-
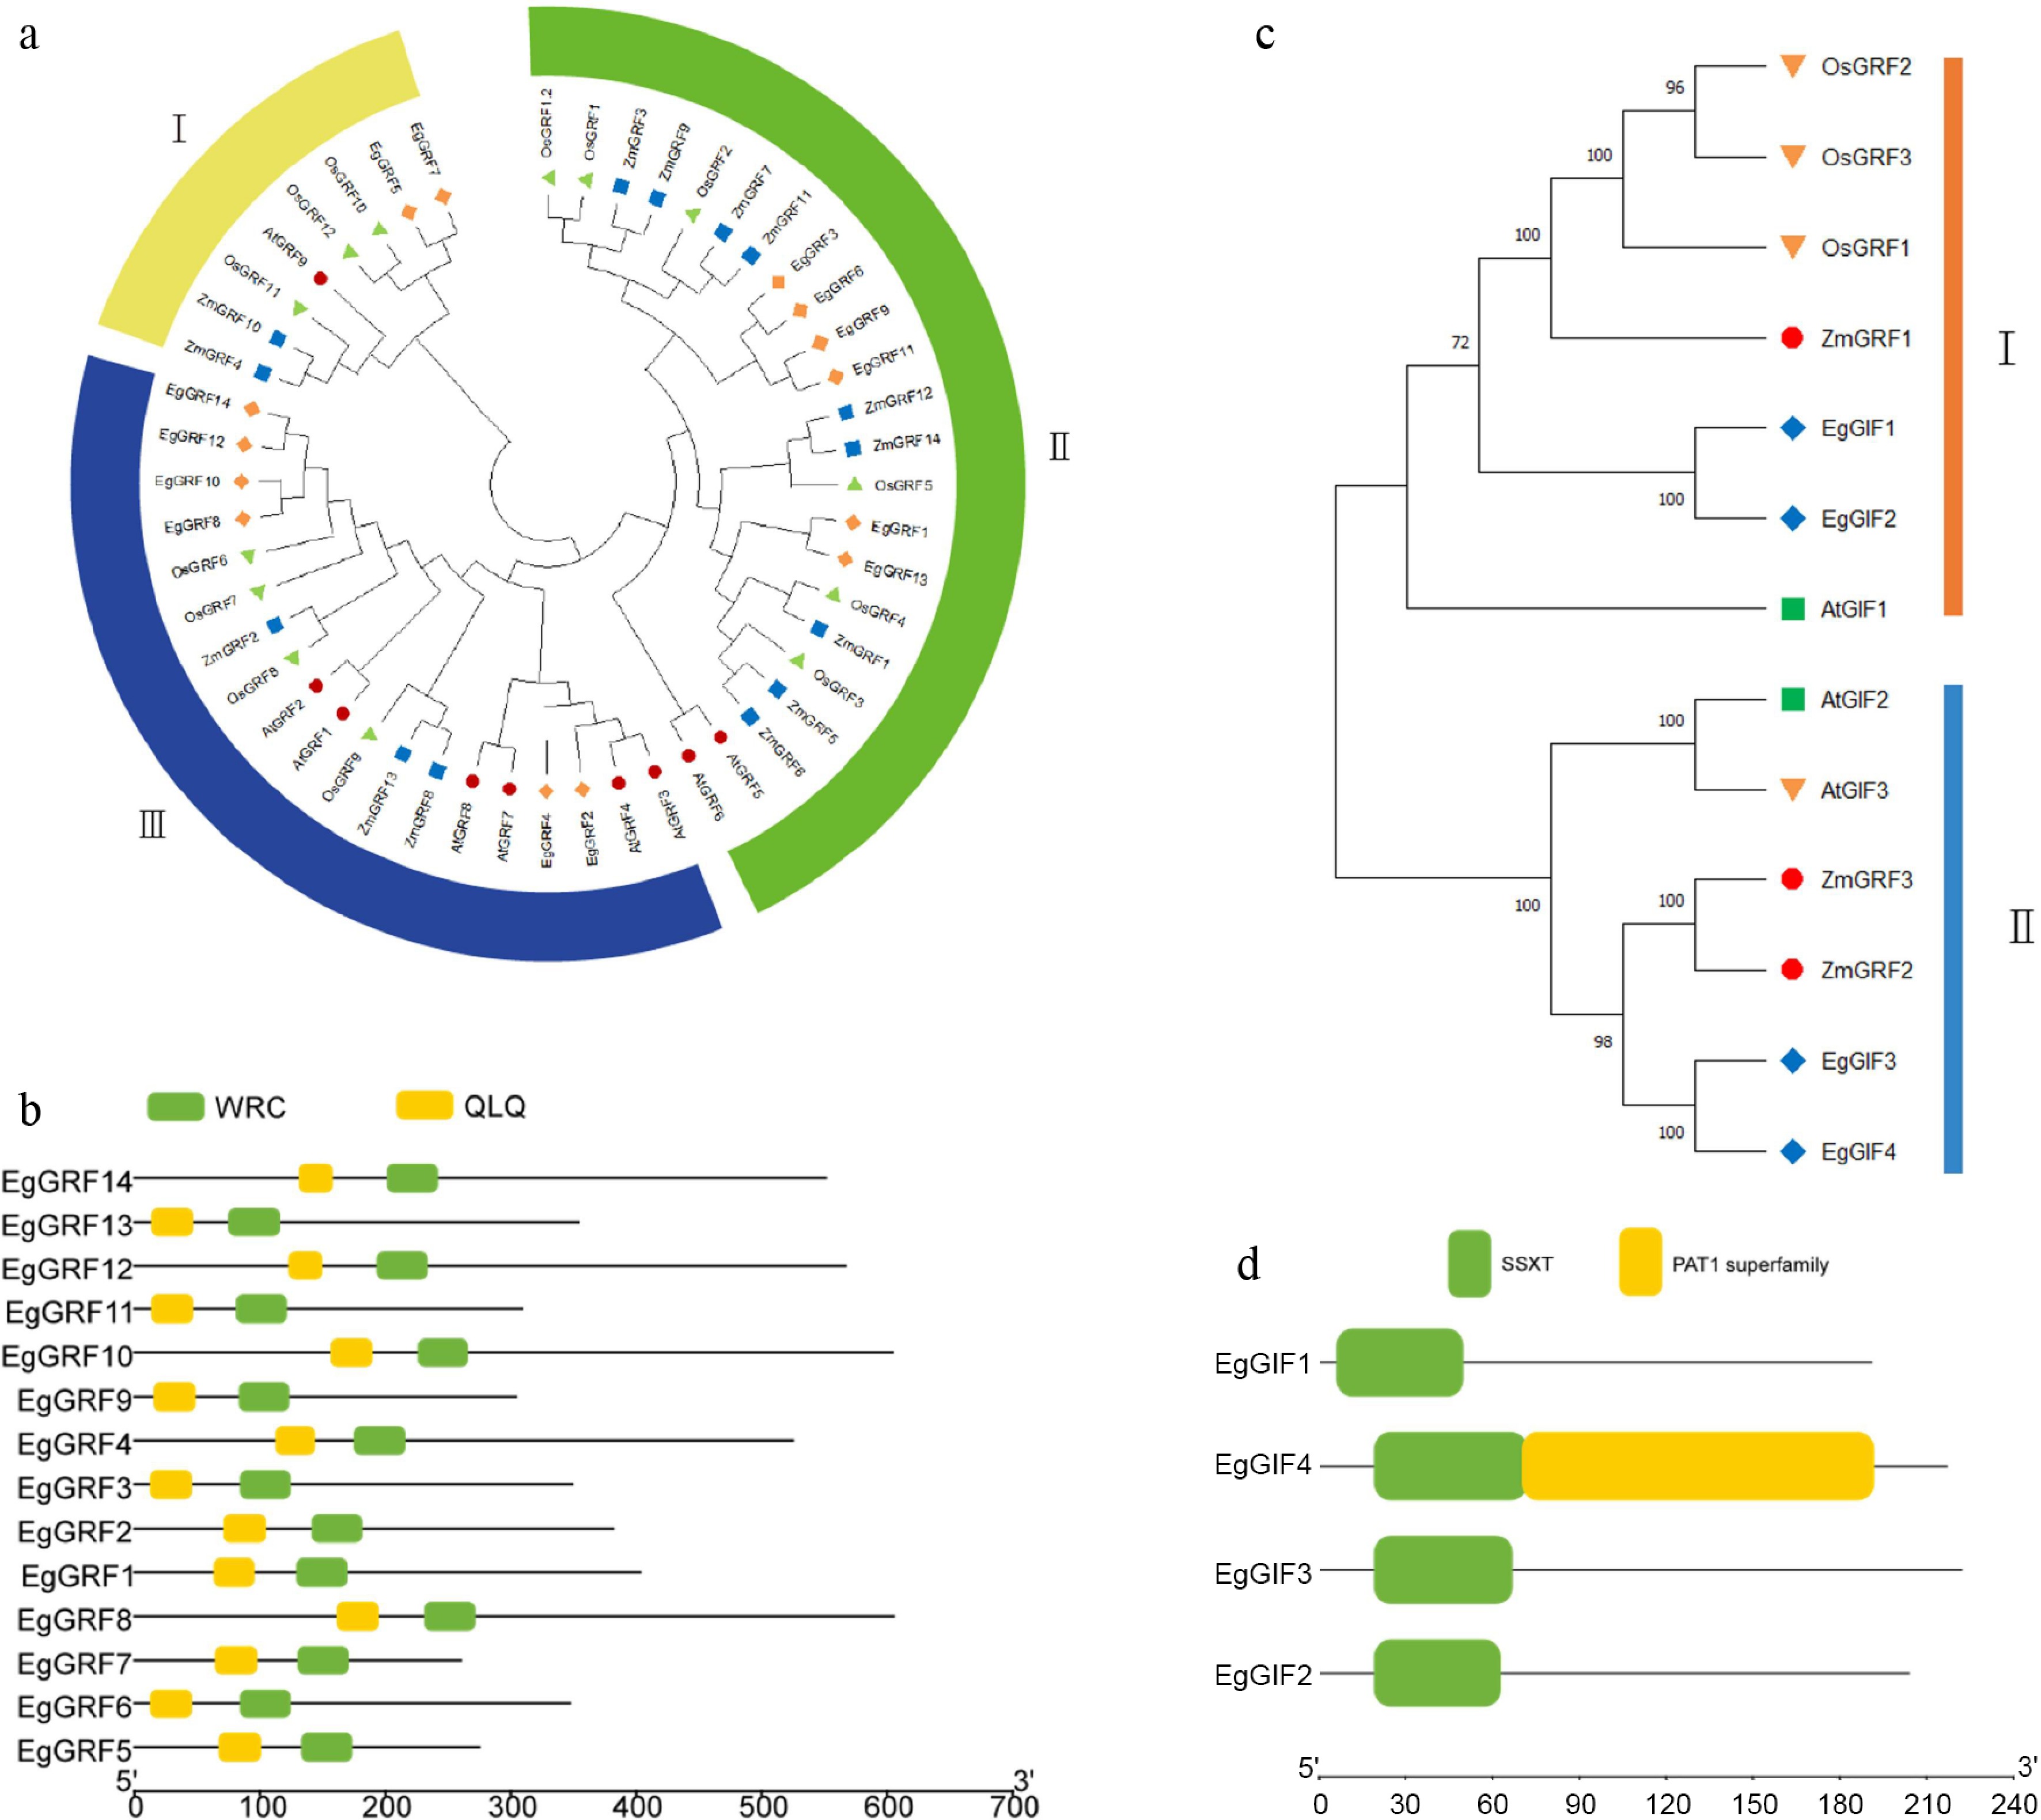
Figure 1.
Phylogenetic relationships and conserved domains of EgGRF and EgGIF genes in oil palm. (a) Phylogenetic tree of the GRF family. (b) Conserved domains of EgGRF family members in oil palm. (c) Phylogenetic tree of the GIF family. (d) Conserved domains of EgGIF family members in oil palm.
-
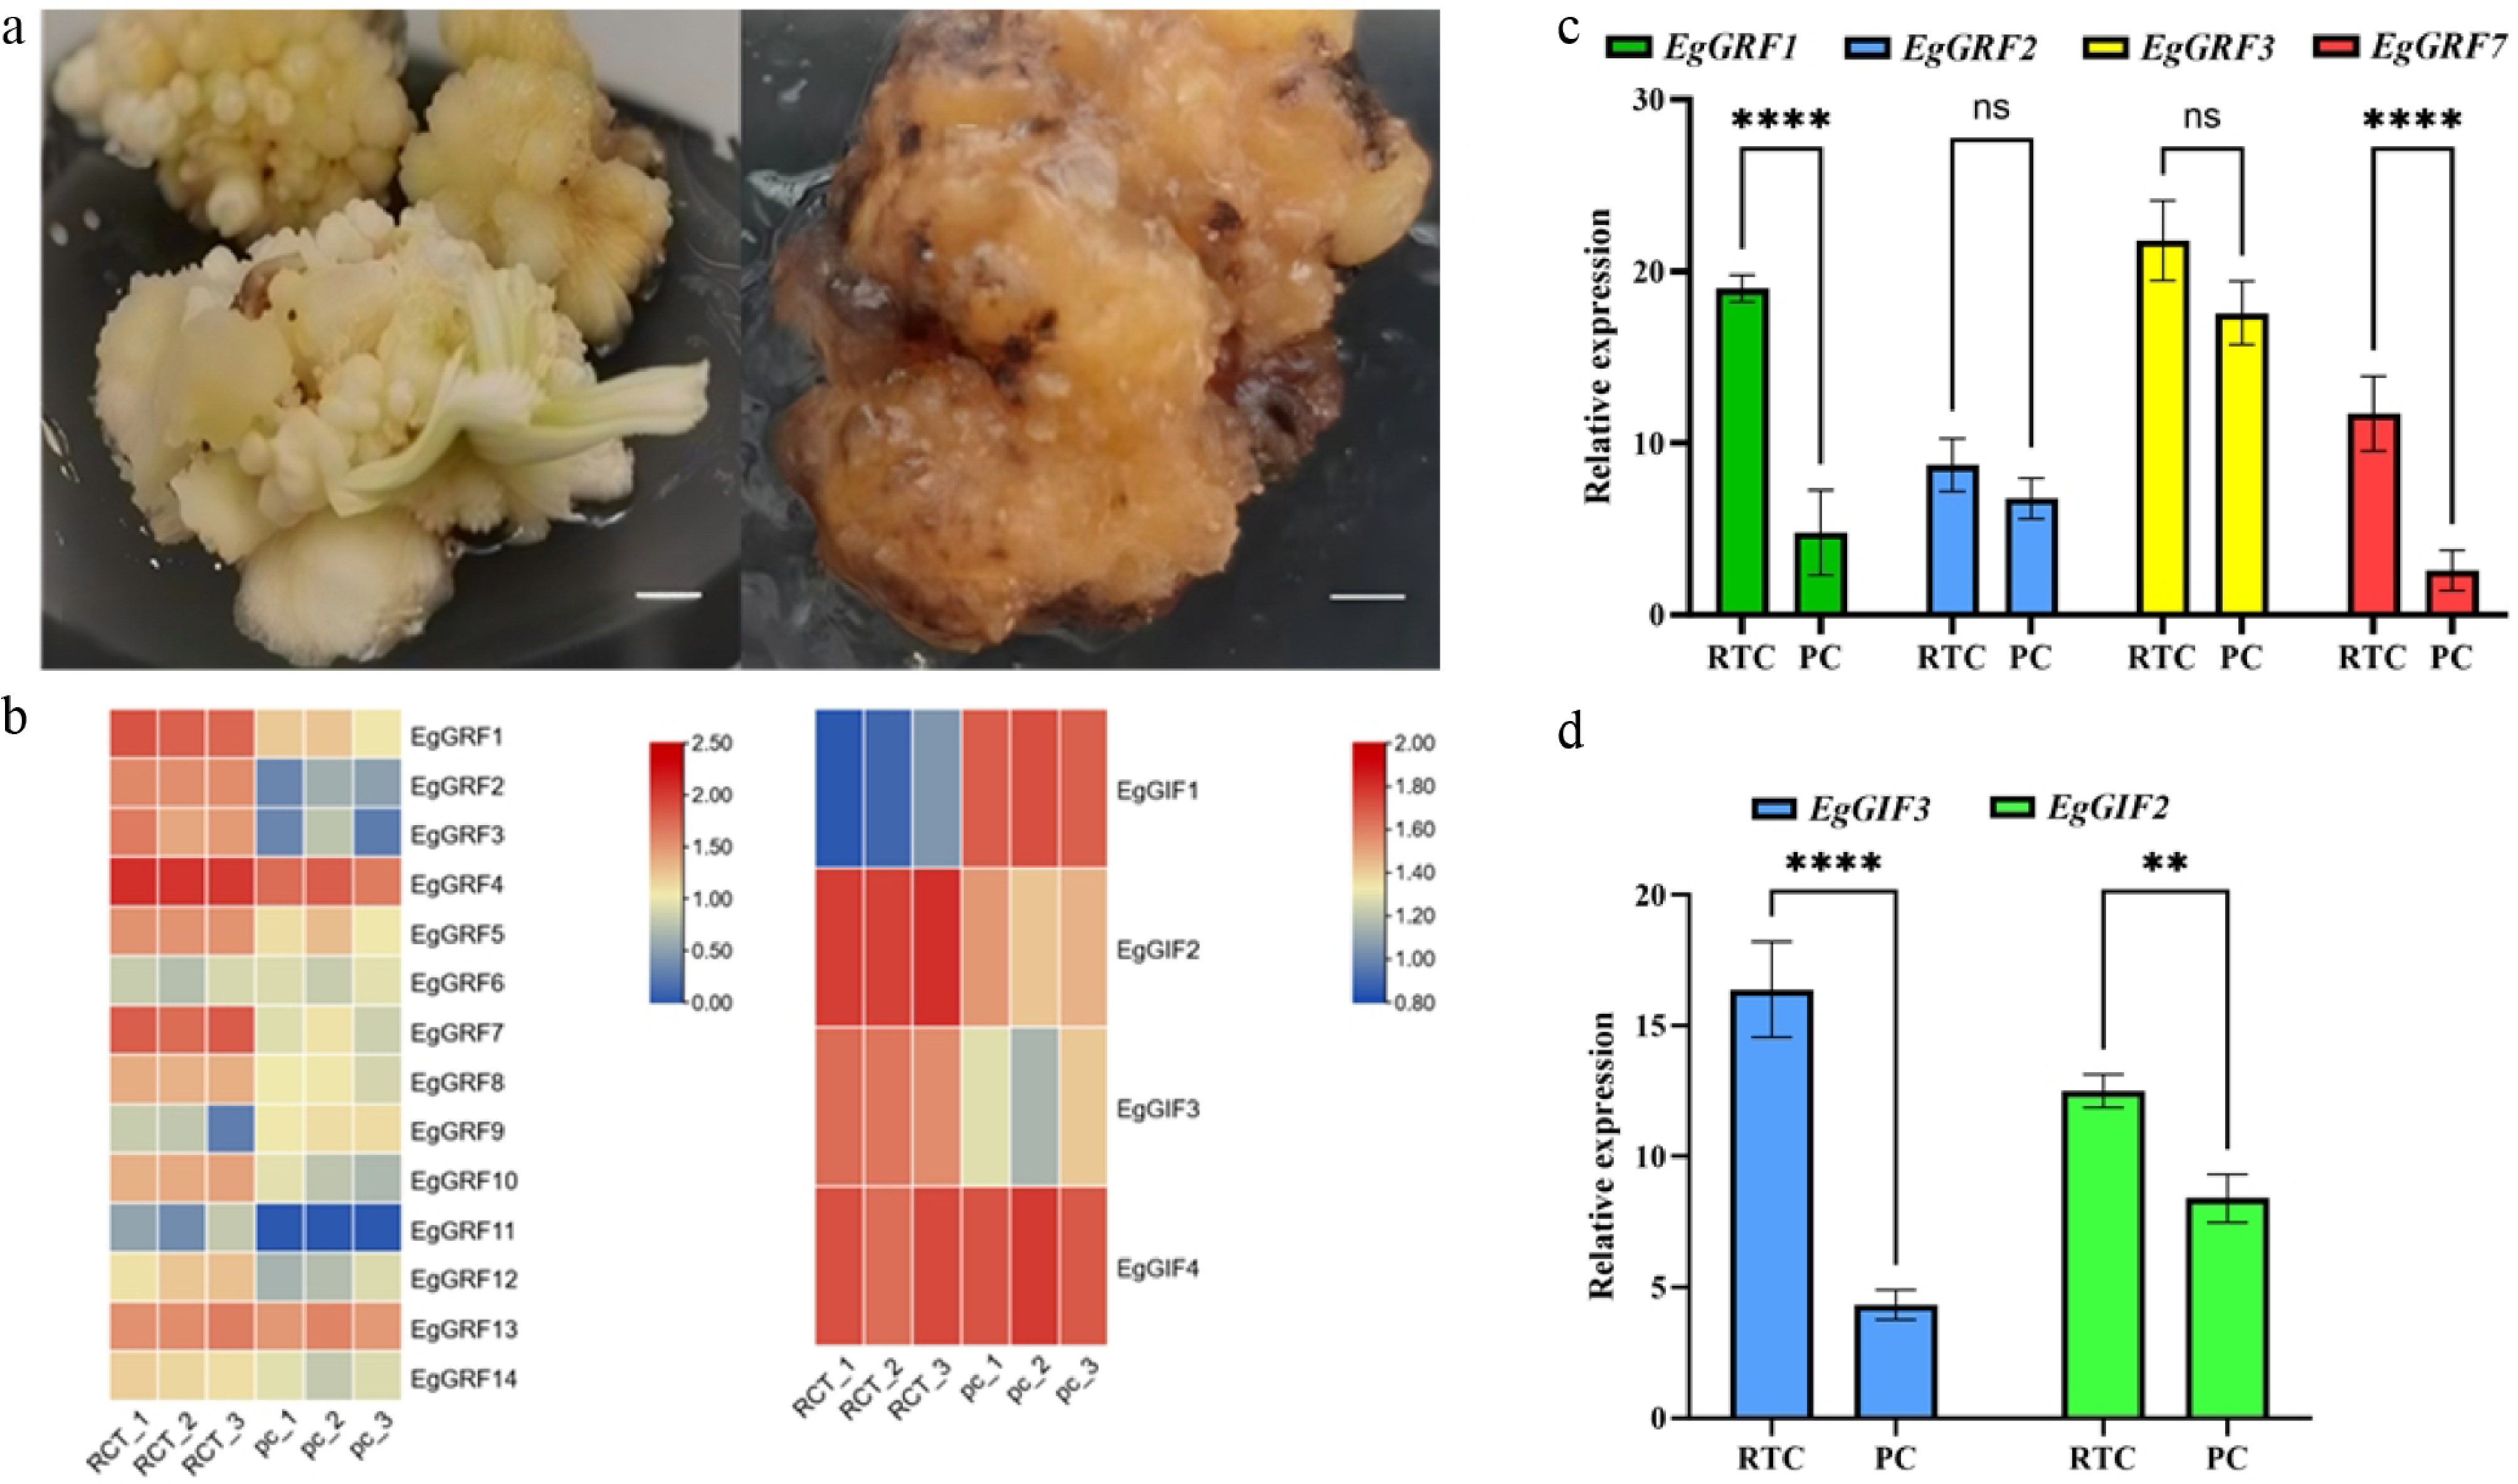
Figure 2.
Differential expression of EgGRF and EgGIF genes between robust regenerable callus (RC) and poorly growing callus (PC). (a) Oil palm callus at different physiological states. Scale bar = 5 mm. (b) Differential expression of oil palm EgGIF and EgGRF genes in callus tissue. (c) Differential expression of GRF genes in oil palm callus. (d) Differential expression of GIF genes in oil palm callus.
-
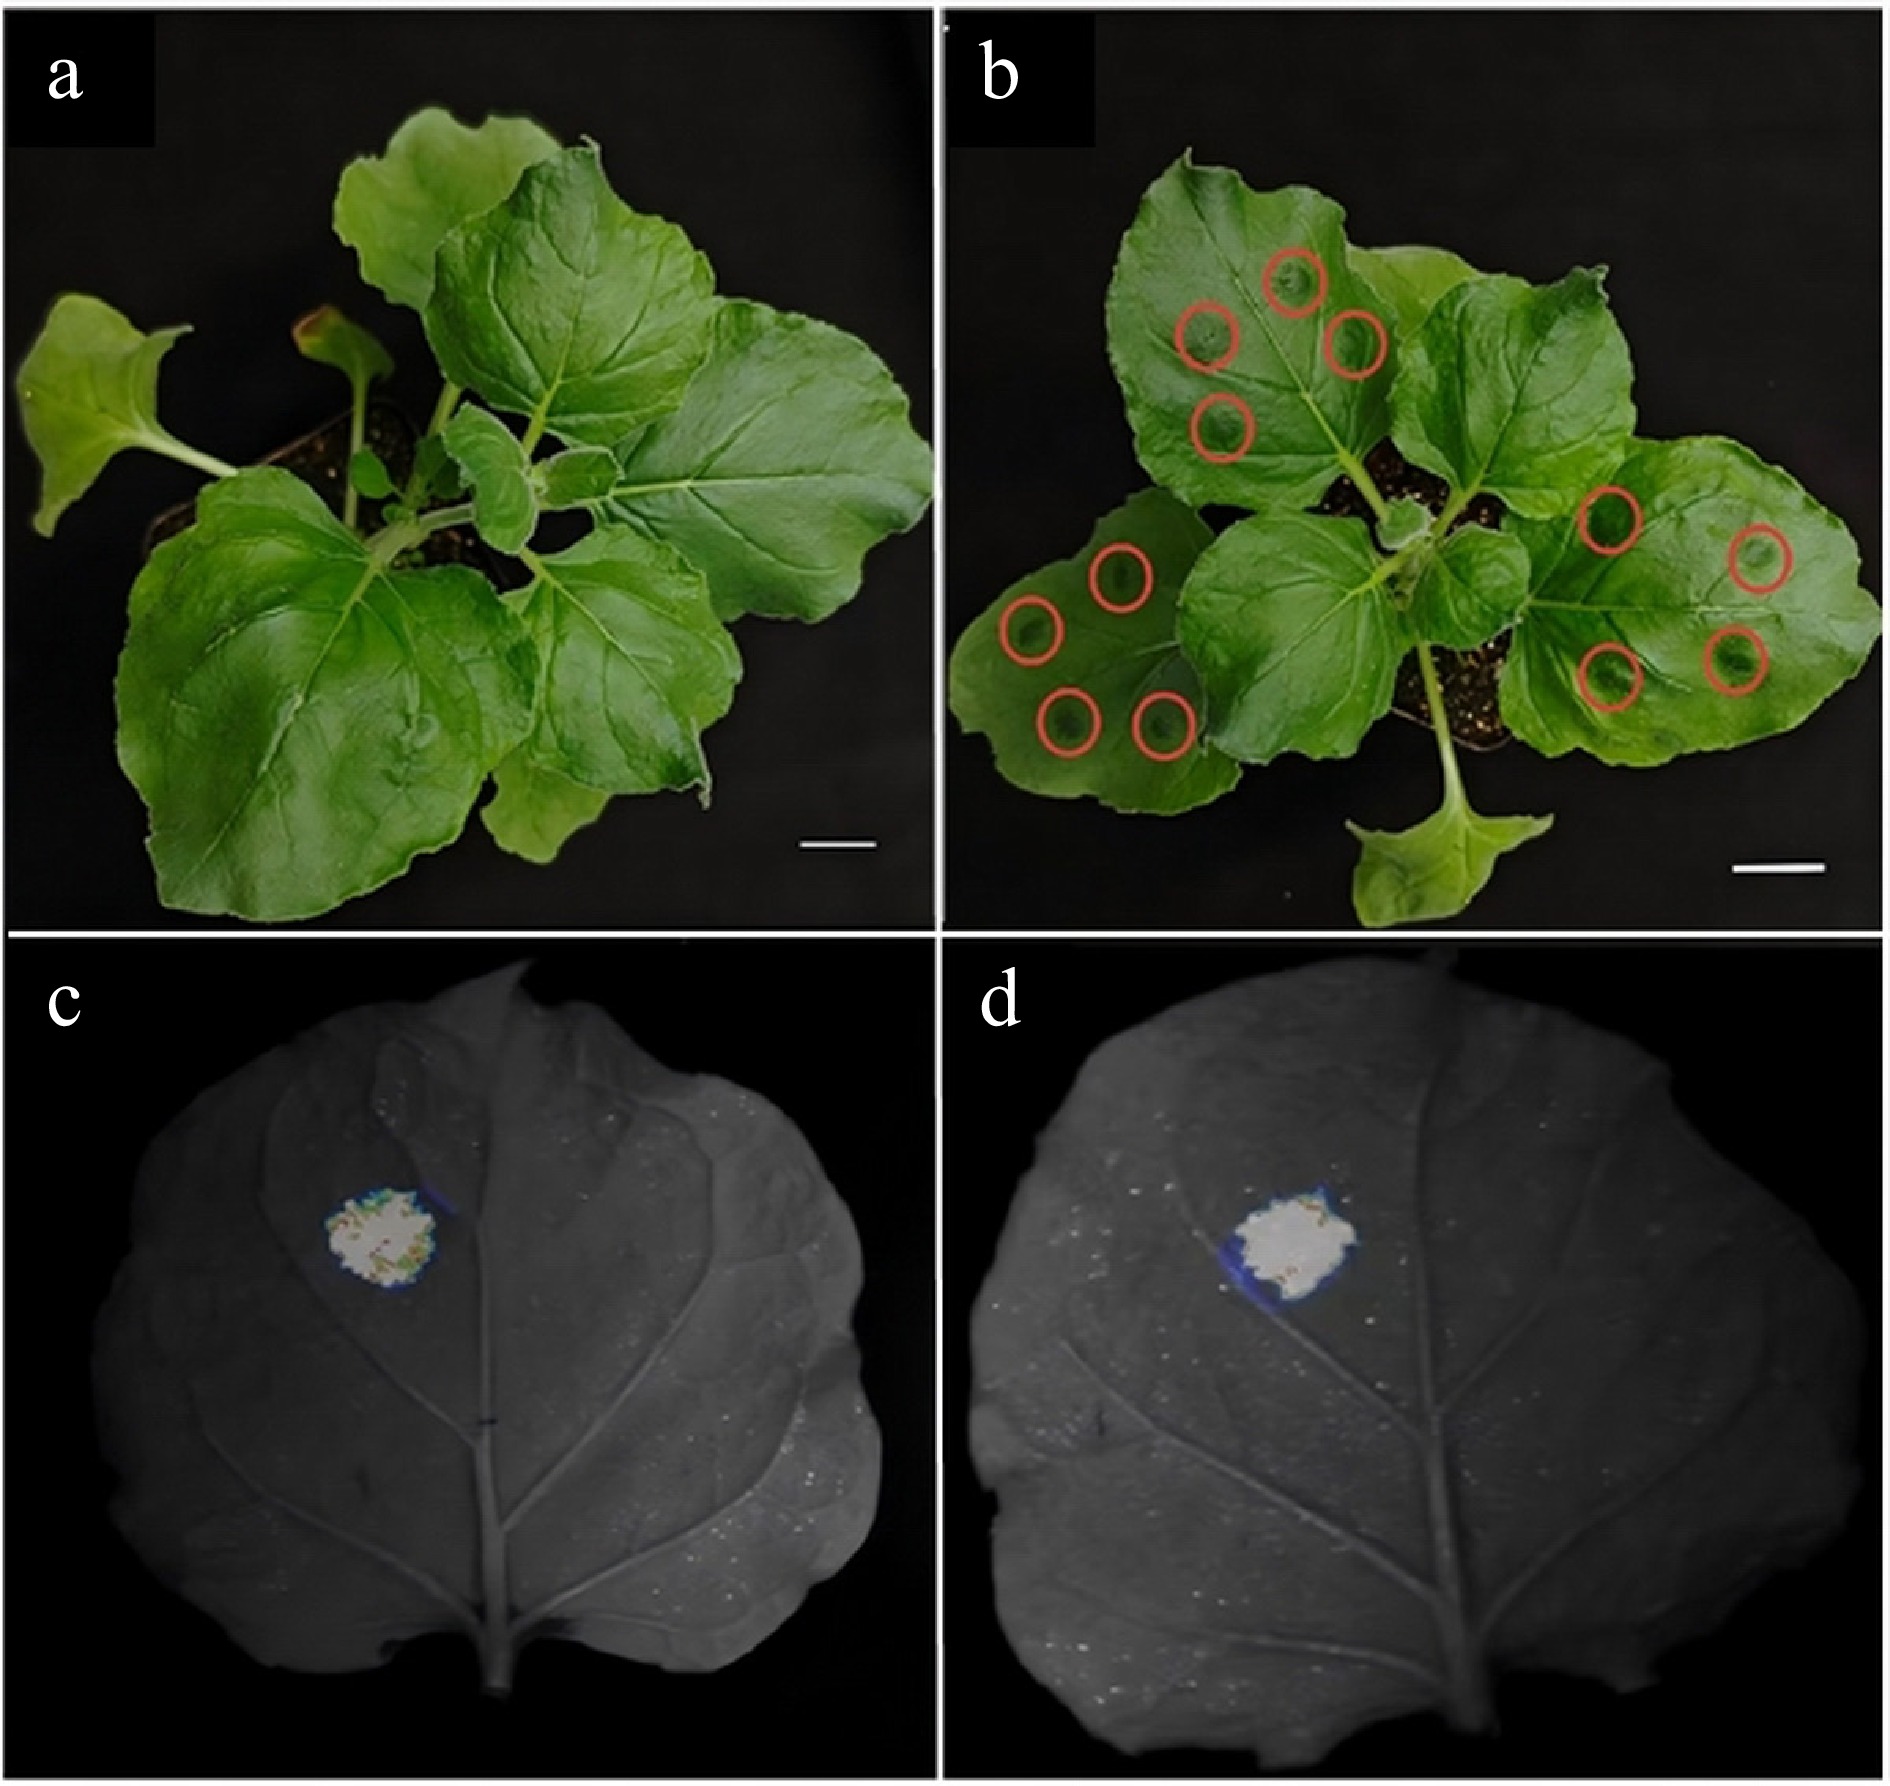
Figure 3.
Protein–protein interaction between EgGRF1/EgGRF7 and EgGIF3 verified by LCI assay in N. benthamiana leaves. (a) Tobacco leaf before injection. (b) Tobacco leaf after injection. (c) Verification of dual-luciferase complementation of EgGRF1 and EgGIF3 genes in tobacco leaves. (d) Verification of dual-luciferase complementation of EgGRF7 and EgGIF3 genes in tobacco leaves. Red circles indicate the injection sites. Scale bar = 1 cm.
-
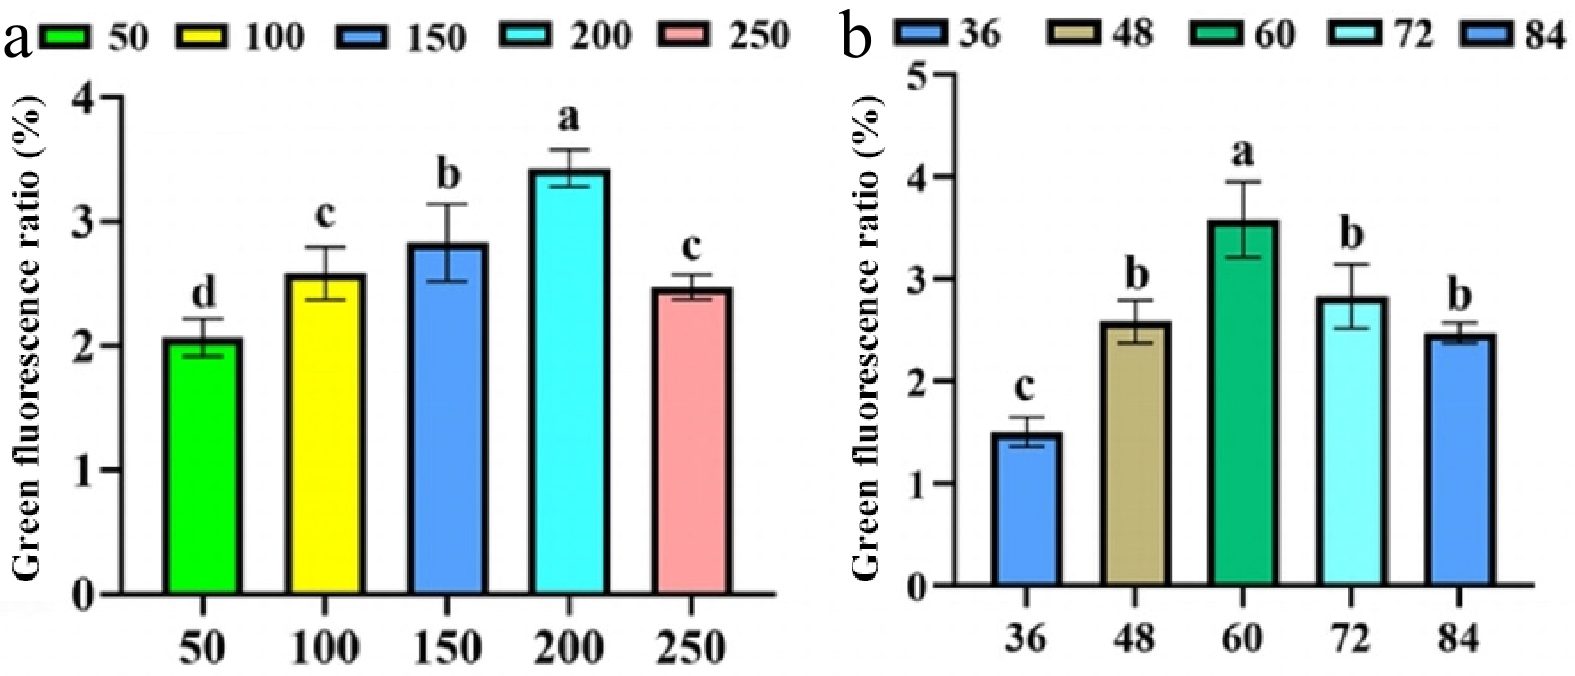
Figure 4.
Effects of (a) acetosyringone (AS) concentration, and (b) co-cultivation duration on Agrobacterium-mediated transformation efficiency of oil palm callus.
-
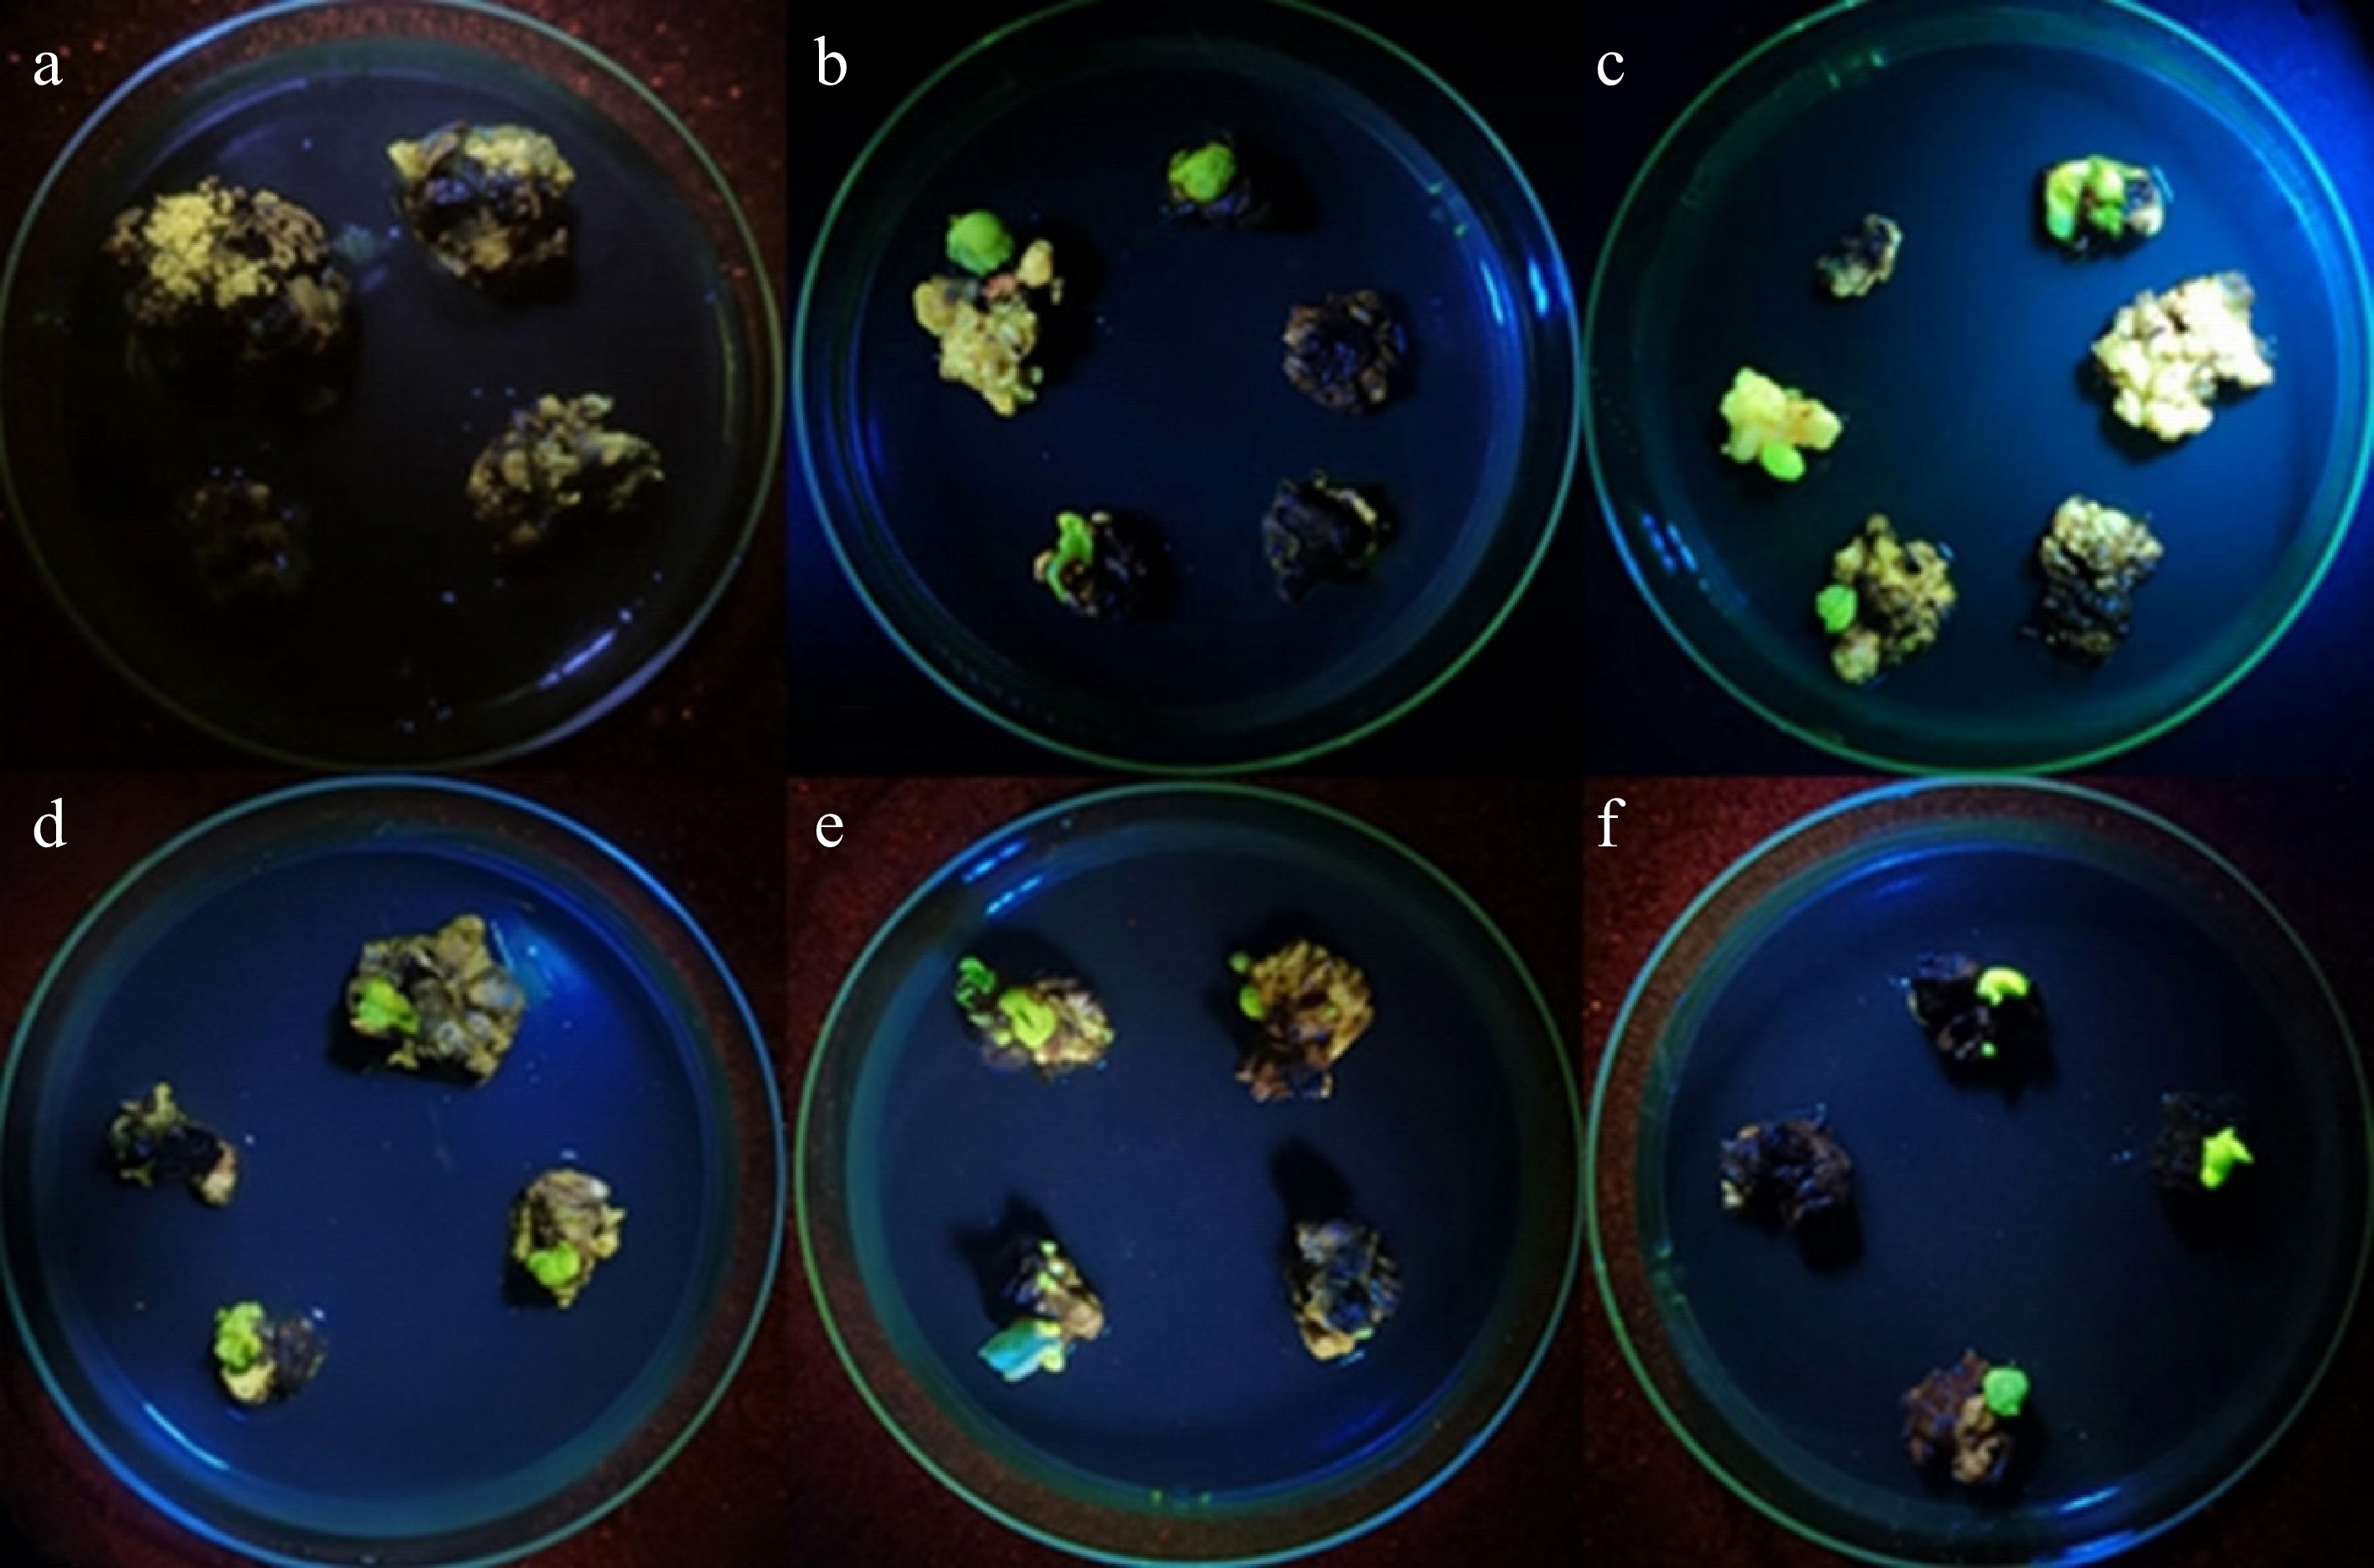
Figure 5.
Visualization and molecular confirmation of transgenic tissues. (a) Wild-type (CK). (b) EgGRF1. (c) EgGRF7. (d) EgGIF3. (e) EgGRF1-GIF3. (f) EgGRF7-GIF3.
-
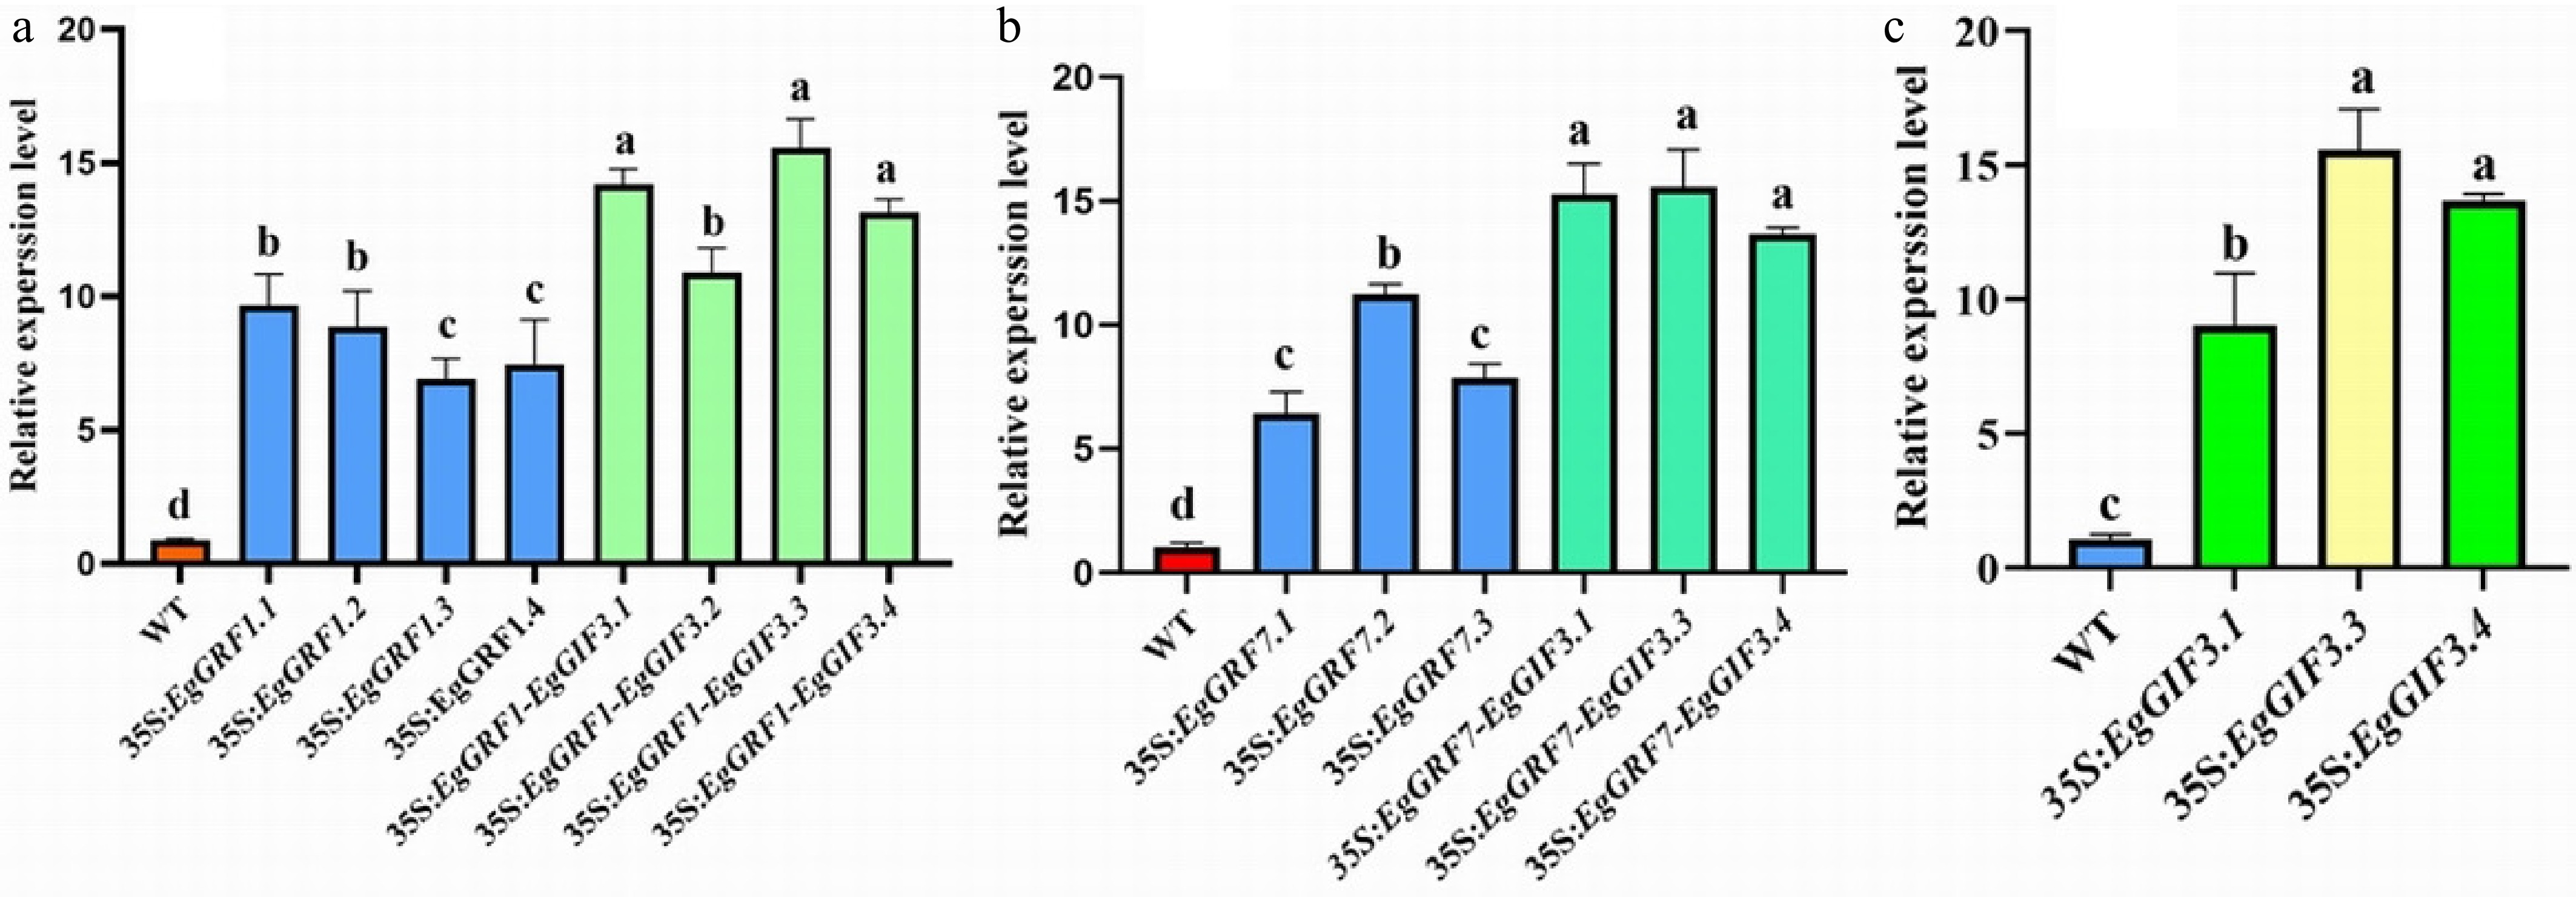
Figure 6.
Relative expression levels of target genes in transgenic embryoids. RT-qPCR analysis was performed on RNA extracted from transgenic embryoids obtained after three to four rounds of selection. (a) Expression levels in embryoids transformed with EgGRF7 and EgGRF1-EgGIF3. (b) Expression levels in embryoids transformed with EgGRF7 and EgGRF7-EgGIF3. (c) Expression levels in embryoids transformed with EgGIF3. Values are mean ± SD (n = 3). Different letters indicate significant differences (p < 0.05).
-
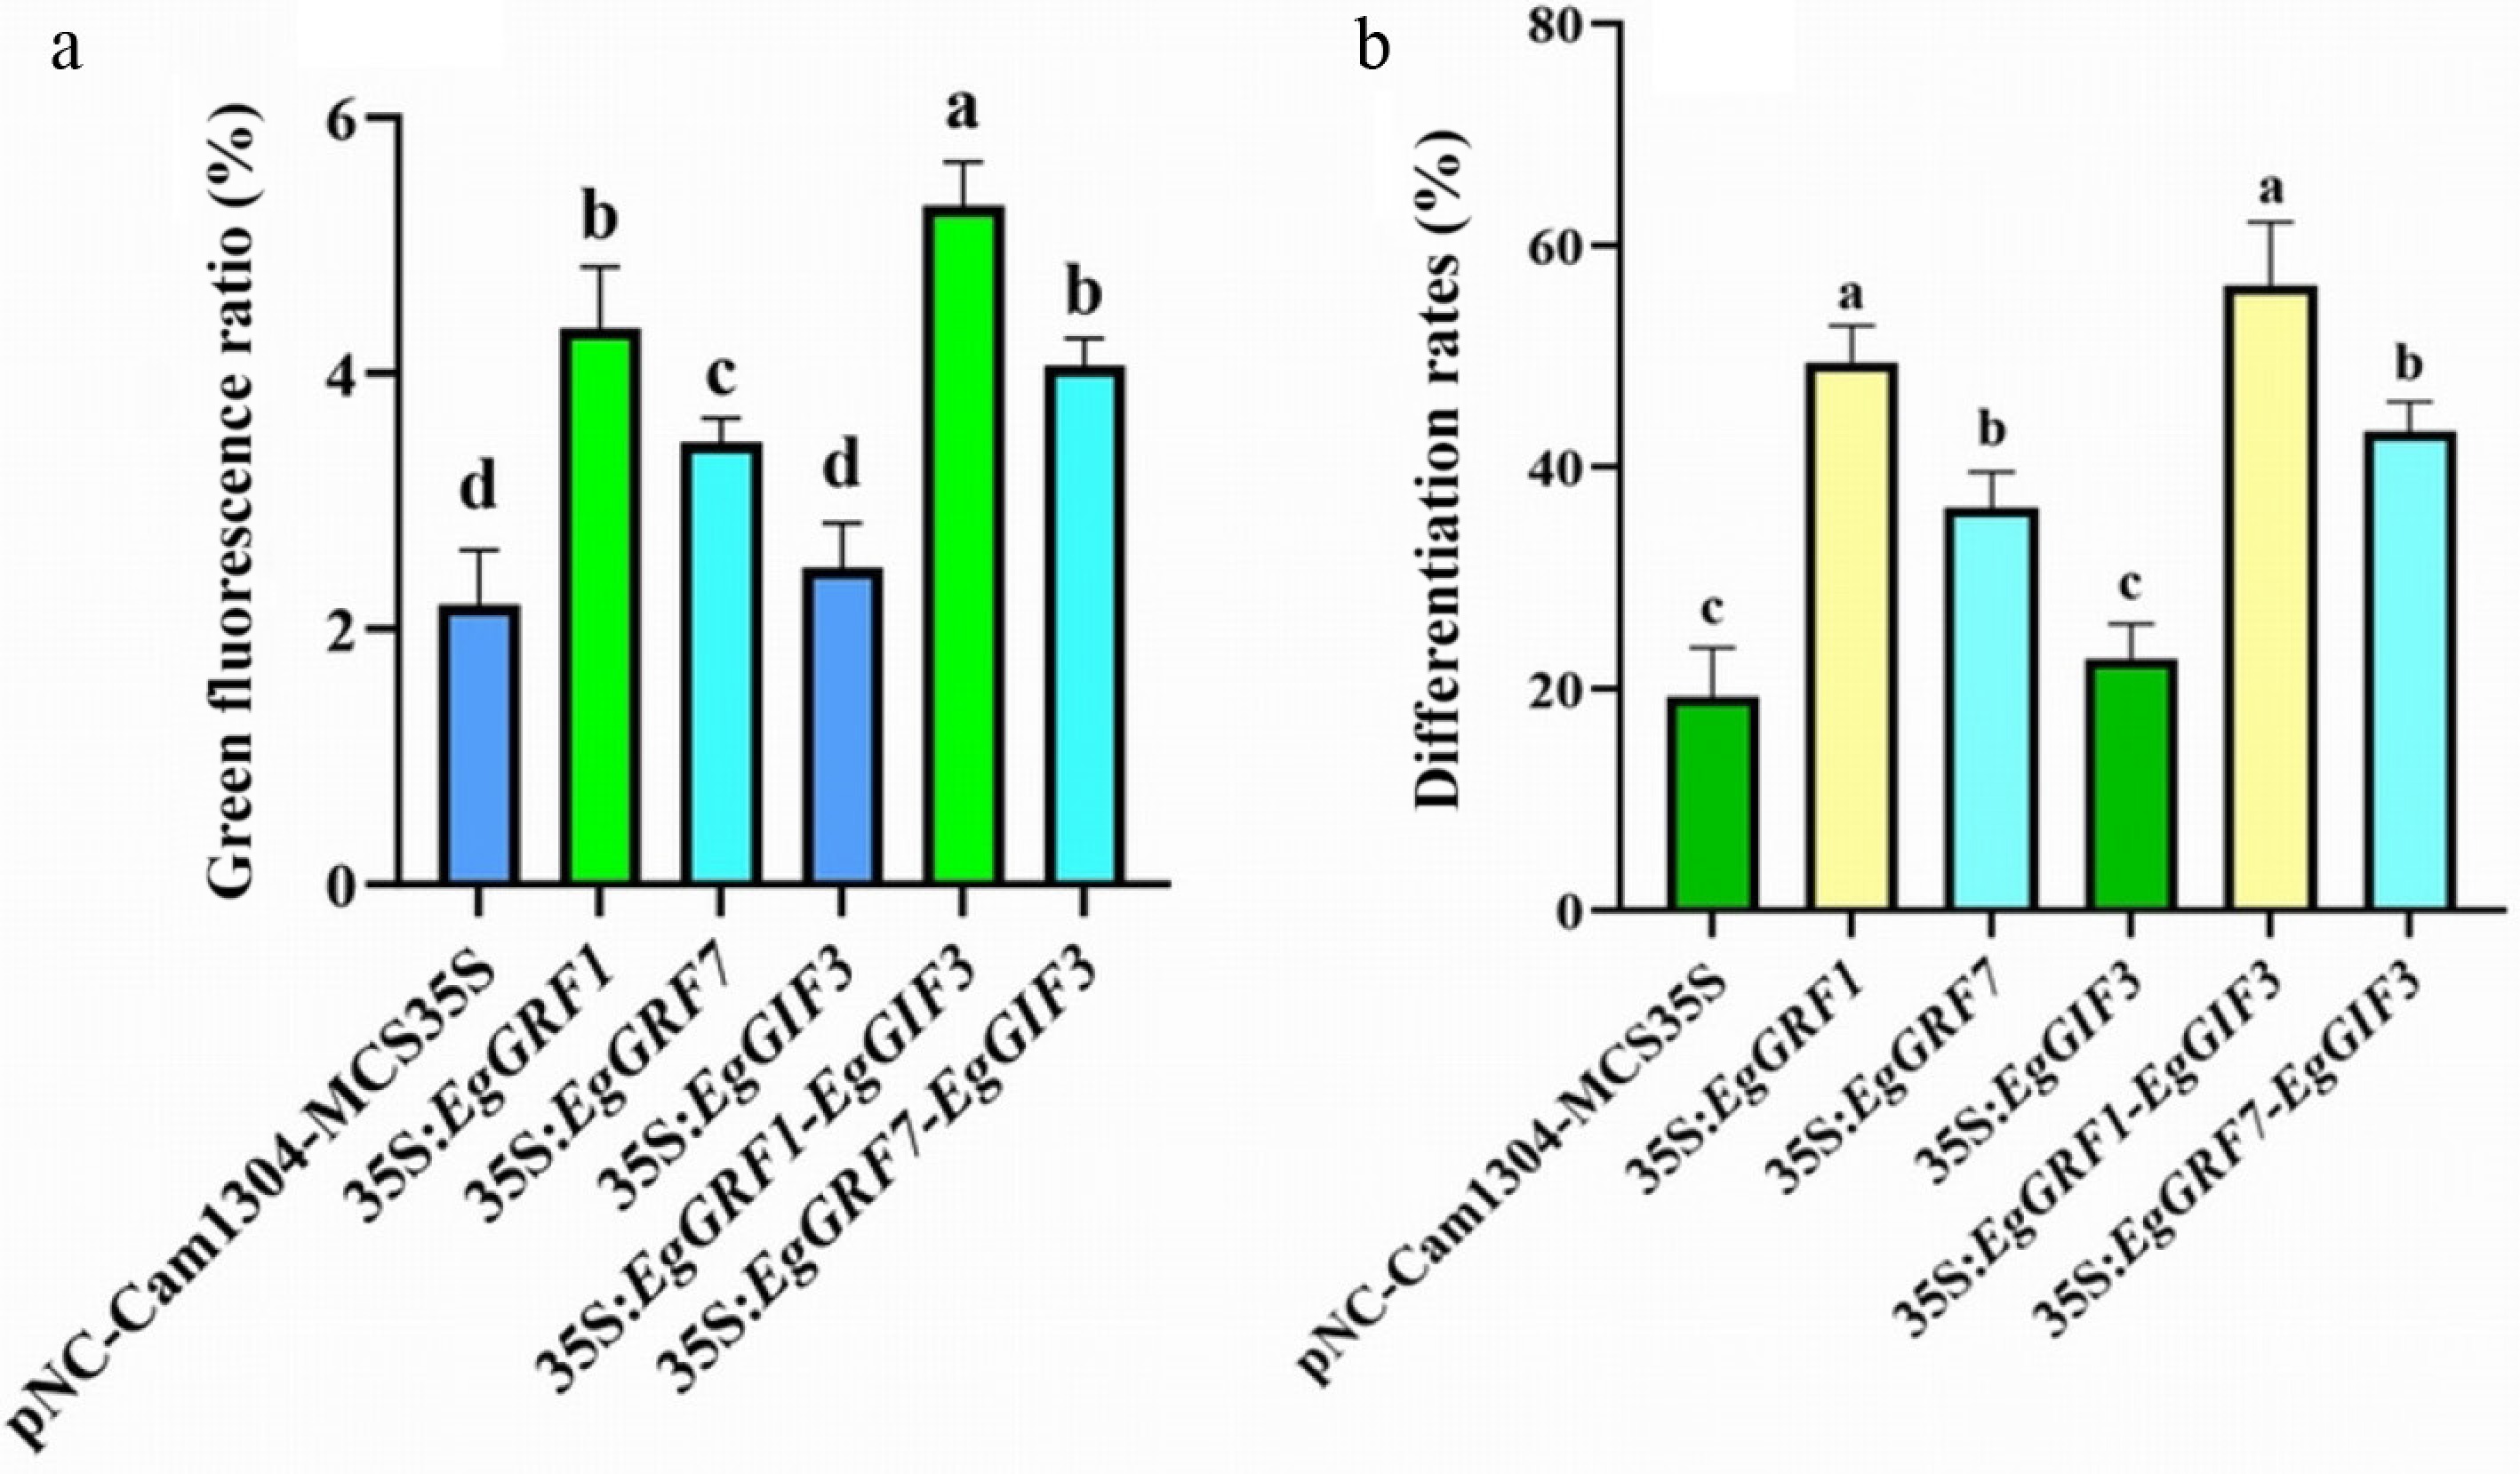
Figure 7.
Effects of EgGRF and EgGIF overexpression on screening efficiency and differentiation. (a) Screening efficiency based on GFP-positive embryoids after three to four rounds of selection. (b) Differentiation rate of transgenic regenerated shoots derived from embryoids. Values are mean ± SD (n = 3). Different letters indicate significant differences (p < 0.05).
-
Level Factors OD600 Time (min) Number GFP (%) 1 0.4 40 184 1.12 ± 1.05bc 2 0.6 50 176 0.00 ± 0.00c 3 0.8 50 144 0.00 ± 0.00c 4 0.6 20 167 1.82 ± 0.69bc 5 0.7 20 170 1.17 ± 1.23bc 6 0.5 20 187 0.00 ± 0.00c 7 0.6 30 178 3.32 ± 0.59ab 8 0.4 30 182 2.06 ± 2.01ab 9 0.4 20 163 0.00 ± 0.00c 10 0.7 30 166 0.00 ± 0.00c 11 0.6 40 166 2.21 ± 0.99ab 12 0.7 40 175 0.00 ± 0.00c 13 0.8 20 180 1.51 ± 1.44bc 14 0.8 30 158 1.47 ± 0.57bc 15 0.8 40 159 0.00 ± 0.00c 16 0.5 30 163 1.82 ± 3.15bc 17 0.7 50 169 0.00 ± 0.00c 18 0.5 50 160 1.95 ± 1.99ab 19 0.5 40 174 3.45 ± 2.84ab 20 0.4 50 173 2.26 ± 0.35ab Different letters after the numbers (a, b, c) represent statistical differences between groups; values represent mean ± SD (n = 3). Table 1.
Effects of Agrobacterium concentration and infection time on screening efficiency.
Figures
(7)
Tables
(1)