-
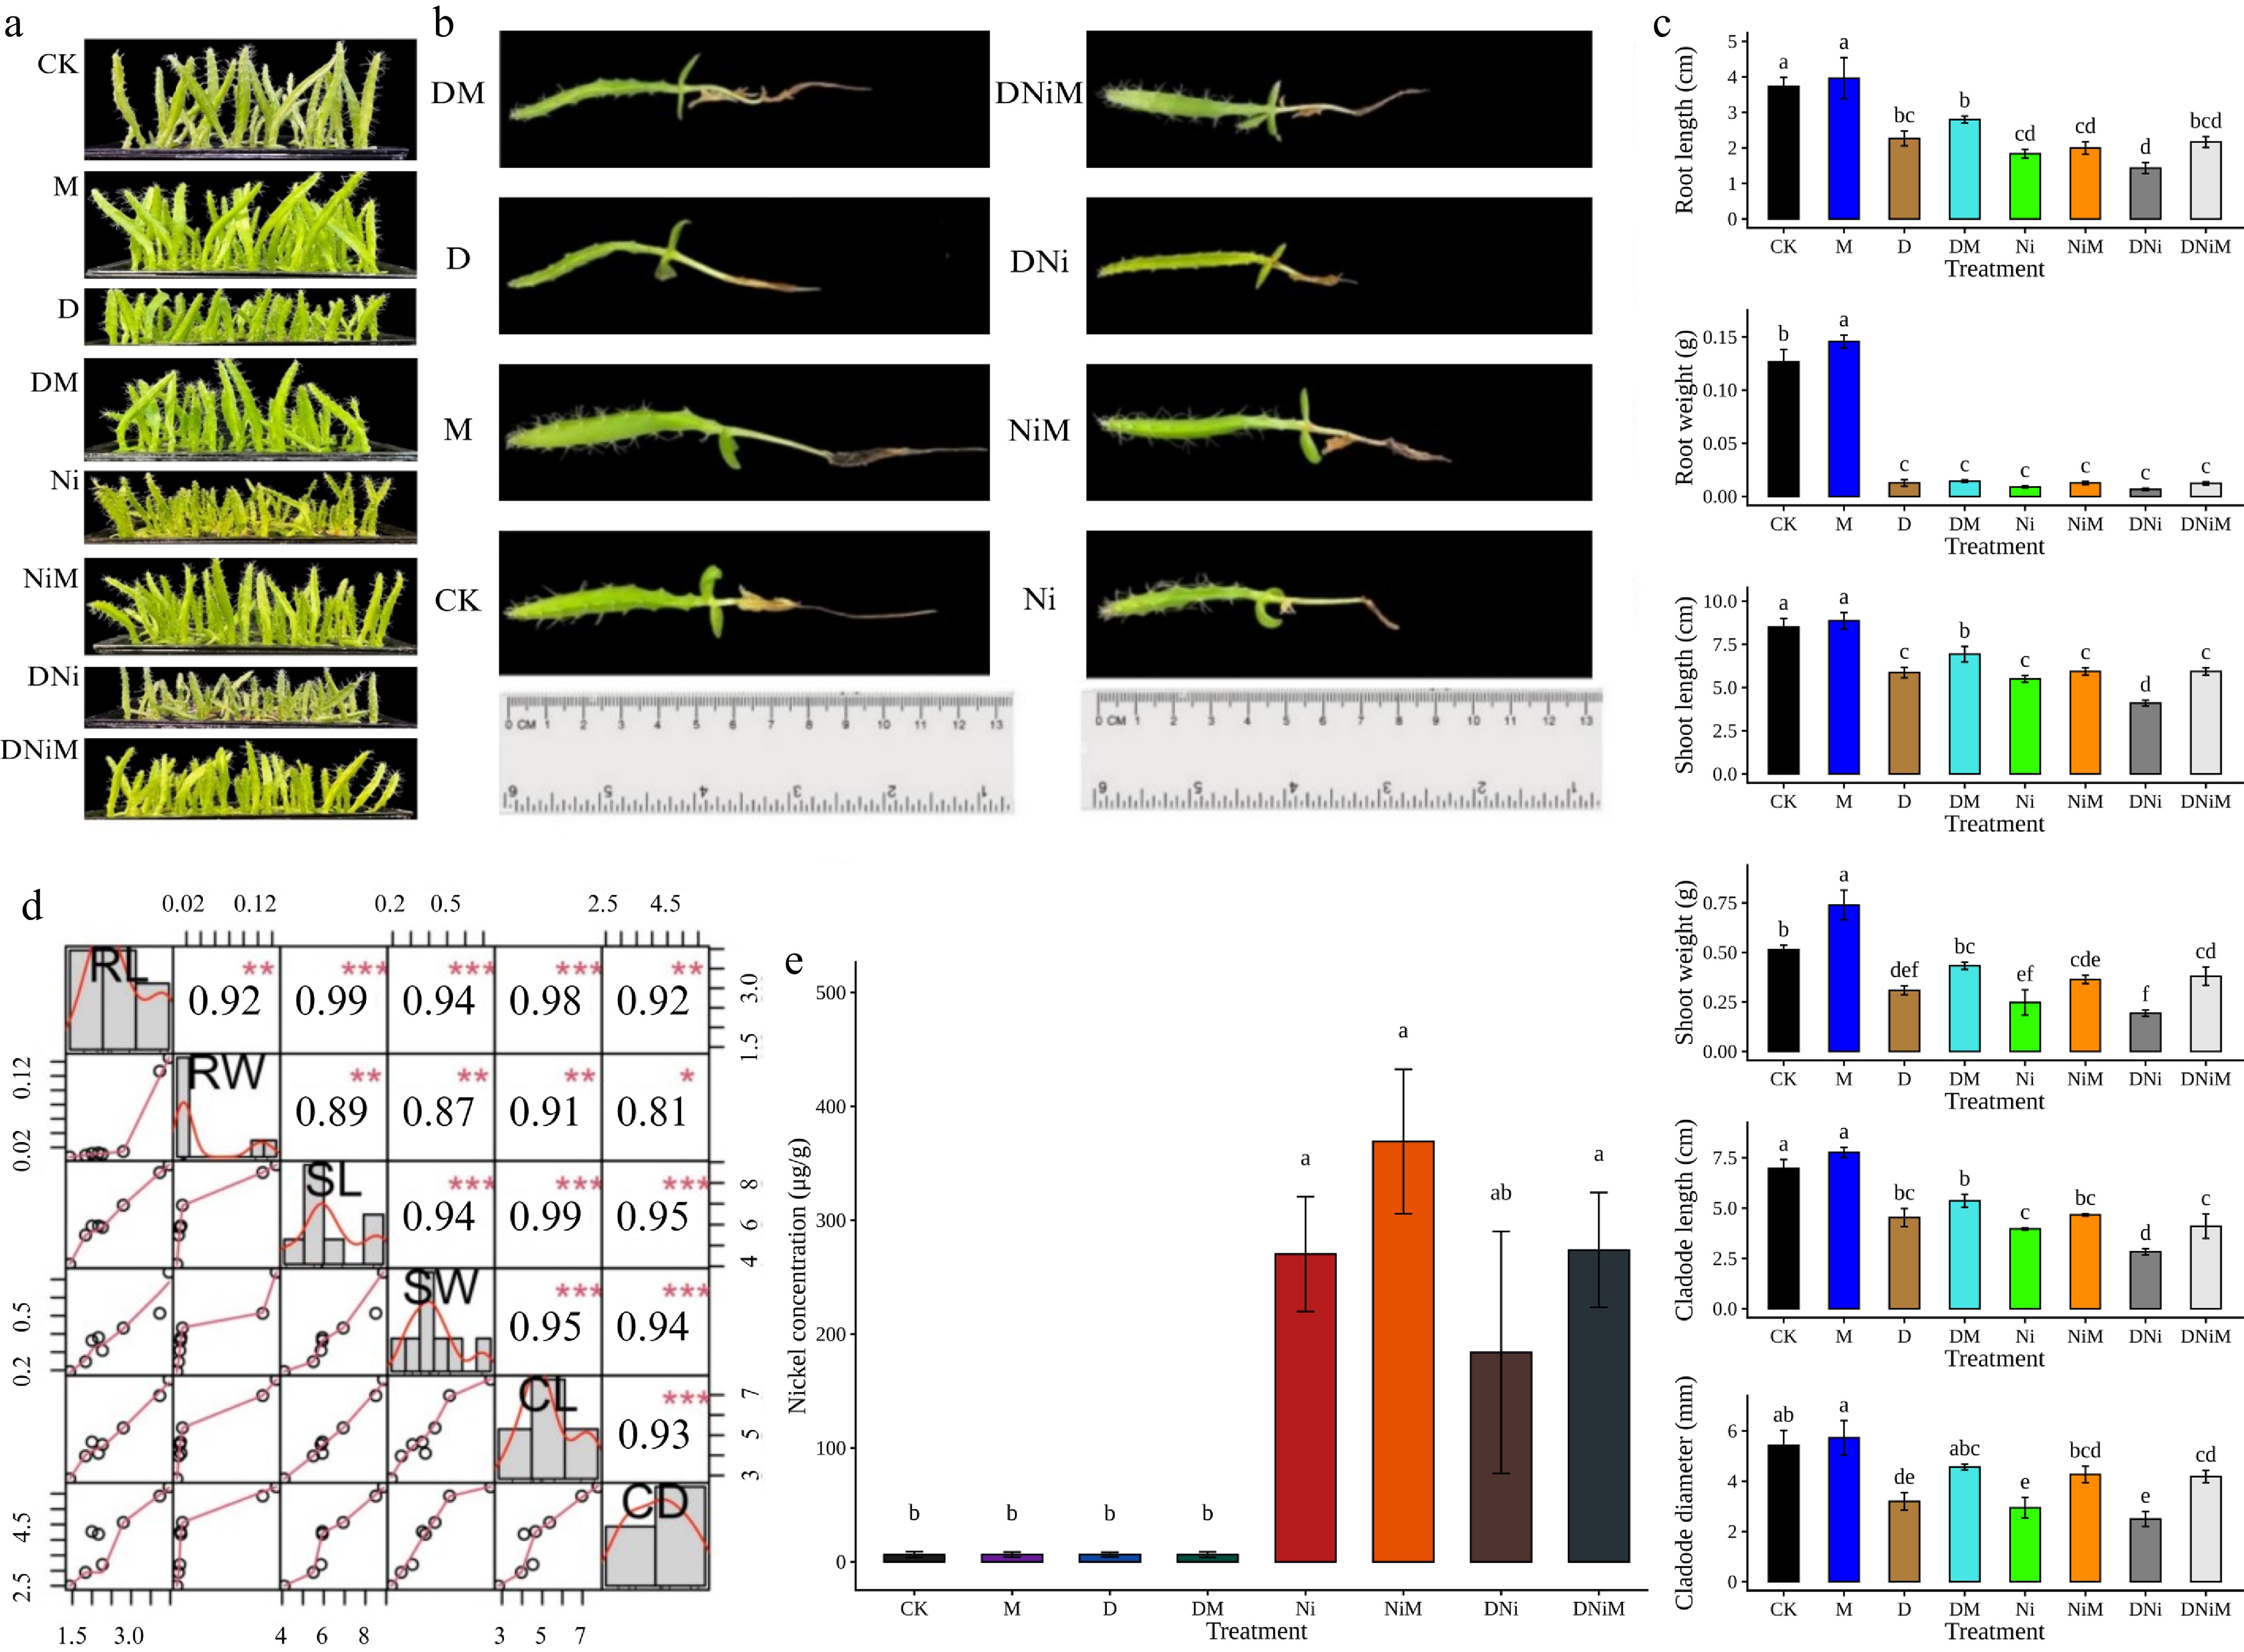
Figure 1.
Morphological and growth responses of pitaya seedlings after 60 d under control (CK), melatonin (M), drought (D), drought + melatonin (DM), nickel (Ni), nickel + melatonin (NiM), drought + nickel (DNi), and drought + nickel + melatonin (DNiM) treatments. (a) Whole plant phenotypes. (b) Representative roots and shoots comparison. (c) Growth traits: root length (RL), root weight (RW), shoot length (SL), shoot weight (SW), cladode length (CL), and cladode diameter (CD). (d) Pearson correlation matrix among traits (*** p < 0.001; ** p < 0.01; * p < 0.05). (e) Seedling Ni accumulation (µg g–1 dry weight). Data are means ± SD (n = 3); length in cm, weight in g, and diameter in mm. Different lowercase letters above the bars indicate significant differences among treatments at p < 0.05
-
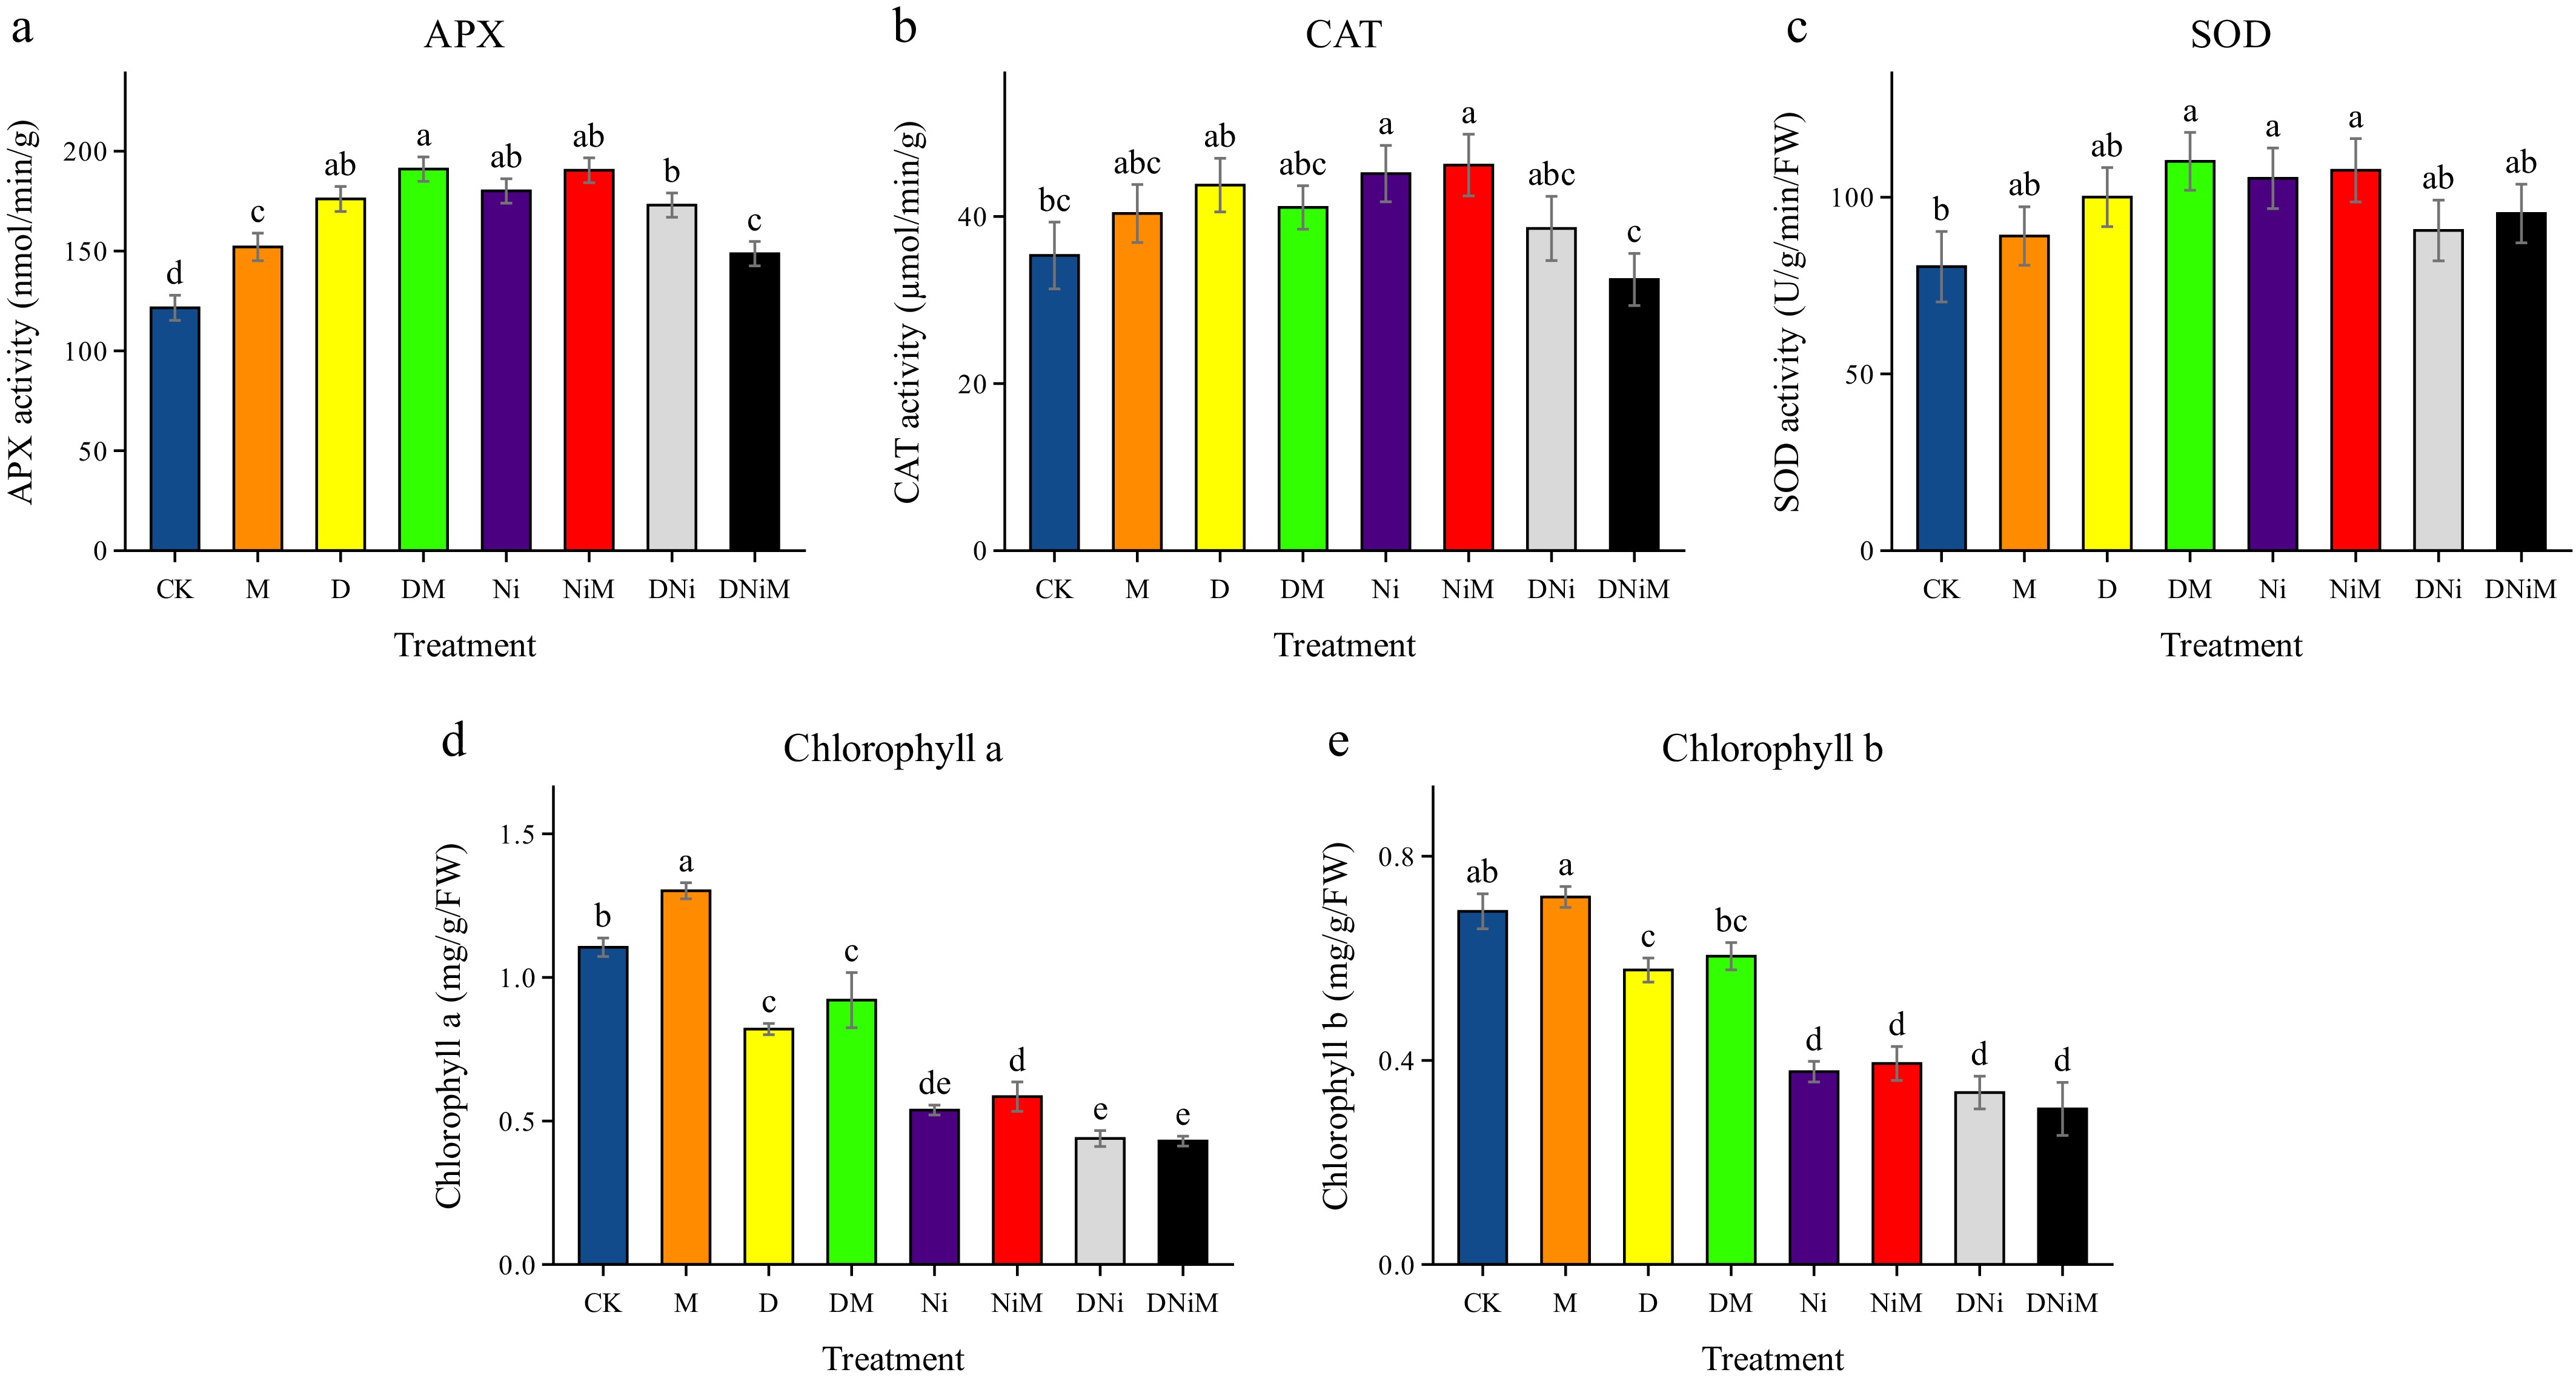
Figure 2.
Antioxidant enzyme activities and chlorophyll contents in pitaya cladode under control (CK), melatonin (M), drought (D), drought + melatonin (DM), nickel (Ni), nickel + melatonin (NiM), drought + nickel (DNi), and drought + nickel + melatonin (DNiM) treatments. (a) Activities of ascorbate peroxidase (APX). (b) Activities of catalase (CAT). (c) Activities of superoxide dismutase (SOD). (d) Chlorophyll a content. (e) Chlorophyll b content. Data are means ± SD (n = 3). Different lowercase letters above the bars indicate significant differences among treatments at p < 0.05
-
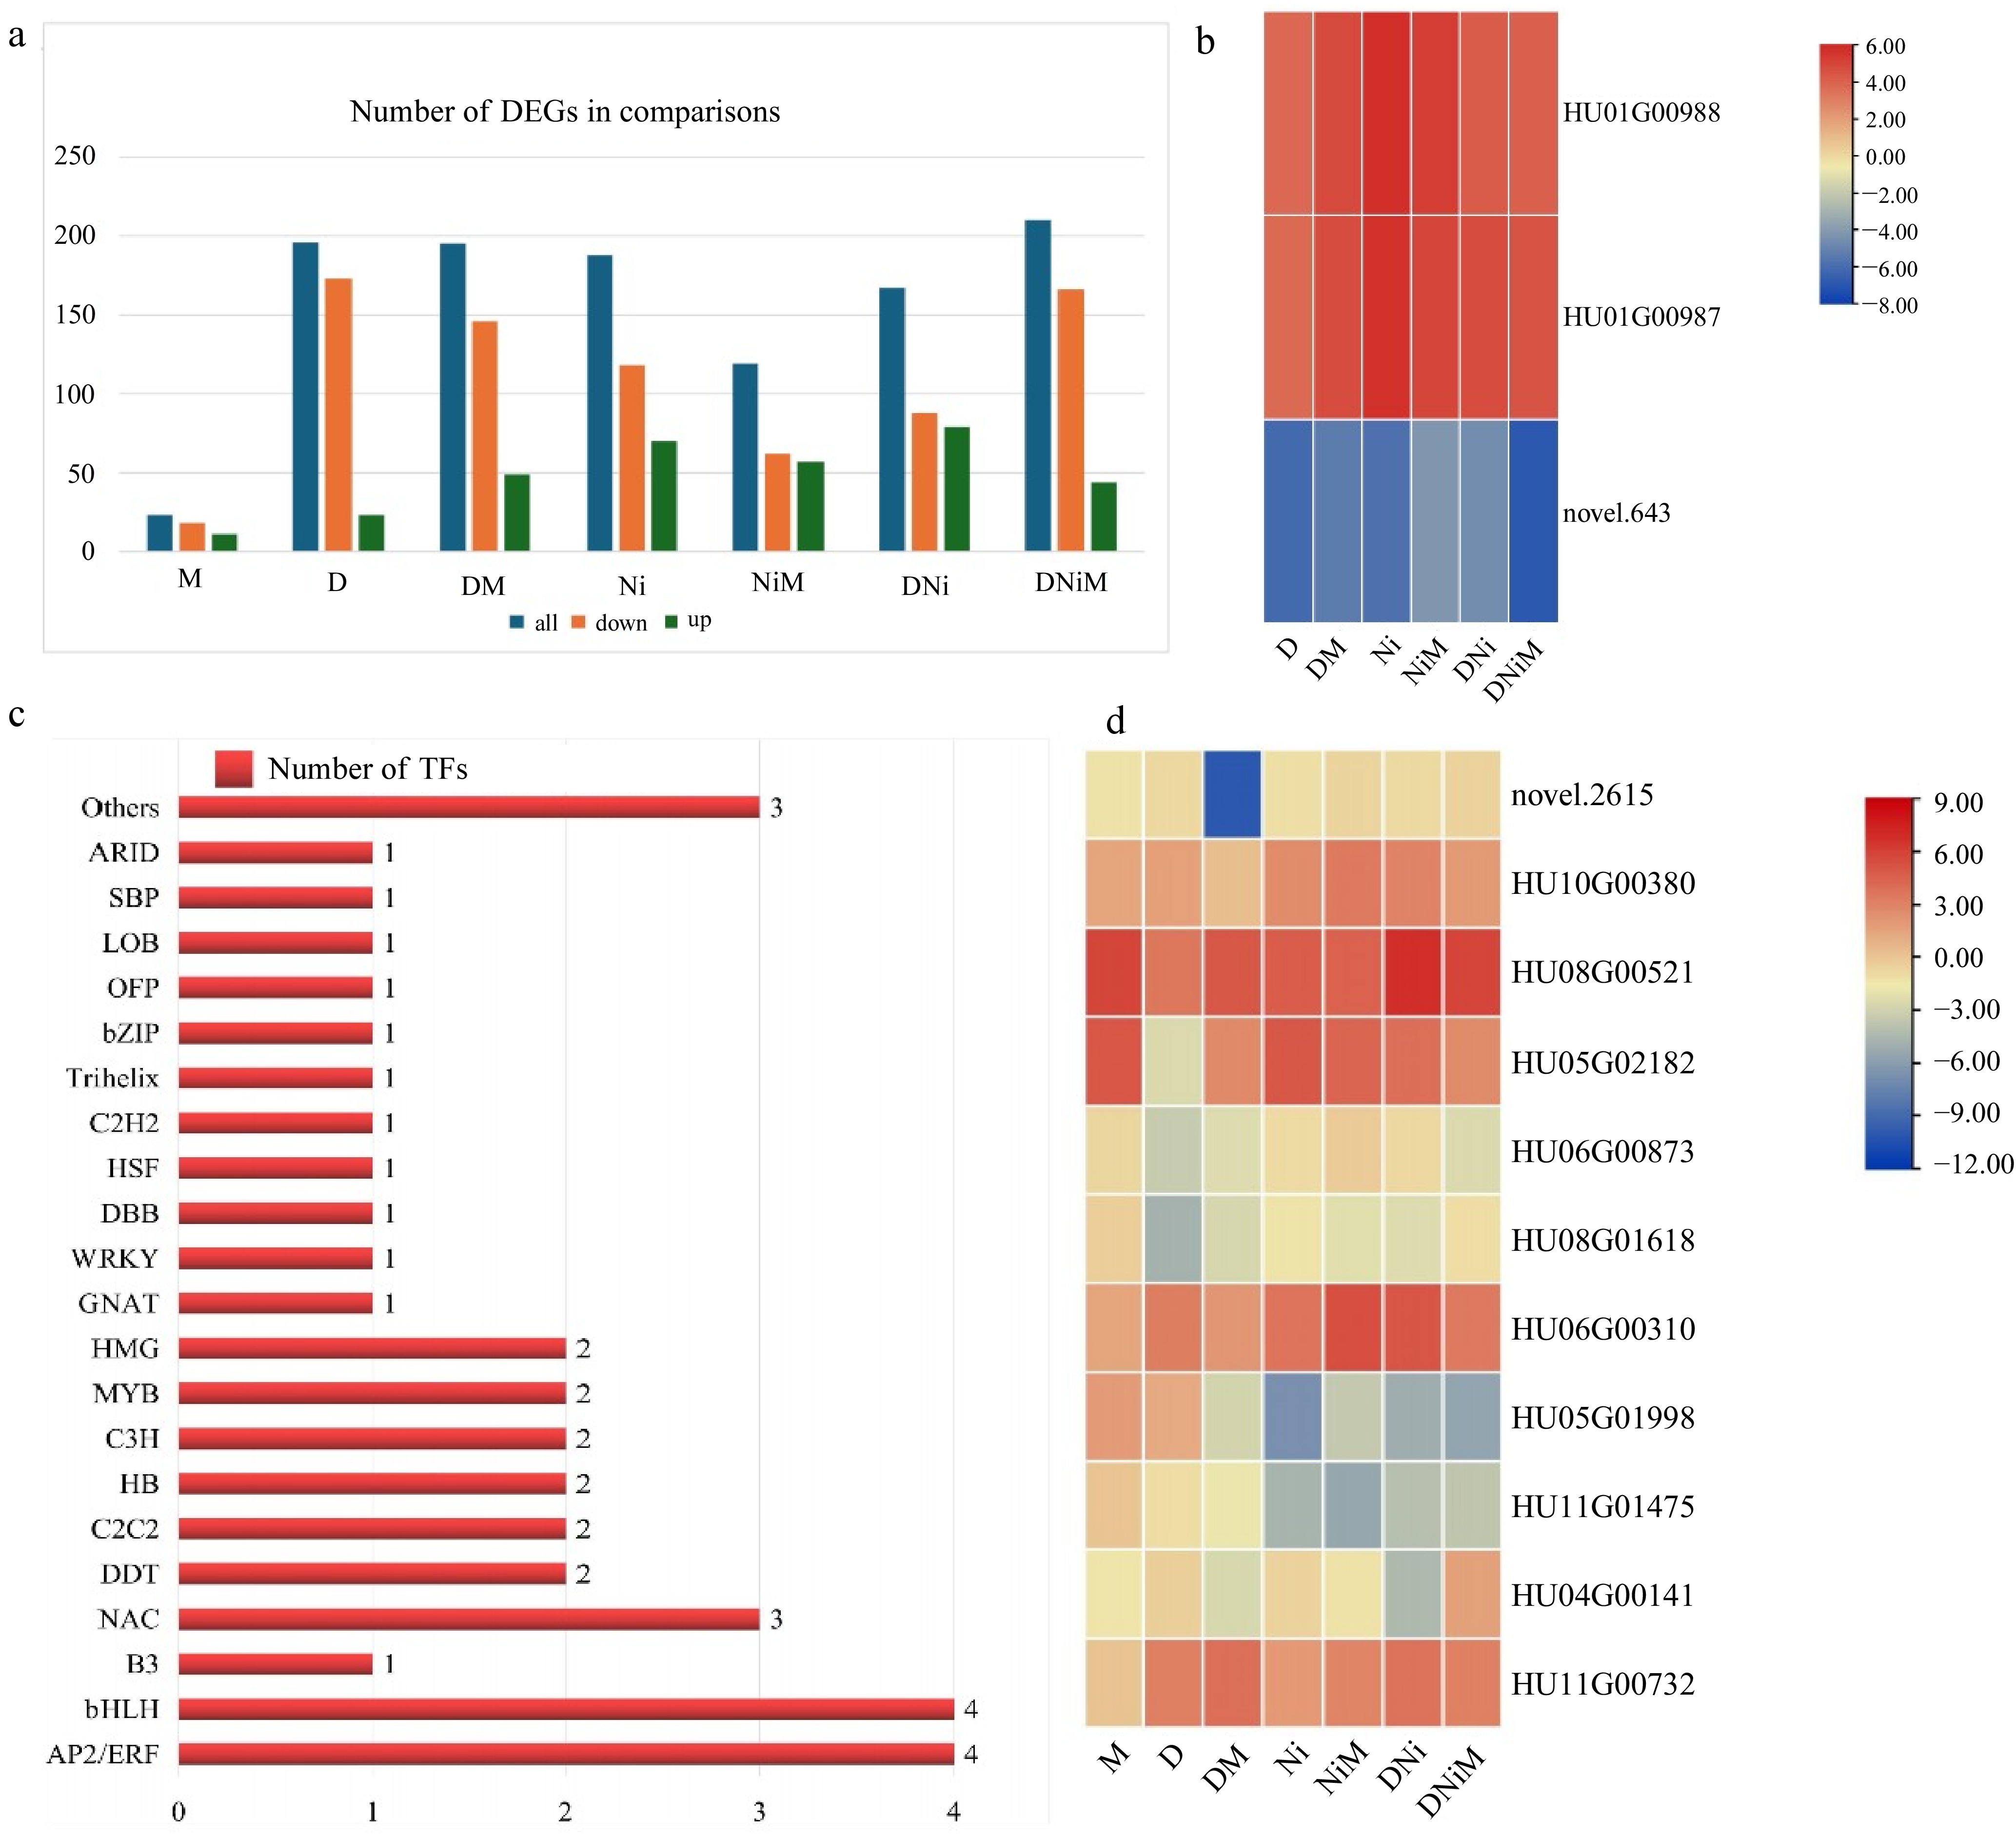
Figure 3.
Differentially expressed genes (DEGs) and transcription factor (TF) families were identified under the indicated treatments. (a) Number of upregulated and downregulated DEGs under each stress treatment. (b) Heatmap illustrating the expression patterns of three representative DEGs (HU01G00987, HU01G00988, and novel 643) across treatment groups. (c) Distribution of 21 TF families represented among the identified DEGs across treatments. (d) Heatmap of the relative expression levels of 11 representative genes from the three most abundant TF families (AP2/ERF, bHLH, and NAC) across treatment groups. DEGs were defined at FDR < 0.05 and |log2FC| ≥ 3.
-
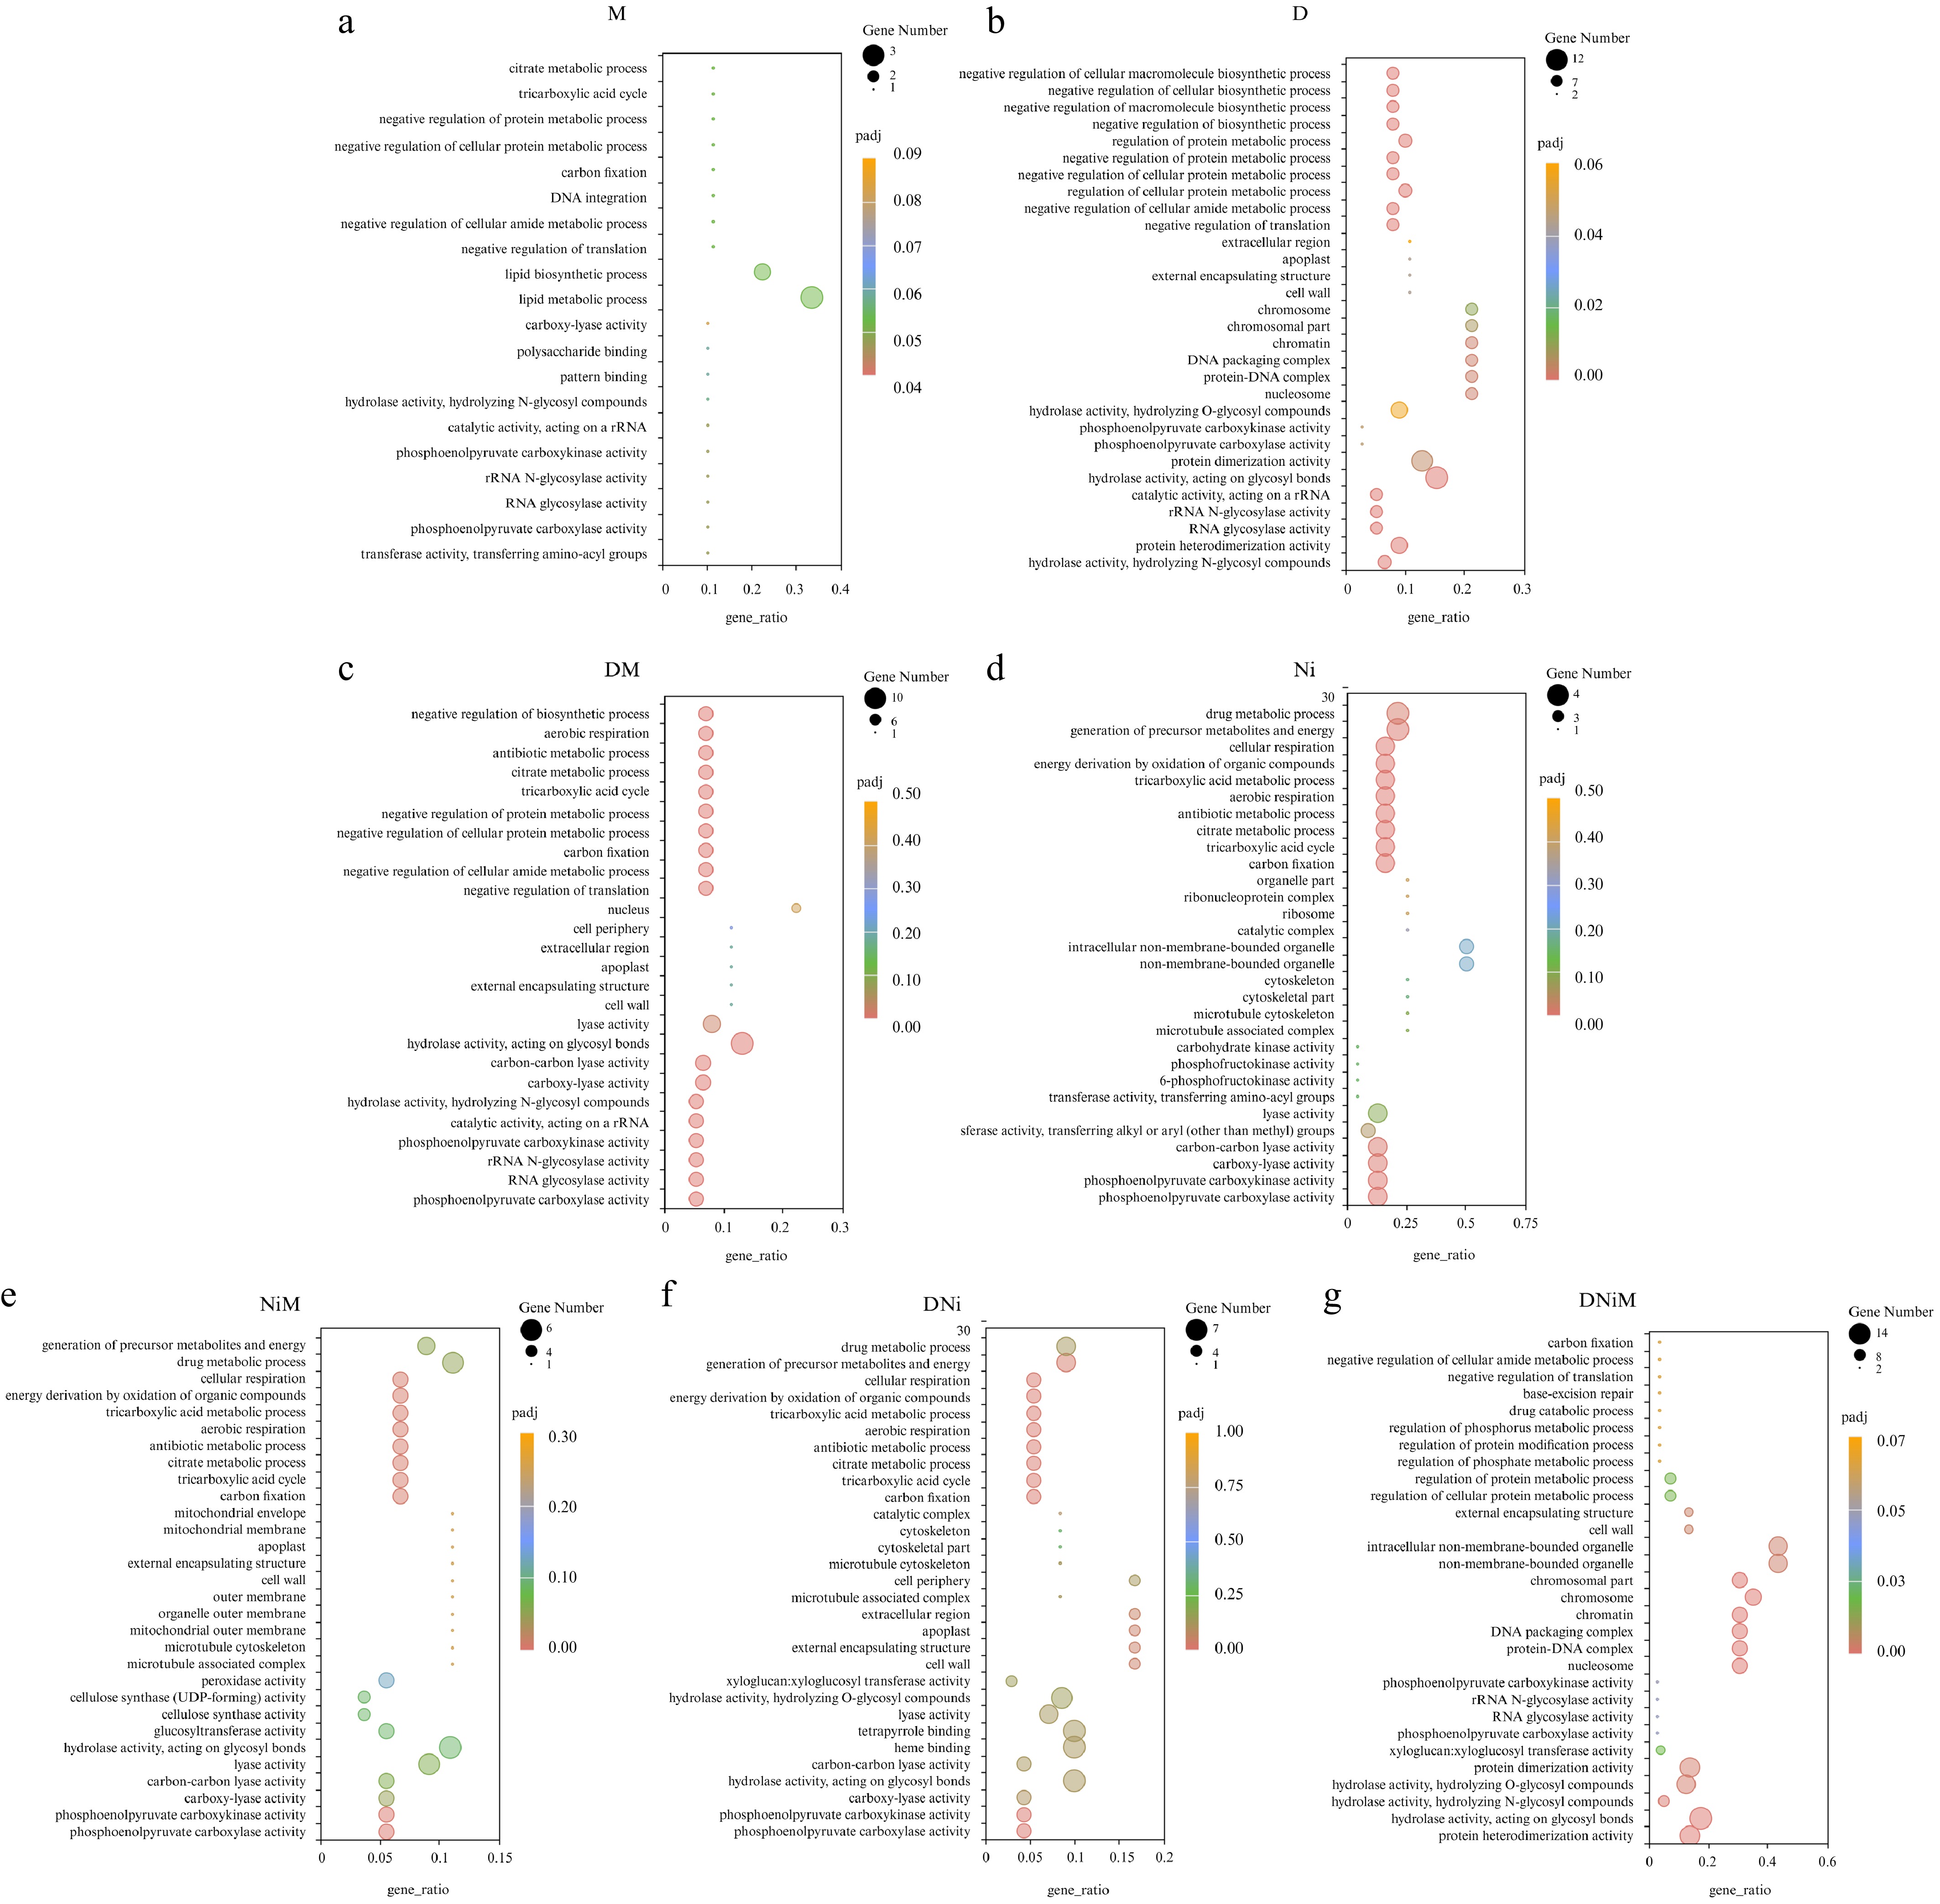
Figure 4.
Gene Ontology (GO) enrichment analysis of DEGs under different treatments. Panels (a)−(g) correspond to a specific stress treatment: (a) melatonin; (b) drought; (c) drought + melatonin; (d) nickel; (e) nickel + melatonin; (f) drought + nickel; (g) drought + nickel + melatonin. For each treatment, the x-axis shows the gene ratio, and the y-axis lists enriched GO terms. Dot size indicates the number of DEGs, and dot color scales with FDR (darker colors indicate more substantial enrichment).
-
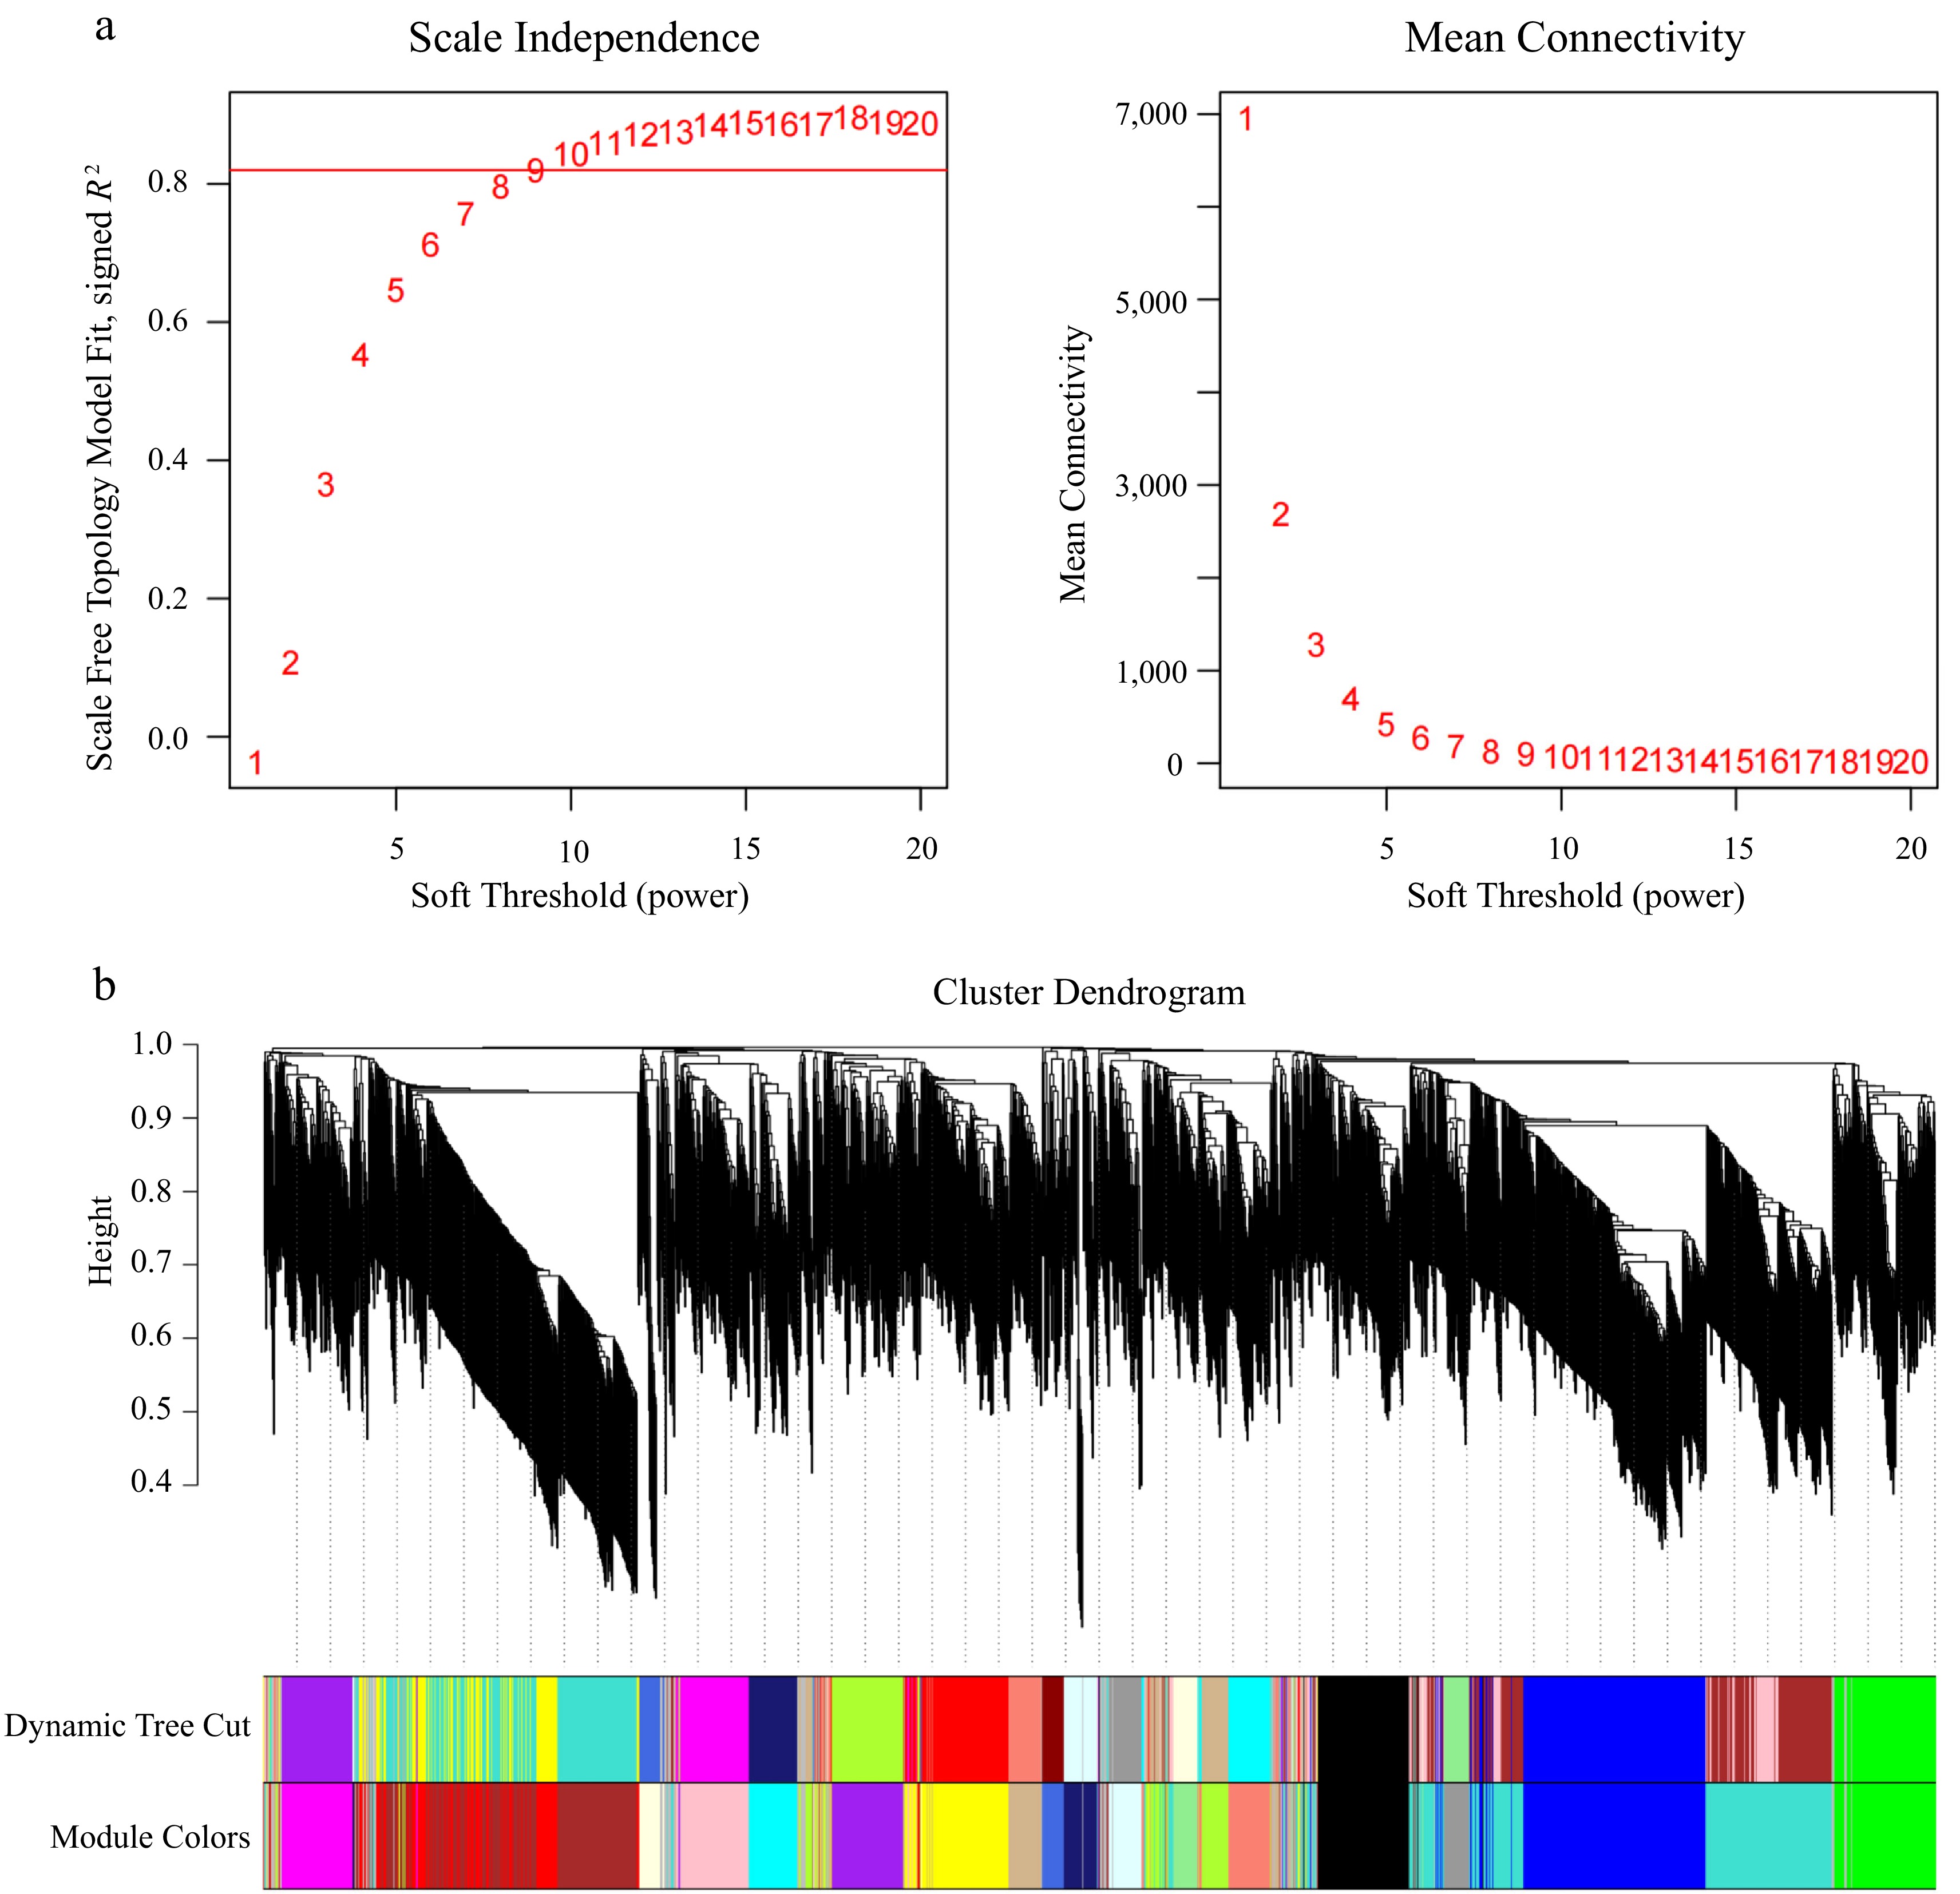
Figure 5.
WGCNA-based co-expression modules and transcription factor (TF) distribution. (a) Effect of soft-thresholding power on scale-free topology fit and mean connectivity. The red horizontal line indicates the scale-free topology fit threshold of R2 = 0.80 used to guide soft-thresholding power selection for WGCNA network construction. (b) Hierarchical clustering dendrogram of expressed genes based on topological overlap, showing assignment of genes into co-expression modules identified by WGCNA. TFs were mainly concentrated in C2C2, MYB, C2H2, HB, C3H, bHLH, AP2/ERF, bZIP, and WRKY families, consistent with their potential roles in abiotic stress regulation.
-
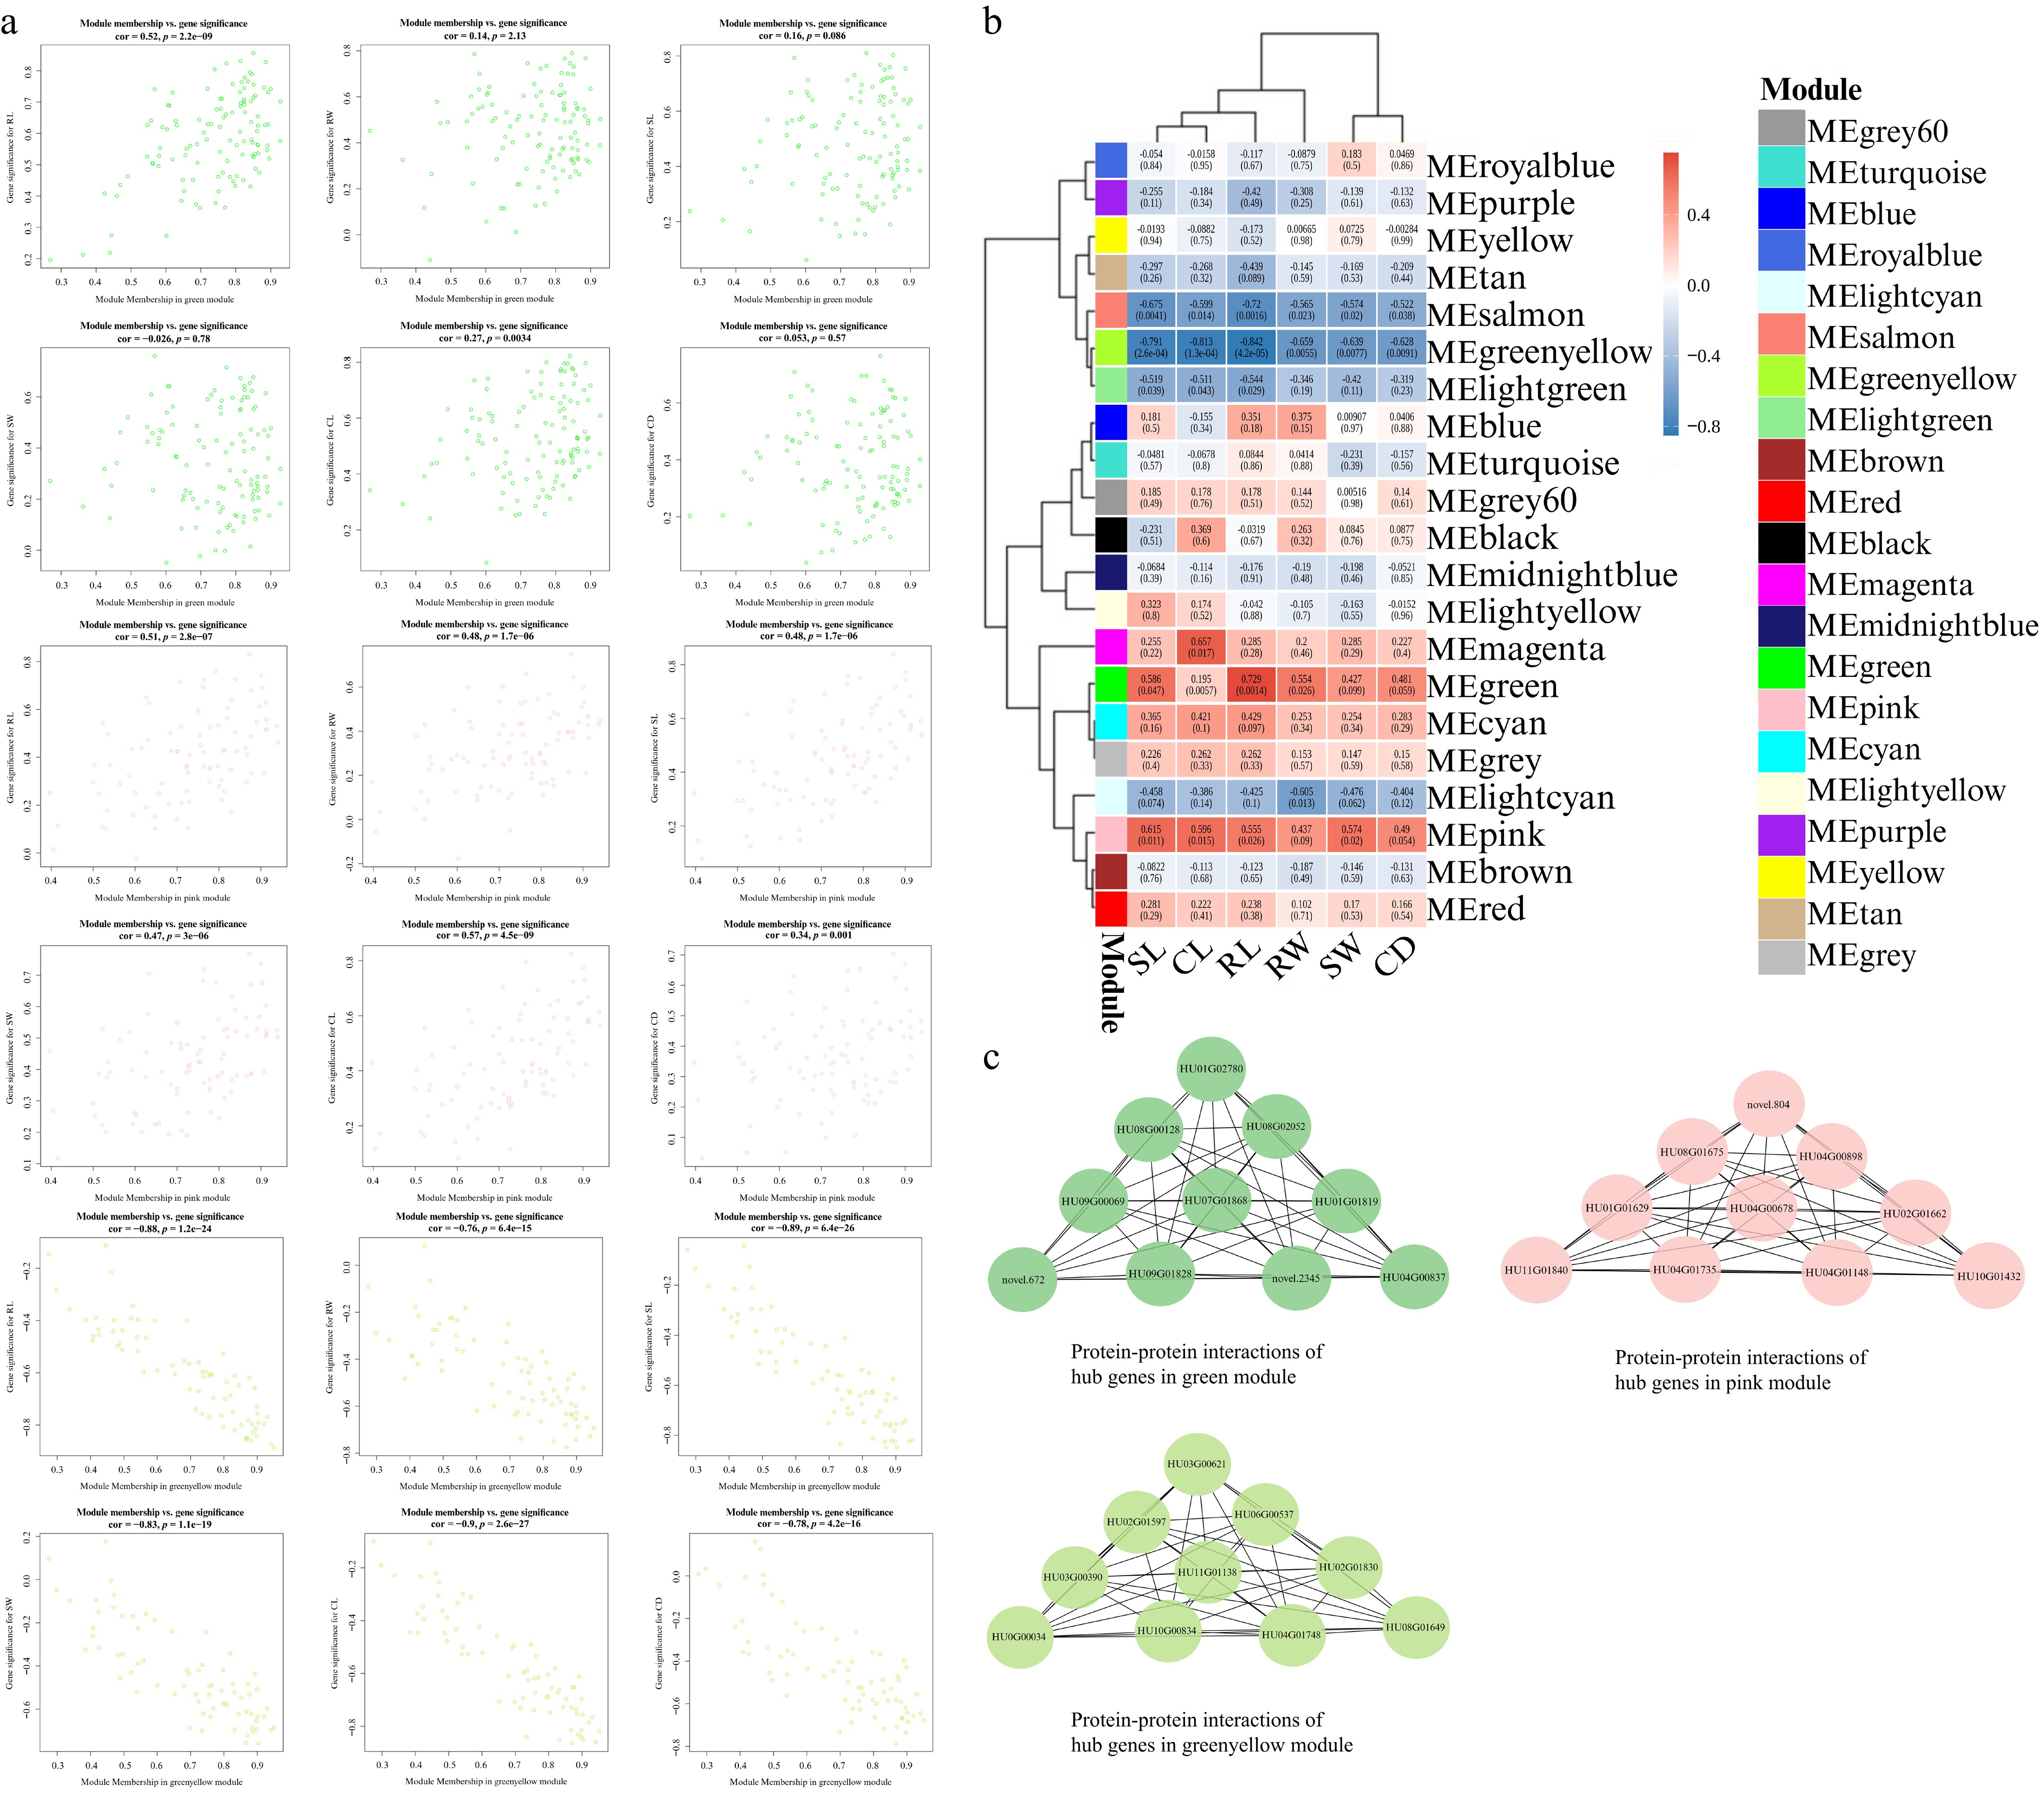
Figure 6.
Module-trait relationship and hub-gene networks under abiotic stress. (a) Scatterplots showing the relationships between module membership and gene significance for the three selected modules (MEgreen, MEpink, and MEgreenyellow). Module membership indicates the correlation between the expression of an individual gene and the corresponding module eigengene, whereas gene significance indicates the correlation between that gene and the associated phenotypic trait. The x-axis represents module membership, while the y-axis displays gene significance for traits. (b) Full heatmap of correlation between 21 WGCNA modules and six phenotypic traits: shoot length (SL), cladode length (CL), root length (RL), root weight (RW), shoot weight (SW), and cladode diameter (CD). Red indicates positive correlation and blue indicates negative correlation. Each cell reports the correlation coefficient and the BH-adjusted p-value (FDR). (c) Protein–protein interaction (PPI) network of the top 10 hub genes identified in the MEpink, MEgreen, and MEgreenyellow modules. Nodes represent hub genes, and edges indicate predicted conserved interactions. These networks were inferred from Arabidopsis orthologs using STRING and therefore represent orthology-based predicted interactions rather than experimentally validated pitaya-specific PPIs.
-
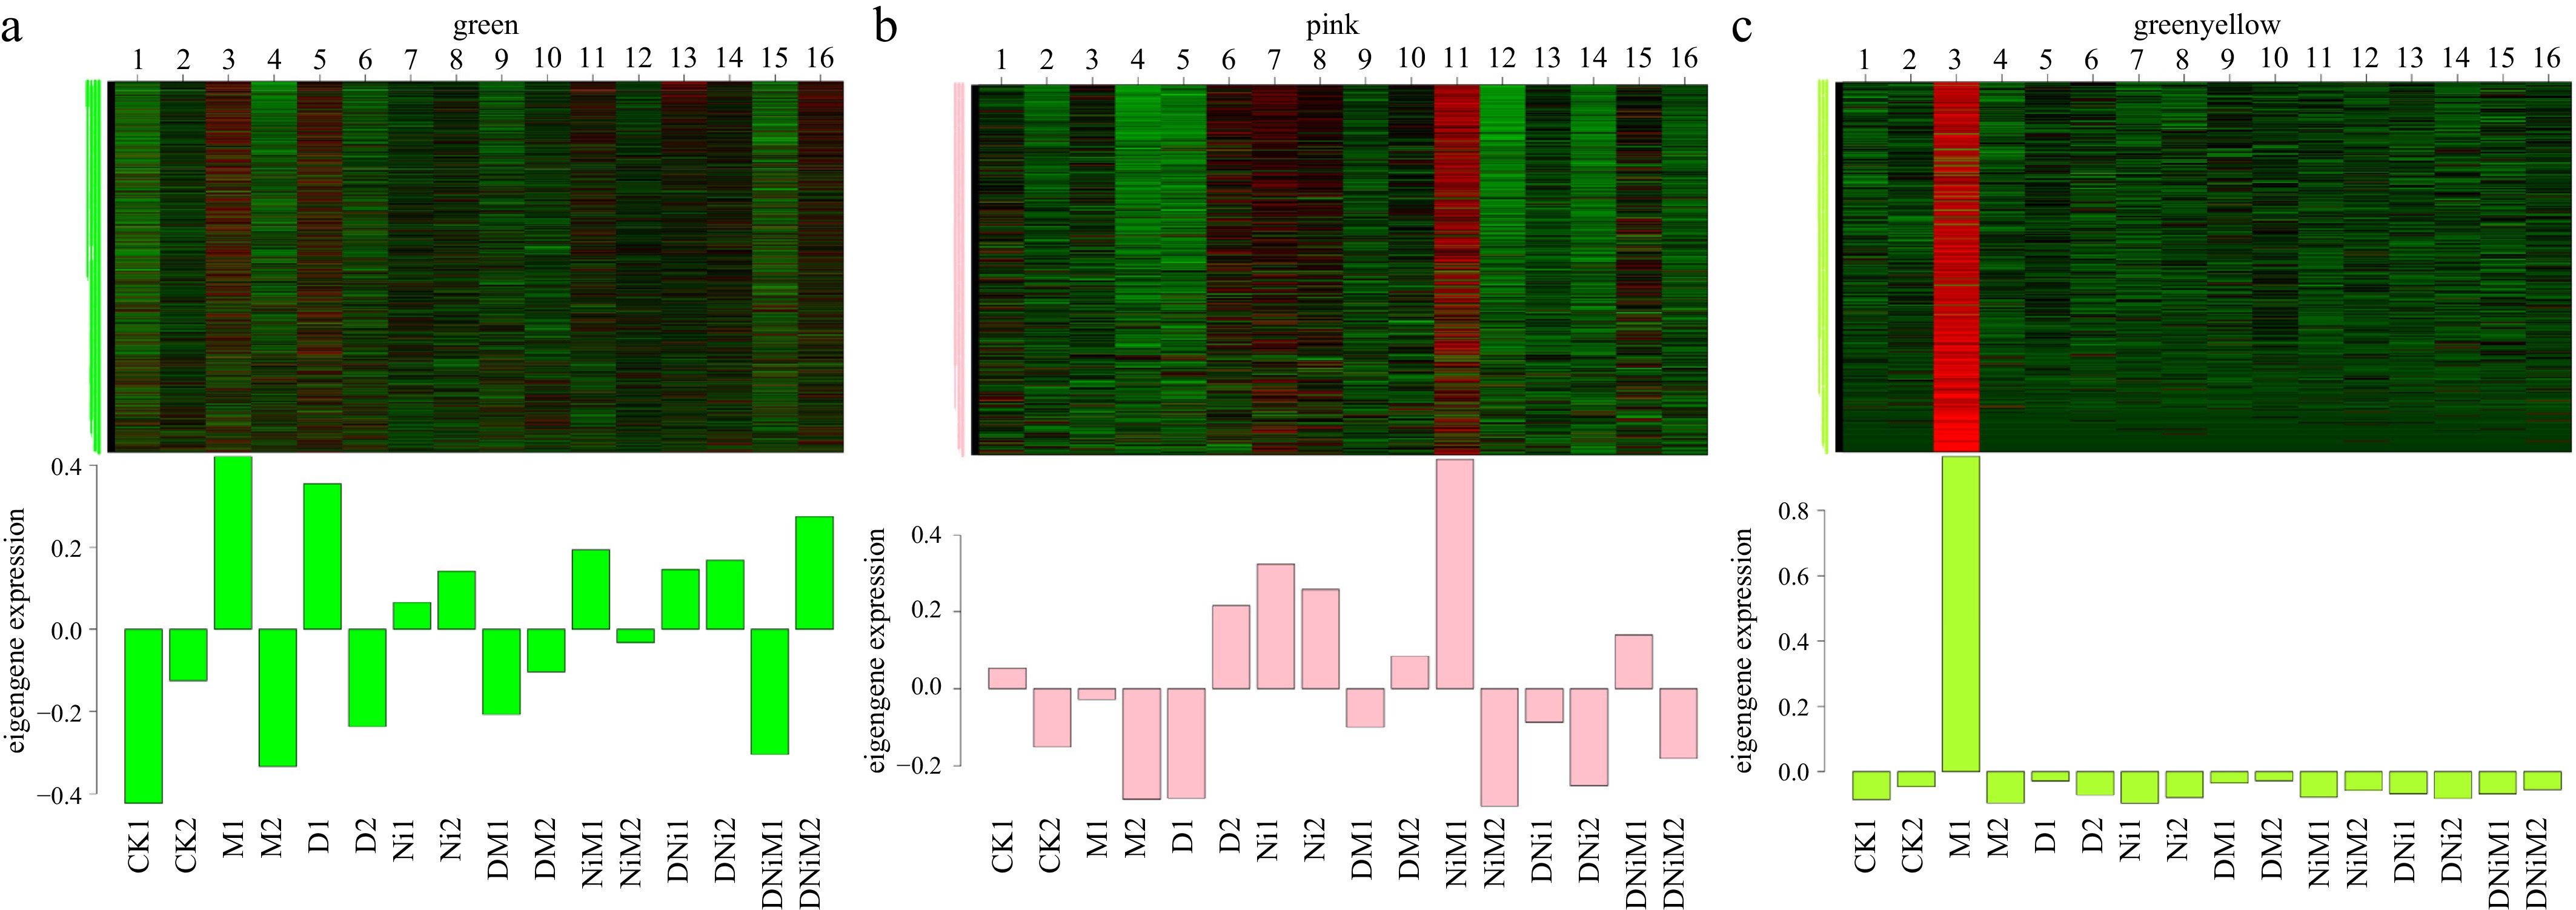
Figure 7.
Relative expression patterns of genes in representative co-expression modules. Heatmaps show the relative expression profiles of genes assigned to the three representative modules: (a) MEgreen; (b) MEpink; (c) MEgreenyellow module. Rows represent genes within each module, and the columns represent treatment samples. The x-axis shows the treatment groups in order: control (CK); melatonin (M); drought (D); drought + melatonin (DM); nickel (Ni); nickel + melatonin (NiM); drought + nickel (DNi); drought + nickel + melatonin (DNiM); with biological replicates one and two for each treatment (n = 2). Color intensity represents relative normalized expression across samples, illustrating treatment-associated expression variation within each module.
-
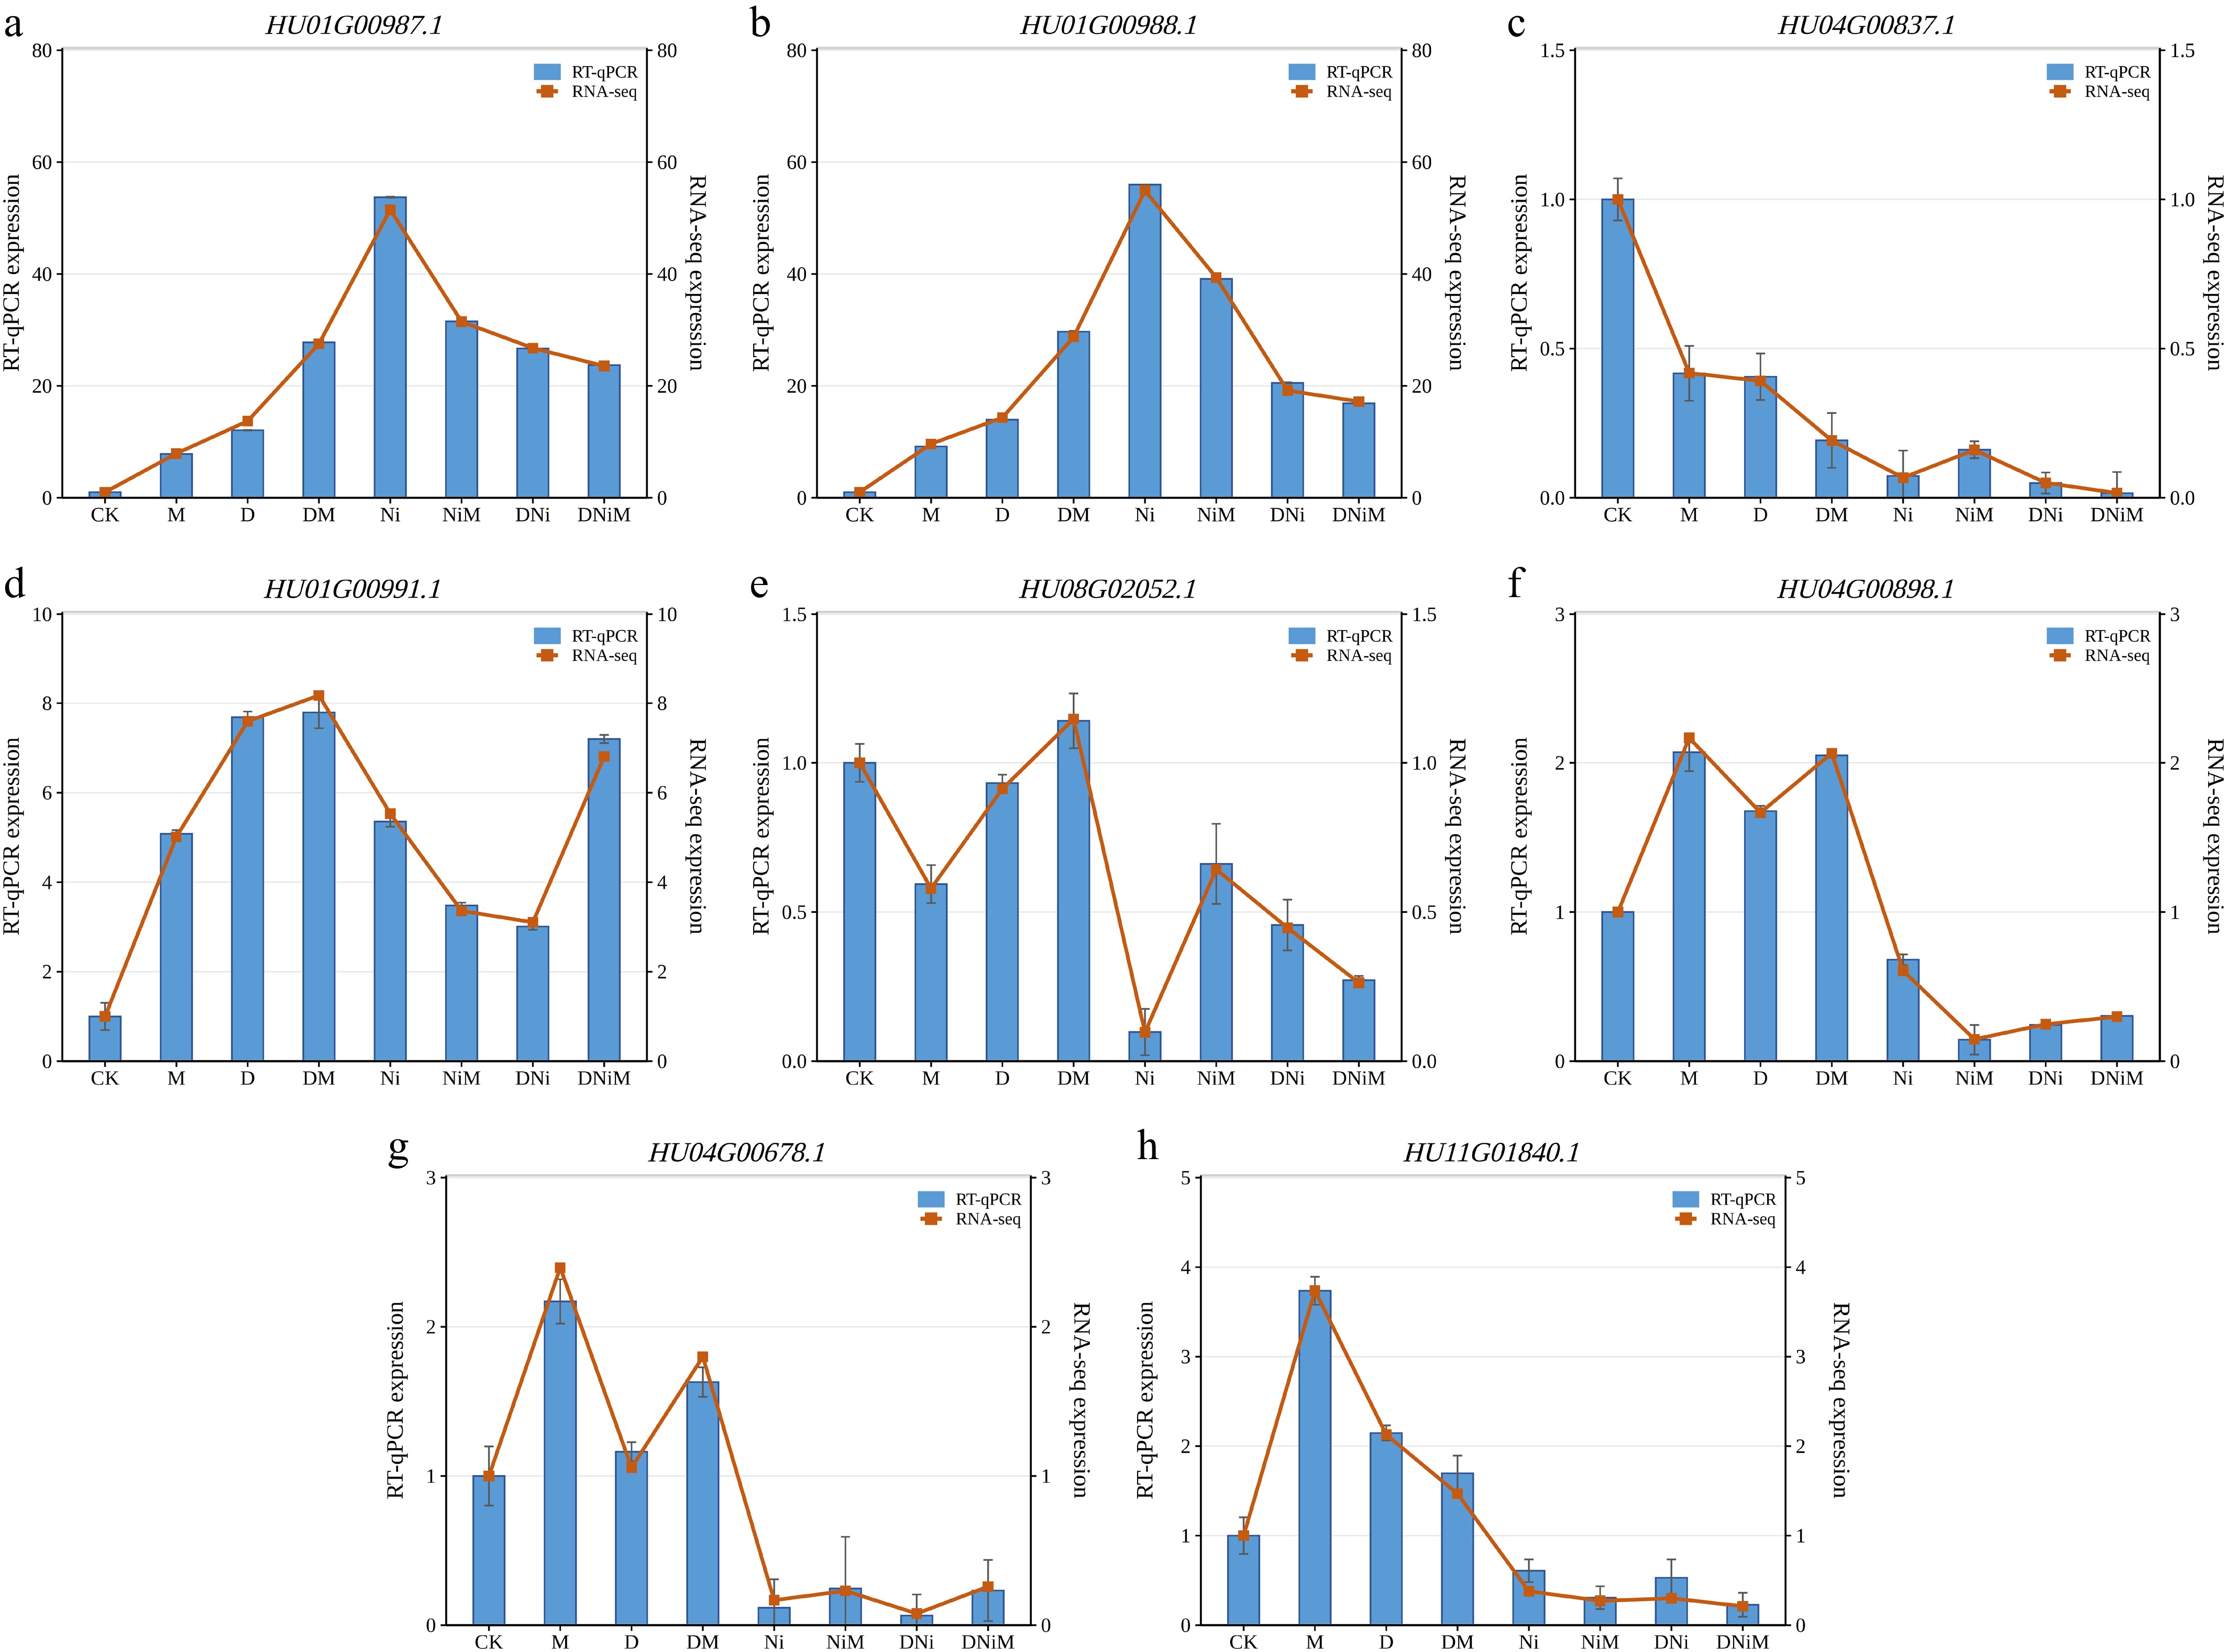
Figure 8.
qRT-PCR validation of eight candidate genes and comparison with RNA-seq expression patterns. Blue bars represent relative qRT-PCR expression levels, and orange lines represent the RNA-seq expression values across CK, M, D, DM, Ni, NiM, DNi, and DNiM treatments. Error bars indicate the standard deviation of RT-qPCR measurements from three biological replicates. The selected genes were HU01G00987.1, HU01G00988.1, HU04G00837.1, HU01G00991.1, HU08G02052.1, HU04G00898.1, HU04G00678.1, and HU11G01840.1.
Figures
(8)
Tables
(0)