-
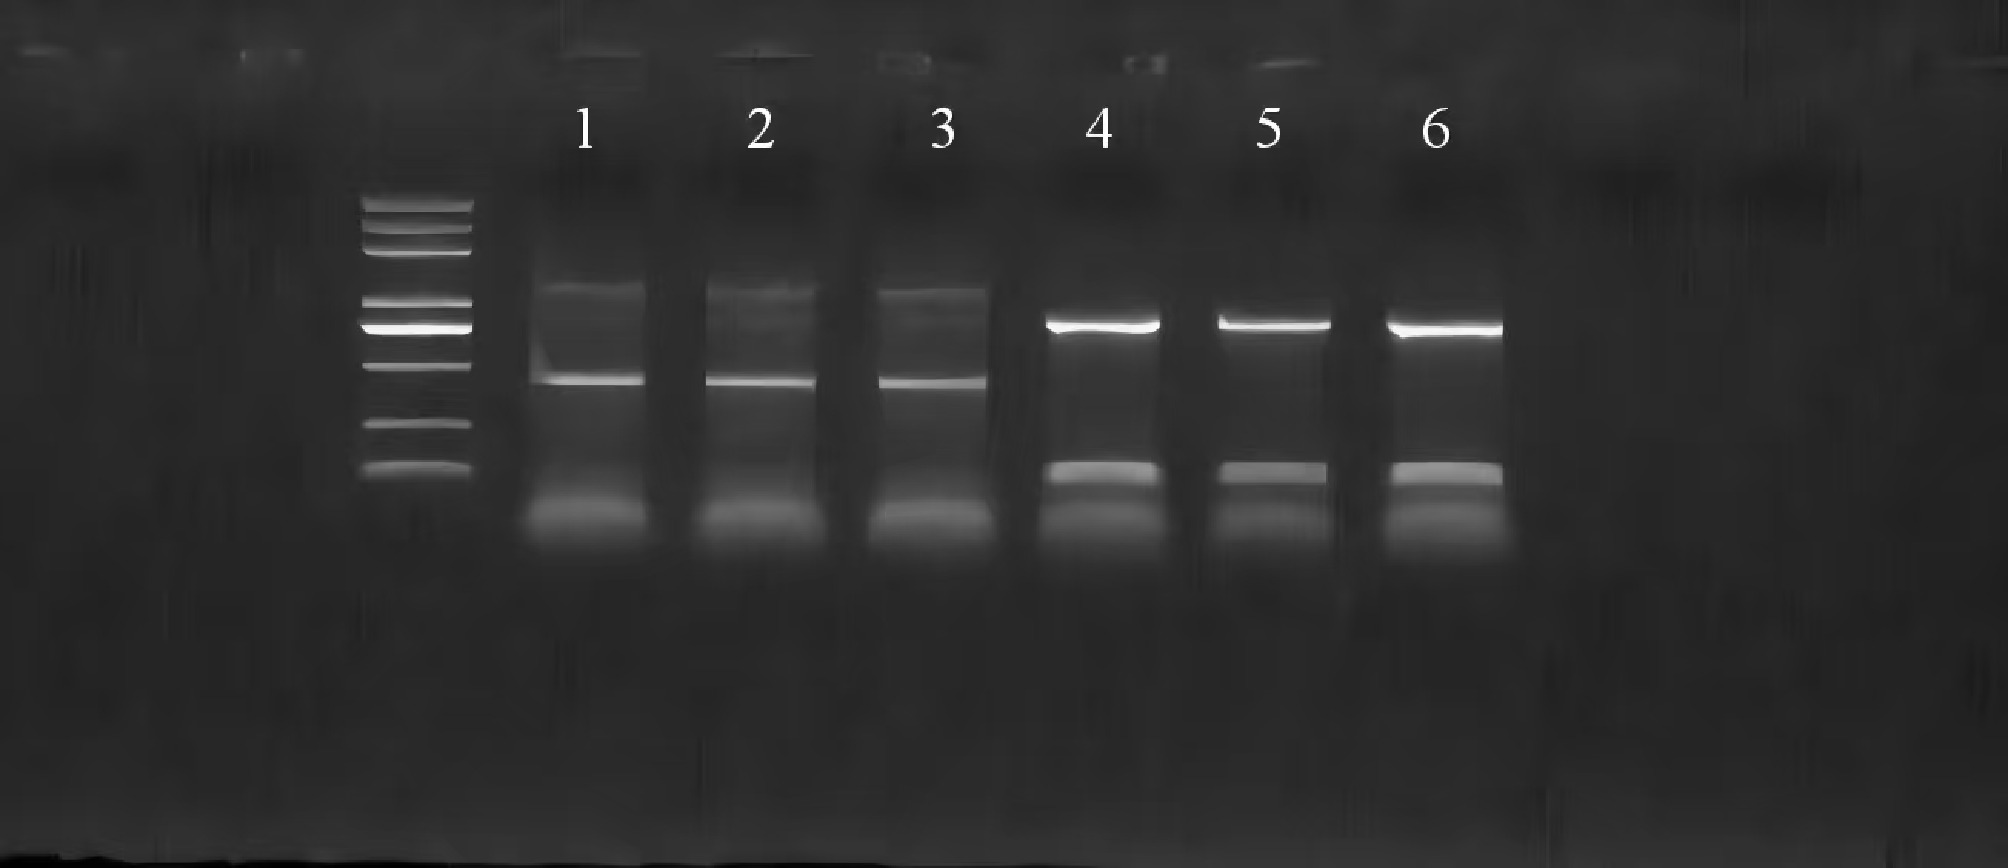
Figure 1.
PCR identification of Shiga-lipa-PBBR overexpressing colonies. Serial numbers 1–3 are wild-type P. shigelloides, and serial numbers 4–6 are P. shigelloides with overexpression of the lipa gene.
-
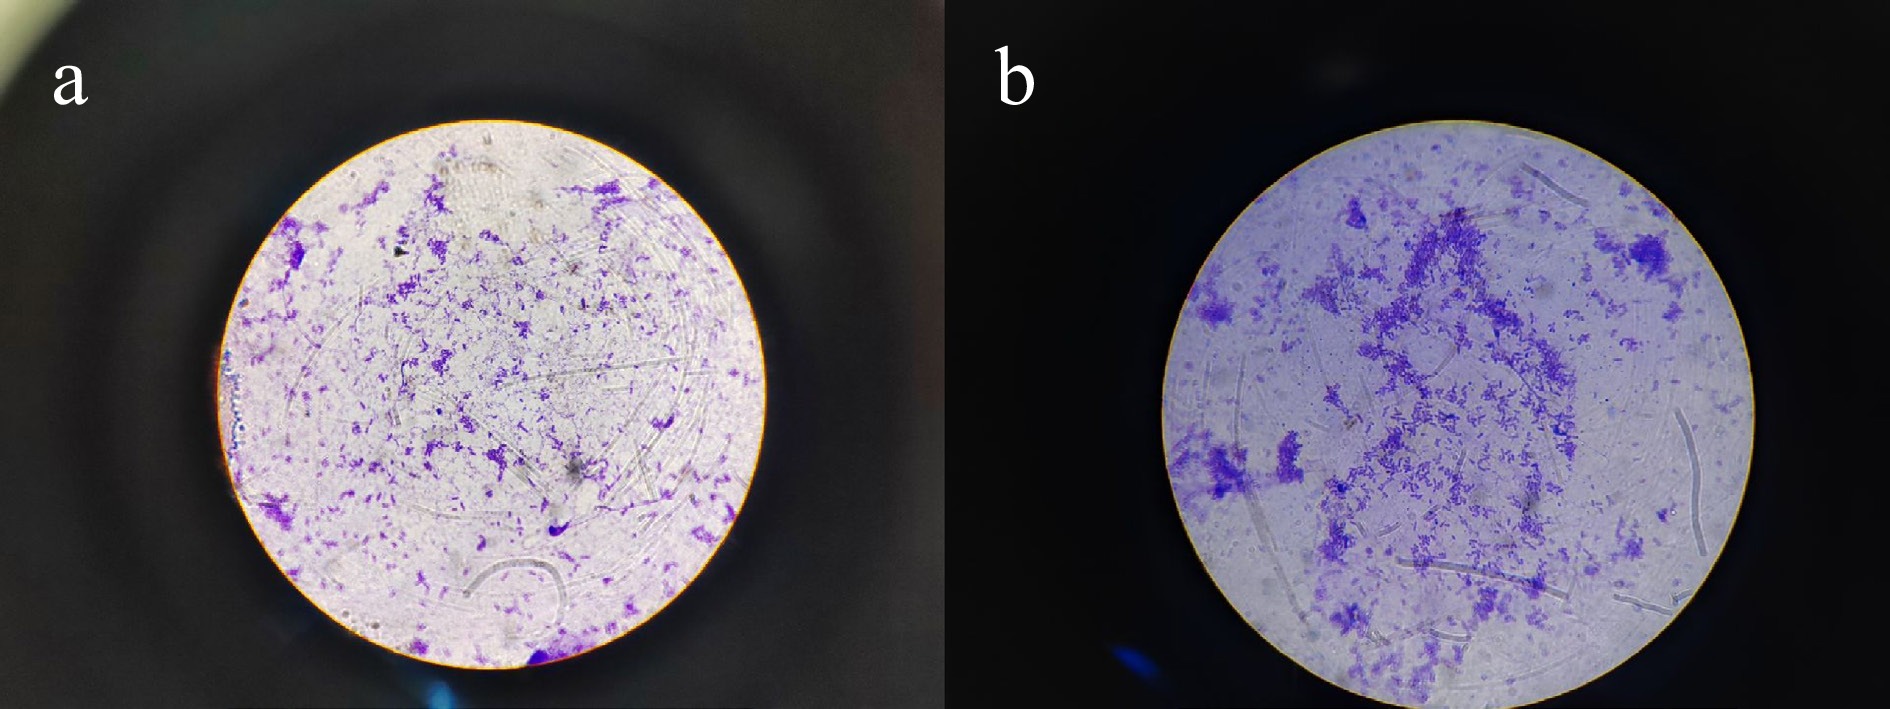
Figure 2.
The adhesion of wild-type P. shigelloides and lipa gene overexpressed P. shigelloides to the mucus on the body surface of the Silurus meridionalis. (a) staining of wild-type P. shigelloides, and (b) staining of P. shigelloides overexpressing the lipa gene.
-
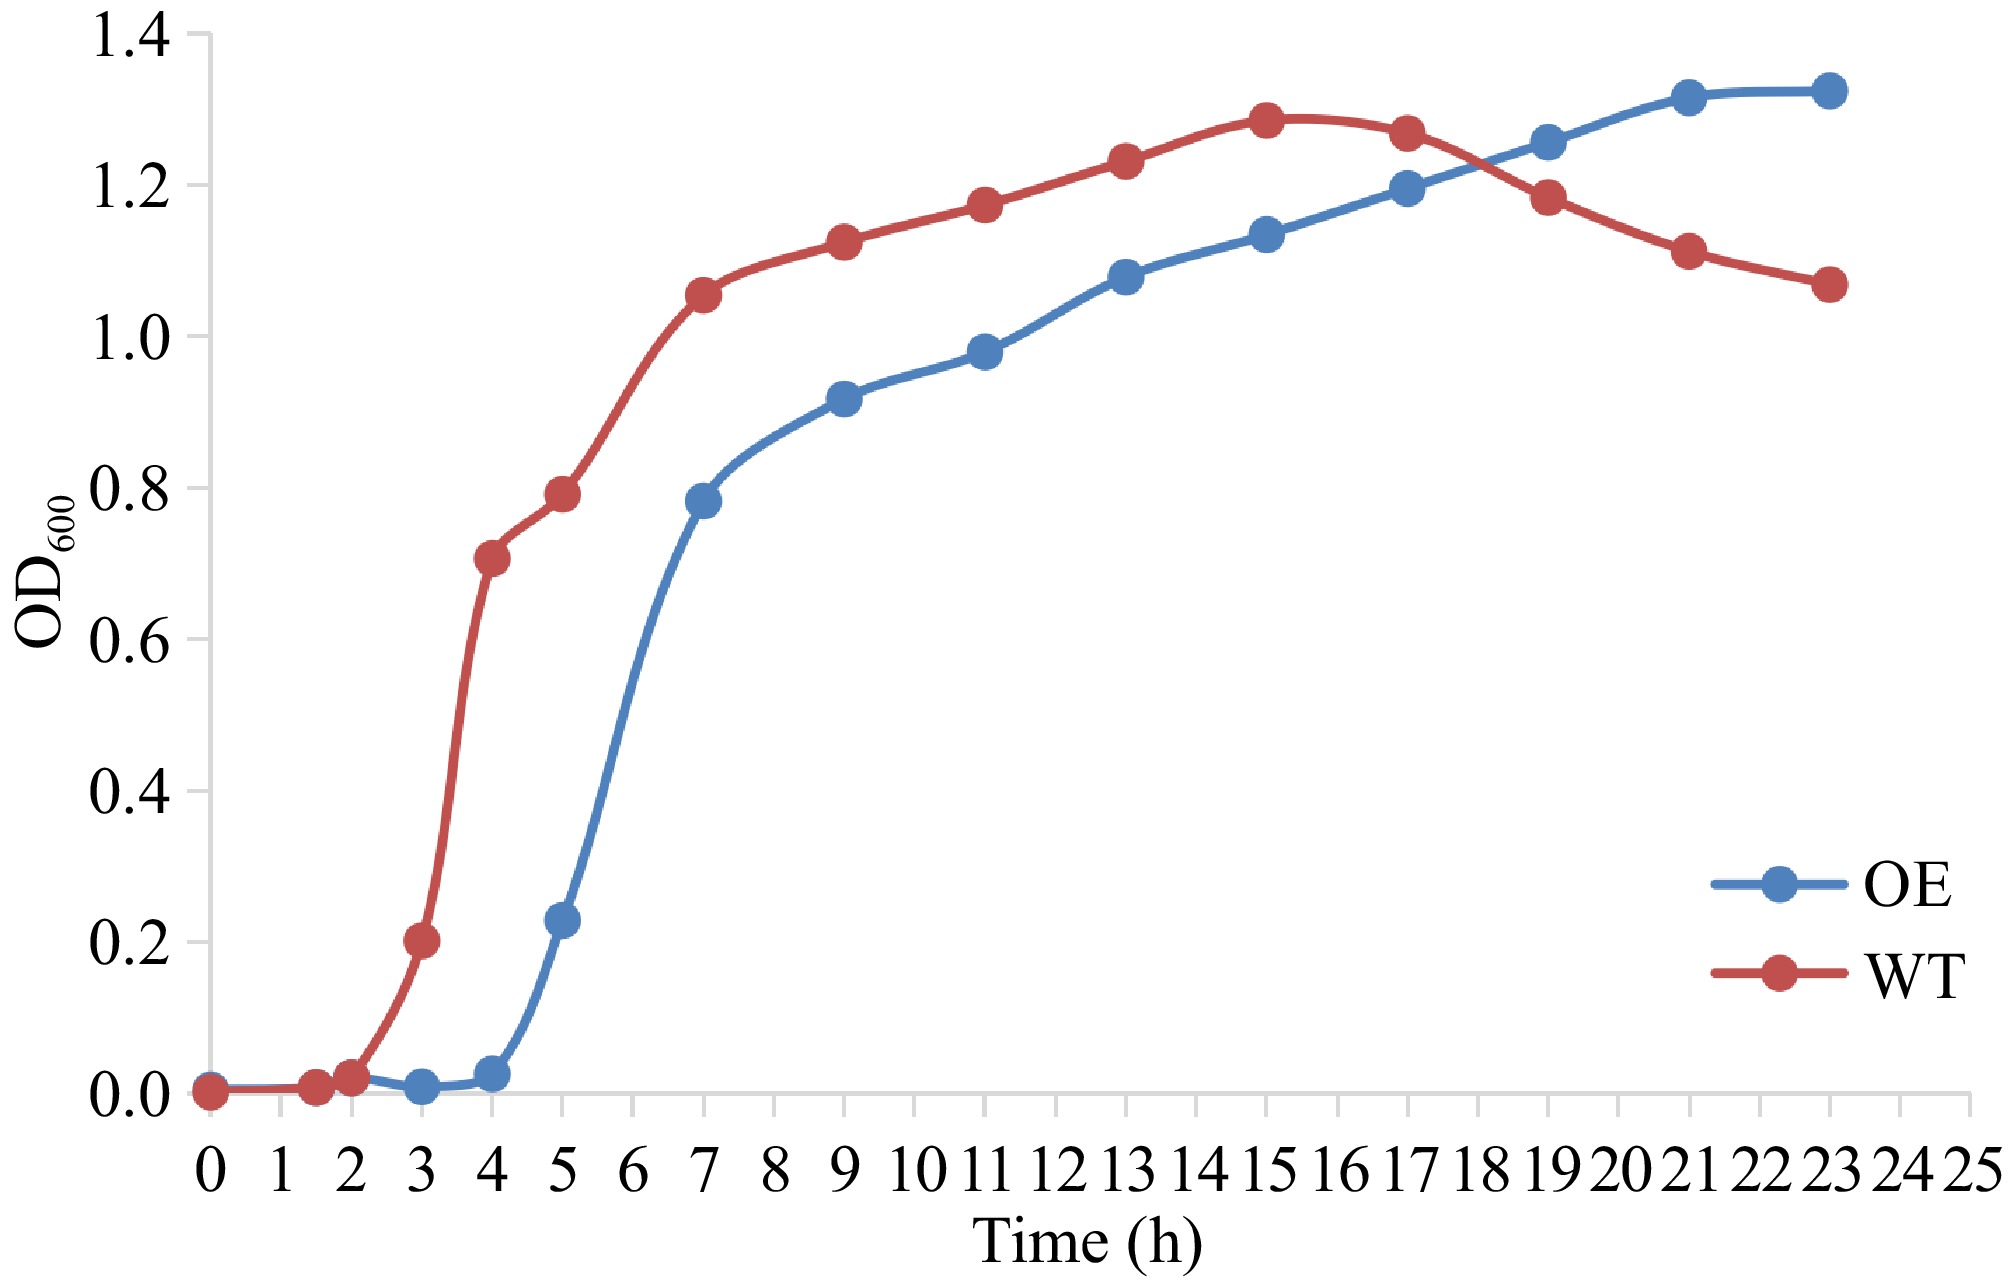
Figure 3.
Growth curves of wild-type (WT) and lipa-overexpressing (OE) P. shigelloides.
-
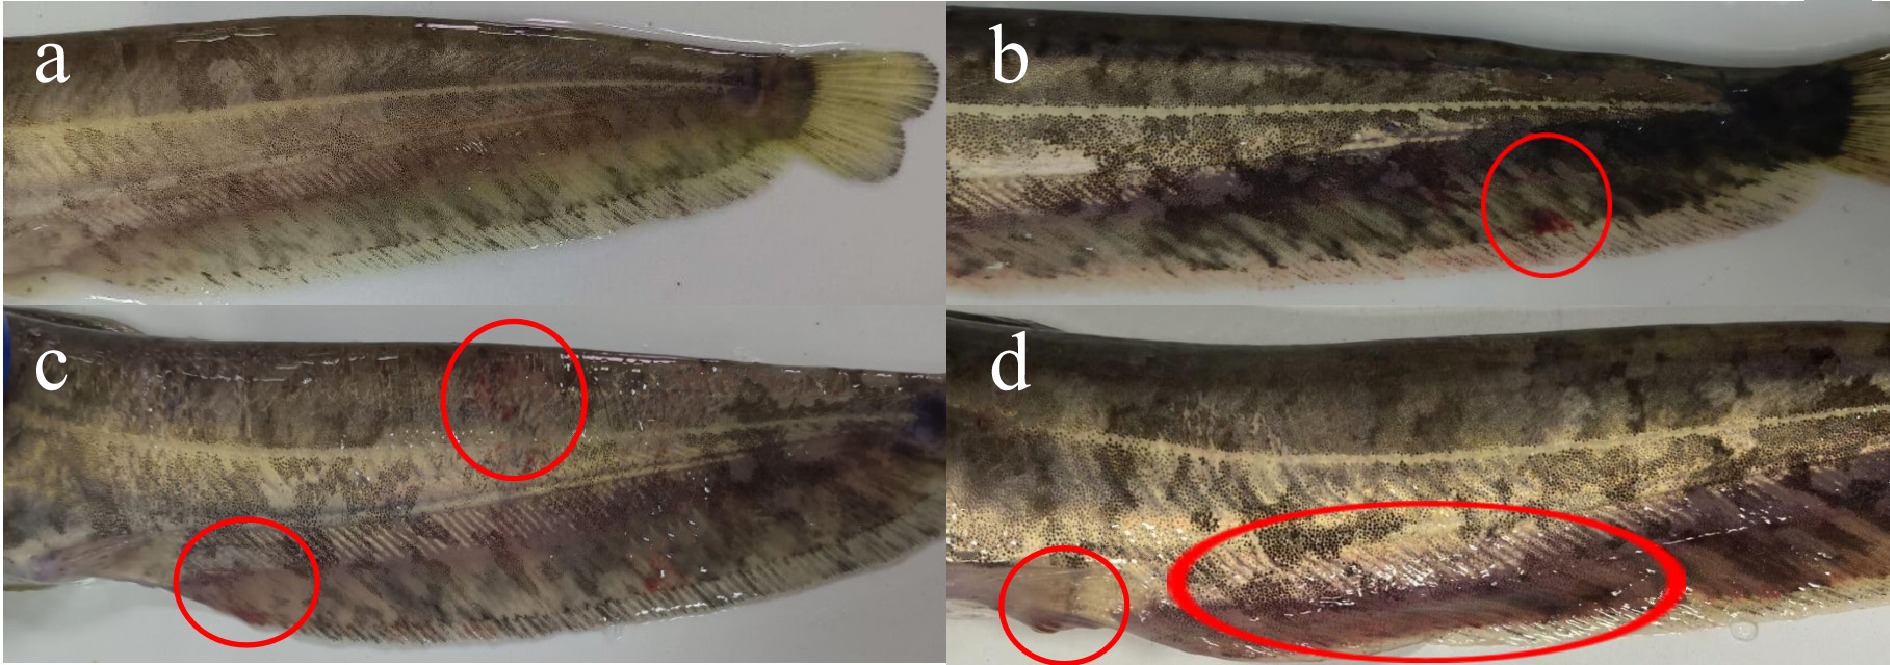
Figure 4.
Symptoms of P. shigelloides infection for 72 h. (a) asymptomatic Silurus meridionalis injected with sterile saline in the control group; (b) bleeding on the anal fin and tail fin with blackness on the body surface in the wild group; (c) obvious lesions on the body surface with bleeding on the tail fin in the overexpression group; and (d) redness and swelling of the genital orifice, black skin and bleeding on the anal fin and the tail fin in the overexpression group.
-
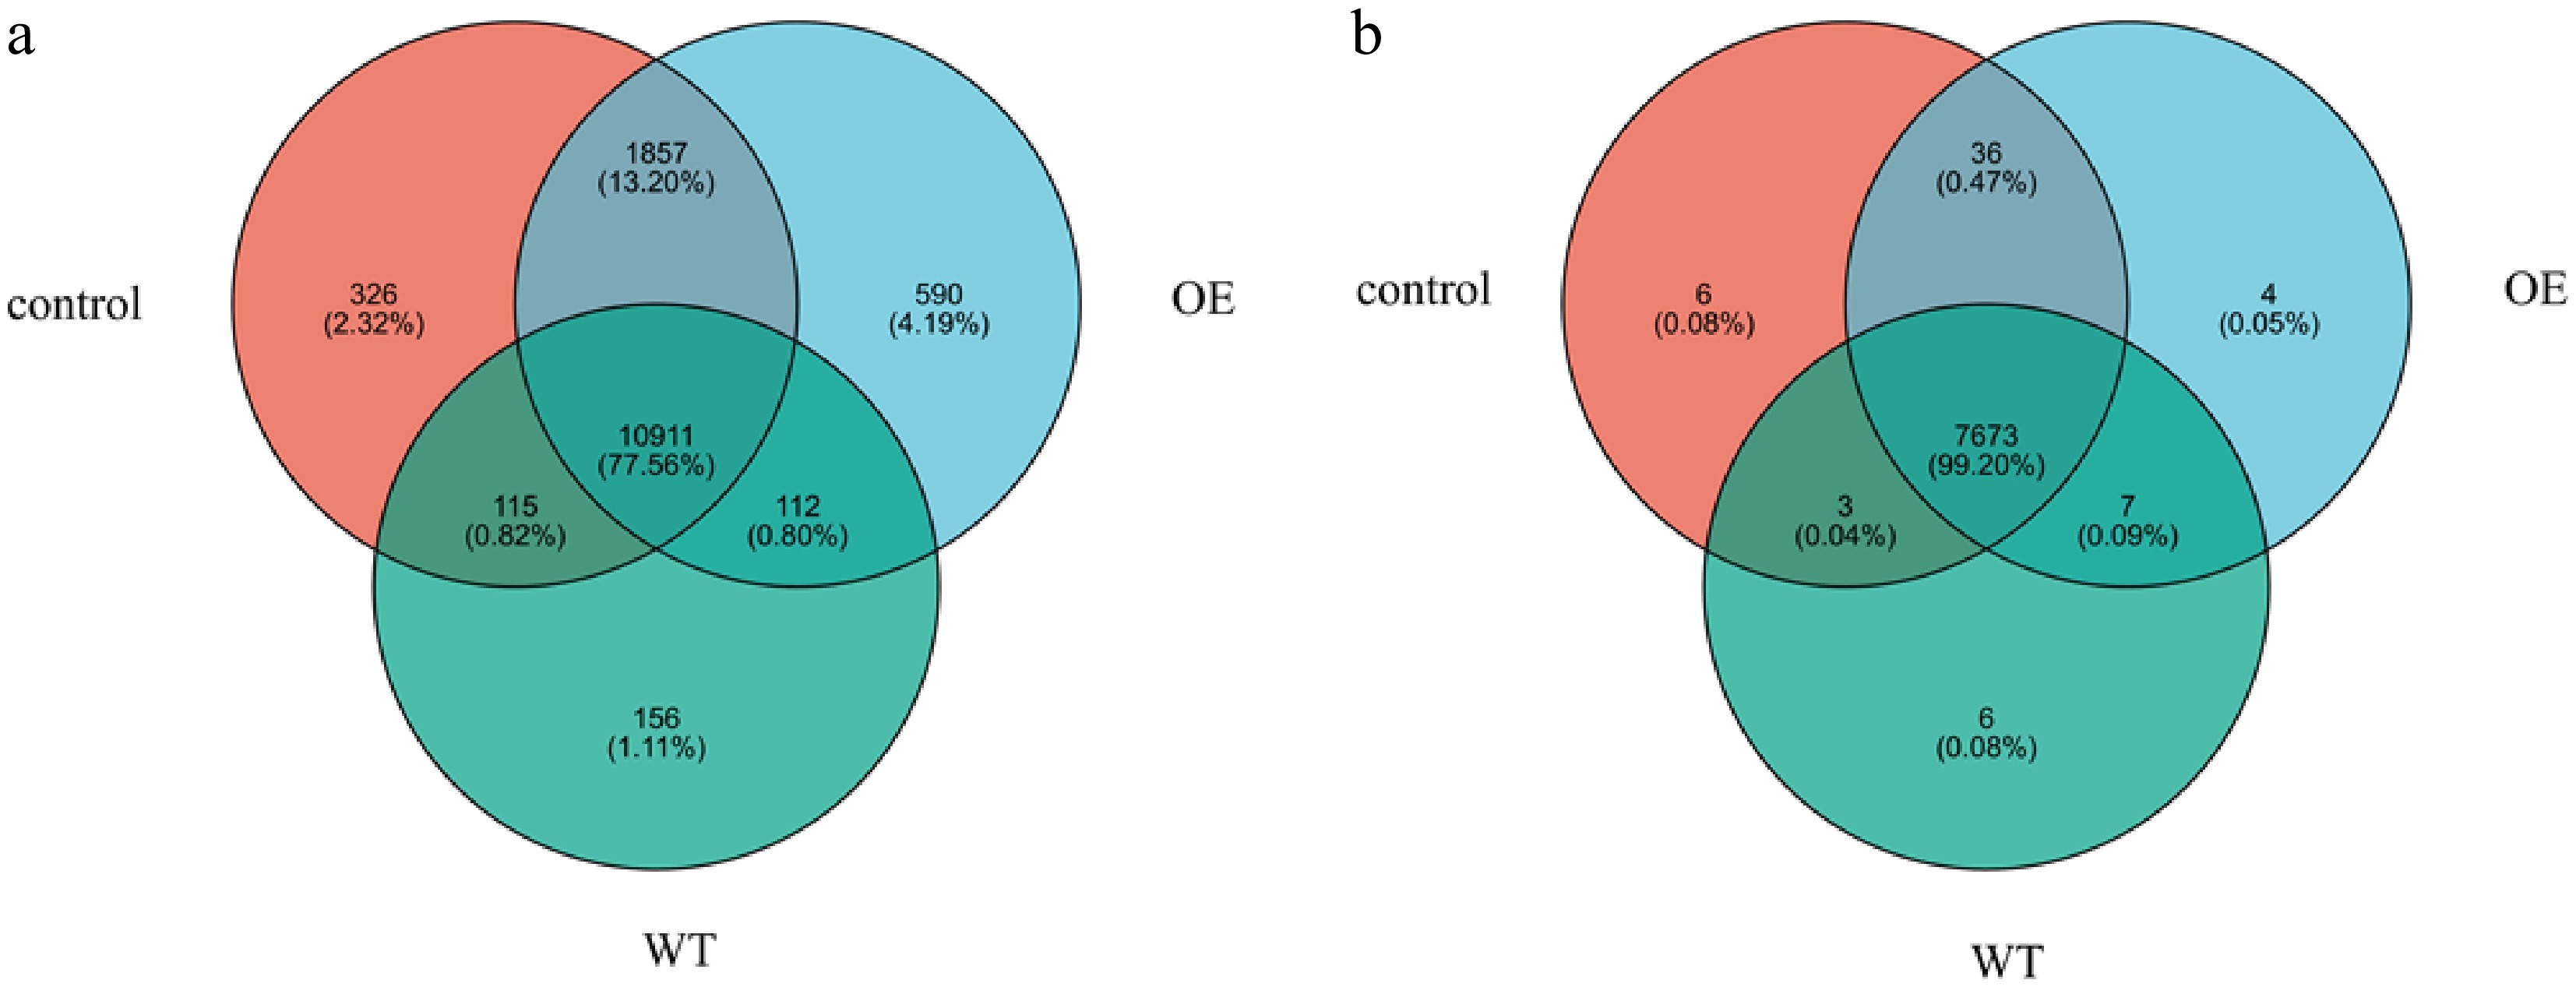
Figure 5.
Venn diagram of genes and proteins. The overlapped part of the figure represents the number of genes and proteins shared between groups; the part without overlap represents the number of genes and proteins unique to the group, and the numbers represent the corresponding gene and protein numbers. Among them, WT represents the wild-type strain group, and OE represents the overexpressed strain group.
-
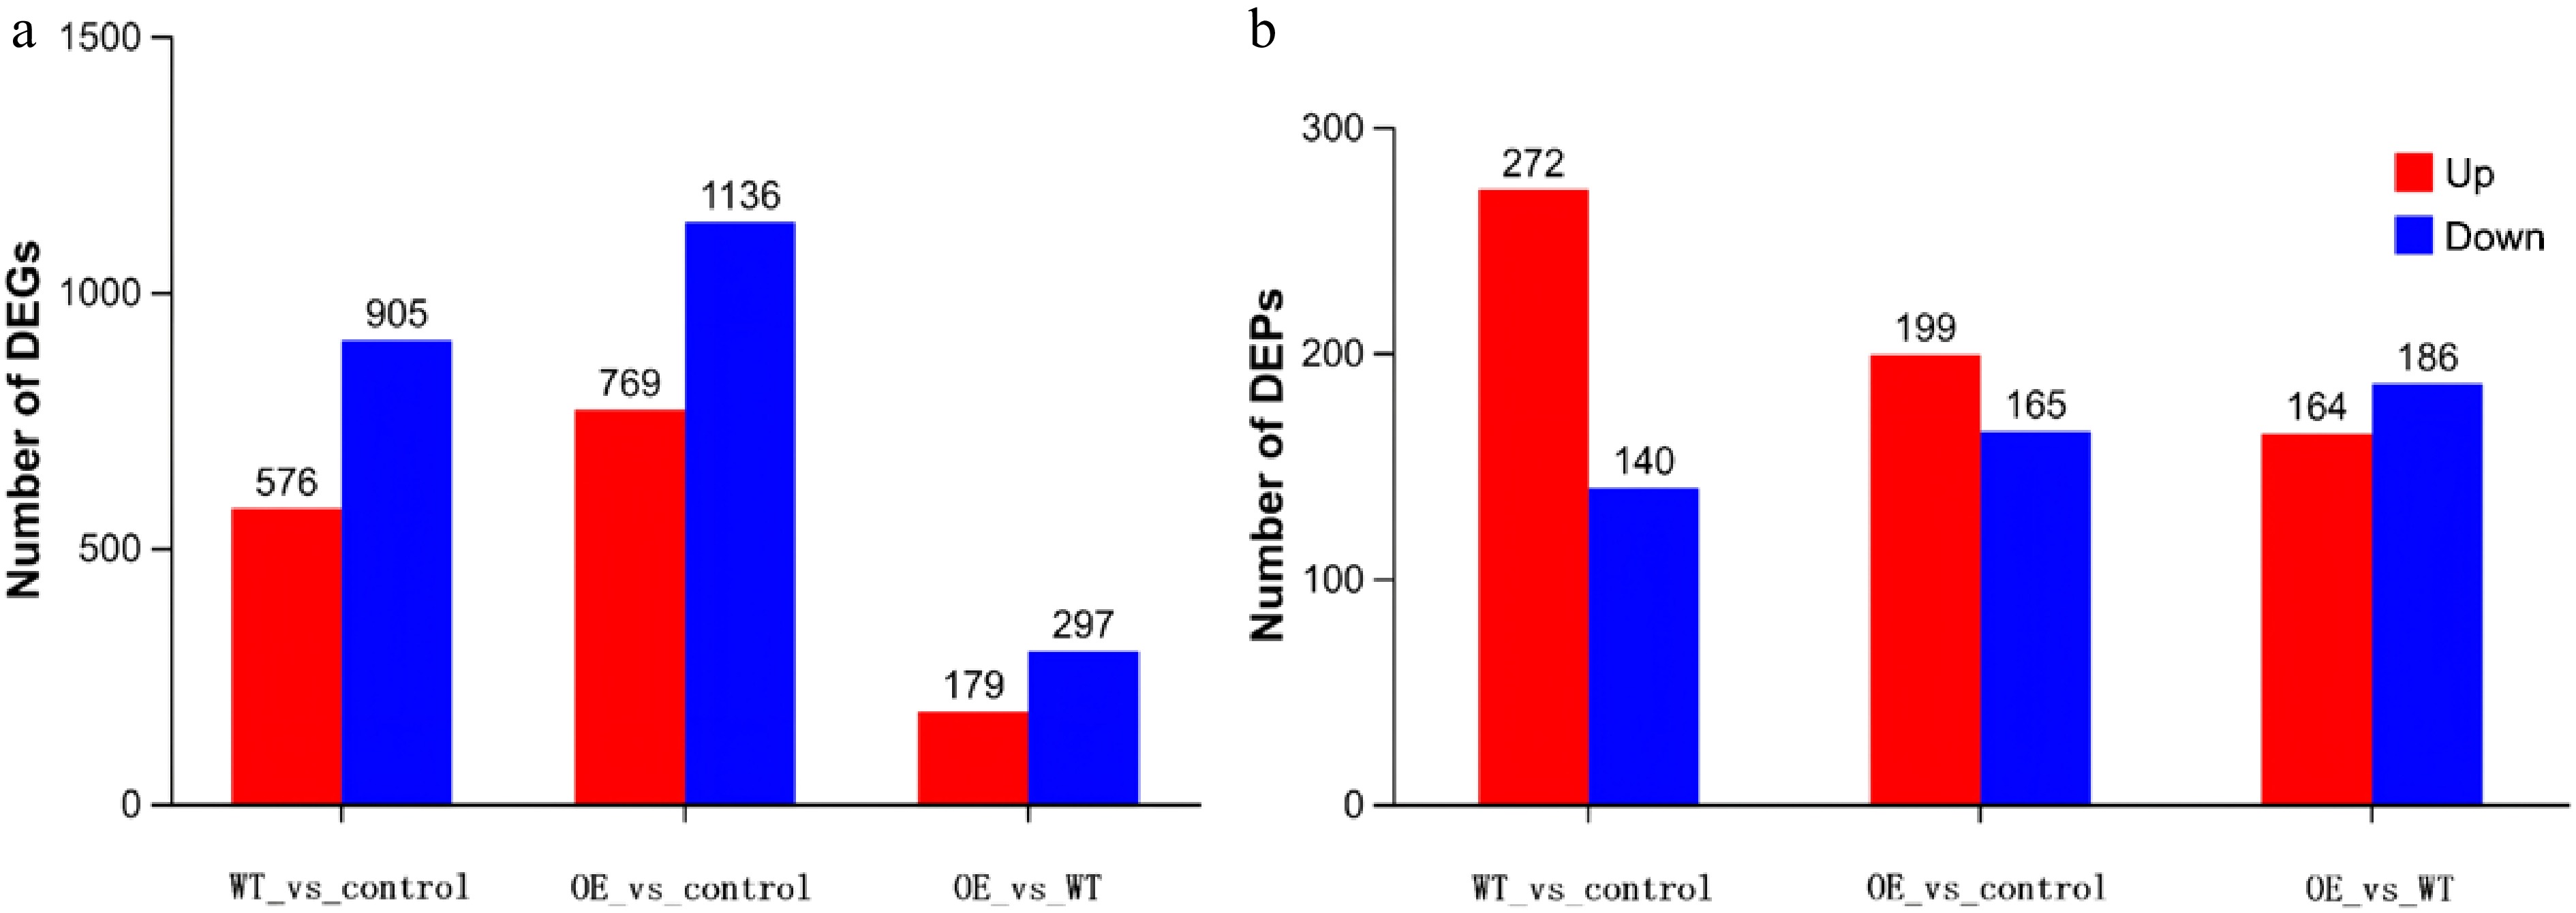
Figure 6.
Statistics of differential proteins and genes. Note: The horizontal coordinate is each difference comparison group. By default, red represents the upregulated gene and protein in the difference comparison group, and blue represents the downregulated gene and protein. Among them, WT represents the wild-type strain group, and OE represents the overexpressed strain group.
-
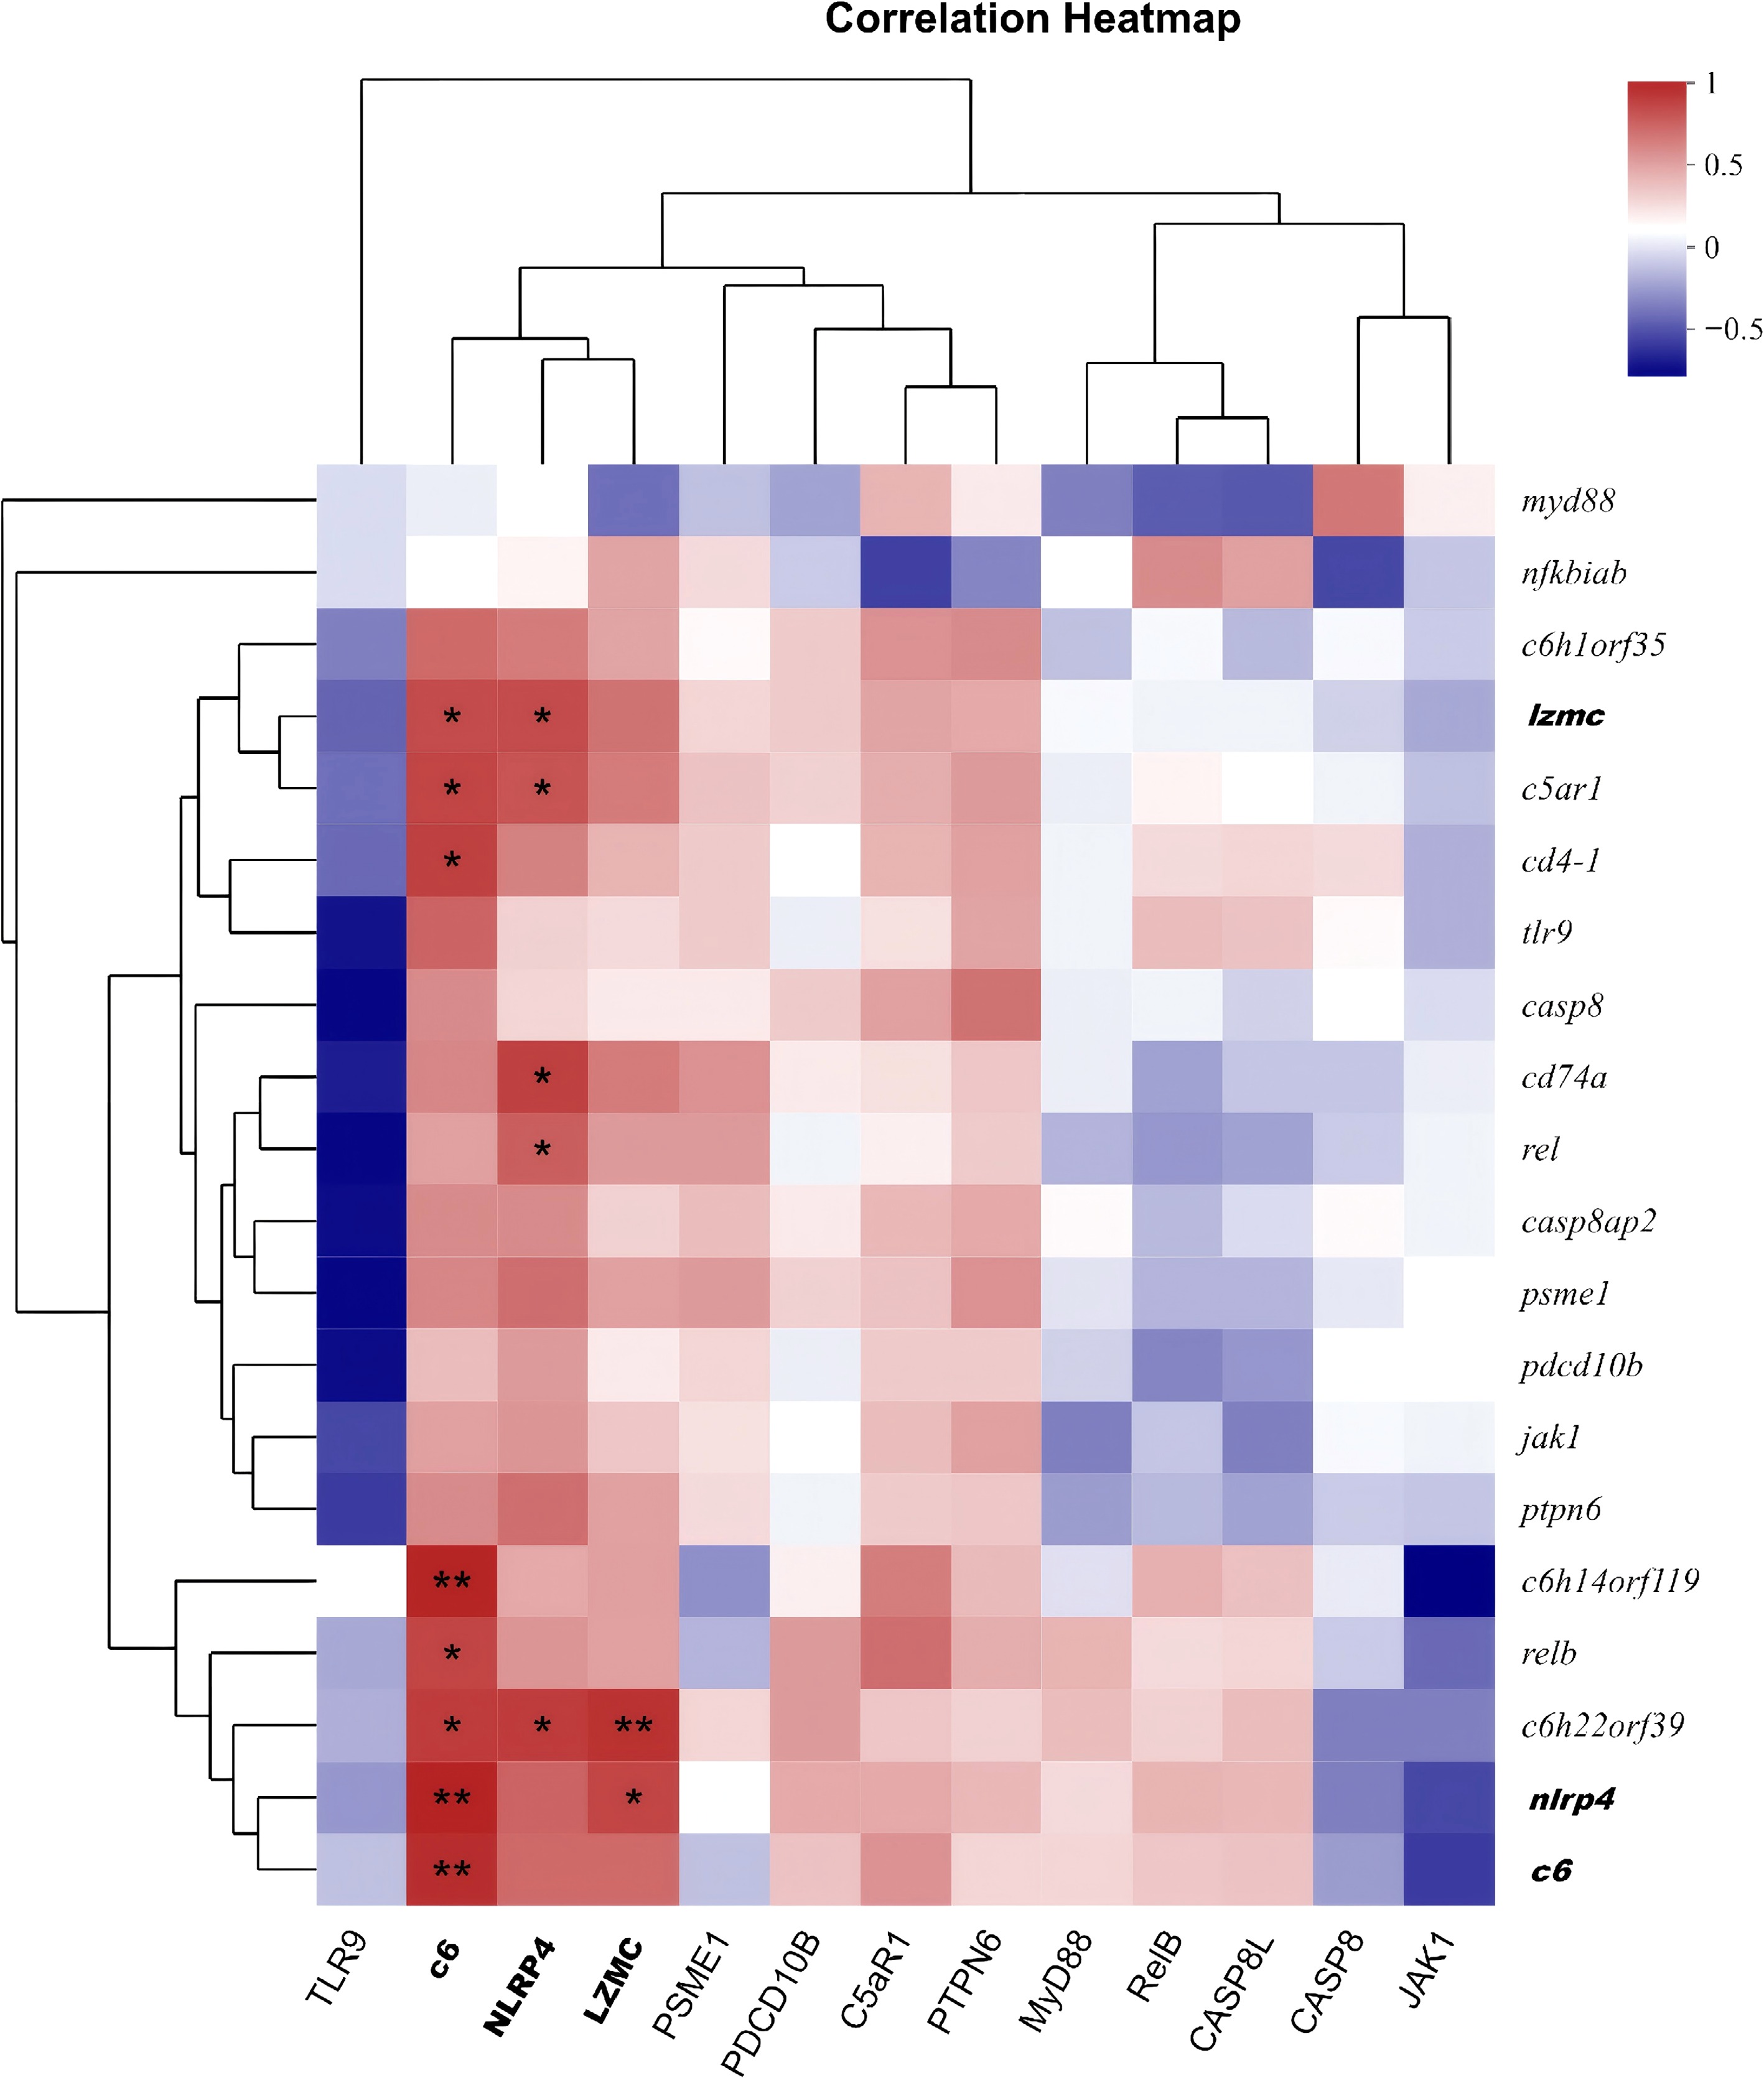
Figure 7.
Spearman correlation heatmap. Spearman correlation heatmap of immune-related molecules between the WT and OE groups. The color gradient from blue to red represents the Spearman correlation coefficient (ρ) ranging from –1 to 1; red indicates positive correlation, white indicates no correlation, and blue indicates negative correlation. The X-axis denotes proteins, and the Y-axis denotes genes. Only significant correlations (p < 0.05) are shown. Data are from three biological replicates per group.
-
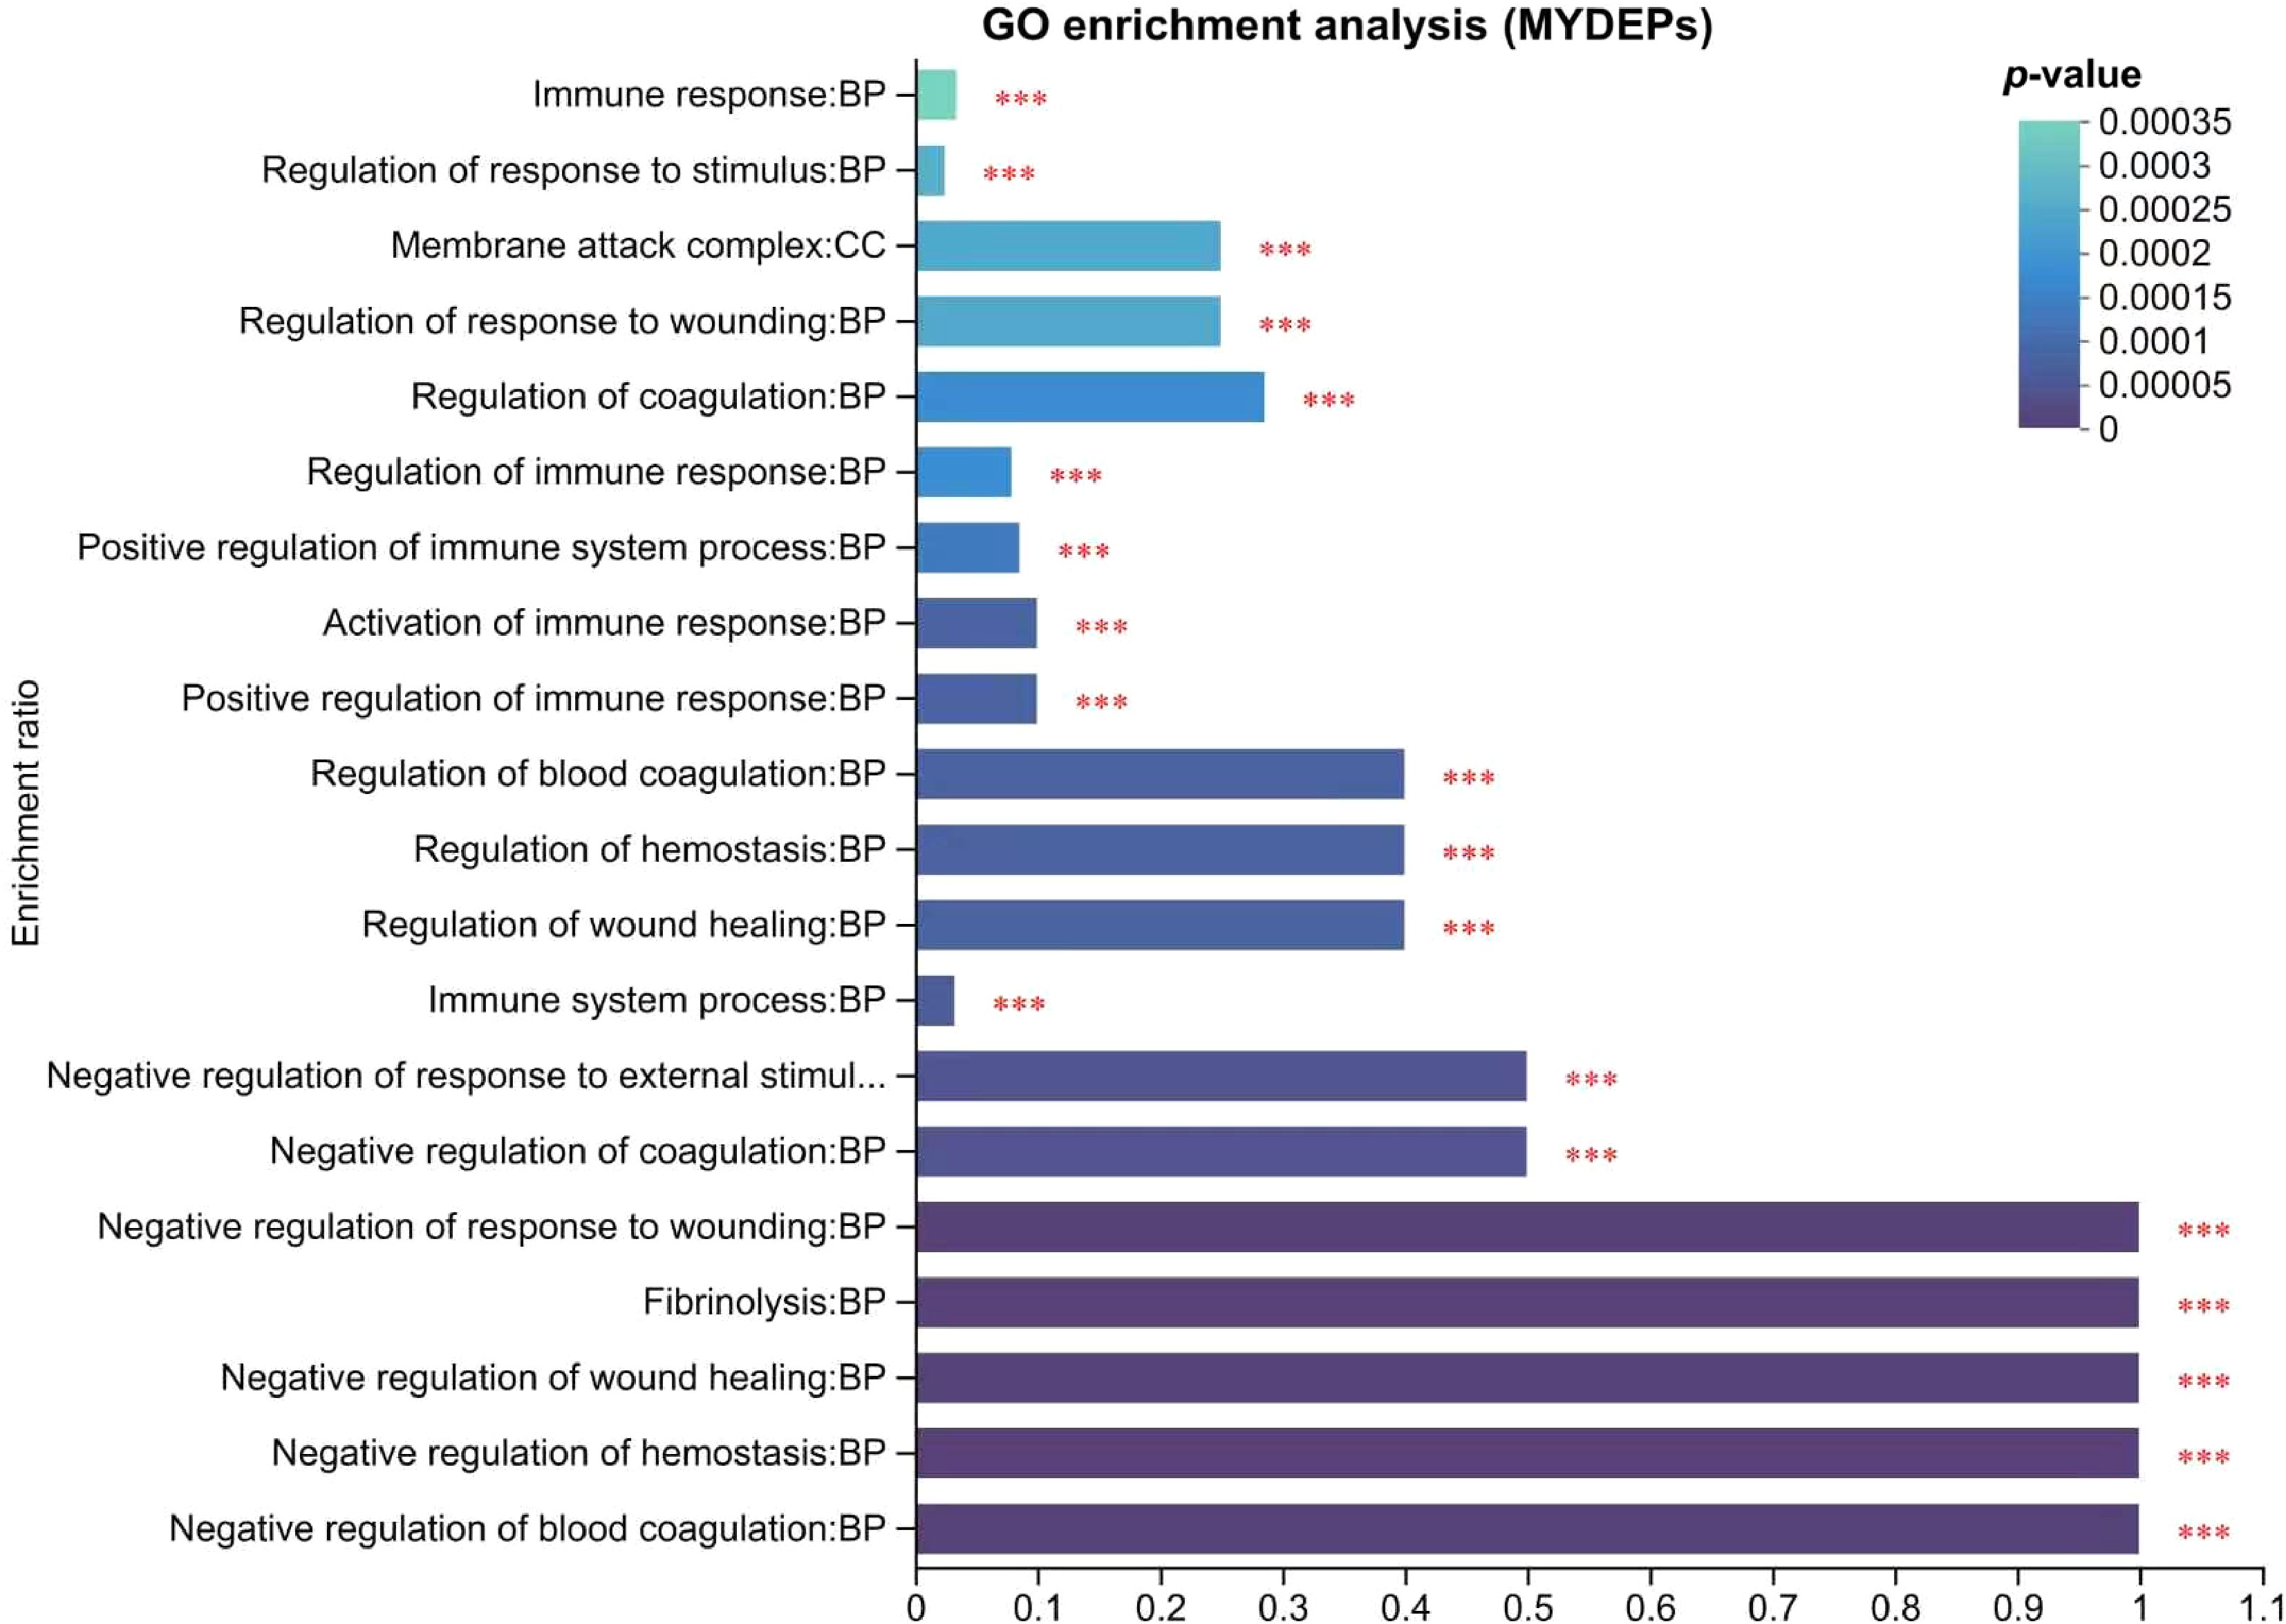
Figure 8.
Analysis of immune-related DEPs GO. Note: The abscissa represents the GO term, and the ordinate represents the enrichment rate (refers to the ratio of the number of proteins enriched in the GO term to the number of proteins annotated to the GO term; the greater the ratio, the greater the degree of enrichment). The column color gradient indicates the significance of enrichment, with p or FDR < 0.001 marked as ***, p or FDR < 0.01 marked as **, and p or FDR < 0.05 marked as *.
-
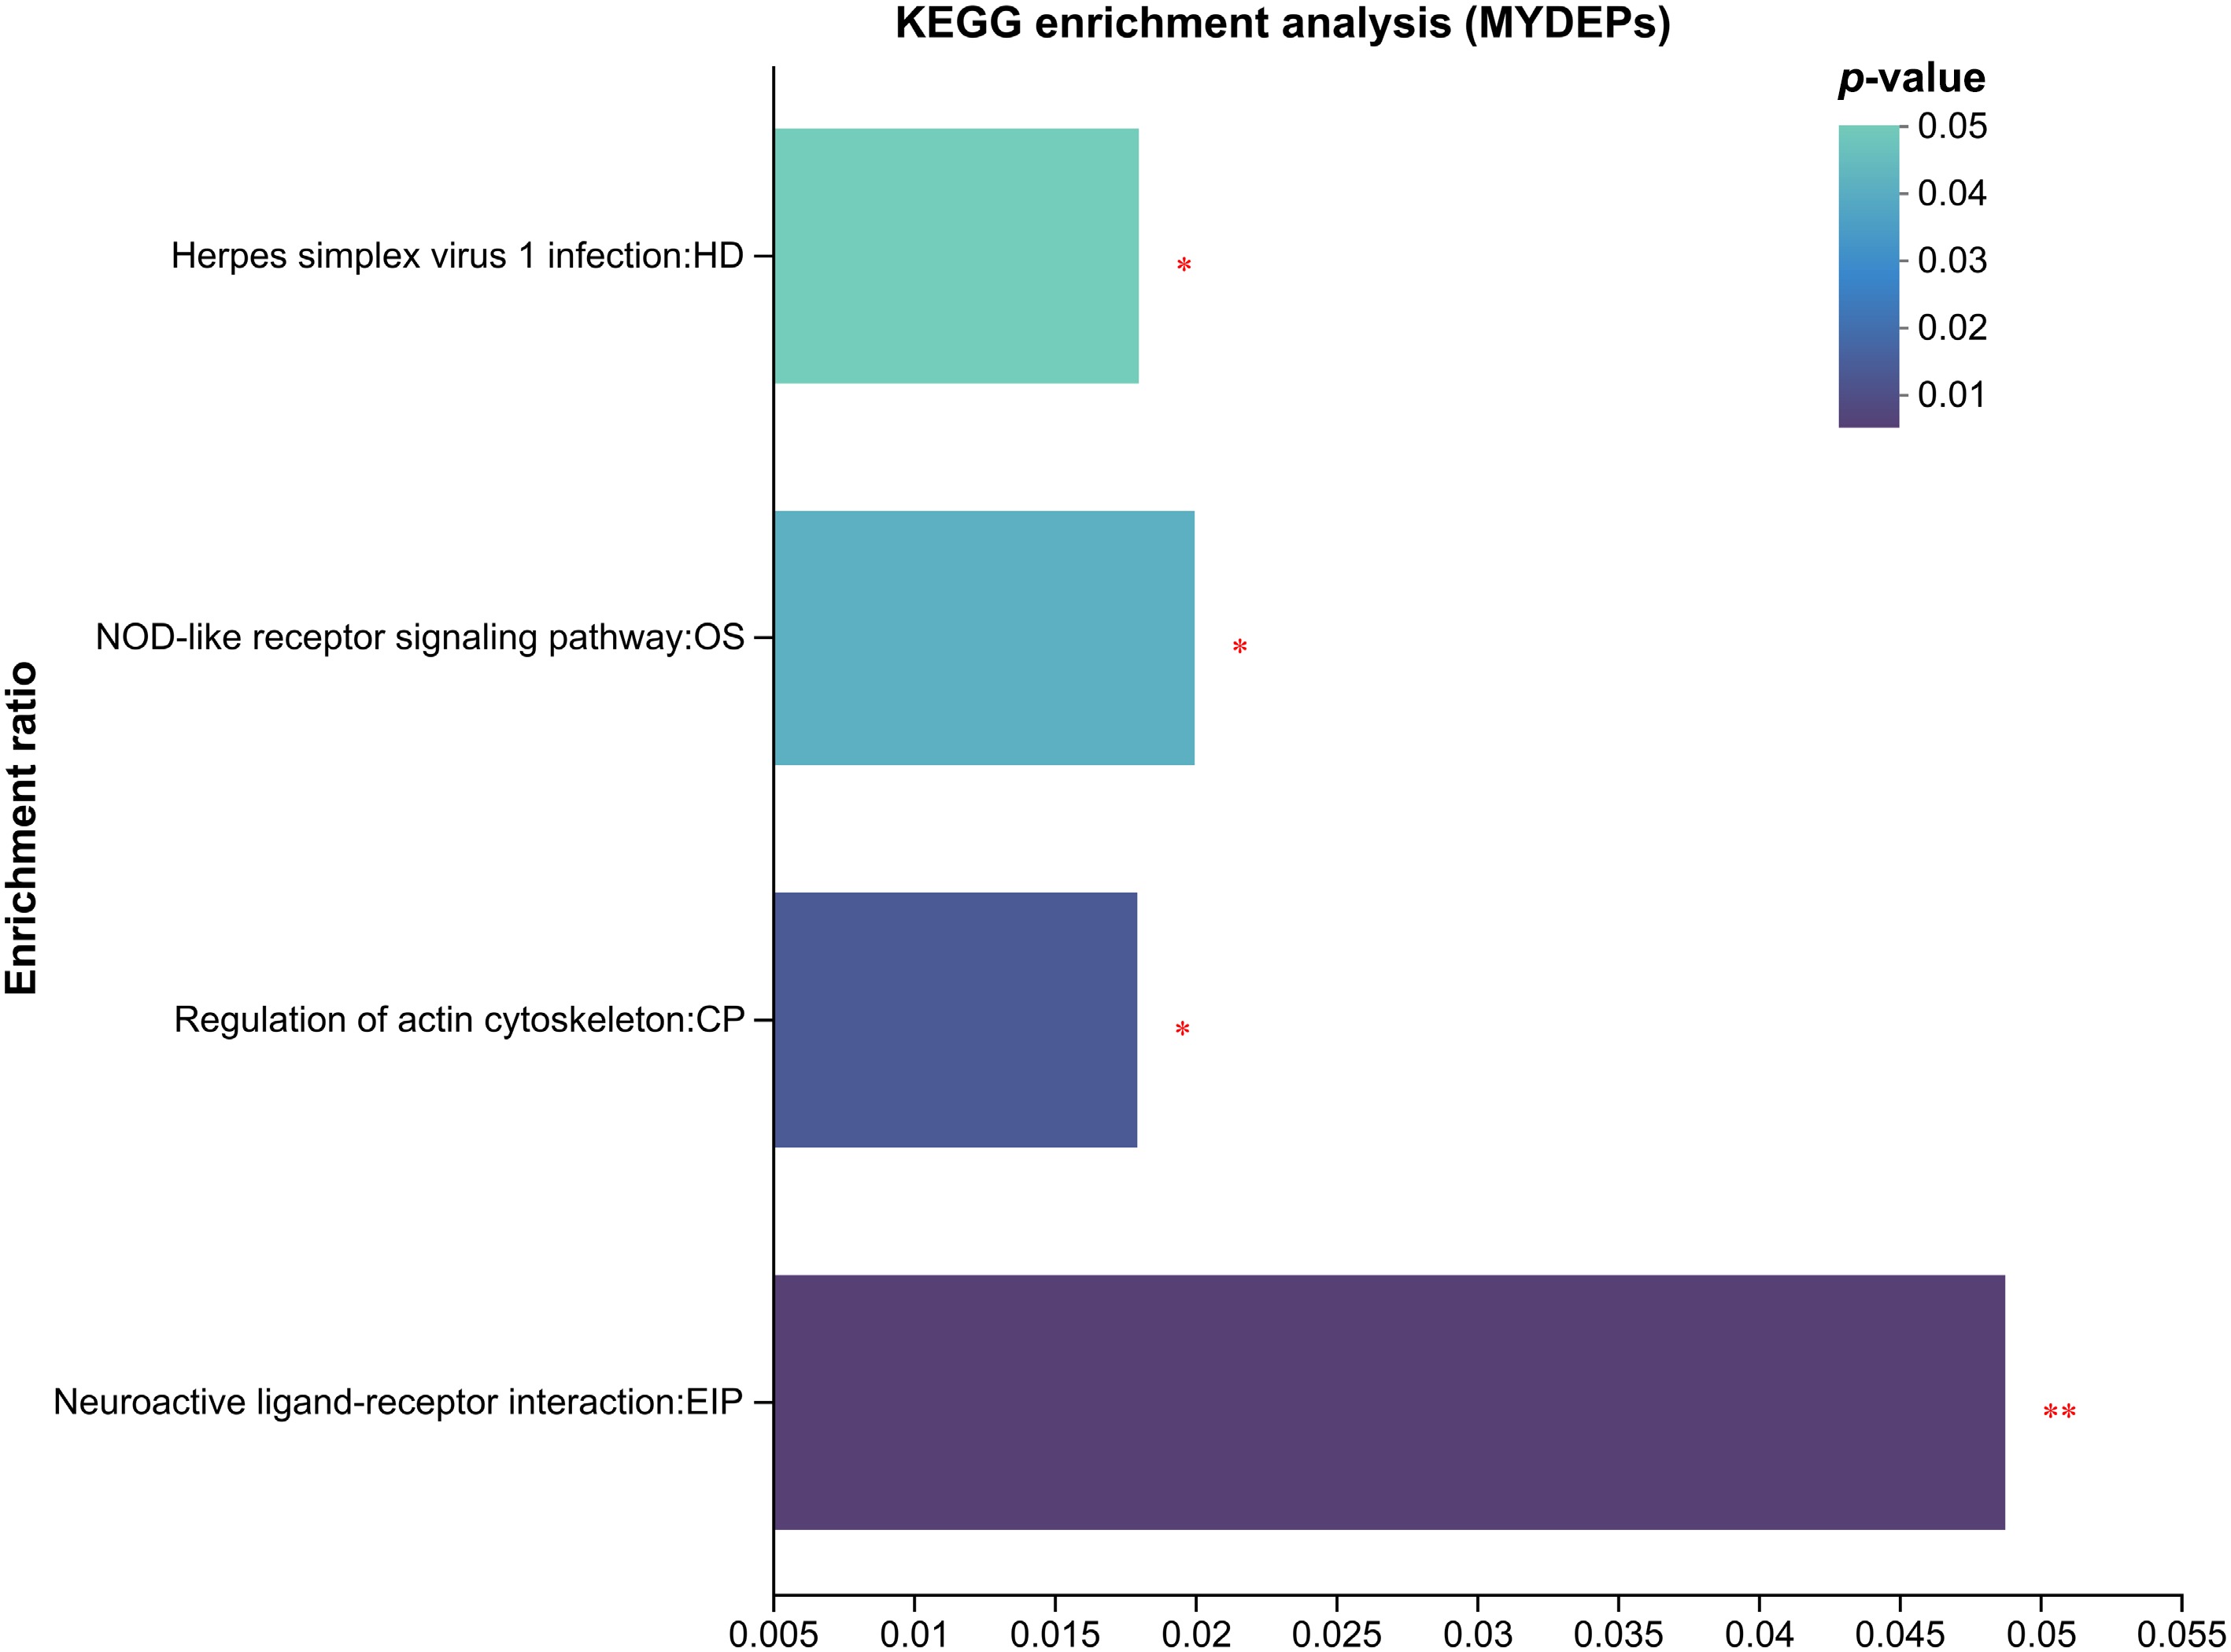
Figure 9.
Enrichment analysis of immune-related DEPs in KEGG. The abscissa represents the pathway name, and the ordinate represents the enrichment rate (refers to the ratio of the number of proteins enriched in the pathway to the number of proteins annotated to the pathway; the larger the ratio, the greater the enrichment). The column color gradient indicates the significance of the enrichment, and the darker the default color, the more significant the enrichment of the KEGG term, where p or FDR < 0.01 is marked as **, and p or FDR < 0.05 is marked as *.
-
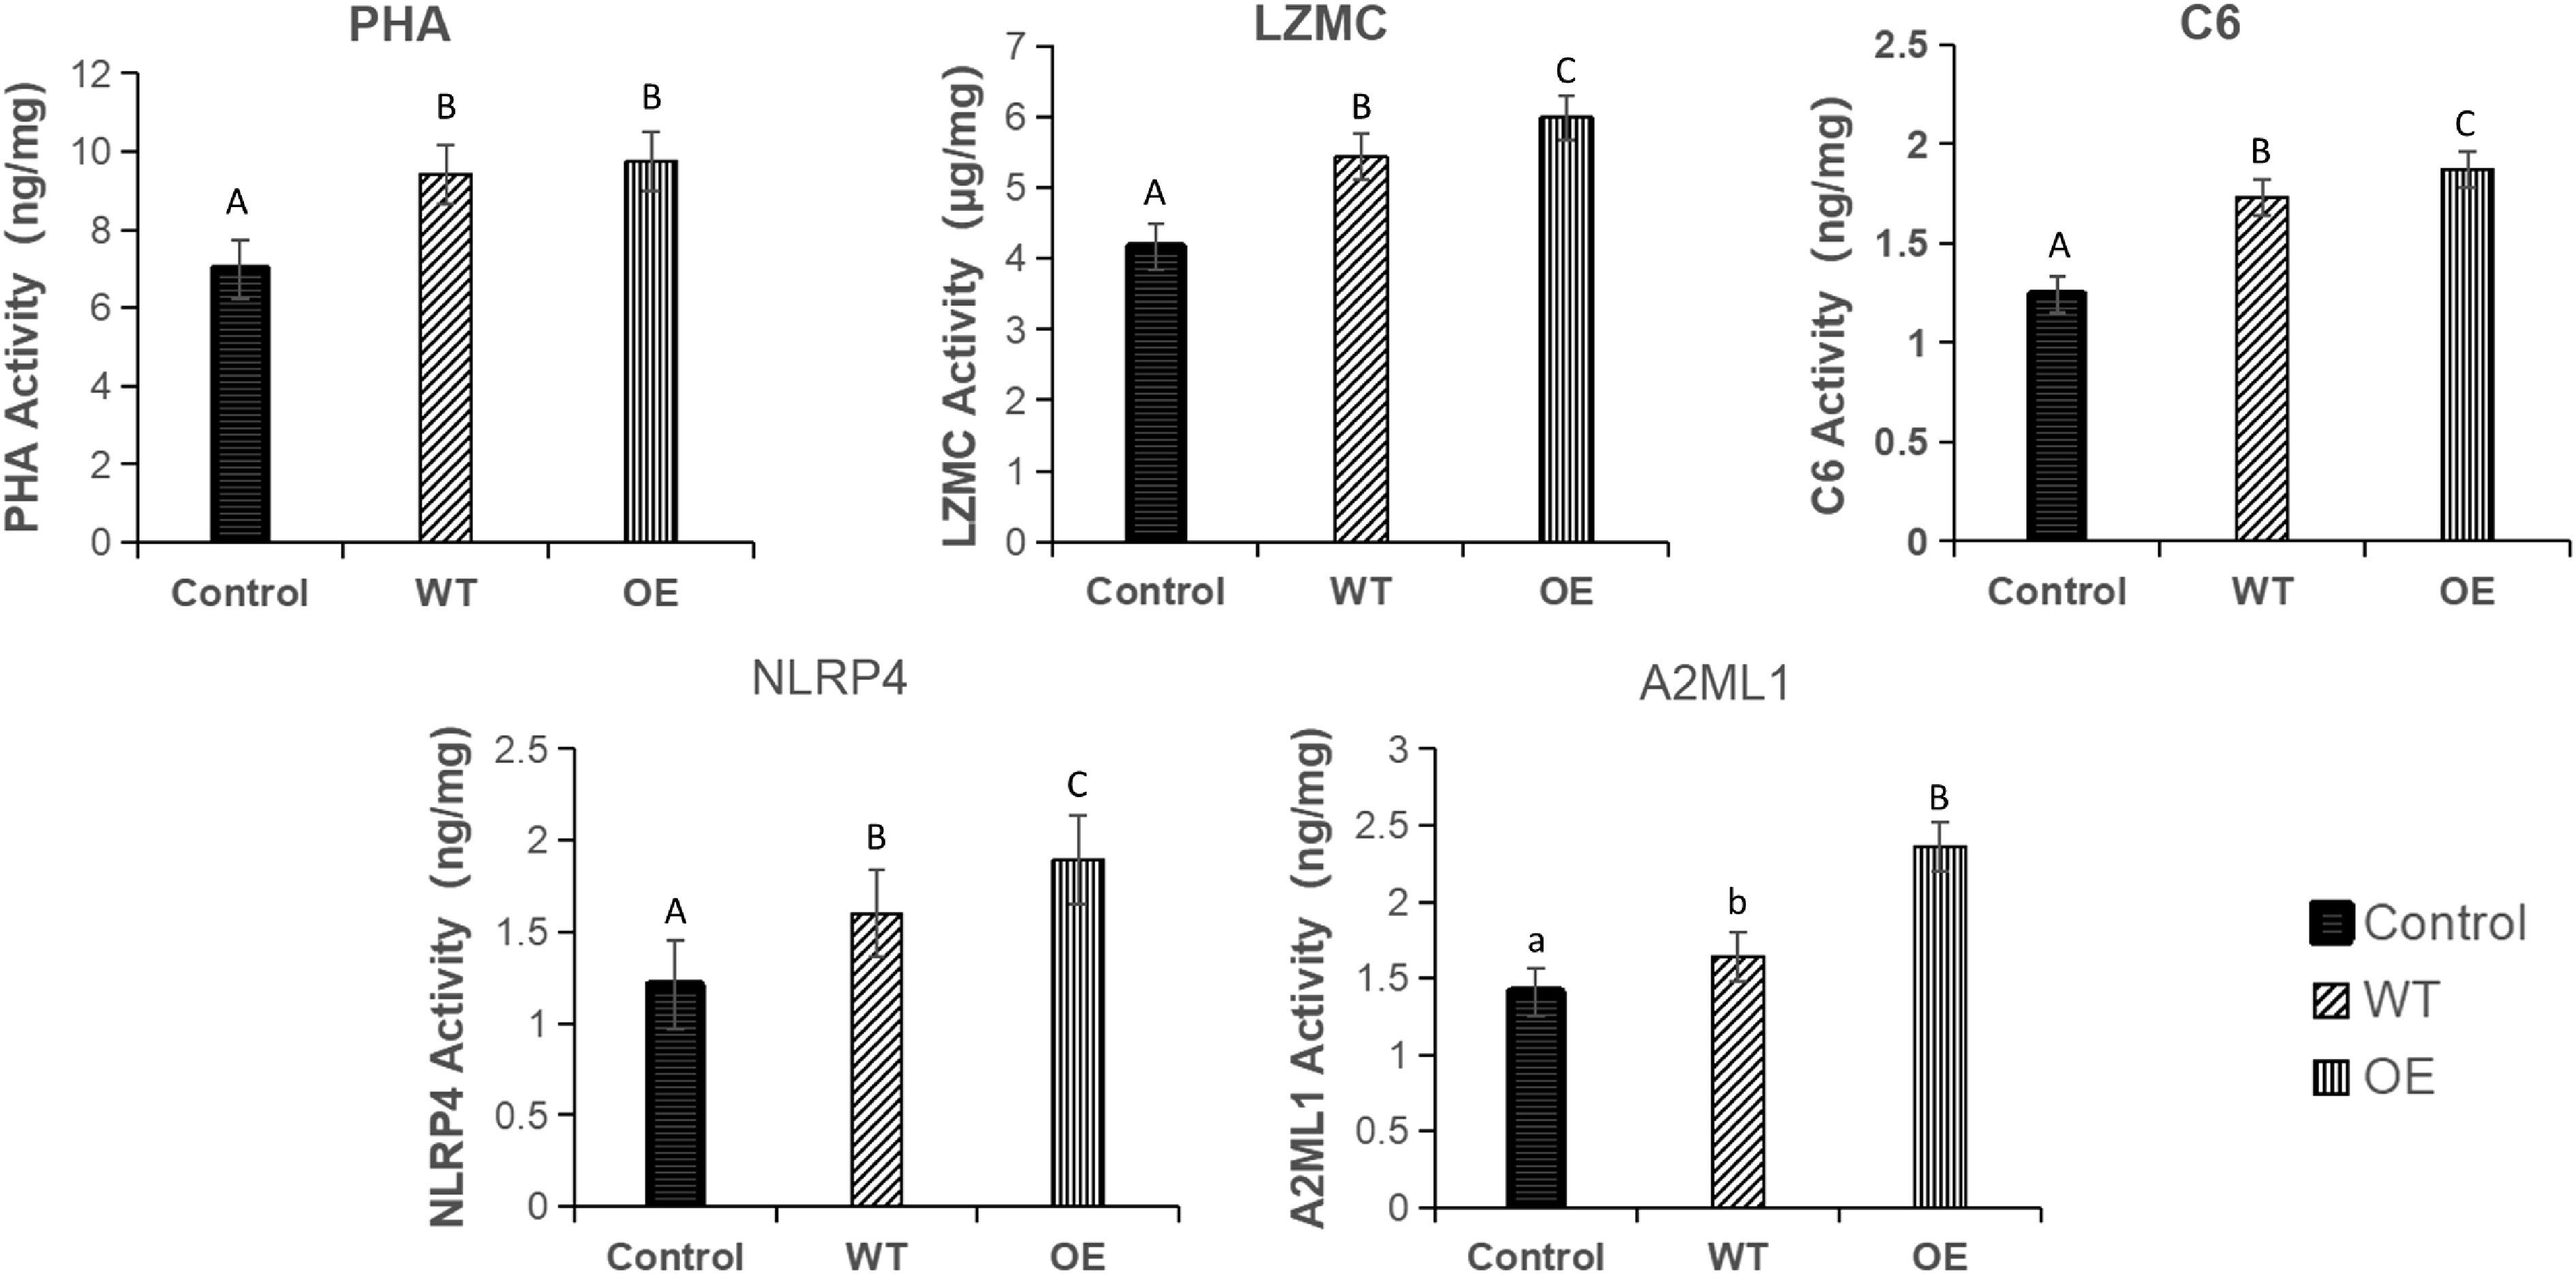
Figure 10.
Contents of PHA, LZMC, C6, NLRP4, and A2ML1 in the head kidney of Silurus meridionalis. There was no significant difference among groups represented by the same letter, while there were statistical differences at corresponding levels among groups represented by different letters. Among them, WT represents the wild strain group, and OE represents the overexpressed strain group.
-
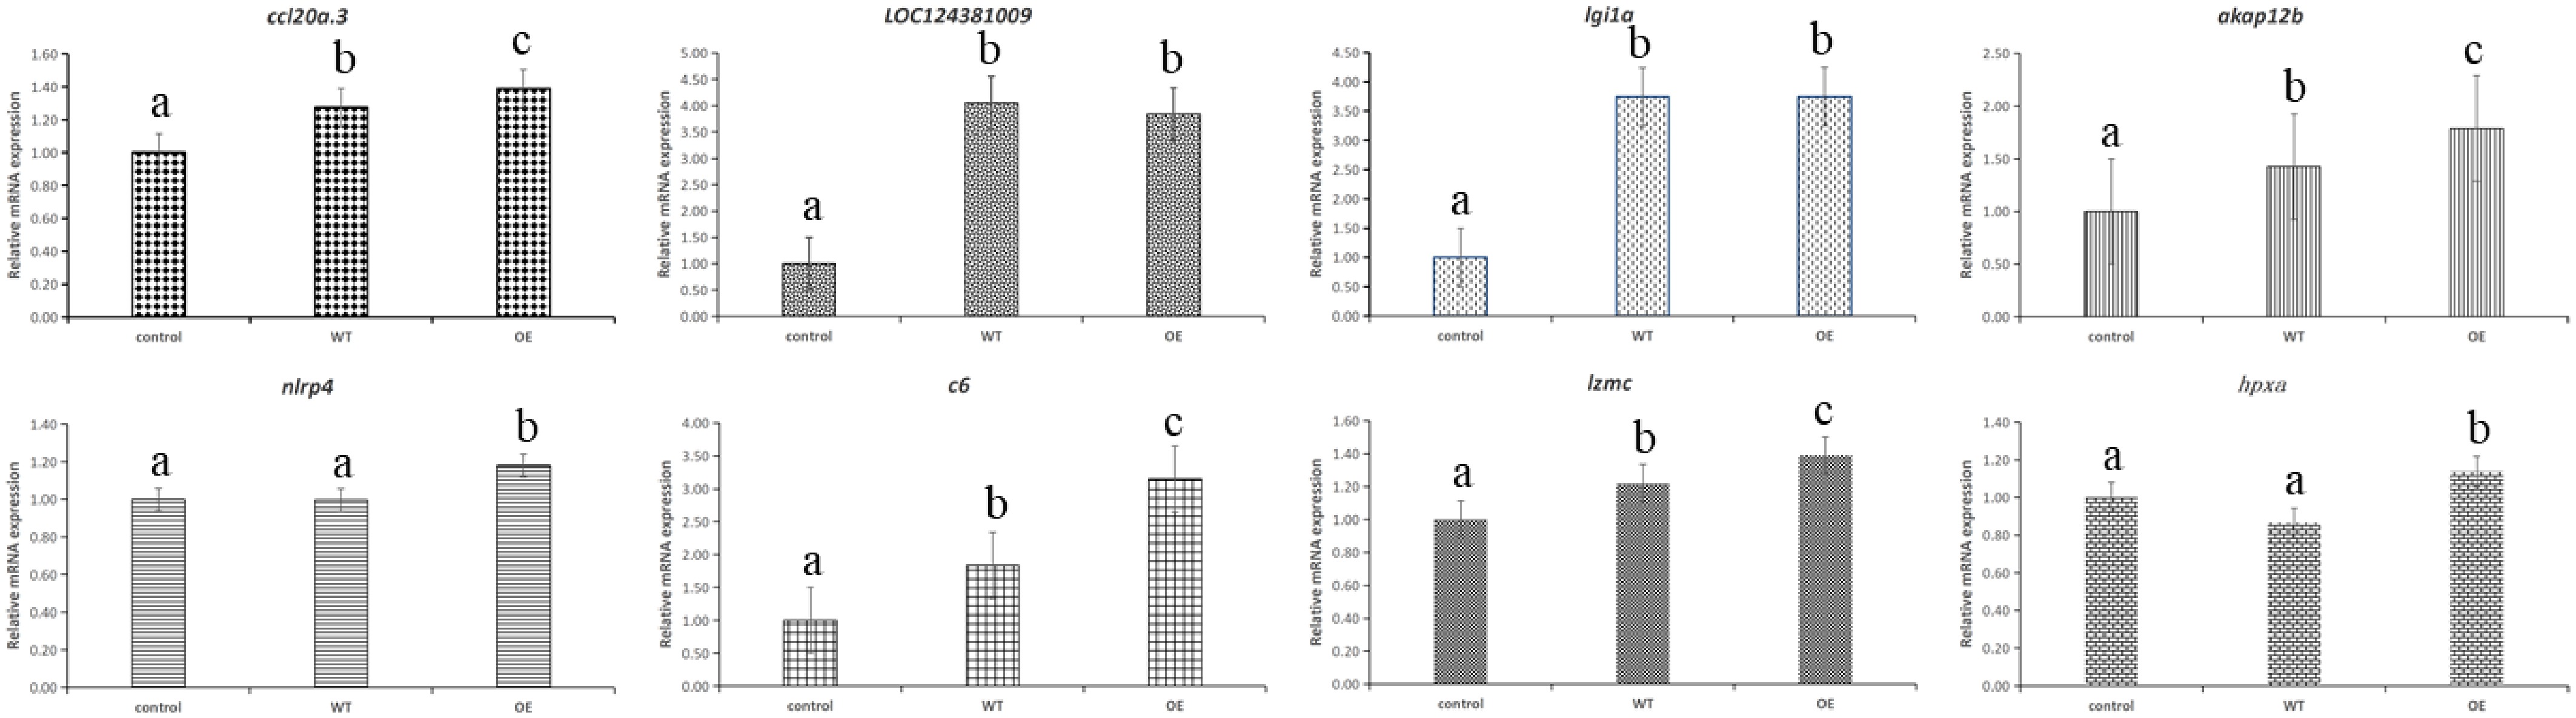
Figure 11.
Verification results of eight DEGs qRT-PCR.
-
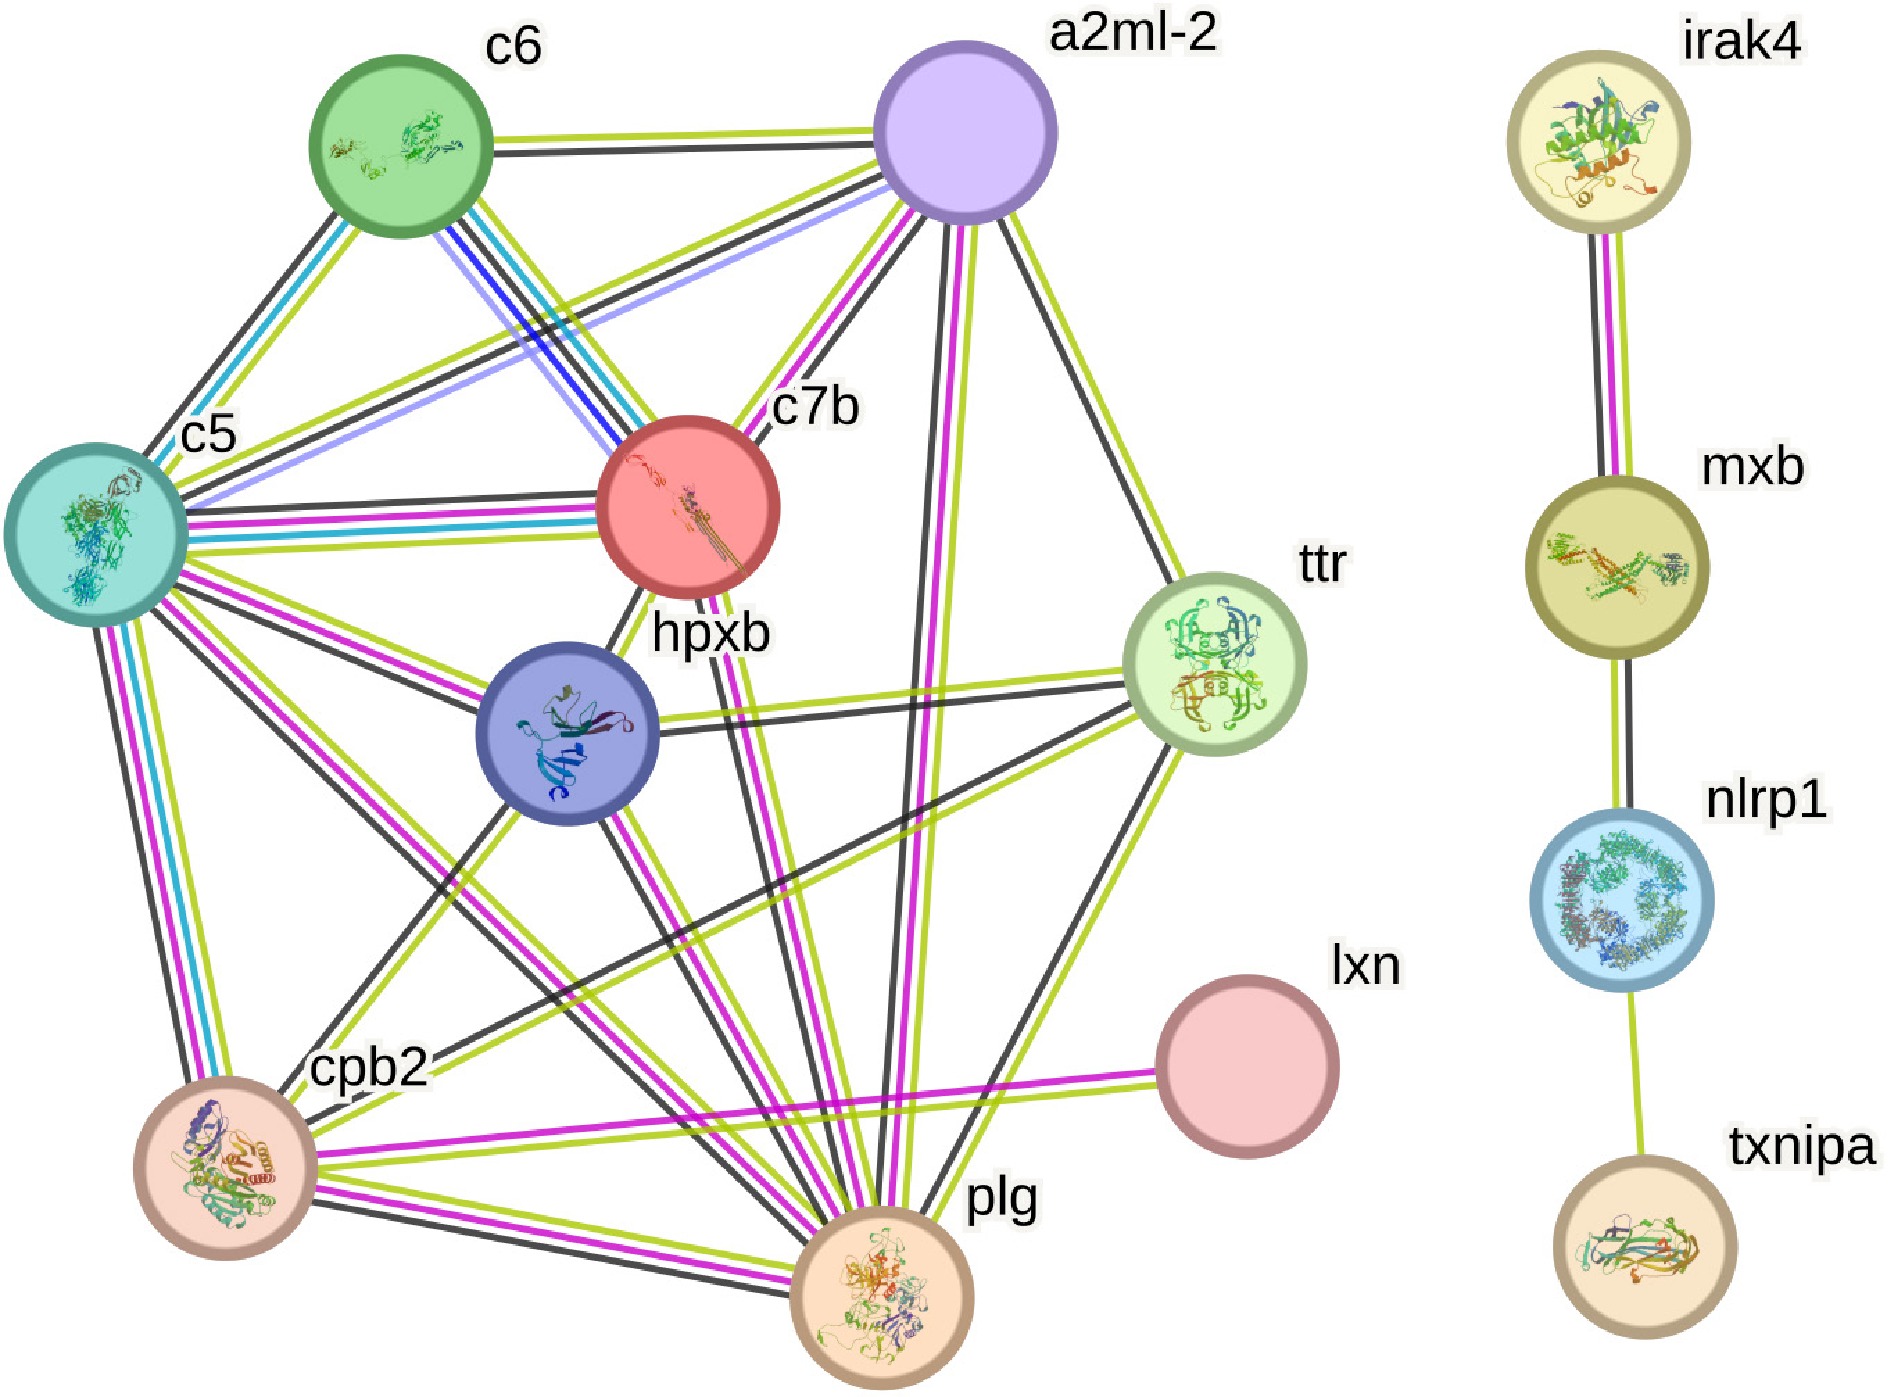
Figure 12.
Network diagram of immune-related differential protein interaction between the WT (wild) group and the OE (overexpression) group.
-
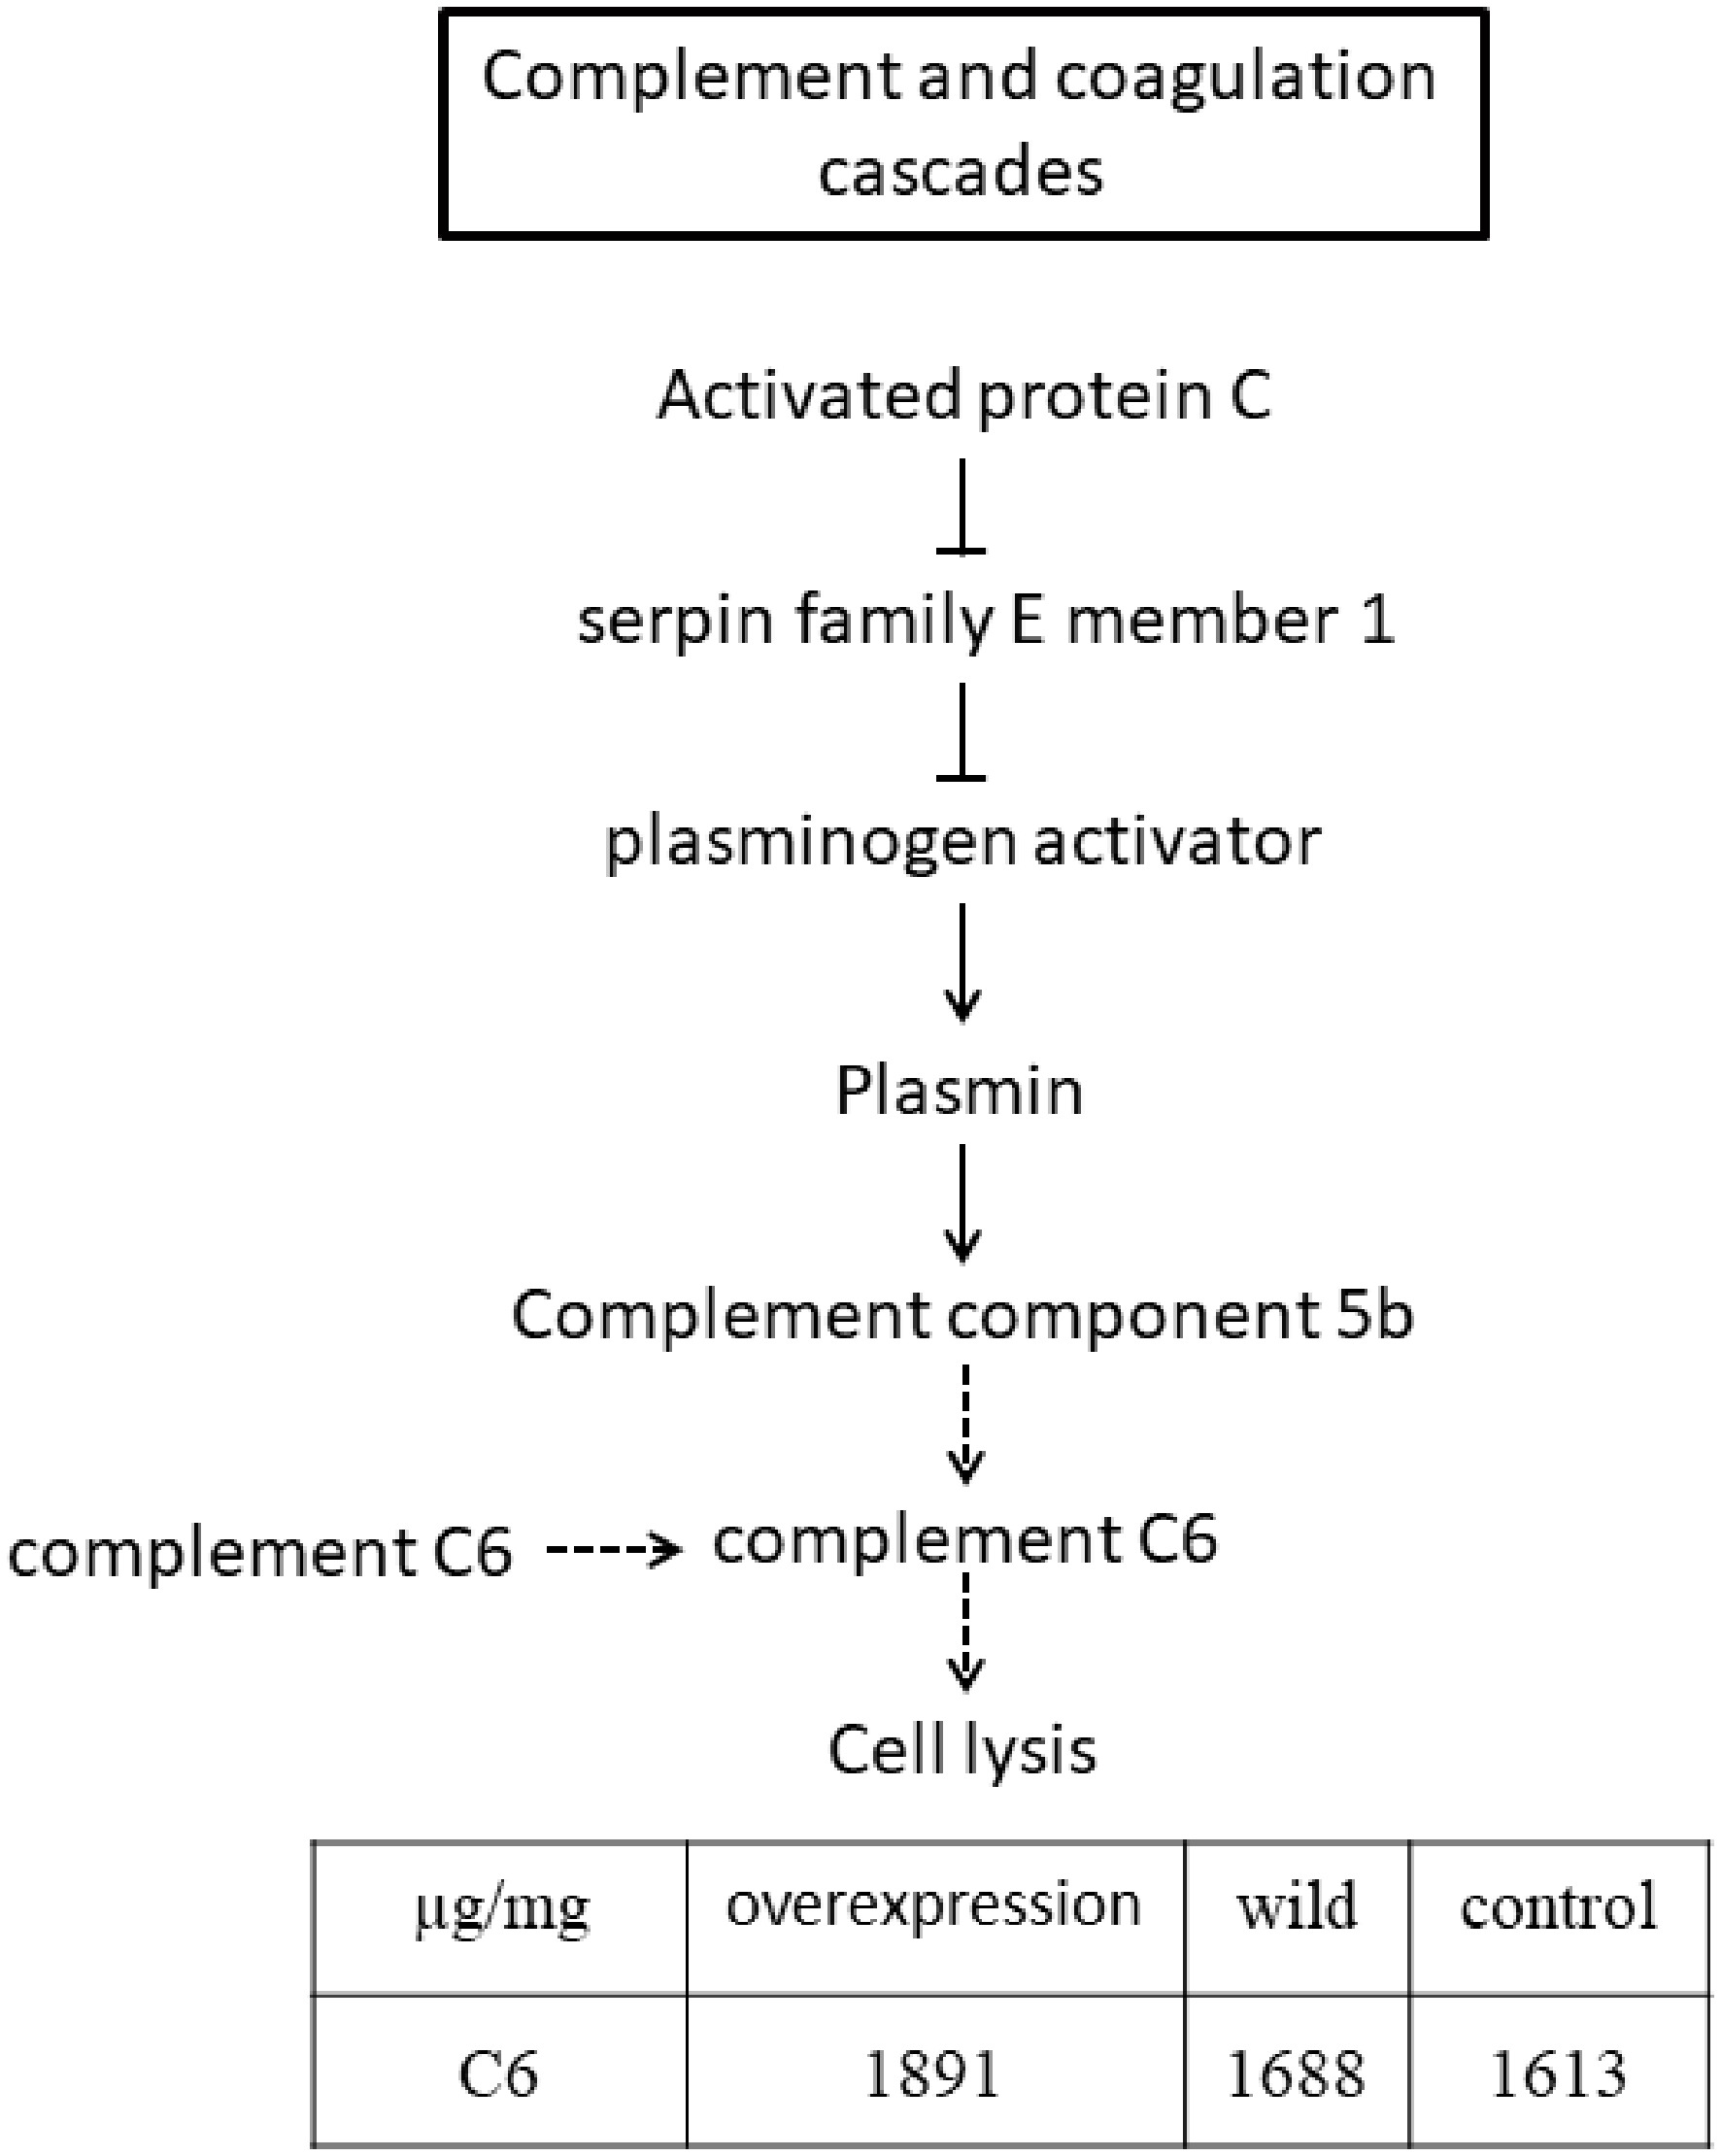
Figure 13.
Simplified complement and coagulation cascade pathway.
-
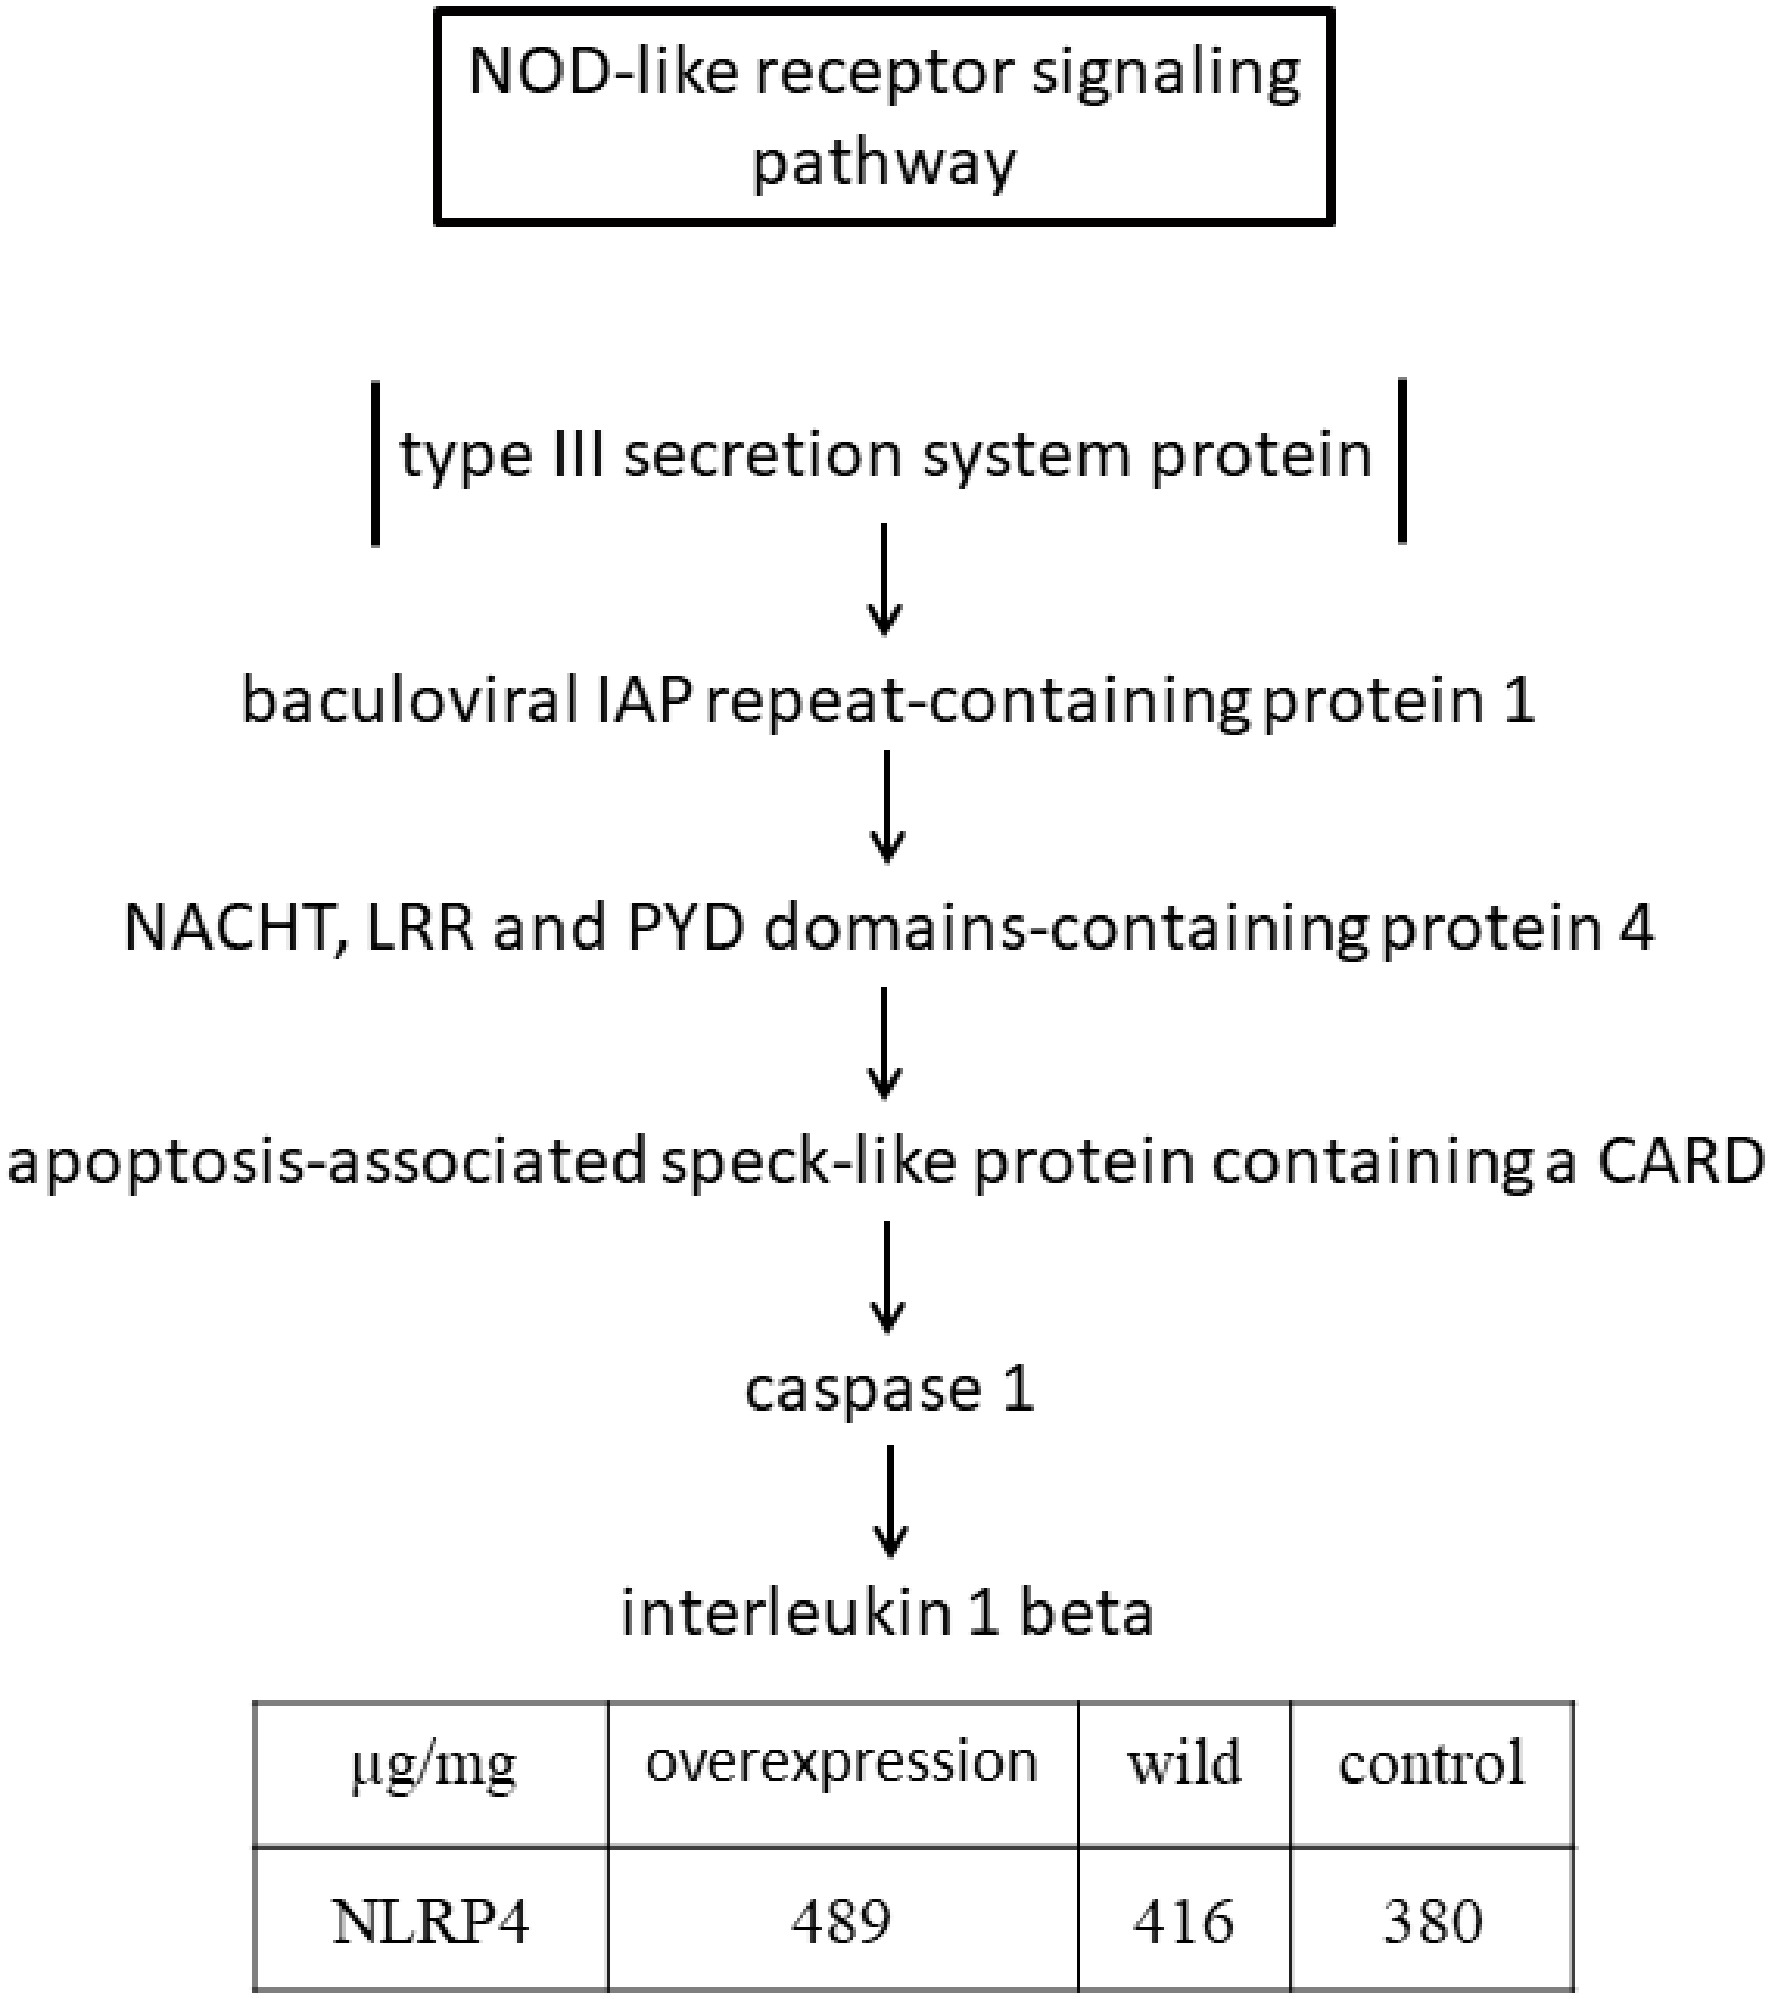
Figure 14.
Simplified diagram of the NOD-like receptor signaling pathway.
-
Primer name Sequence information lipa-F CCTGATAATCACAACTTTATGAGTAAACCTATTCAGATTG lipa-his-R TGGTGGTGGTGGTGGTGTTTAACTTCTTCGCCTTTGGCCT puc19-his-F CACCACCACCACCACTAAGGCGTAATCATGGTCATAGCTG 19-lipa-P-R TGAATAGGTTTACTCATAAAGTTGTGATTATCAGGTGCAT lipa-pBBR-F CACCACCACCACCACCACTAACTCGAGATCGATACCGTC
GACAGpBBR-his-F TACGATATCGATGGCACCACCGGTTTATTGACTACCGGAA ACTB-S CCAGCACTCCCACTTCACTTT ACTB-A GCTTTAGATTTTGGGTTTGTCG ccl20a.3-S GCAACAATAAATTCCAGACATGACC ccl20a.3-A ACACCAGACTTTATACCTCCCATGA LOC124381009-S TGAGGACGCCATTTCCACTG LOC124381009-A CAATTACAGAGTTGTGTGCTGATGC lgi1a-S GTGAAGACTCGTTTGGCAGCA lgi1a-A GAATGGAGGACGGTGCAATAA akap12b-S GGTCACCACAGAAAGCGAAGA akap12b-A GCTGGCTTTCCTCCTCAACA nlrp4-S CAACACATGAATTATCTCCATCTGC nlrp4-A ACAGCAGAACTTTACCTGGTTACTT c6-S AGACTGGAACCTTCGGAGACA c6-A CTCGCATCACAAACACTCCA lzmc-S TCAACCGAAACACTGATGGATCT lzmc-A GTGAGATGTTATCGGAAAGAAGTGC hpxa-S CATACCCATTCTGAGGCAAAACC hpxa-A ACAGCCGAGCAGTTCTTTGG Table 1.
Primer information.
Figures
(14)
Tables
(1)