-
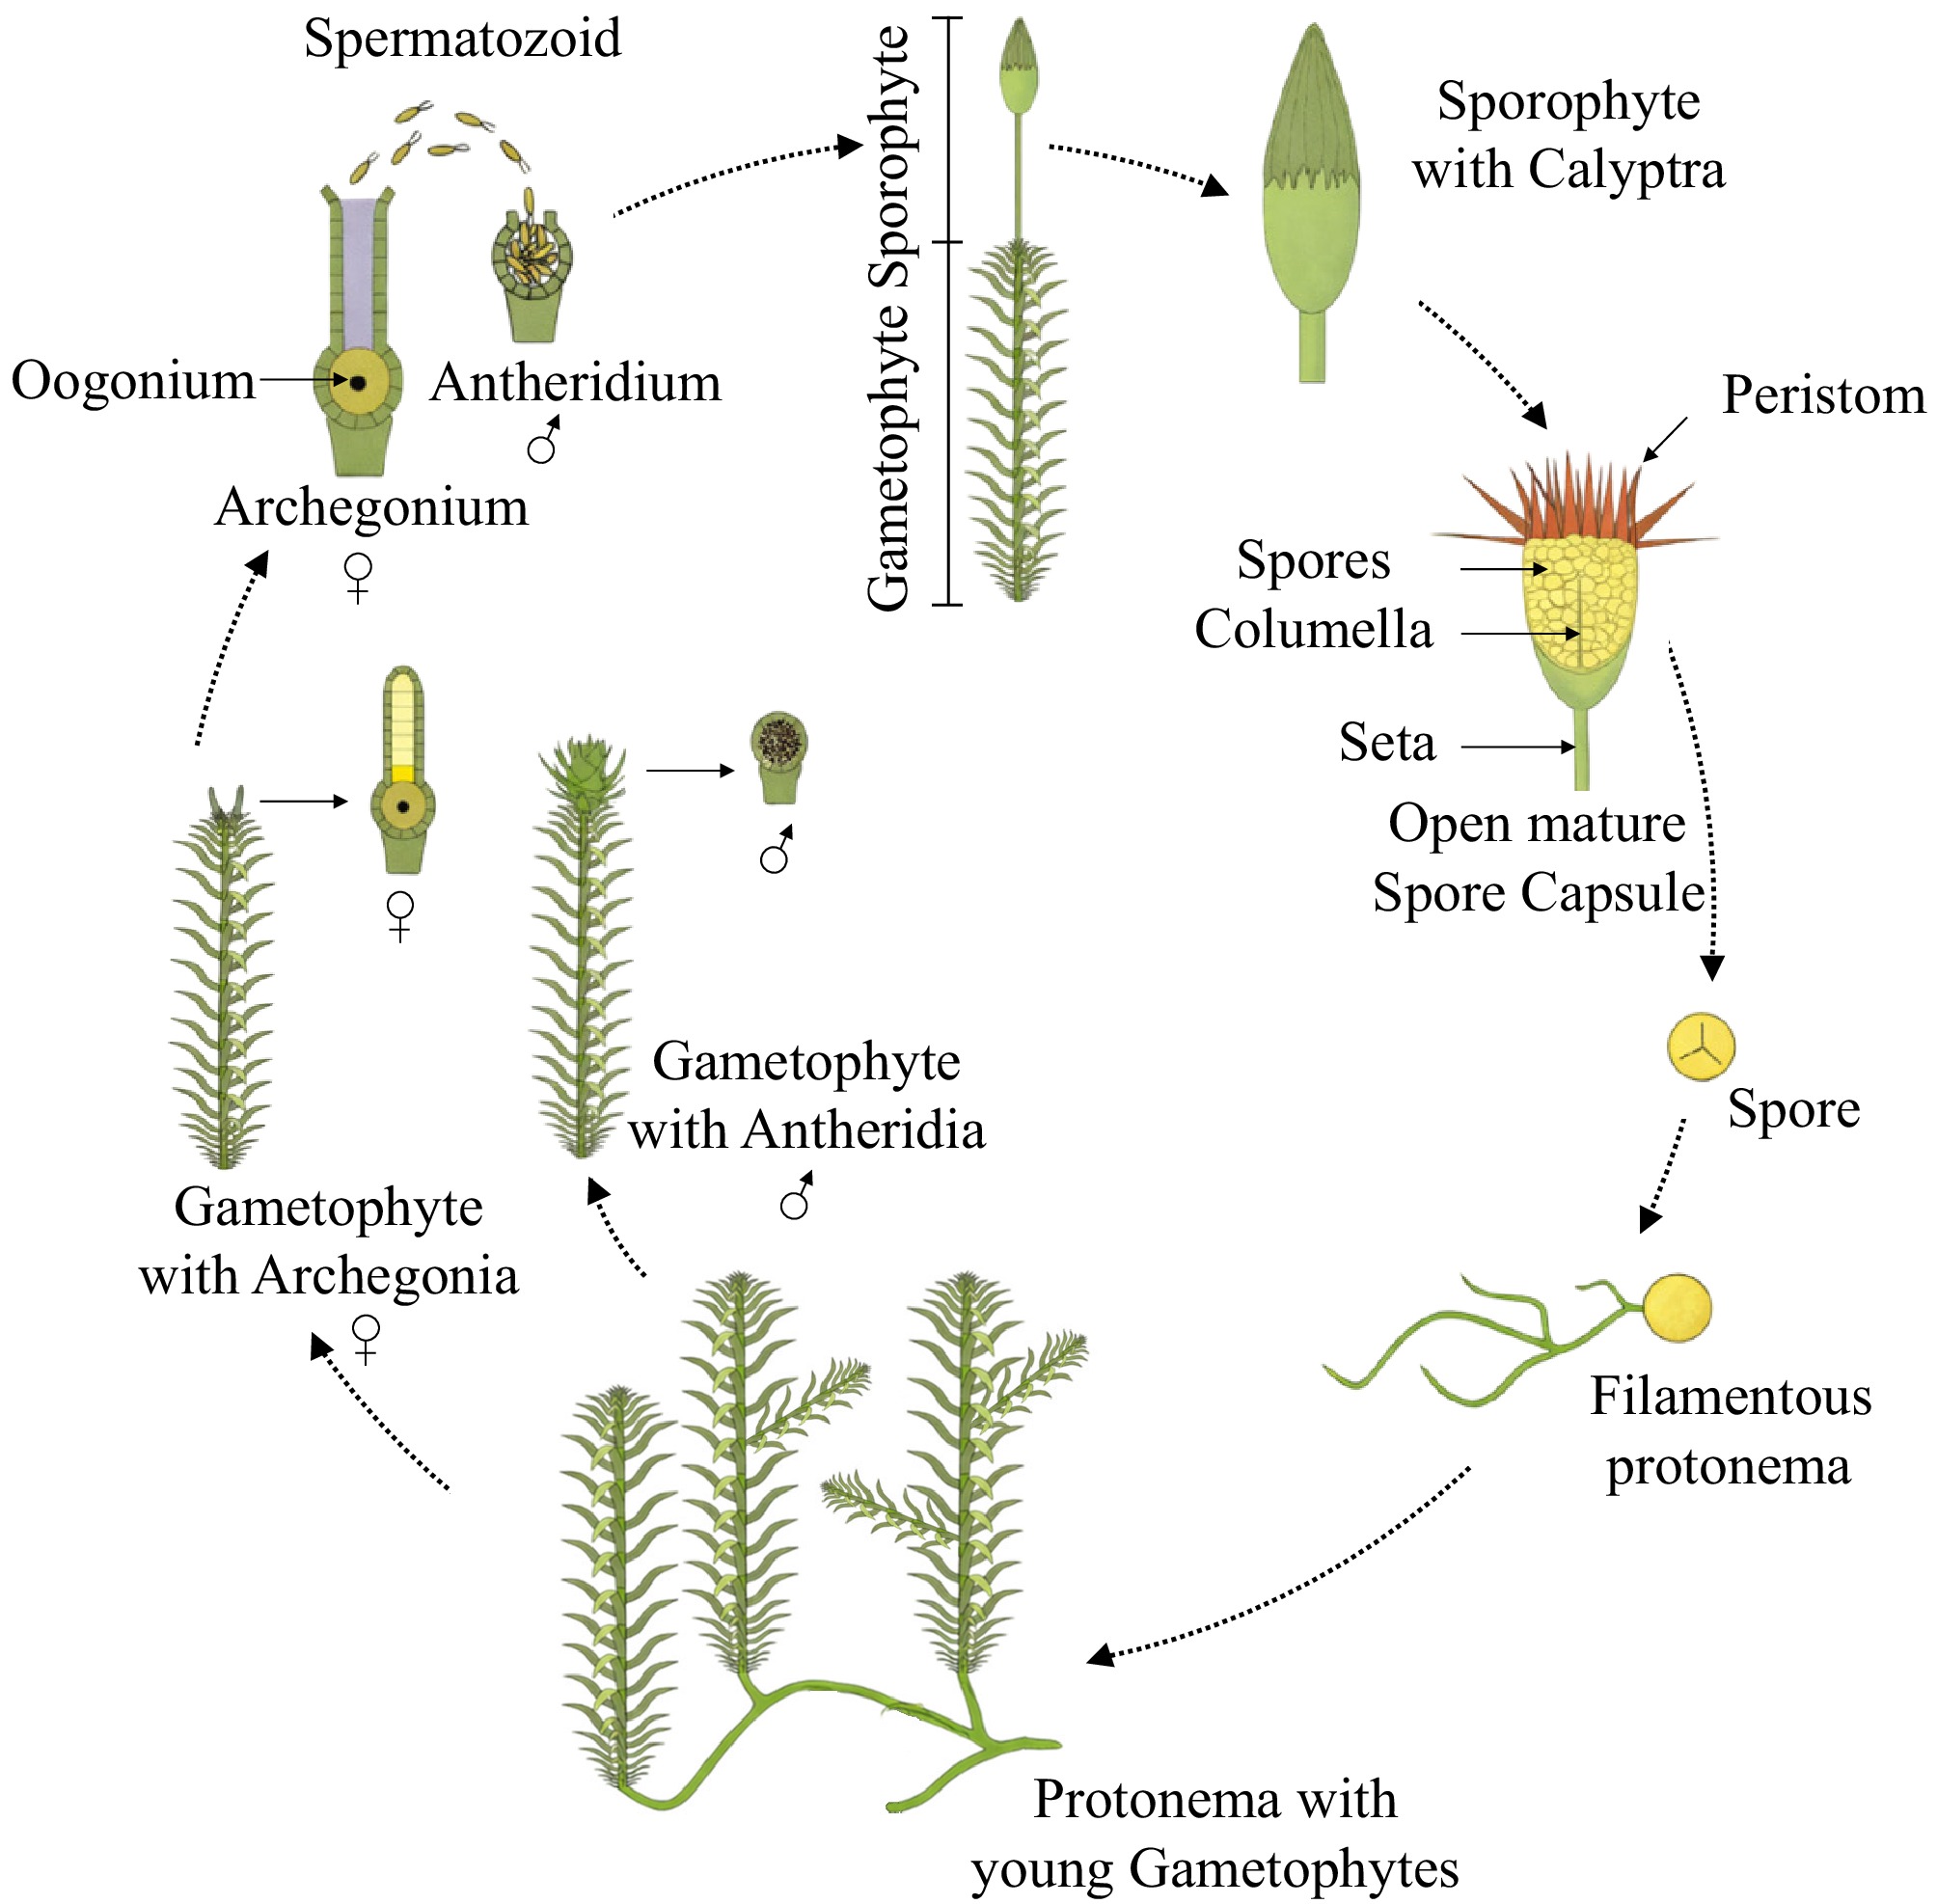
Figure 1.
Generation cycle in peat moss; in photobioreactors, filamentous protonema and protonema with young gametophytes may occur, which are investigated here. The gametophytes carry small leaves and can develop side branches. The sprouting points at the ends are called capitula. Simplified tracing according to Dörken[4].
-
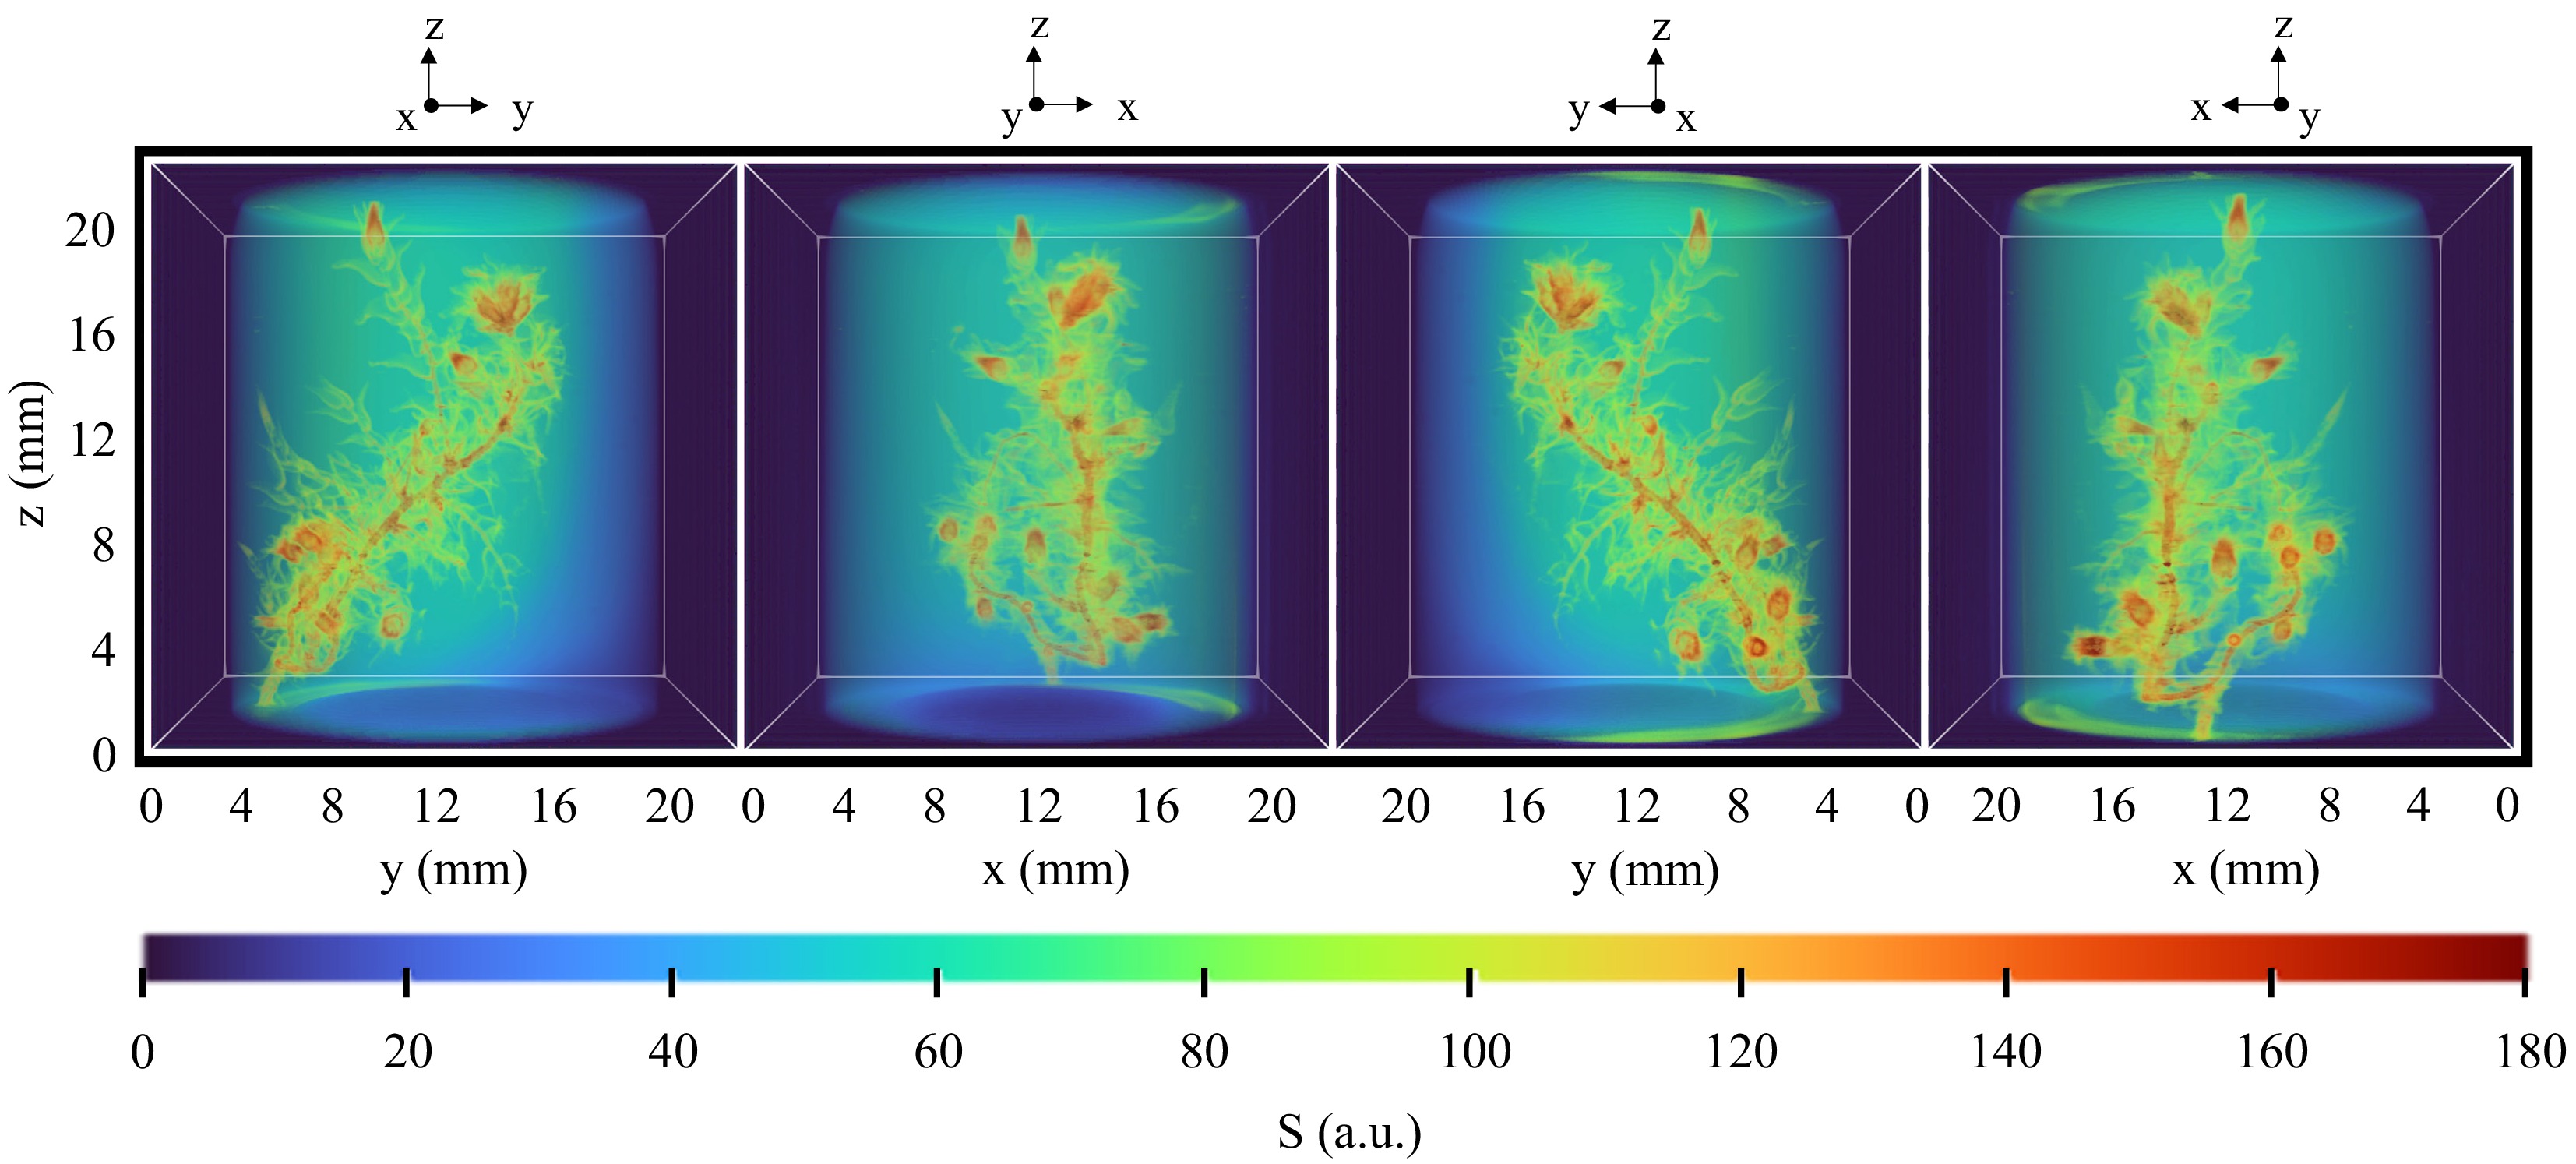
Figure 2.
A specimen of a gametophyte chosen as an example; the images show four different views of a 3D MRI dataset consisting of 256 × 256 × 256 voxels. The cylindrical structure is a signal from the sample vial. The color bar, 'turbo' in MATLAB, gives the code for the signal intensities between 0 and 180 corresponding to the highest measured value in this set. The colors follow the sequence in a visible light spectrum from blue to red. Capitula and stems appear in orange-reddish colors, whereas leaves and water-rich regions appear in yellow-green with reduced signal intensities caused by T1 weighting.
-
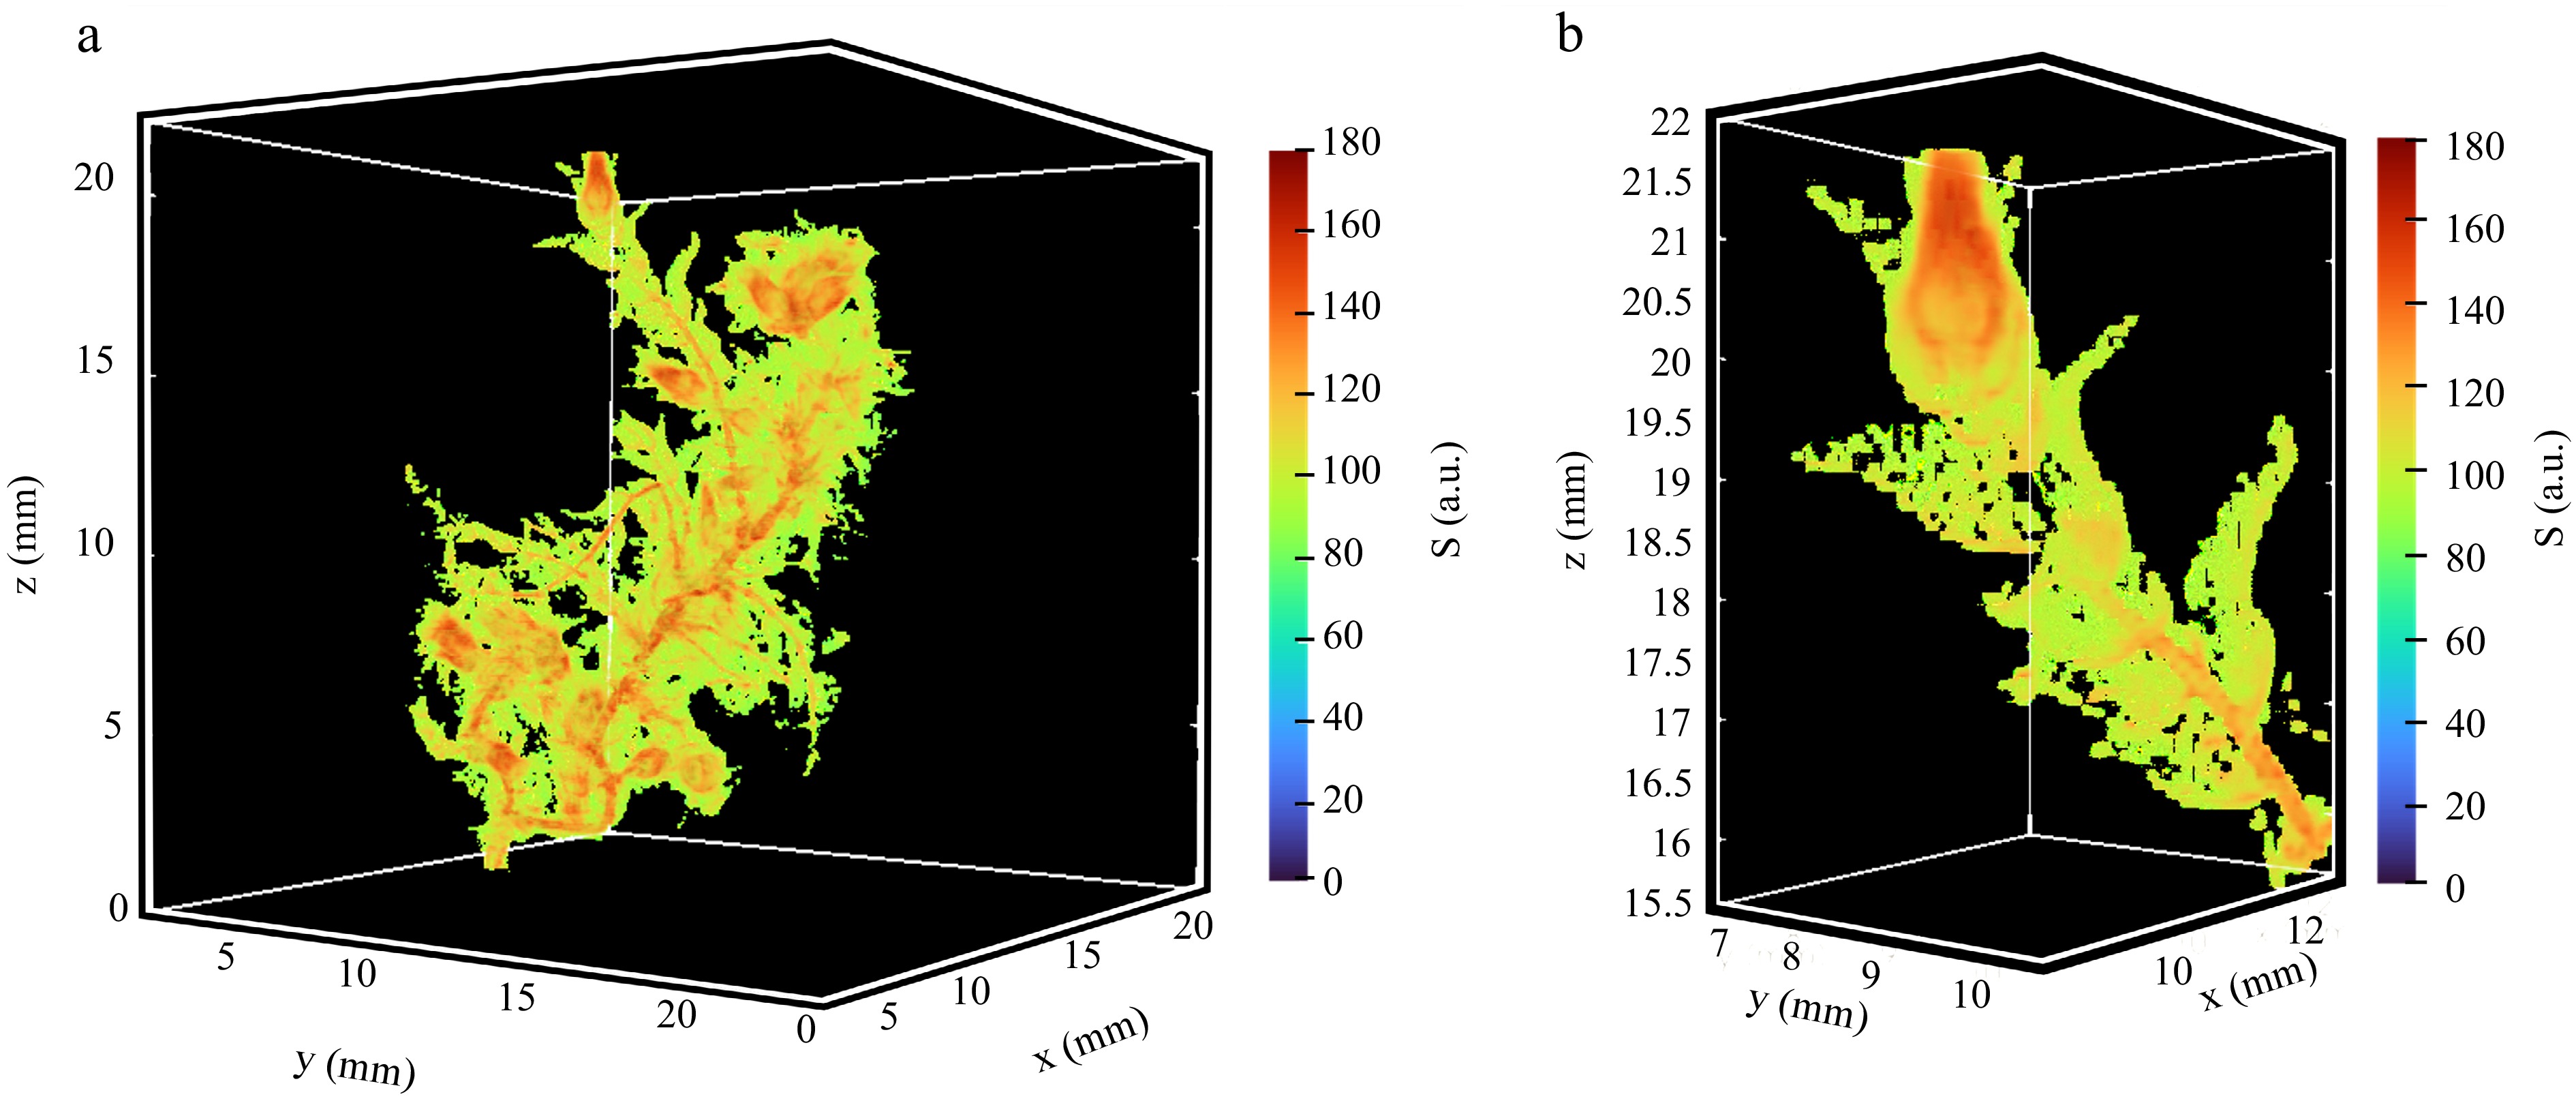
Figure 3.
A 3D segmented MR image of the clipped gametophyte. Signals from the vial and the water are cut off. Now it can be investigated in its full information content. (a) Clipped gametophyte; no disturbing additional signals are to be seen. (b) Clipped capitulum; the leaflets are somewhat disturbed, as some parts (edges) are not fully covered by one voxel and therefore the signal intensities are too close to that of the surrounding water.
-
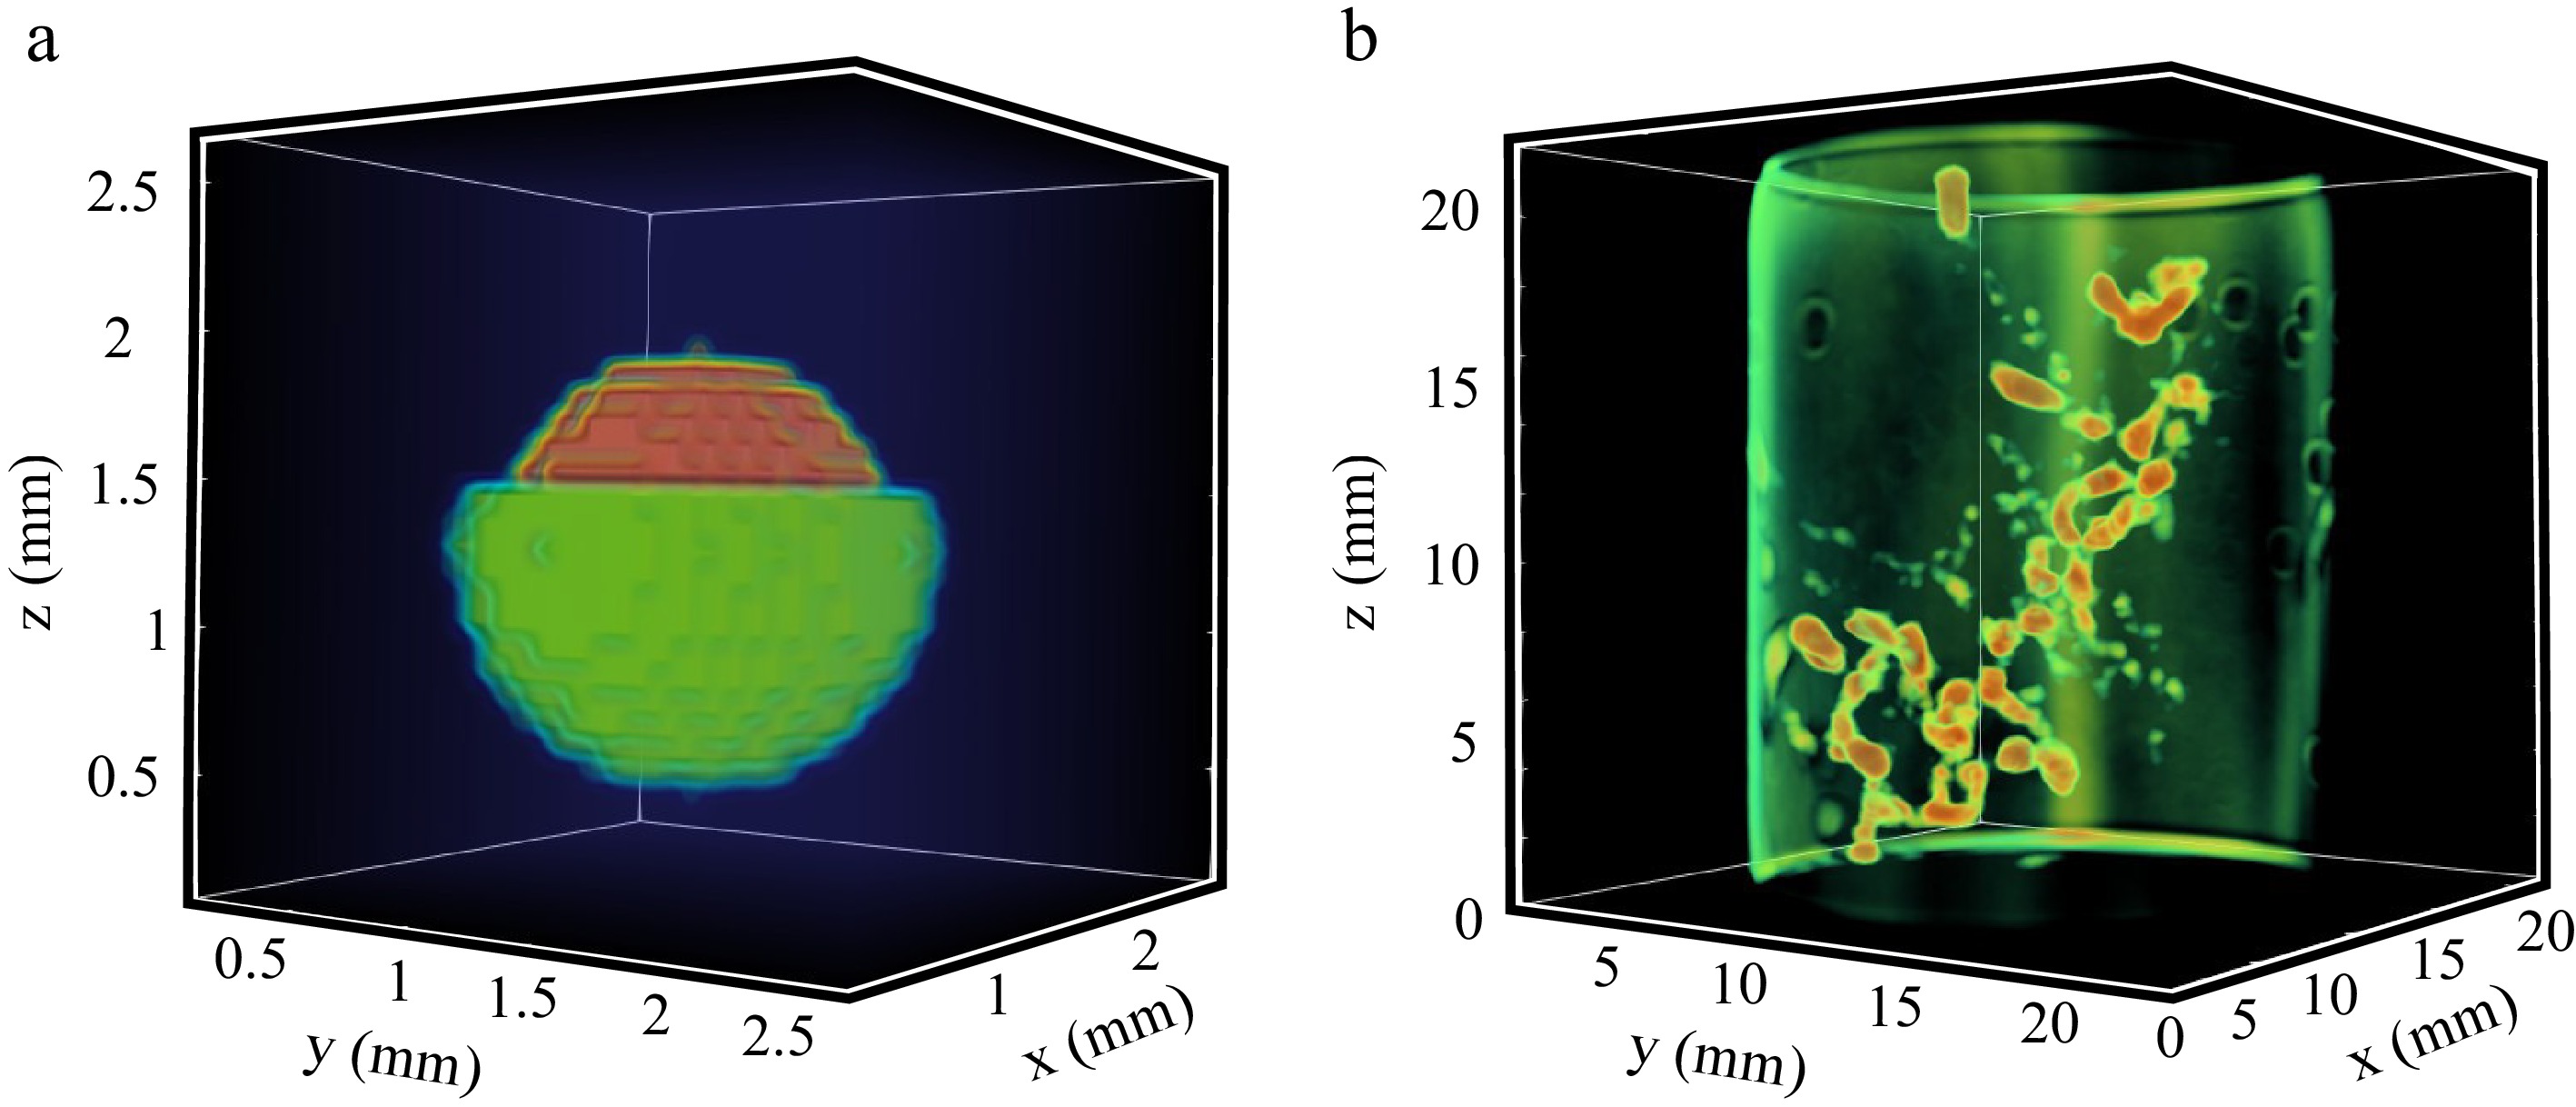
Figure 4.
Volume view of the structure of the matched filter and the filter response; capitula are clearly separated from leaves and from the background. (a) Cutaway diagram of the pattern volume; it is a sphere (red) with a radius of 8 voxels. The rough surface structure reflects the approximation of the sphere with cubic voxels. The coating (green) is 2 voxels thick and the cubic matrix (blue) has an edge length of 31 voxels. (b) The cross-correlation response function clearly shows the capitula as the most intense structures. Background and leaves are nearly completely suppressed, while stems are only partially suppressed.
-
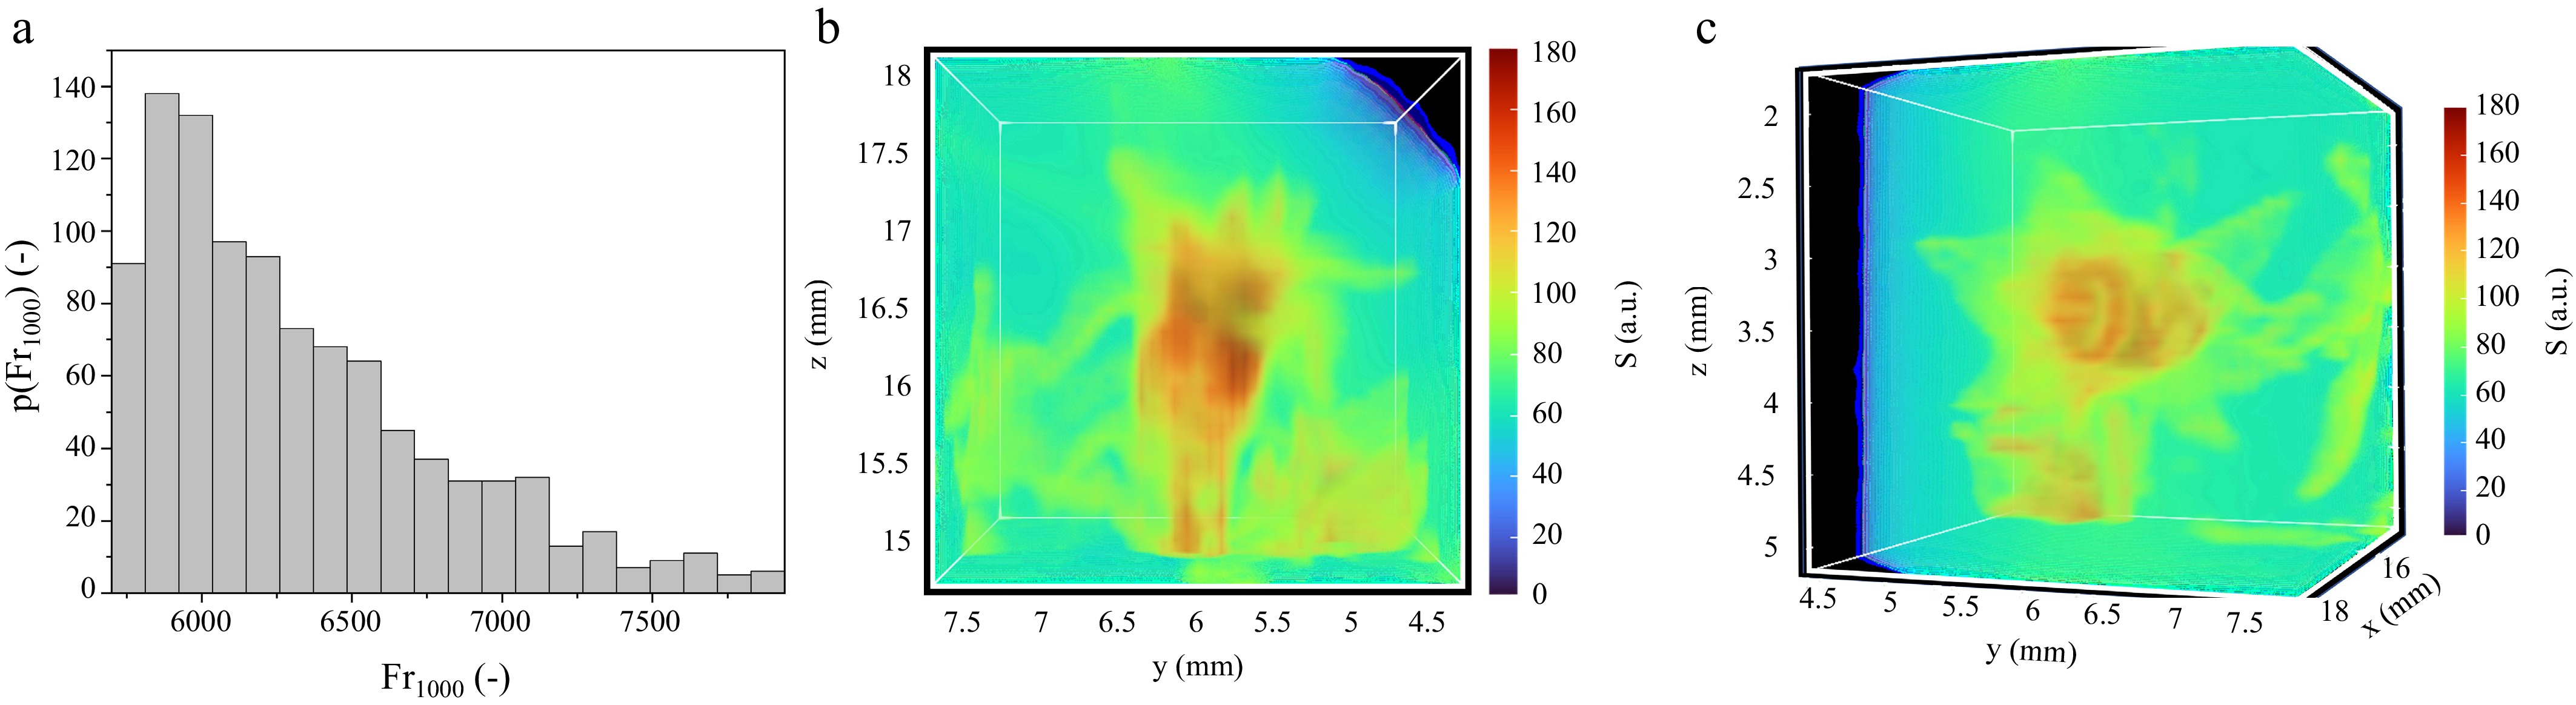
Figure 5.
Distribution density of the filter response and detailed view of the capitulum with the highest matched filter response. (a) Number/size distribution of the largest 1,000 filter responses; starting from the highest value, the hits were clustered by direct neighborhood resulting in ~17 locations of capitula, depending on the fixed threshold. (b) An identified capitulum in detail, namely the one with the highest response; the cube has an edge length of 40 voxels, which corresponds to 1.2 mm. (c) In the view looking down on the capitulum from above, the capitulum is open at the top like a chalice.
-
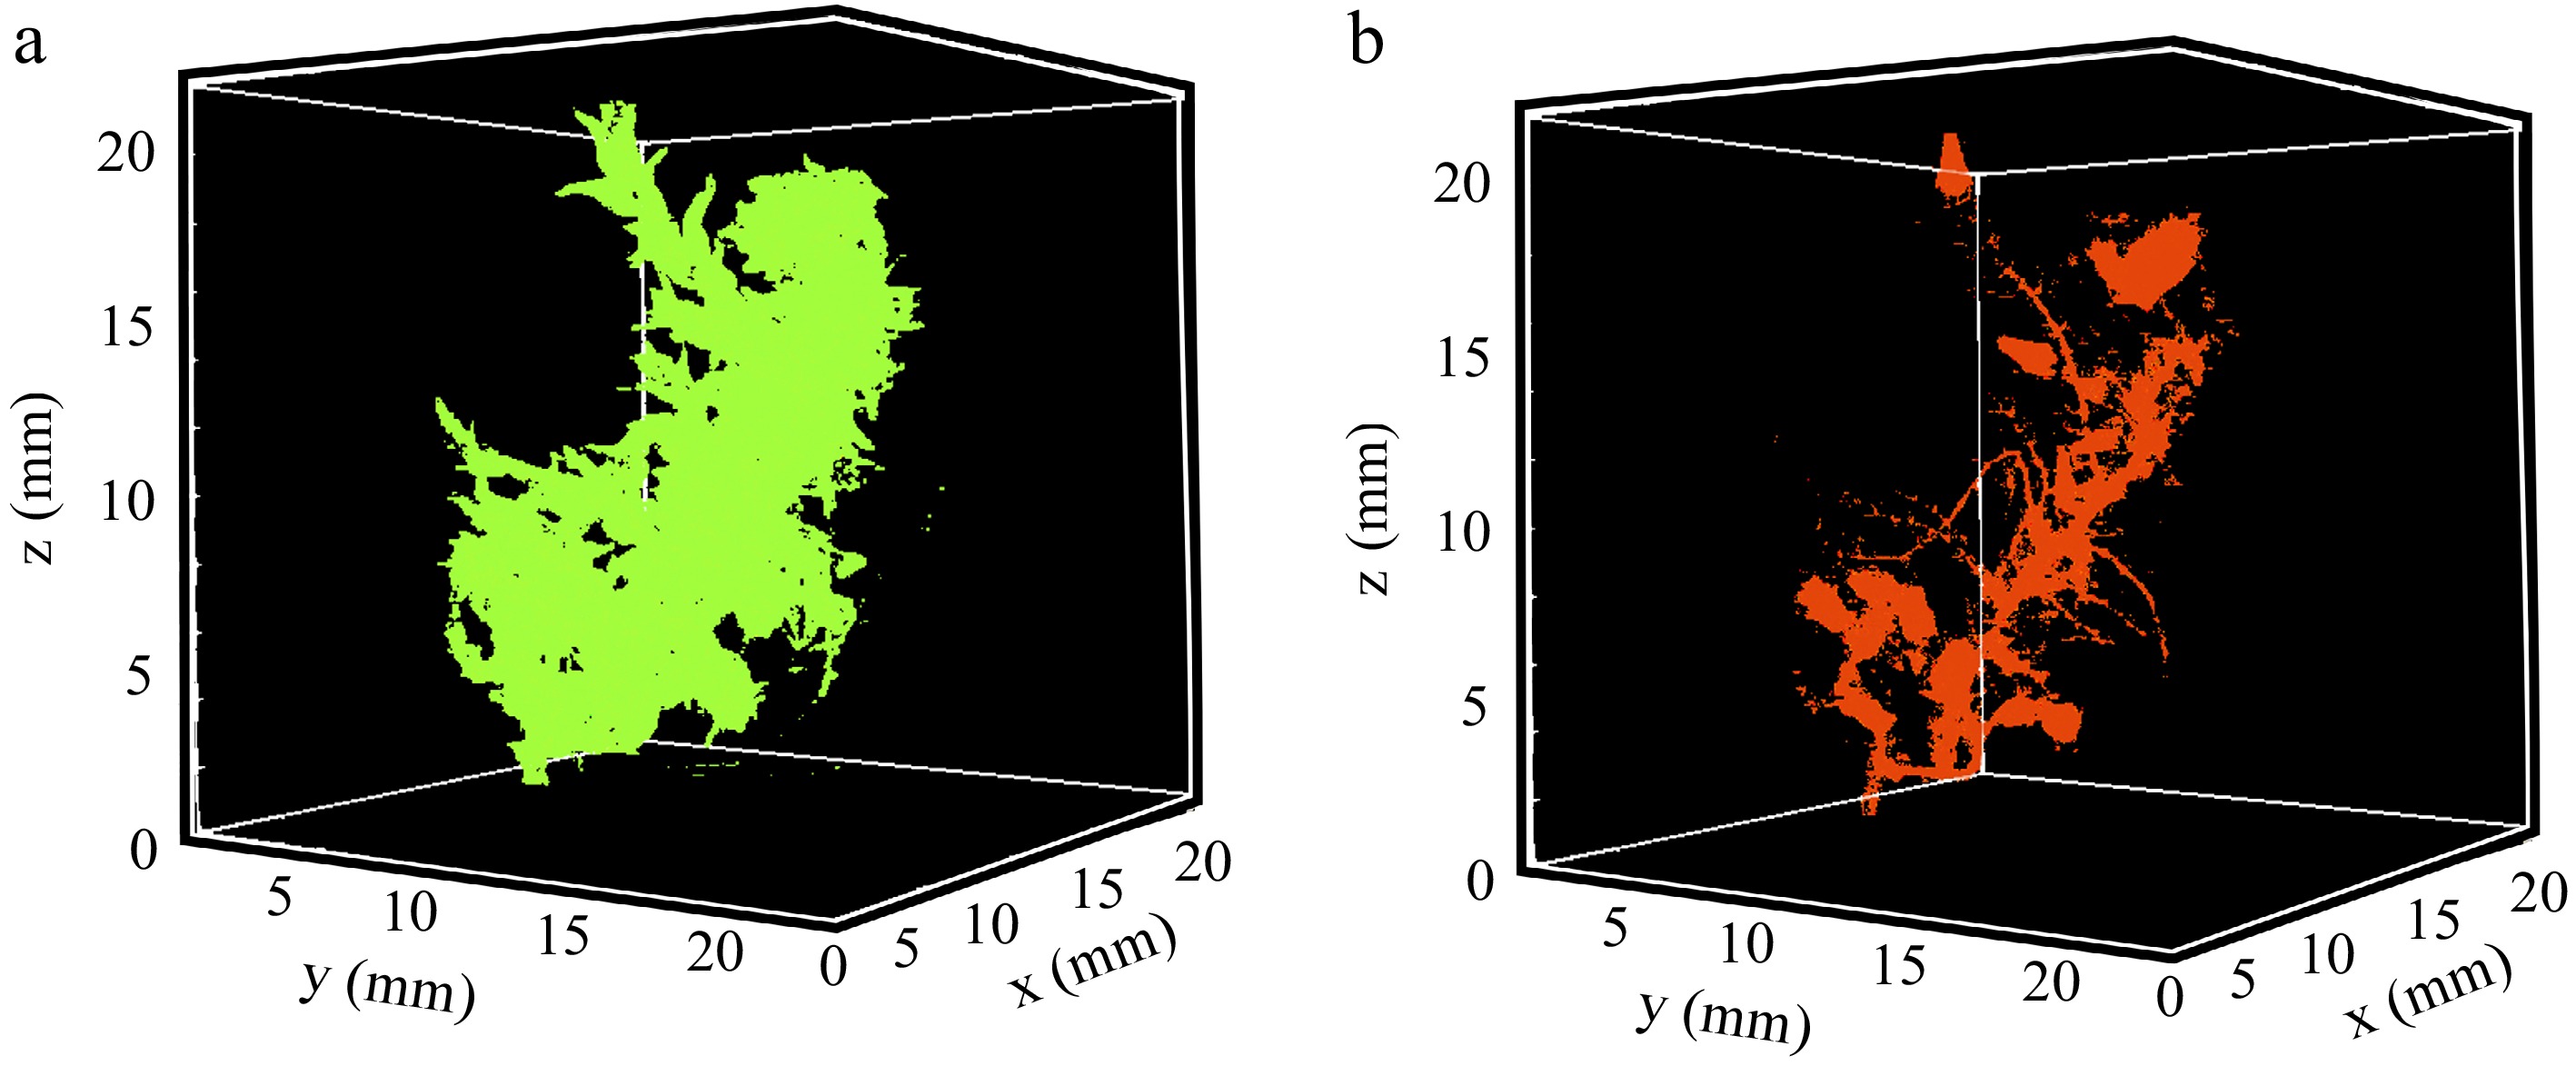
Figure 6.
The three segments after segmentation; against the background as one segment in black, the algorithm found an outer segment, shown here in green, and an inner segment in red. (a) Segment No. 2 in green represents the foliage of the plant. As one would expect from a biological process, the segment forms a continuous volume. (b) Segment No. 3 in red represents the stems and capitula. Leaves are intentionally left out by the algorithm.
-
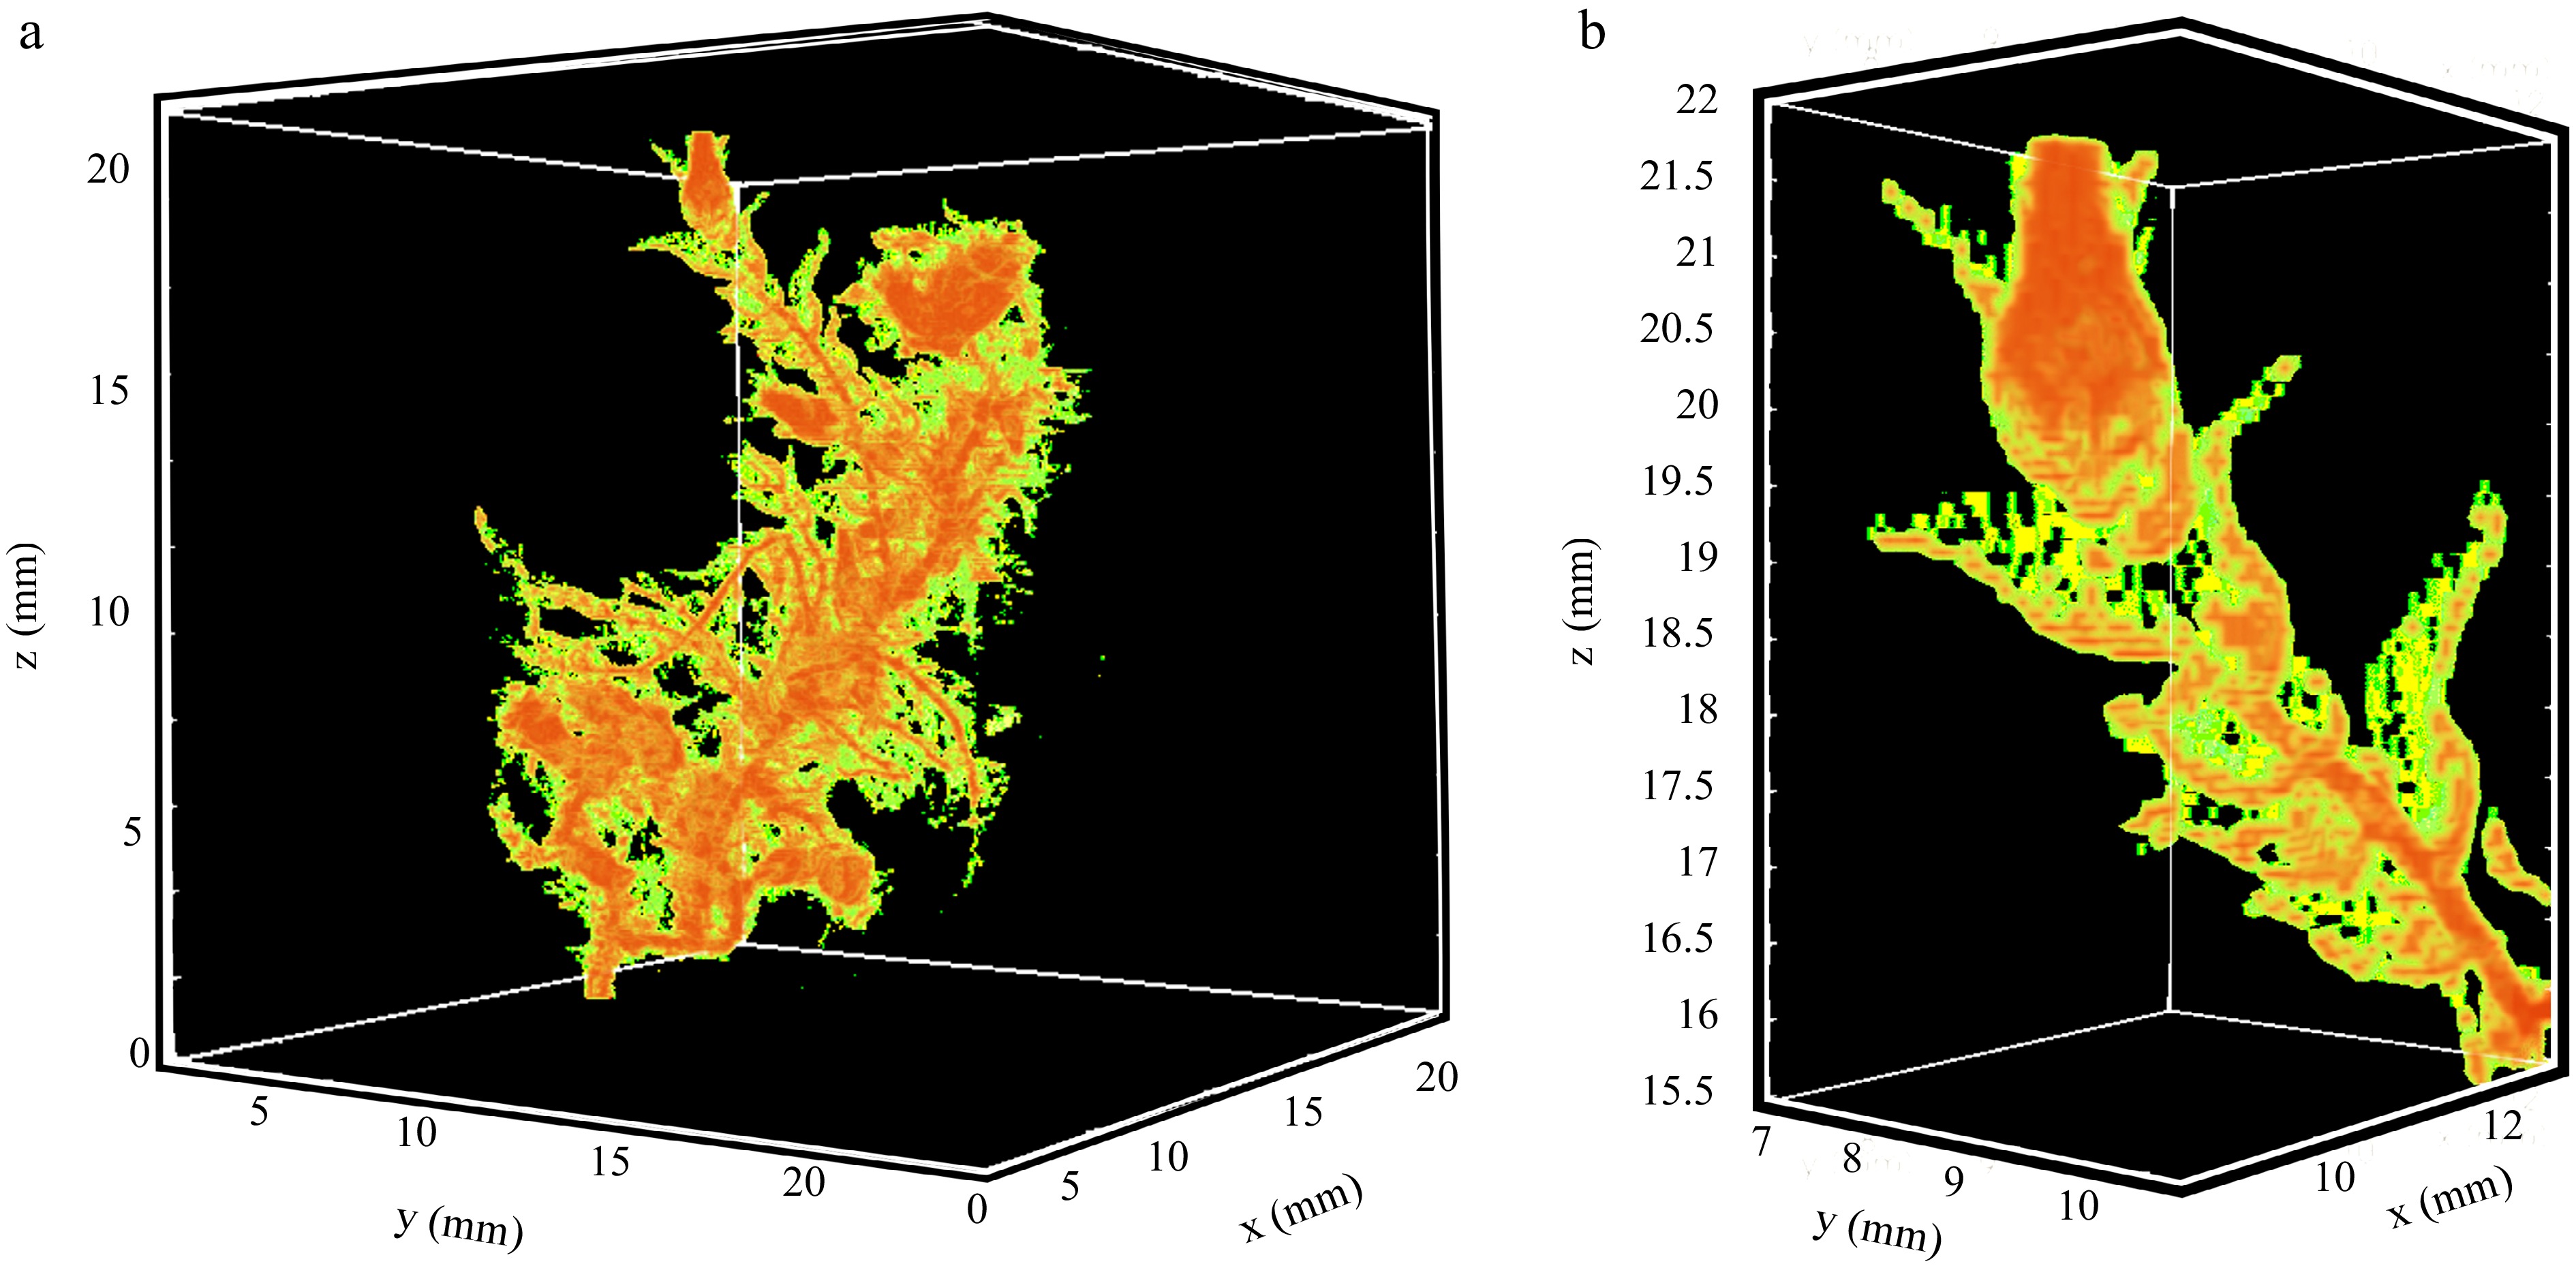
Figure 7.
Results of the quantitative analysis of the preparations using clustering based on a k-means algorithm. The outer (green) segment is made half-transparent to make the inner structure visible. (a) Both clusters showing the plant material together. There is a clear correlation between the material of the stems and the leaf material. (b) A detailed view of the clusters showing the capitulum with the highest filter response of the preparation; the perforated structure of the leaves is caused by the limited spatial resolution, i.e. the interference of leaf edges with the voxel structure.
-
Parameter Unit Value Pulse sequence RARE Magnetic field T 9.4 Repetition time tR s 0.4 Echo time τe ms 3.4 RARE factor – 8 Field of view (x, y, z) mm × mm × mm 22 × 22 × 22 Data matrix size (x, y, z) px × px × px 256 × 256 × 256 Voxel size (x, y, z) µm × µm × µm 86 × 86 × 86 Number of averages – 17 Measurement time h 15.5 Table 1.
1H NMR acquisition parameters for 3D measurement of peat moss.
Figures
(7)
Tables
(1)