-
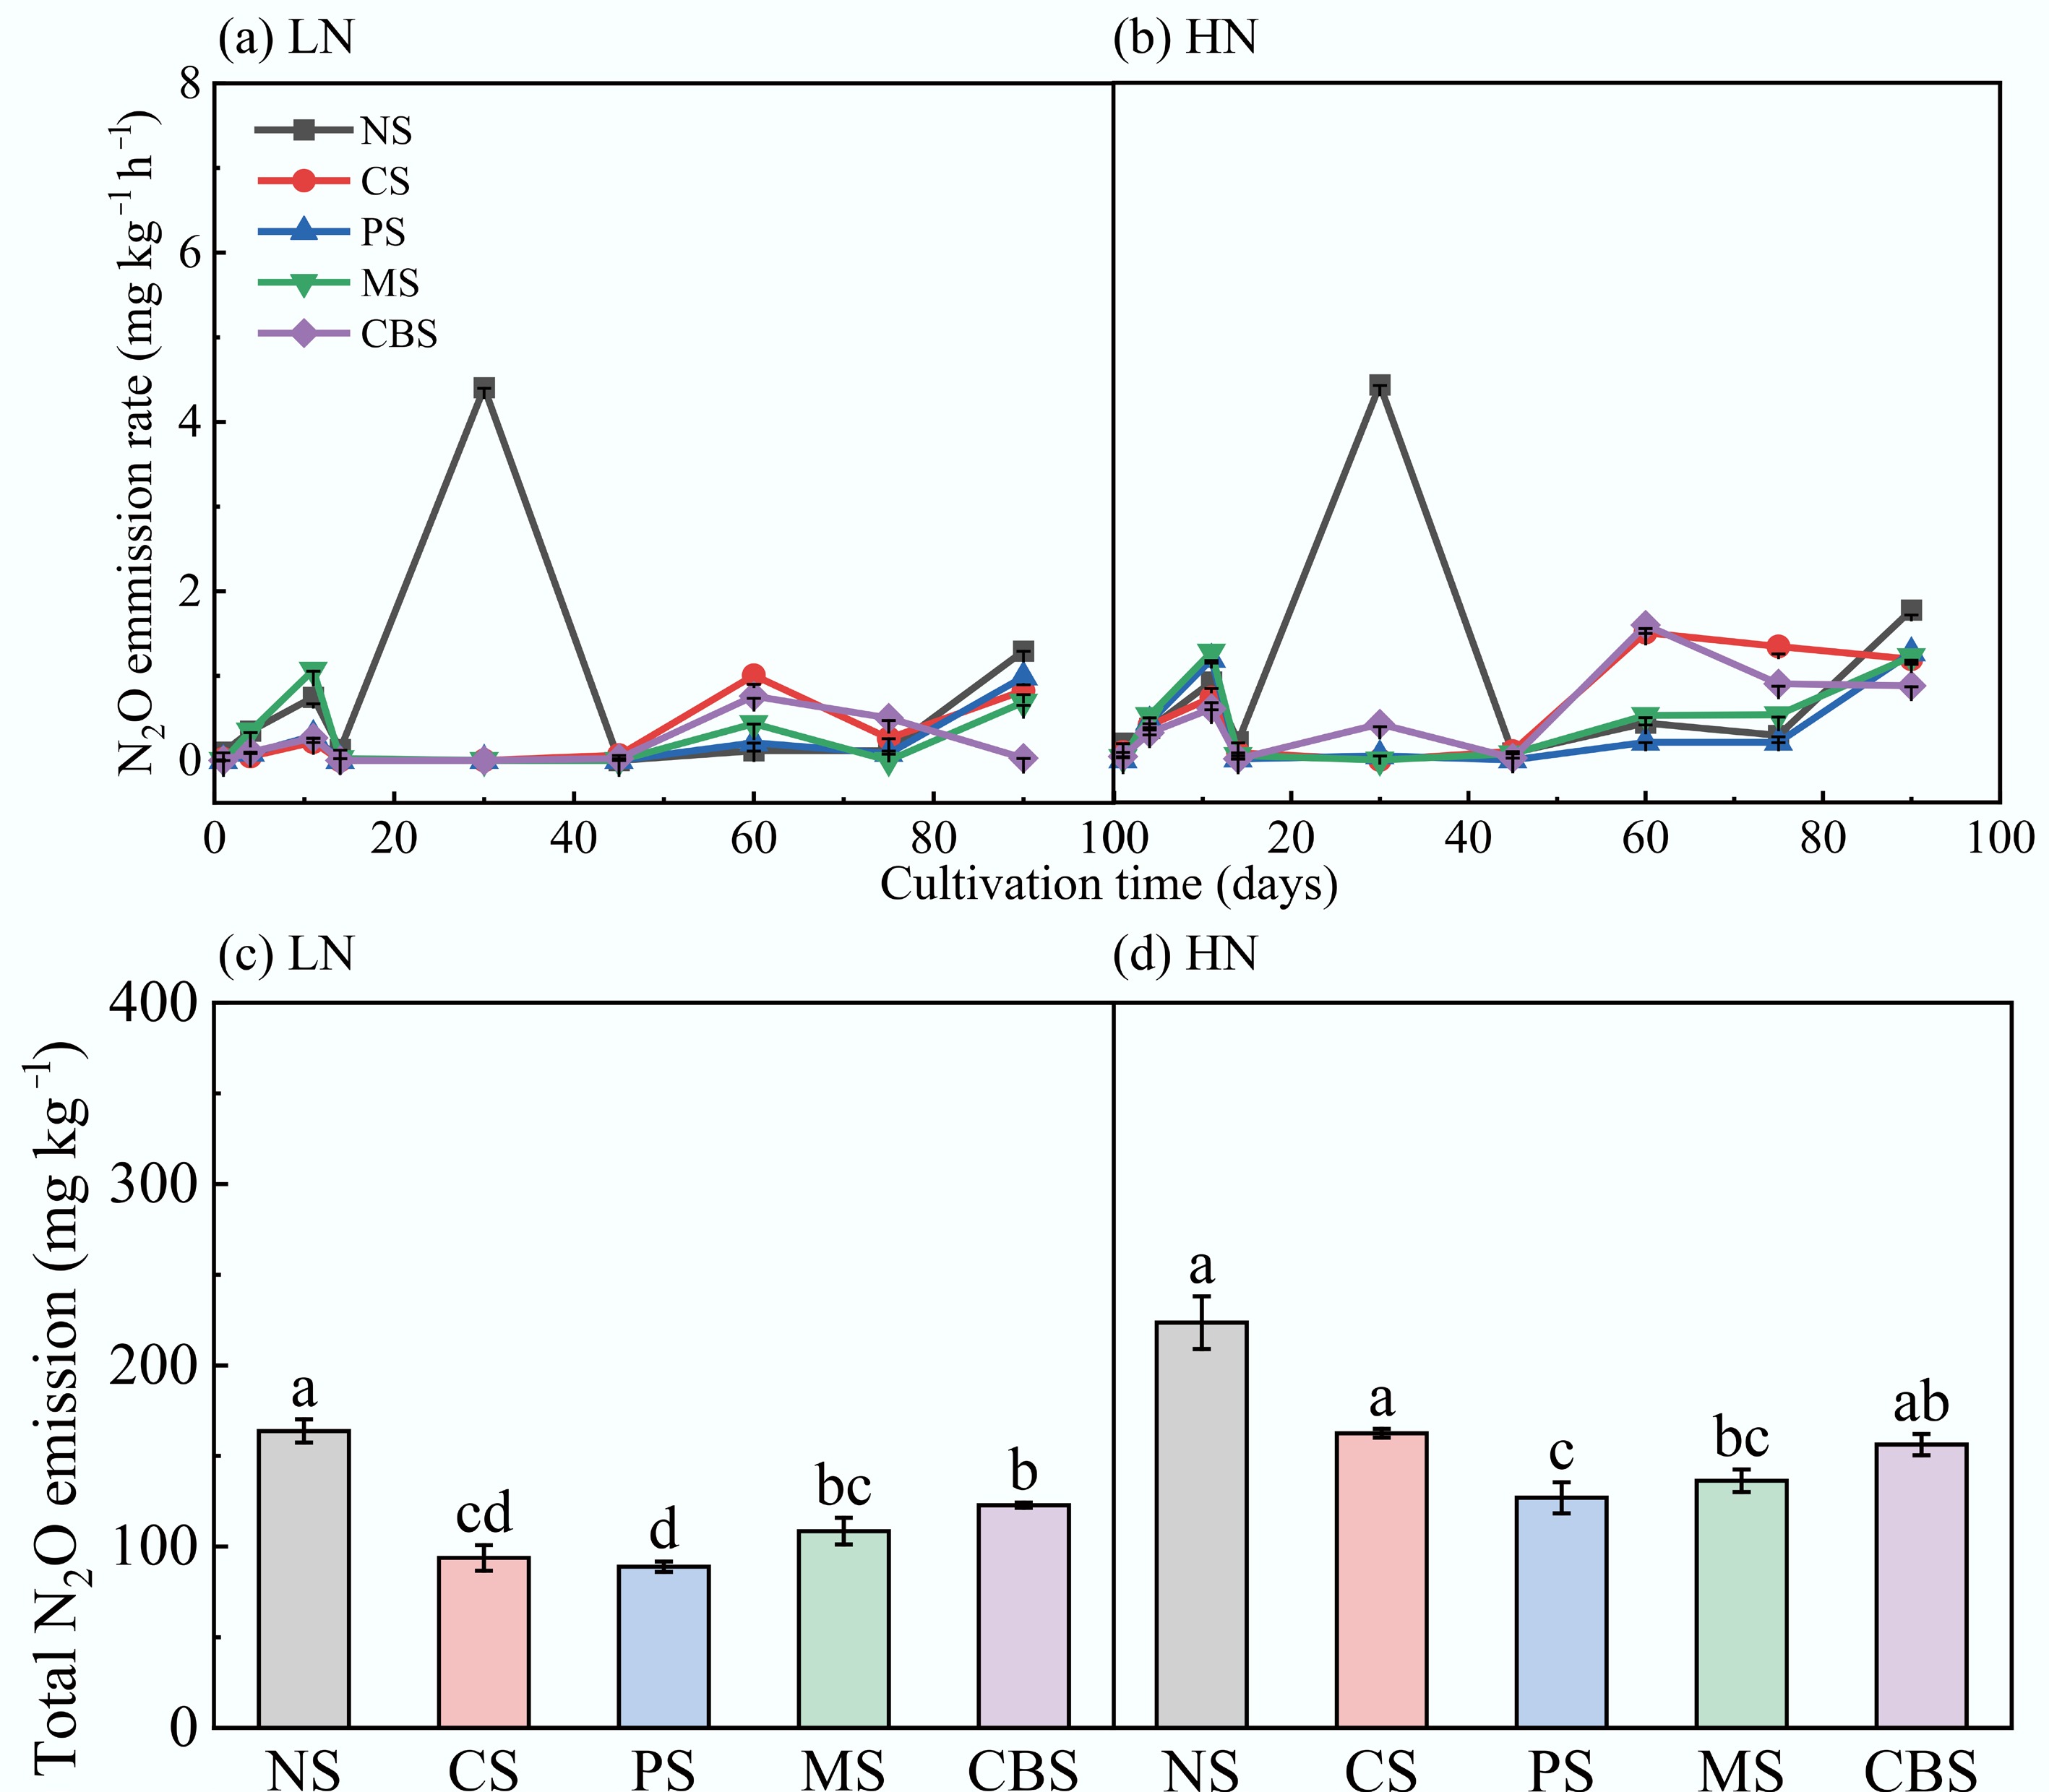
Figure 1.
During the 90-d incubation period, the temporal variations of (a), (b) N2O flux and (c), (d) cumulative N2O emissions in soil under five different straw return methods under low- or high-N conditions. Different letters indicate significant differences among treatments (p < 0.05). Vertical lines represent the standard error of the mean (n = 3).
-
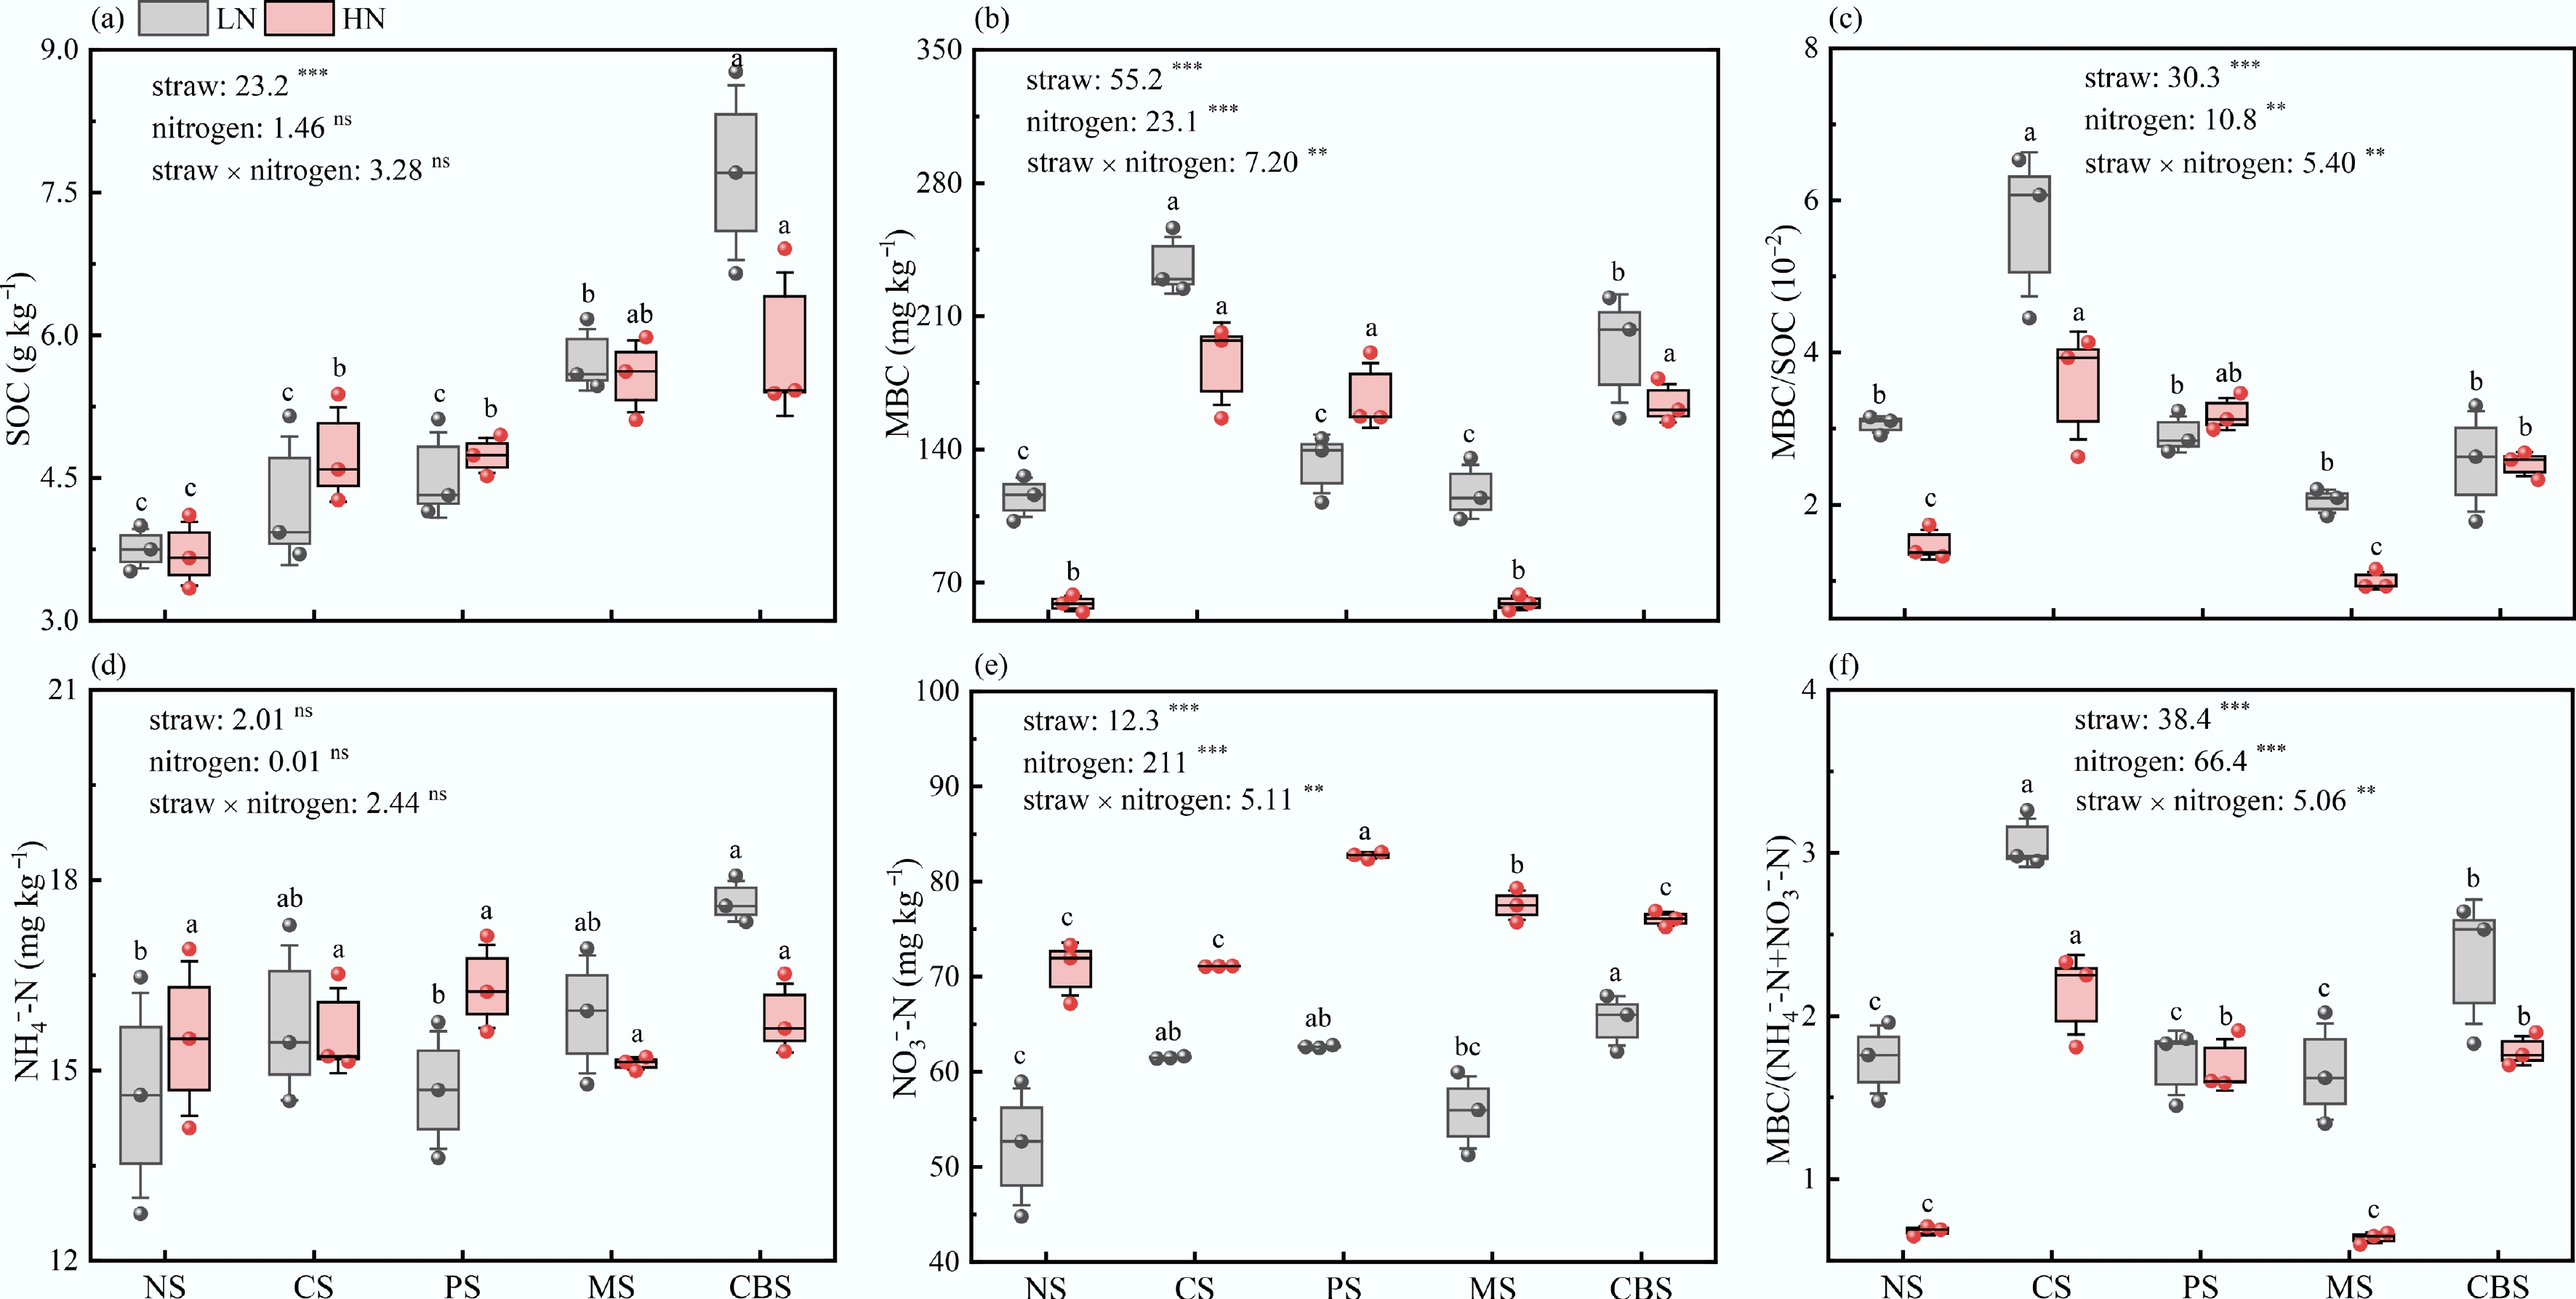
Figure 2.
After 90 days of cultivation, under low- or high-N conditions, the effects of five different straw return methods on the contents of soil SOC, MBC, MBC/SOC, NH4+-N, NO3−-N and MNN: (MBC/[NH4+-N + NO3−-N]).
-
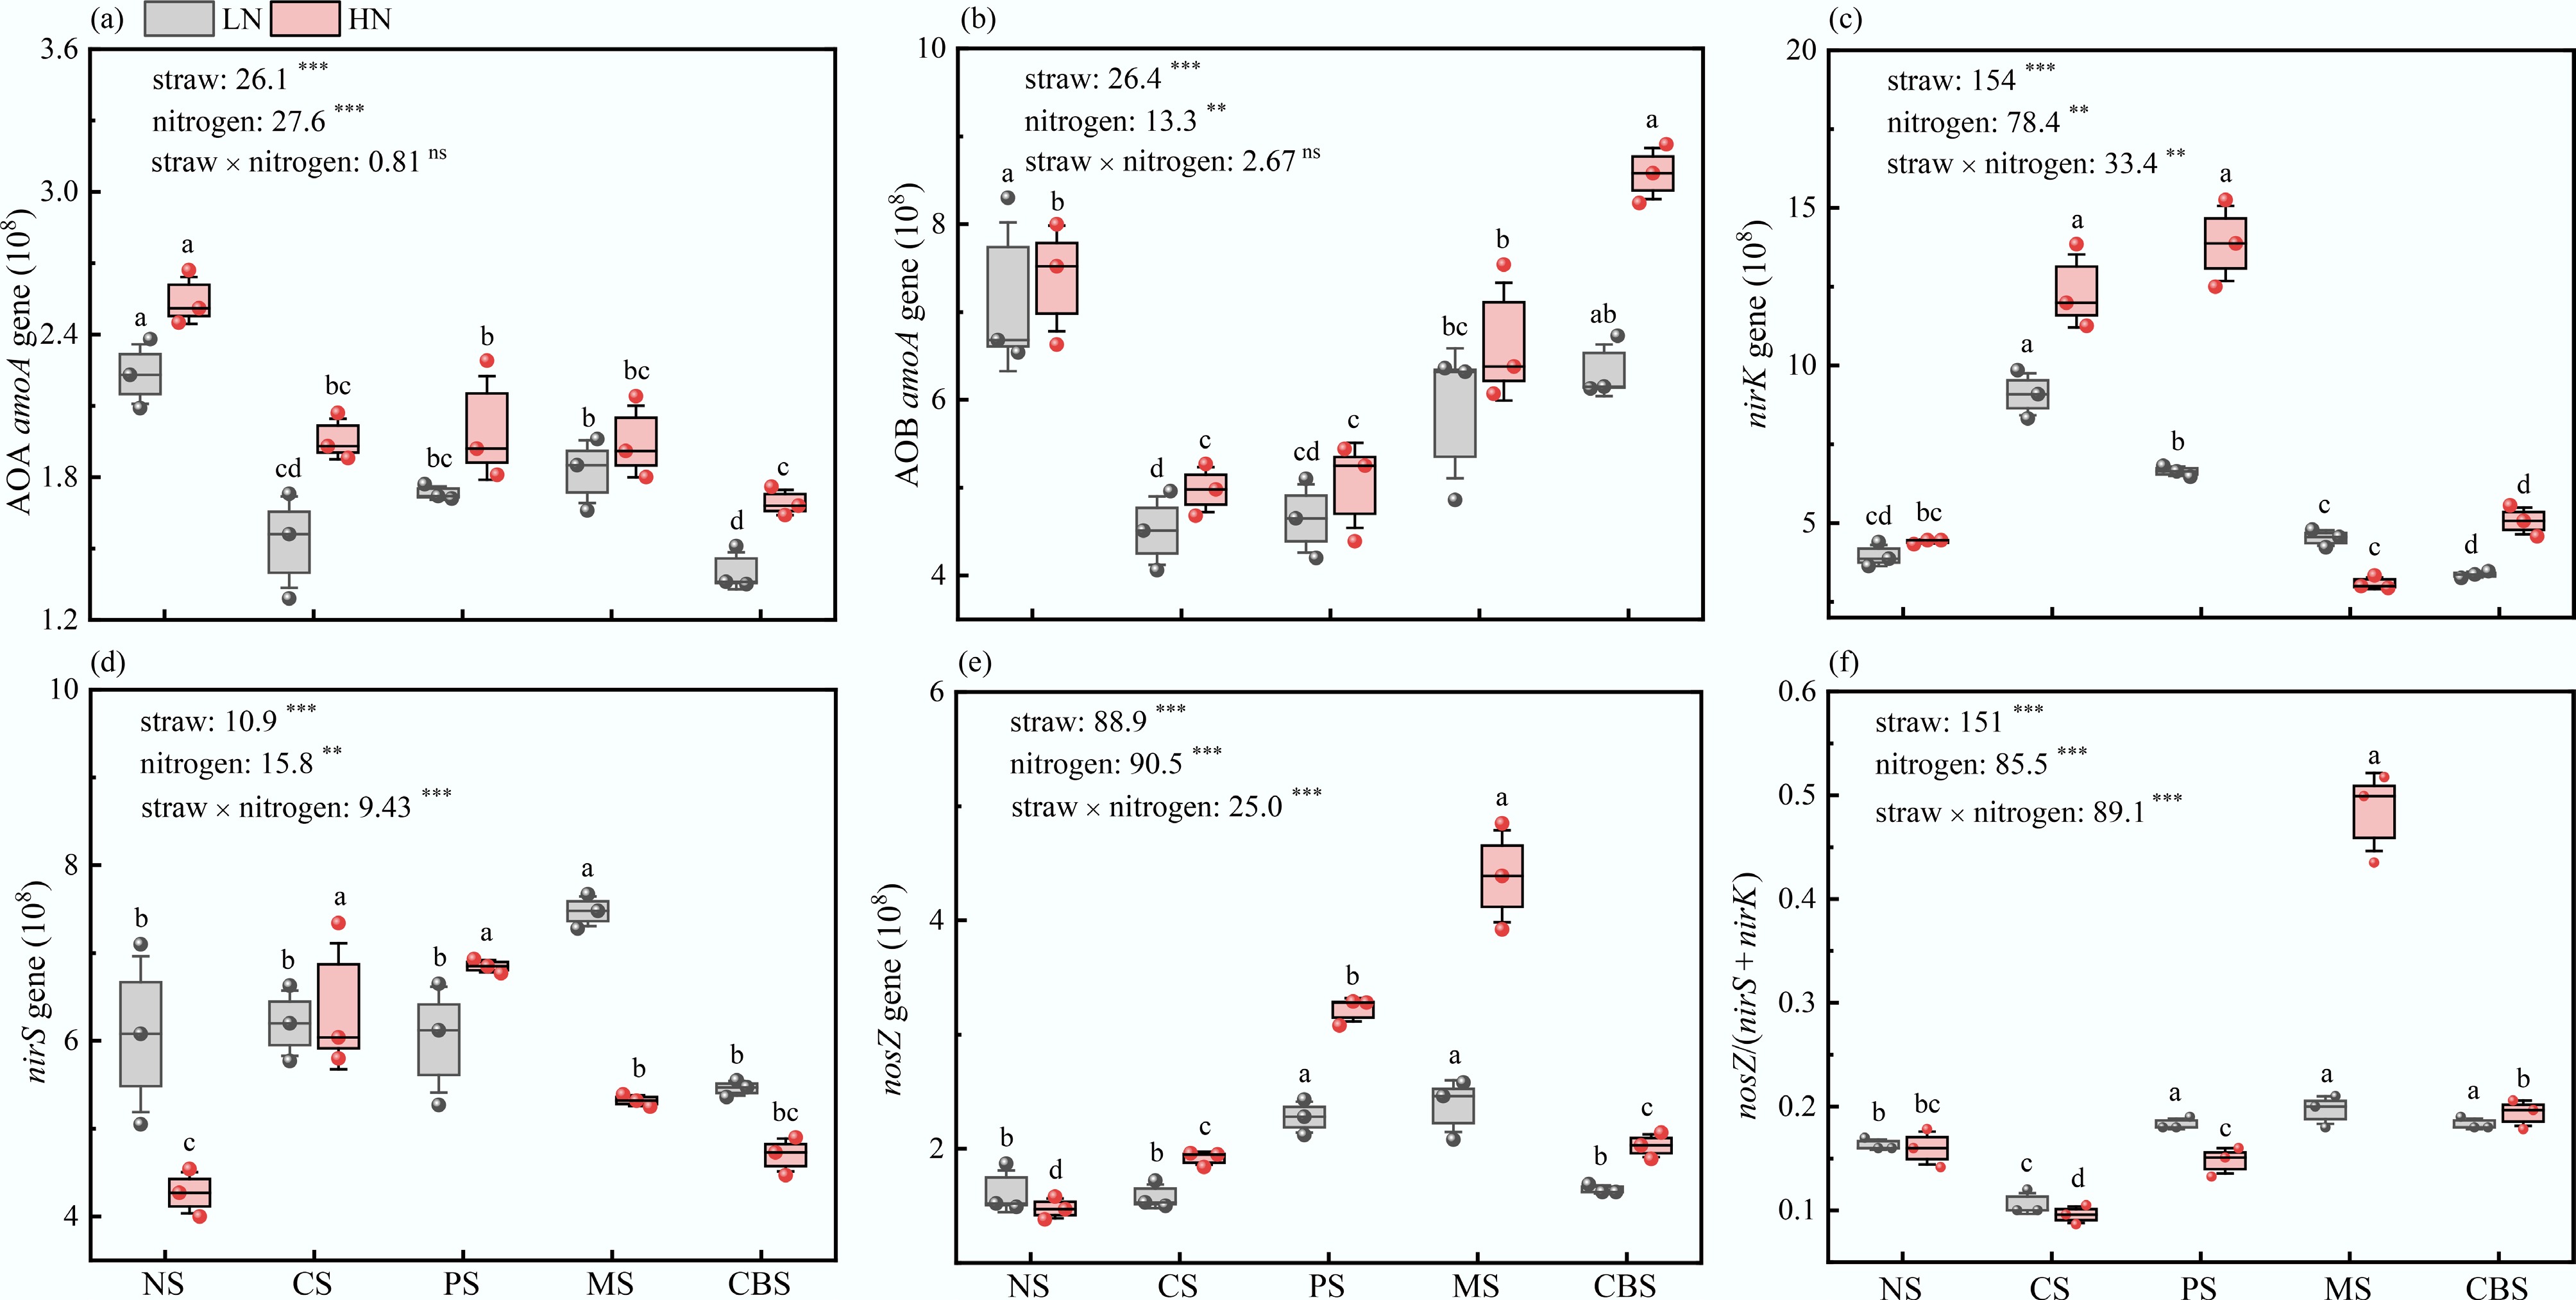
Figure 3.
After a 90-d cultivation period, the gene copy numbers of functional genes (a) AOA amoA, (b) AOB amoA, (c) nirK, (d) nirS, (e) nosZ, and (f) nosZ/(nirS + nirK) in the soil under low- or high-N conditions determined for five different straw return methods.
-
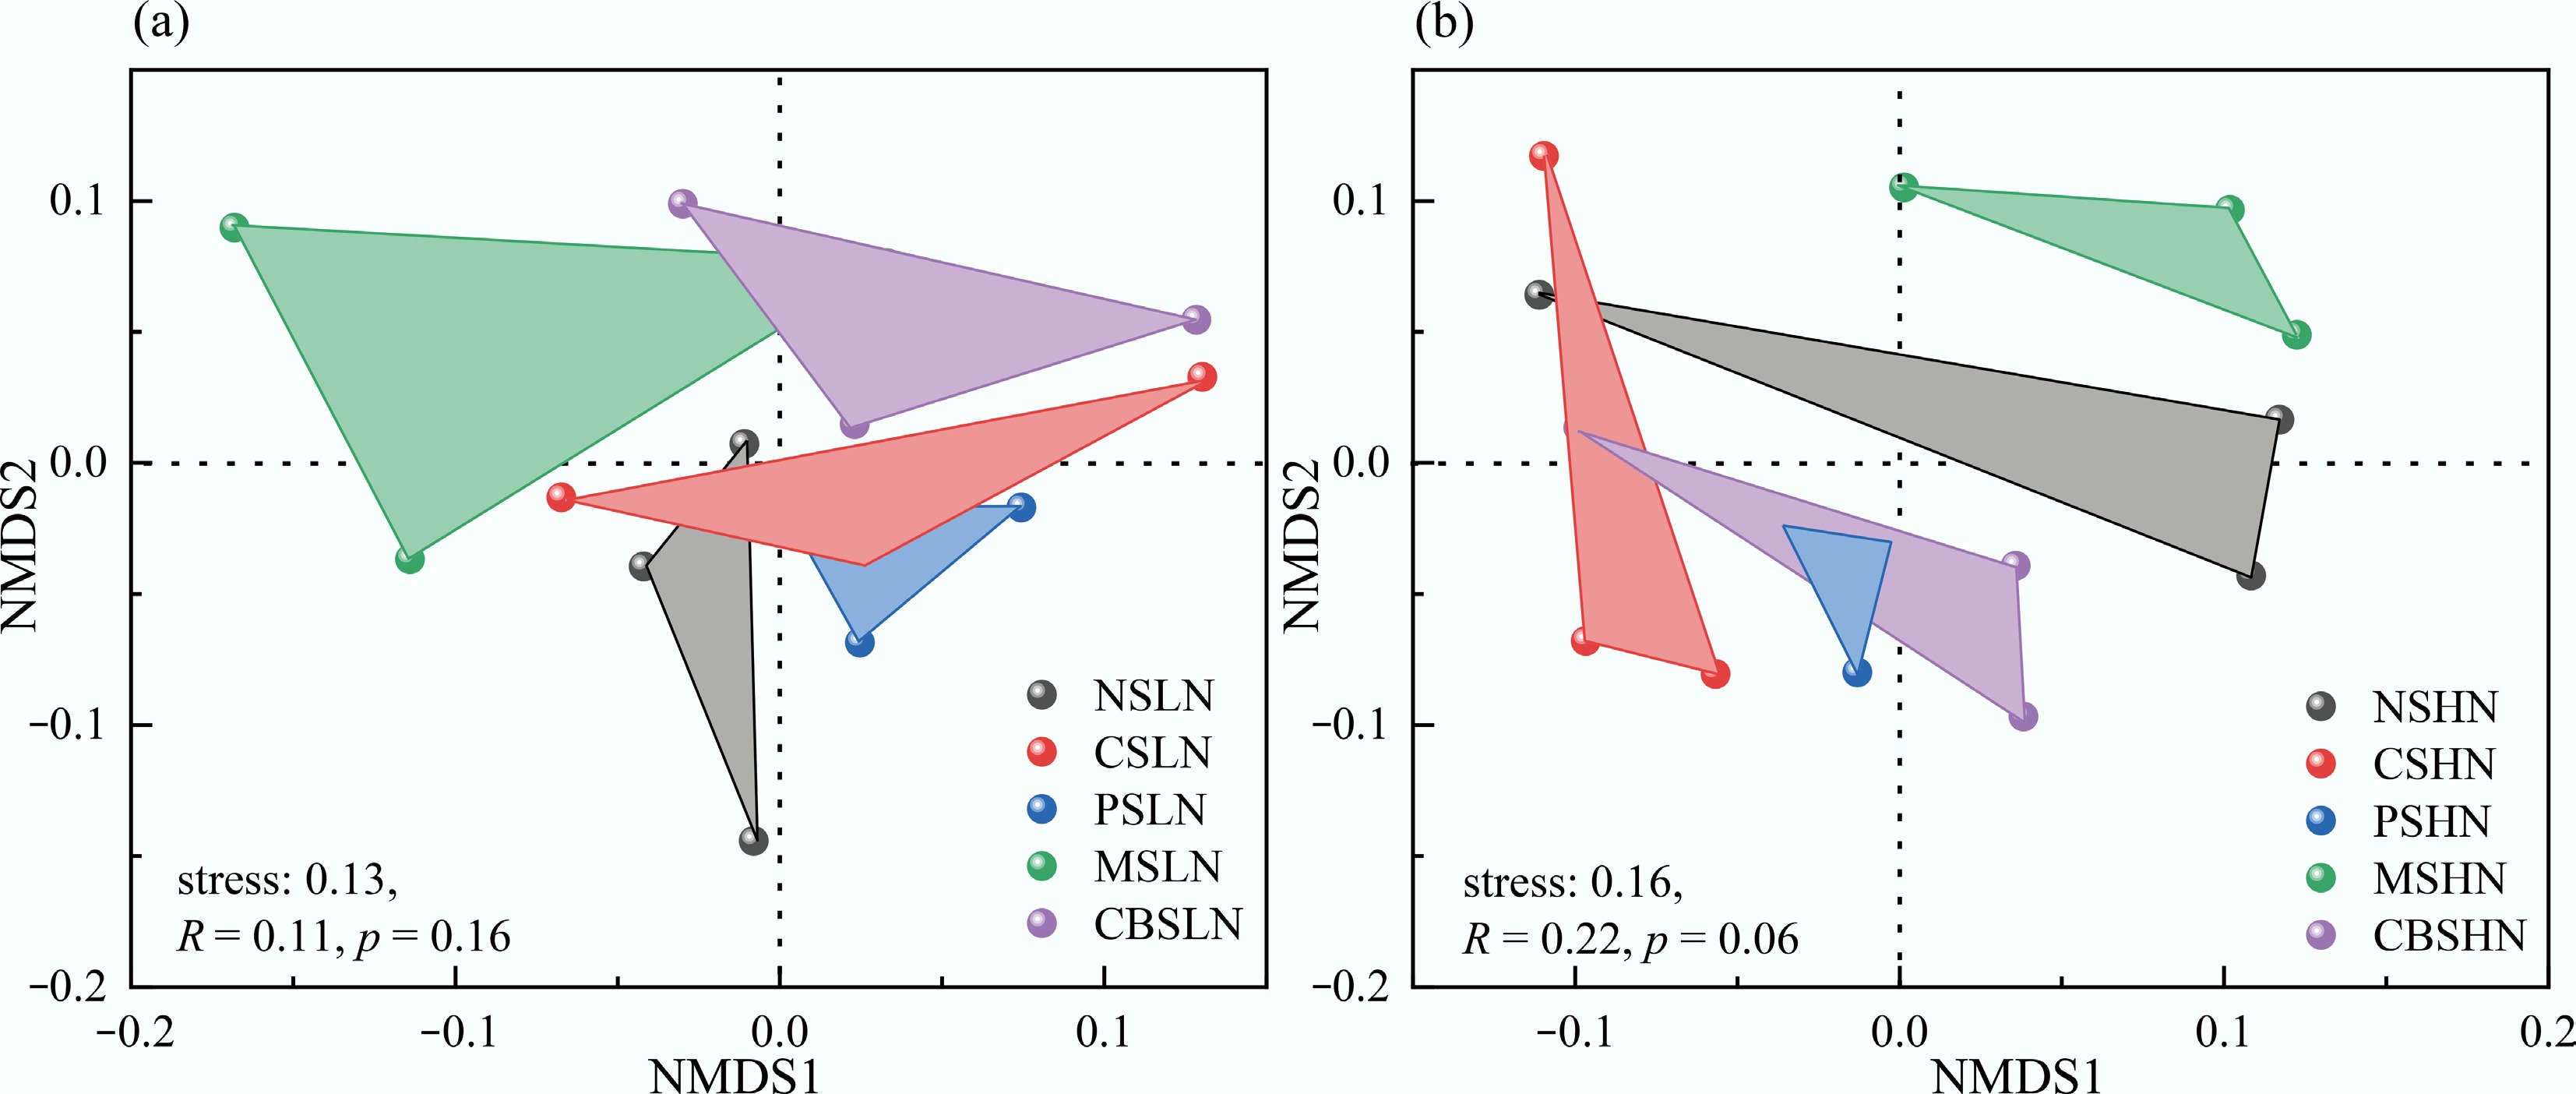
Figure 4.
NMDS analysis of AOB nitrifying bacterial communities under different straw return methods at (a) low-N or (b) high-N conditions.
-
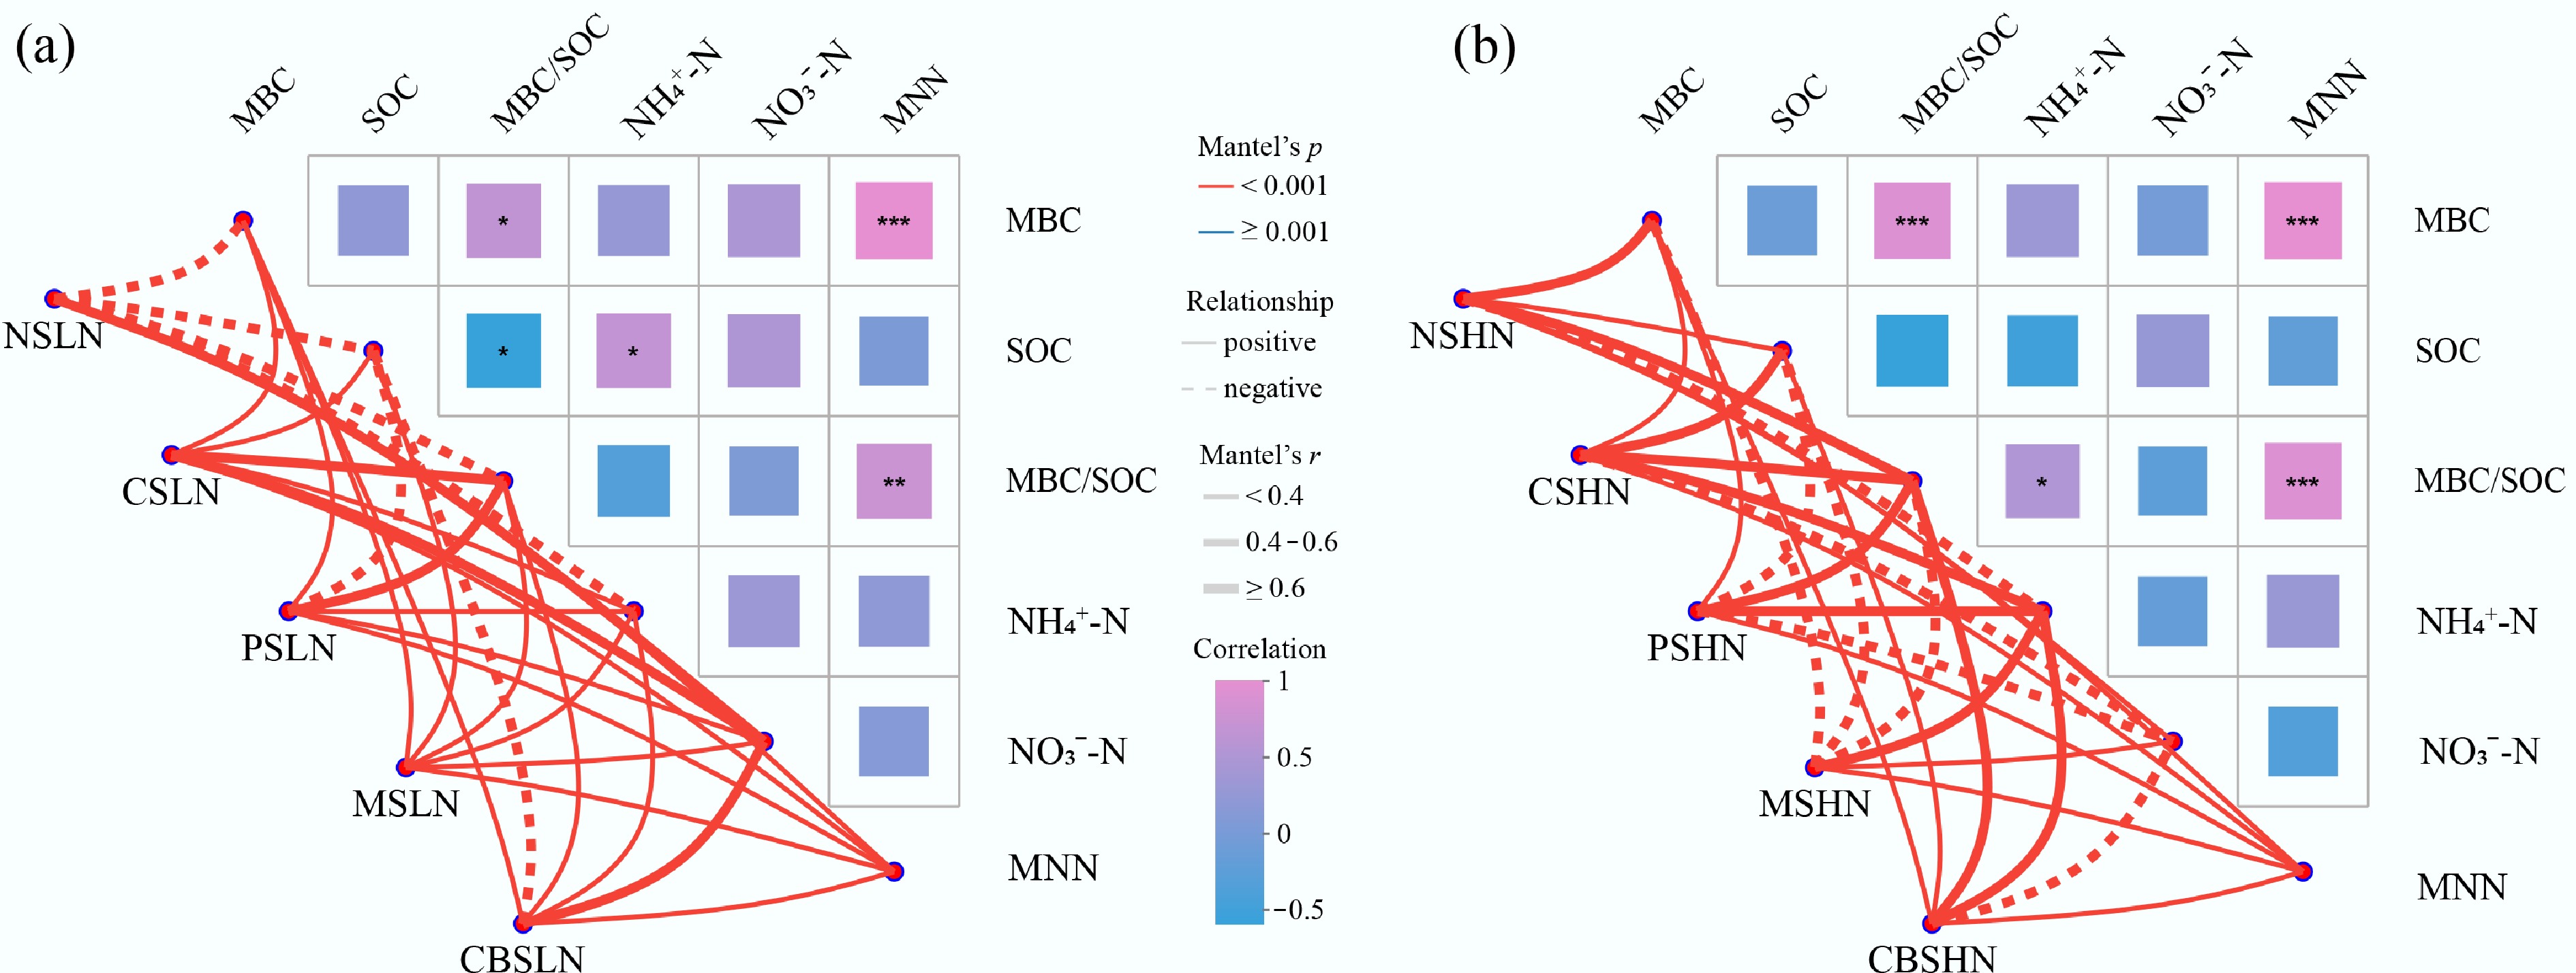
Figure 5.
The relationship between bacterial communities and soil properties under low-N or high-N conditions for different straw return methods (MNN: MBC/[NH4+-N + NO3−-N]).
-
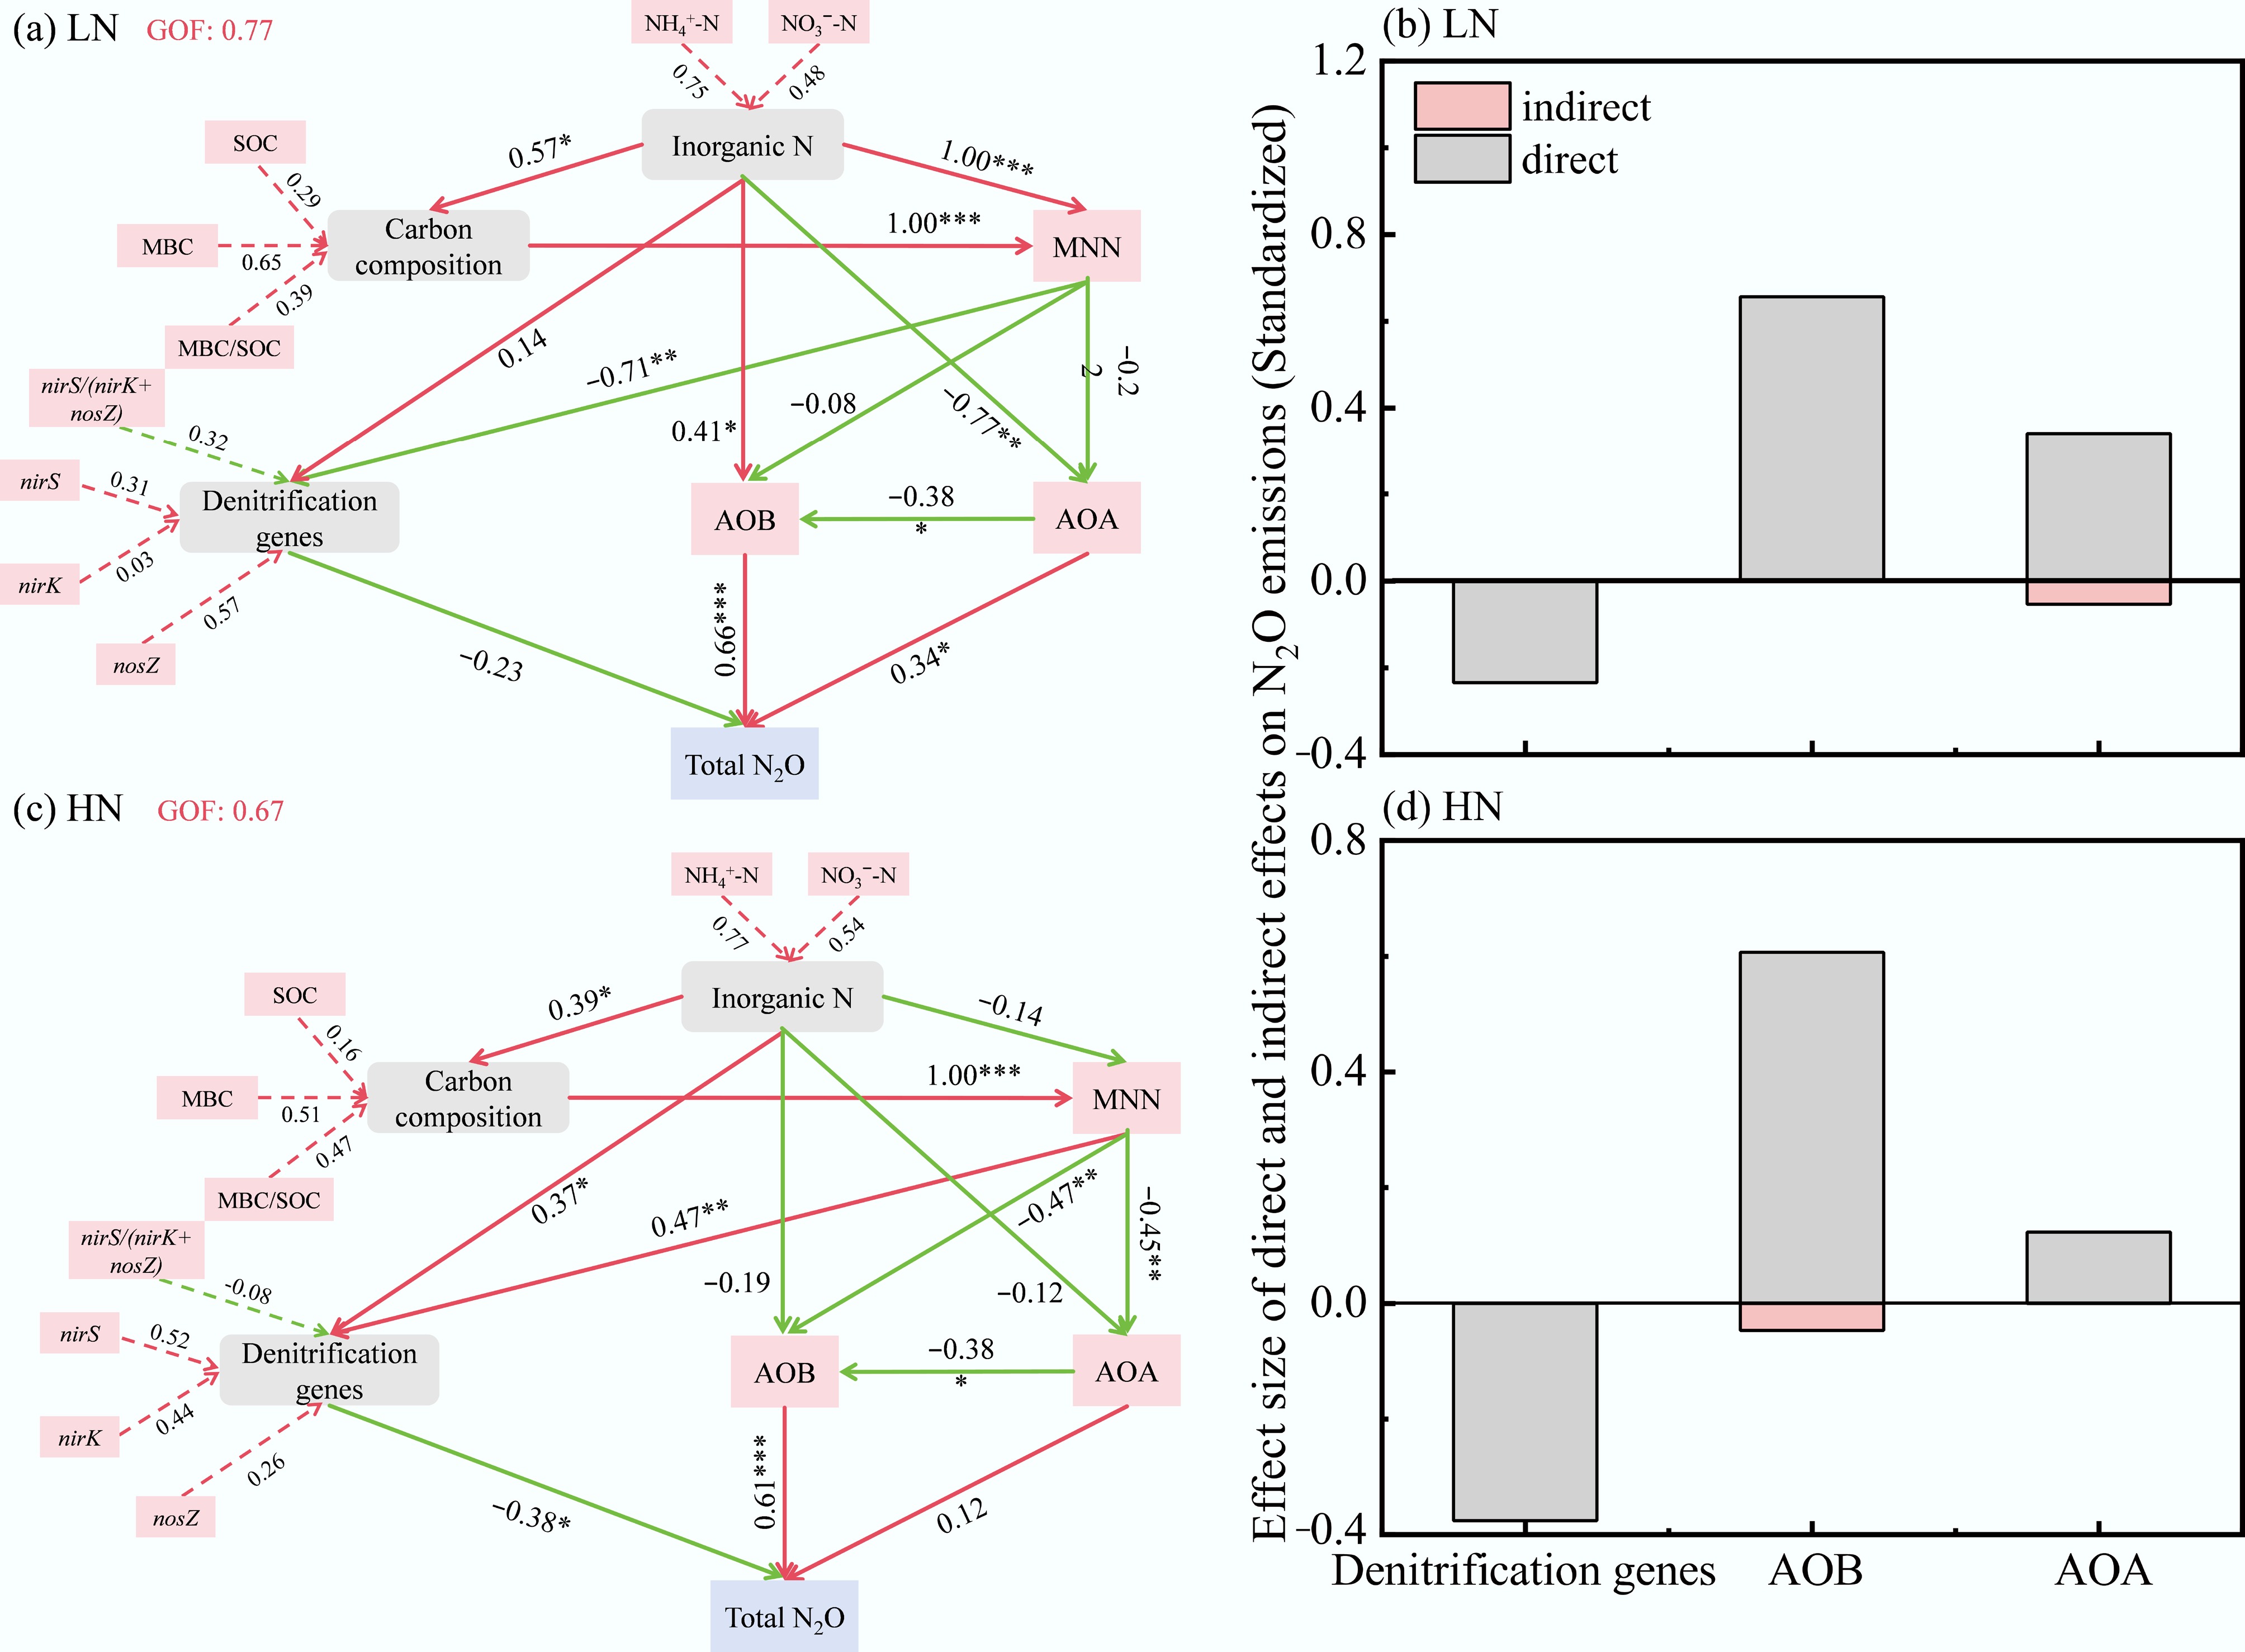
Figure 6.
Nitrification and denitrification gene responses to N2O accumulation emissions. The red line represents a positive effect, while the green line represents a negative effect. The numbers on the arrows indicate the standardized path coefficients. GOF (goodness-of-fit), a measure used for the explanatory power of the entire model as a whole. * p < 0.05; ** p < 0.01; *** p < 0.001.
Figures
(6)
Tables
(0)