-
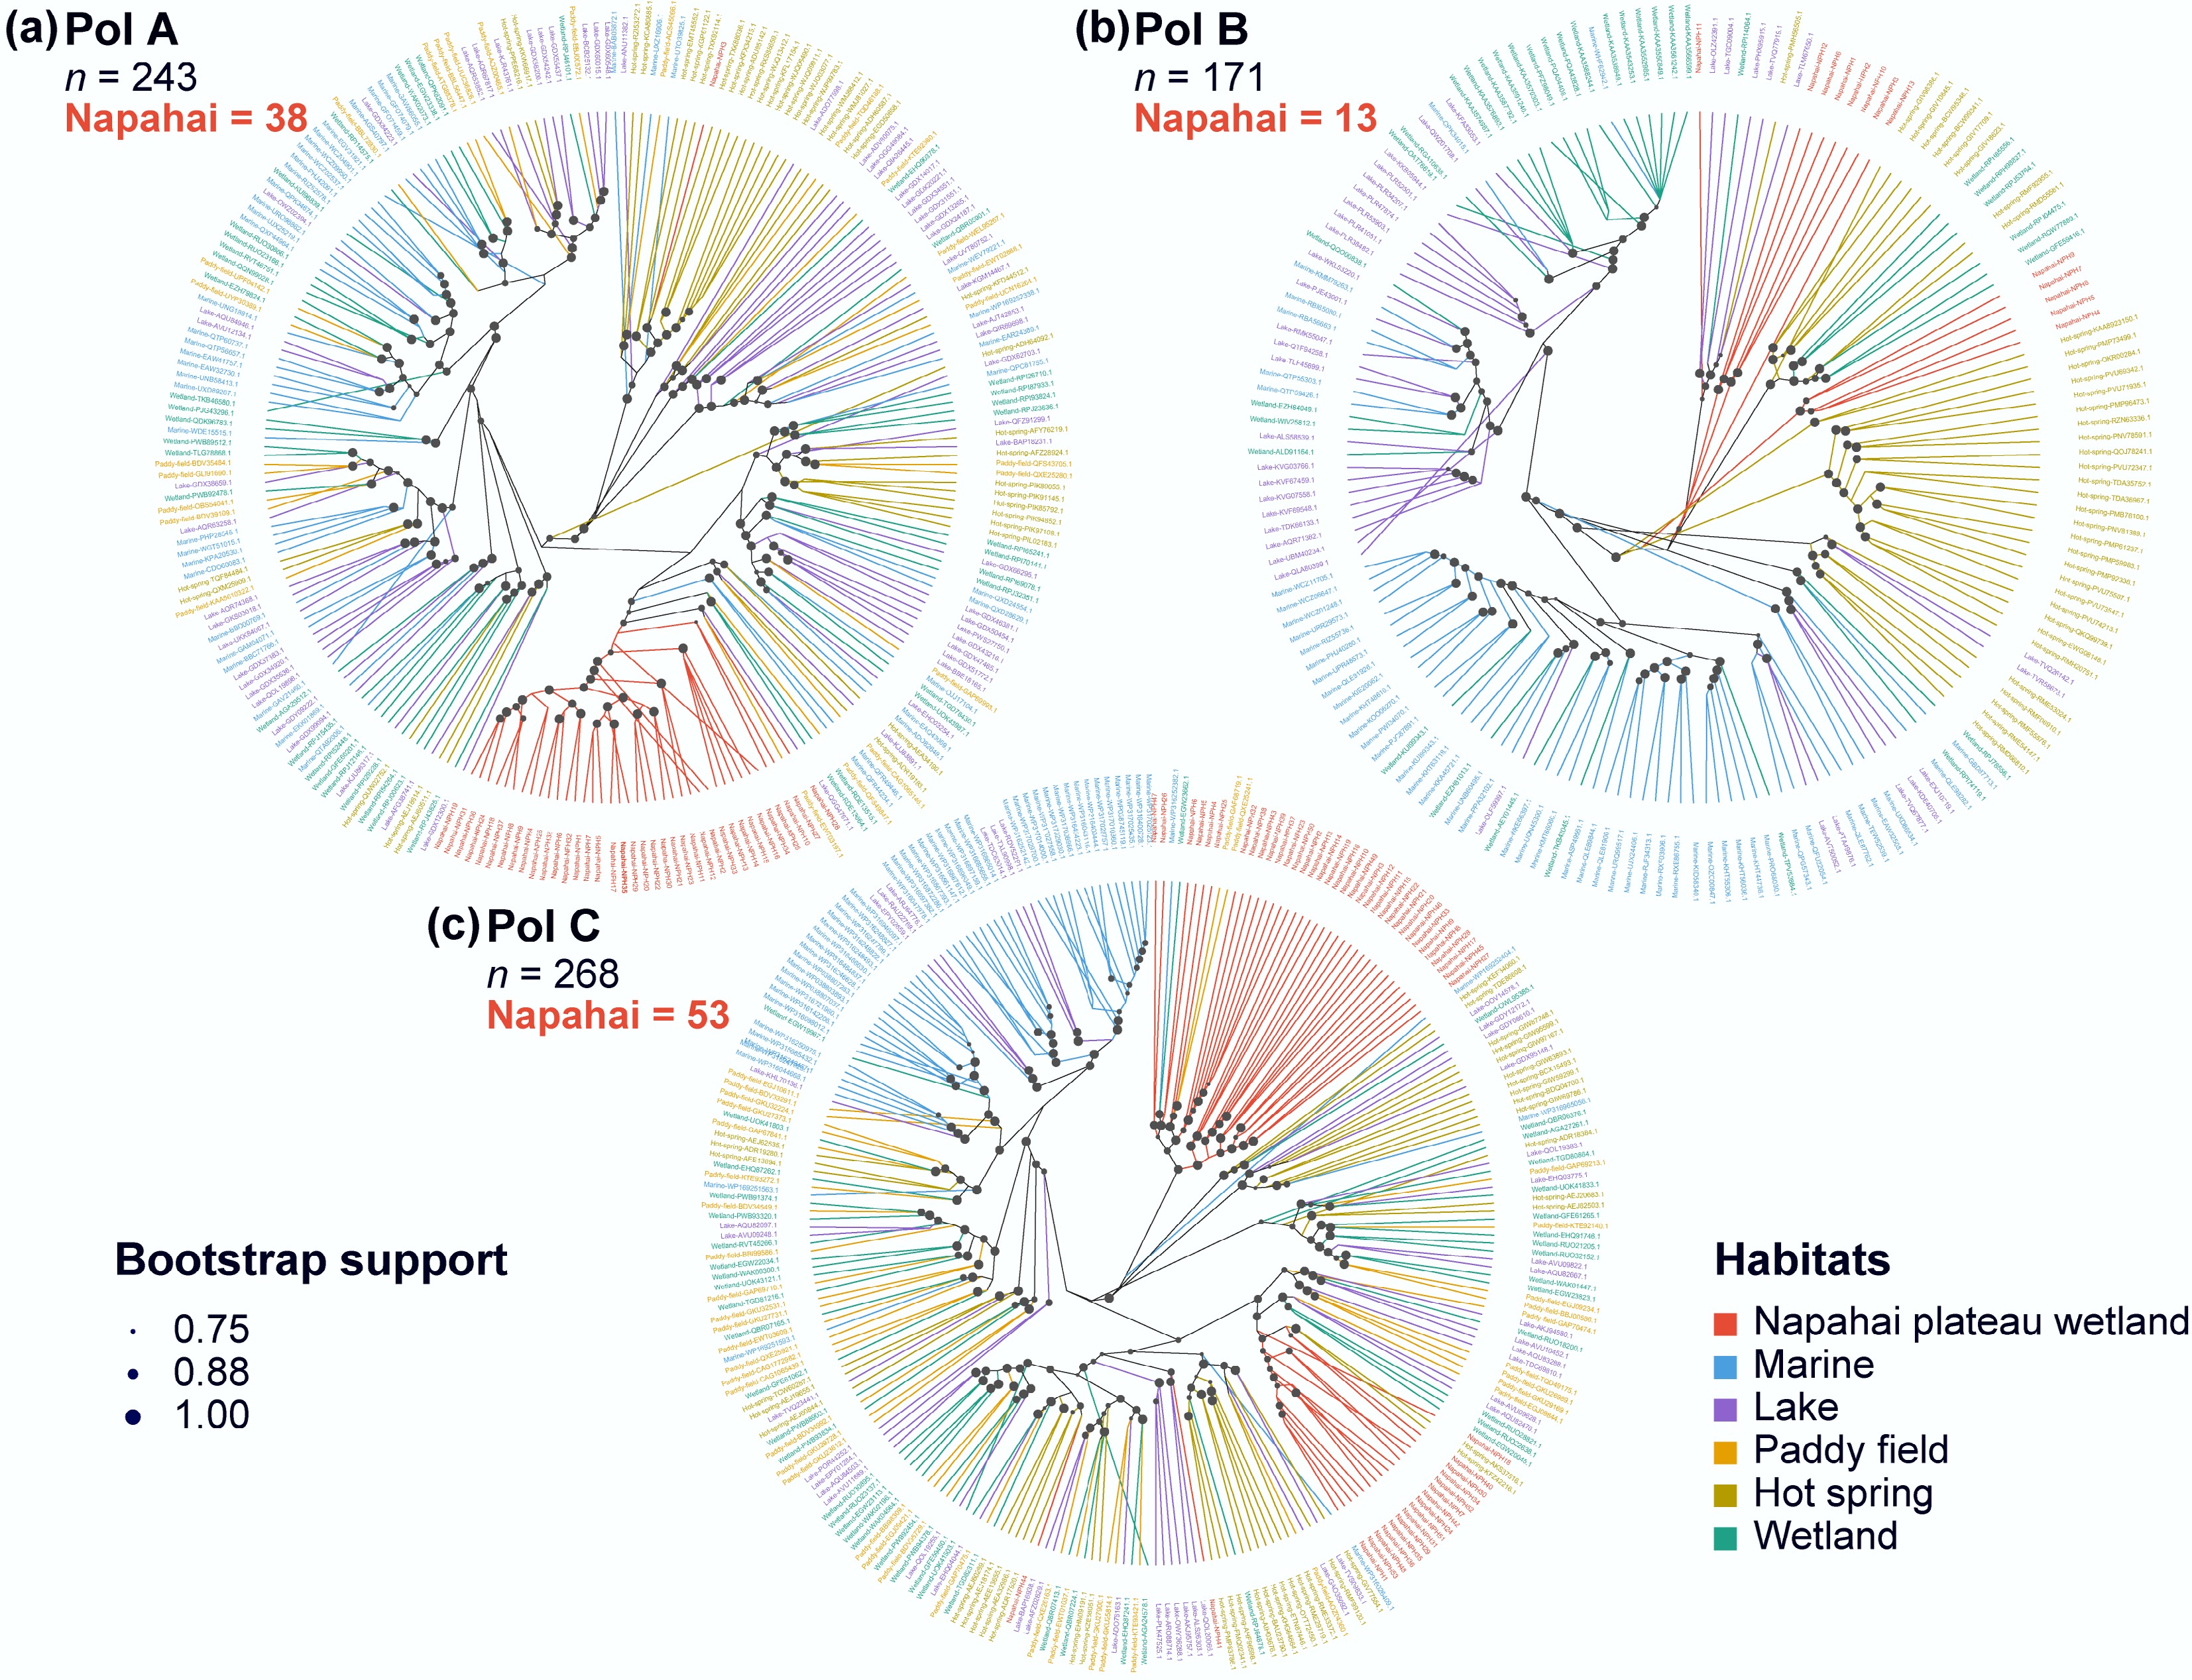
Figure 1.
Phylogenetic analysis of DNA polymerase (Pol) across diverse habitats. The phylogenetic trees of (a) PolA, (b) PolB, and (c) PolC family genes, with different colors representing different habitats.
-
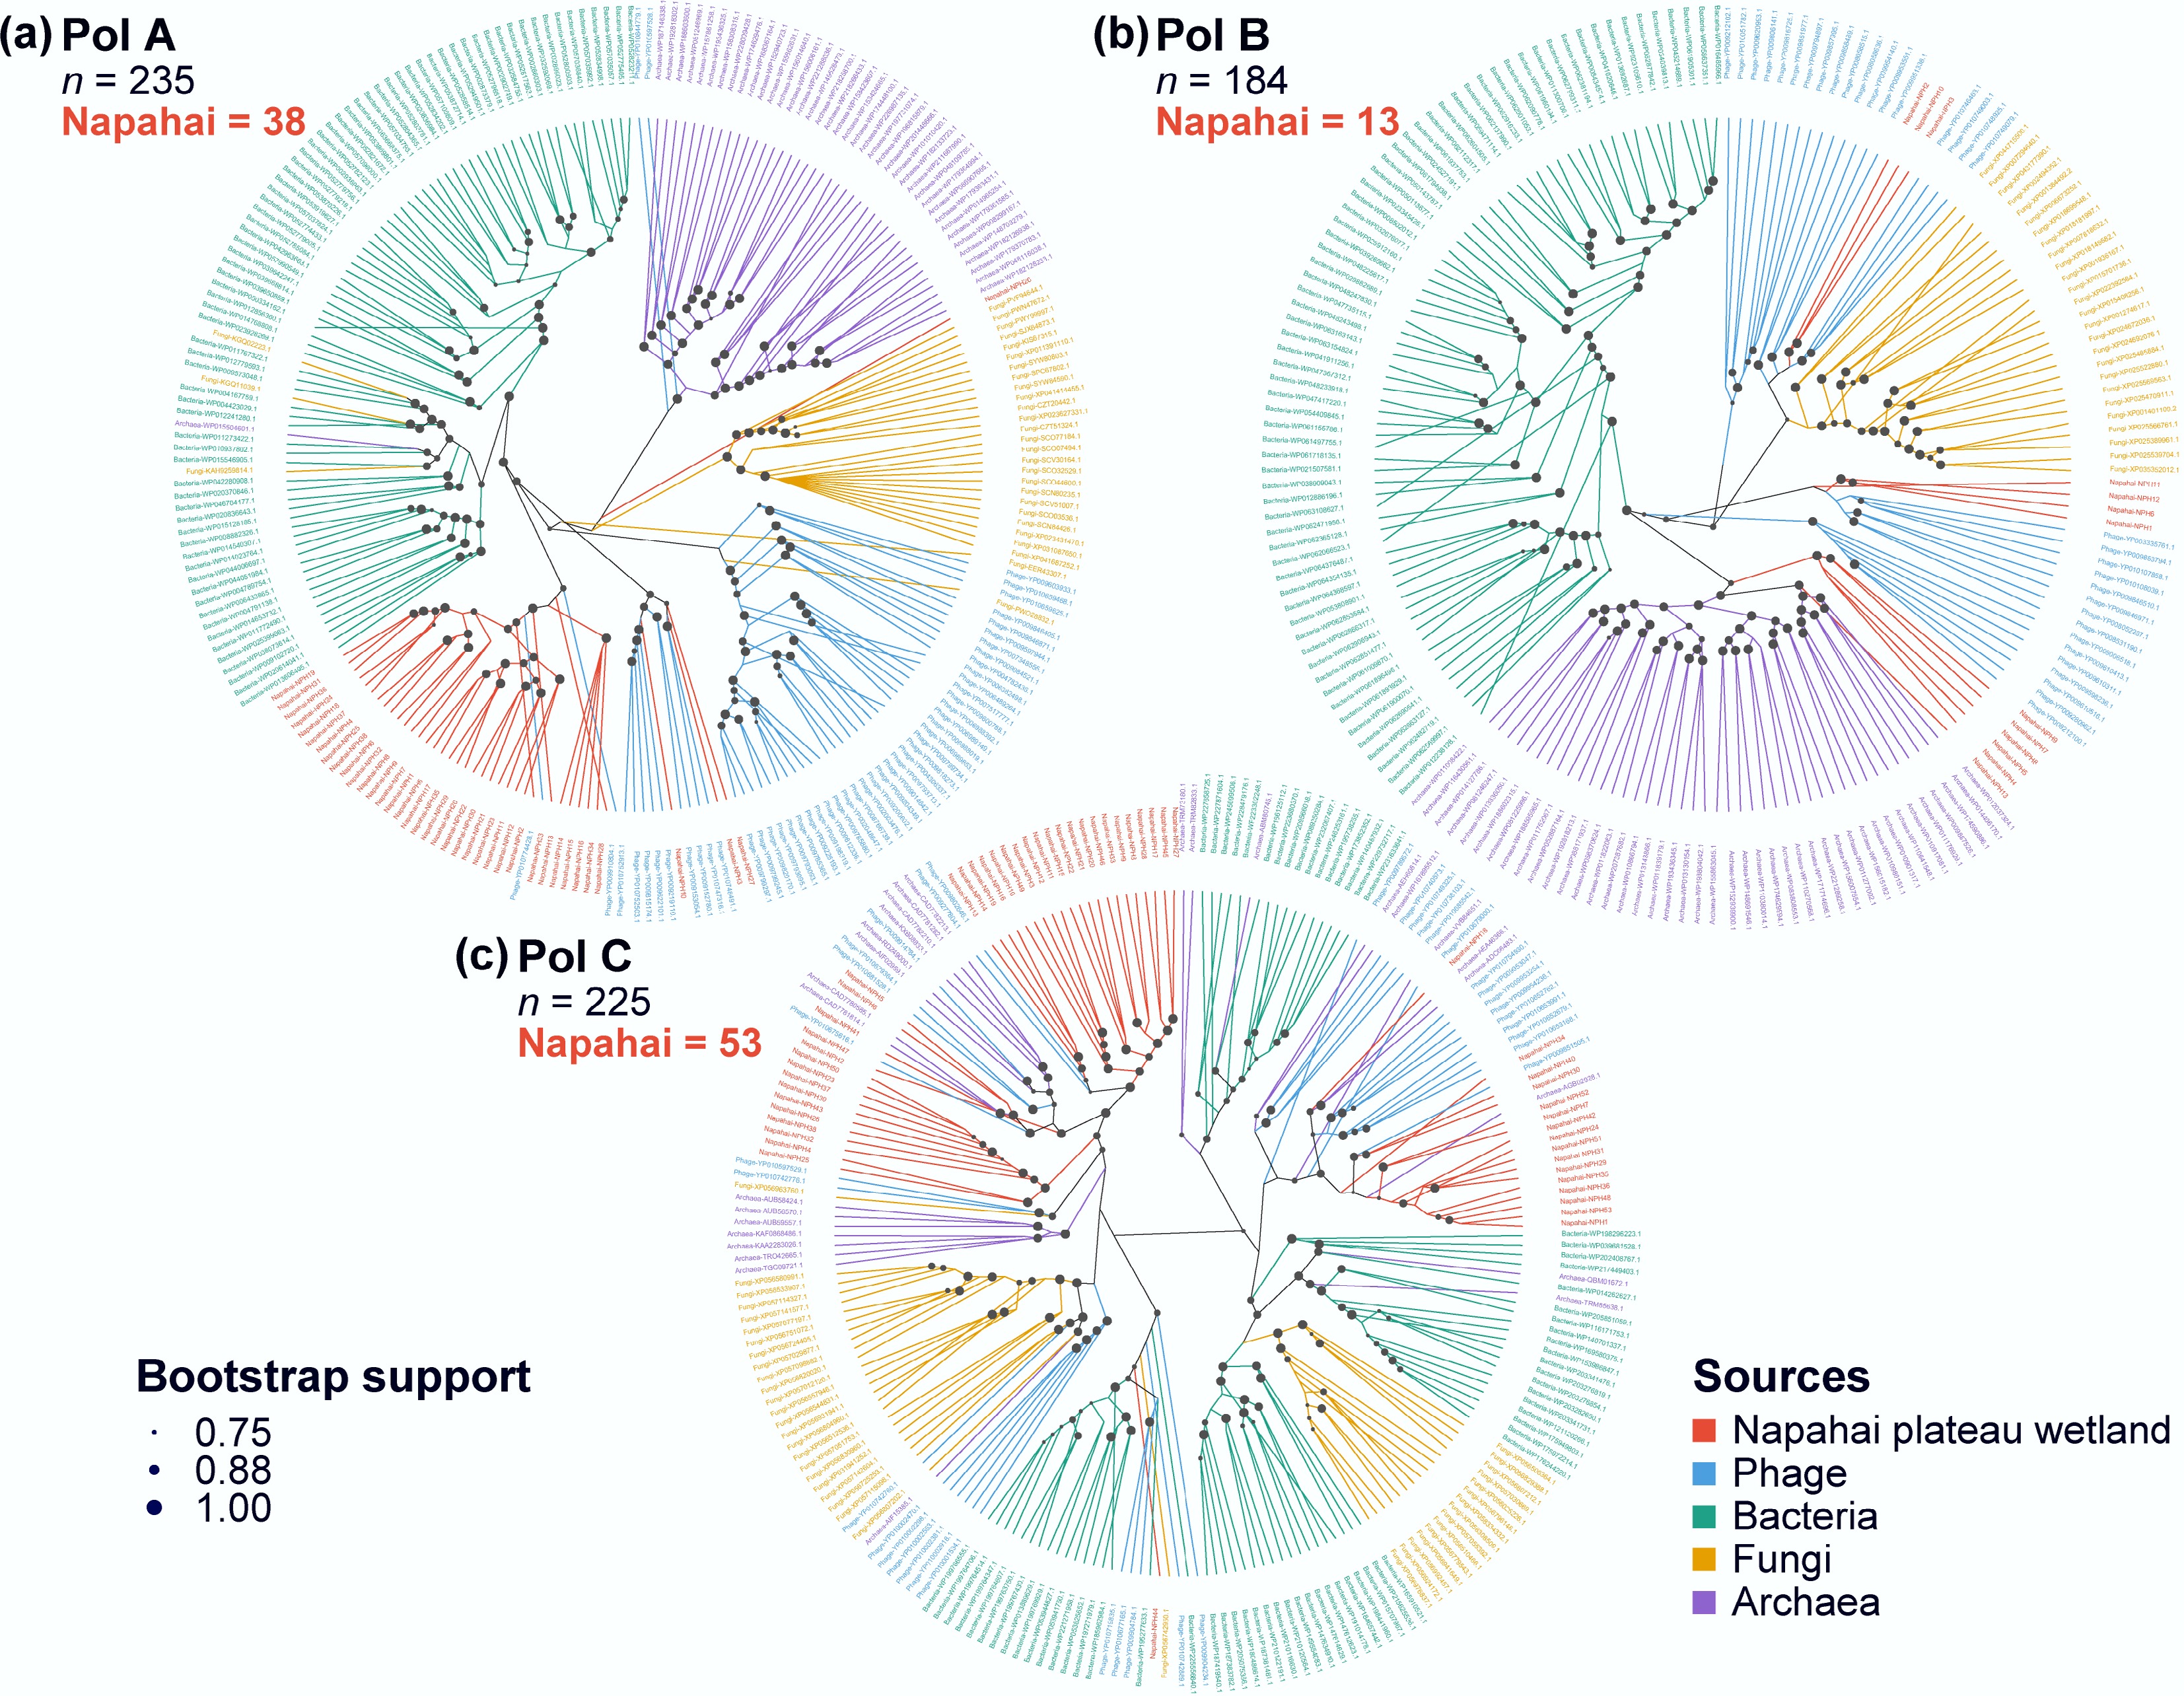
Figure 2.
Phylogenetic analysis of DNA polymerases from different sources. Phylogenetic trees of (a) PolA, (b) PolB, and (c) PolC family genes, with different colors indicating different sources.
-
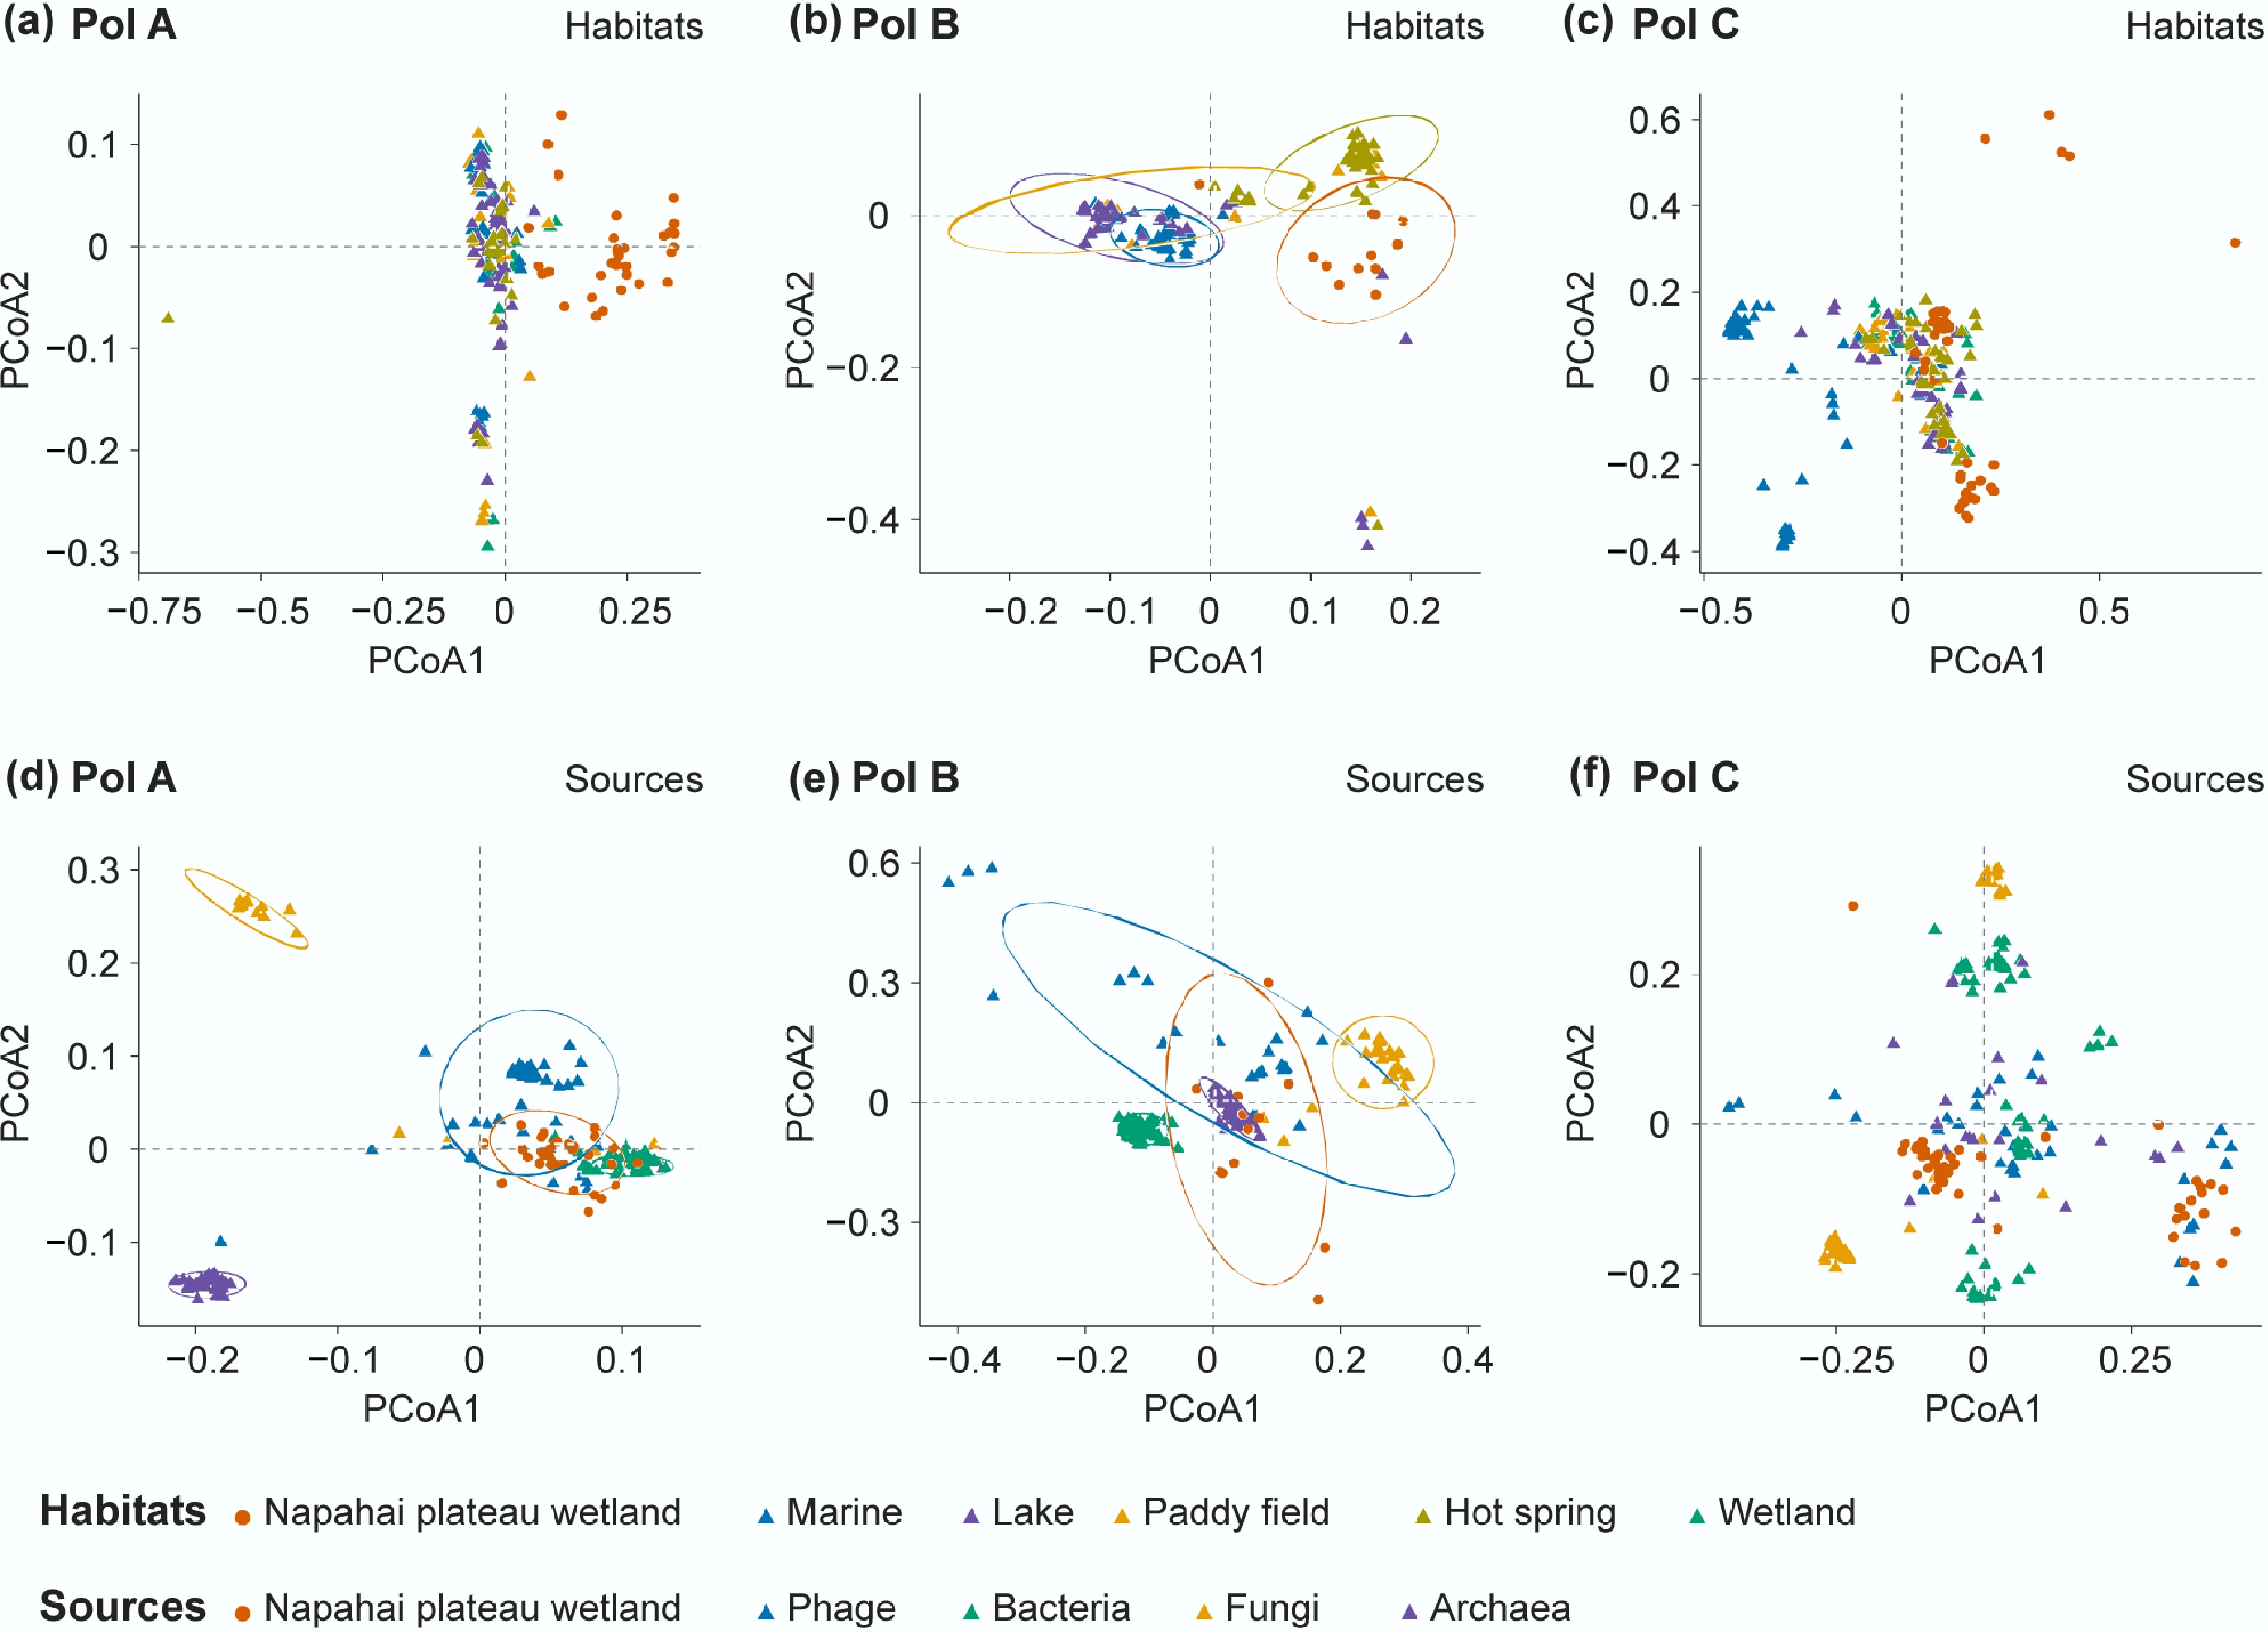
Figure 3.
Principal coordinate analysis of DNA polymerase genes in the Napahai plateau wetland. Panels (a) and (d) present the PCoA for PolA family genes from different habitats and different origins. Panels (b) and (e) present the PCoA for PolB family genes from different habitats and different origins. Panels (c) and (f) present the PCoA for PolC family genes from different habitats and different origins.
-
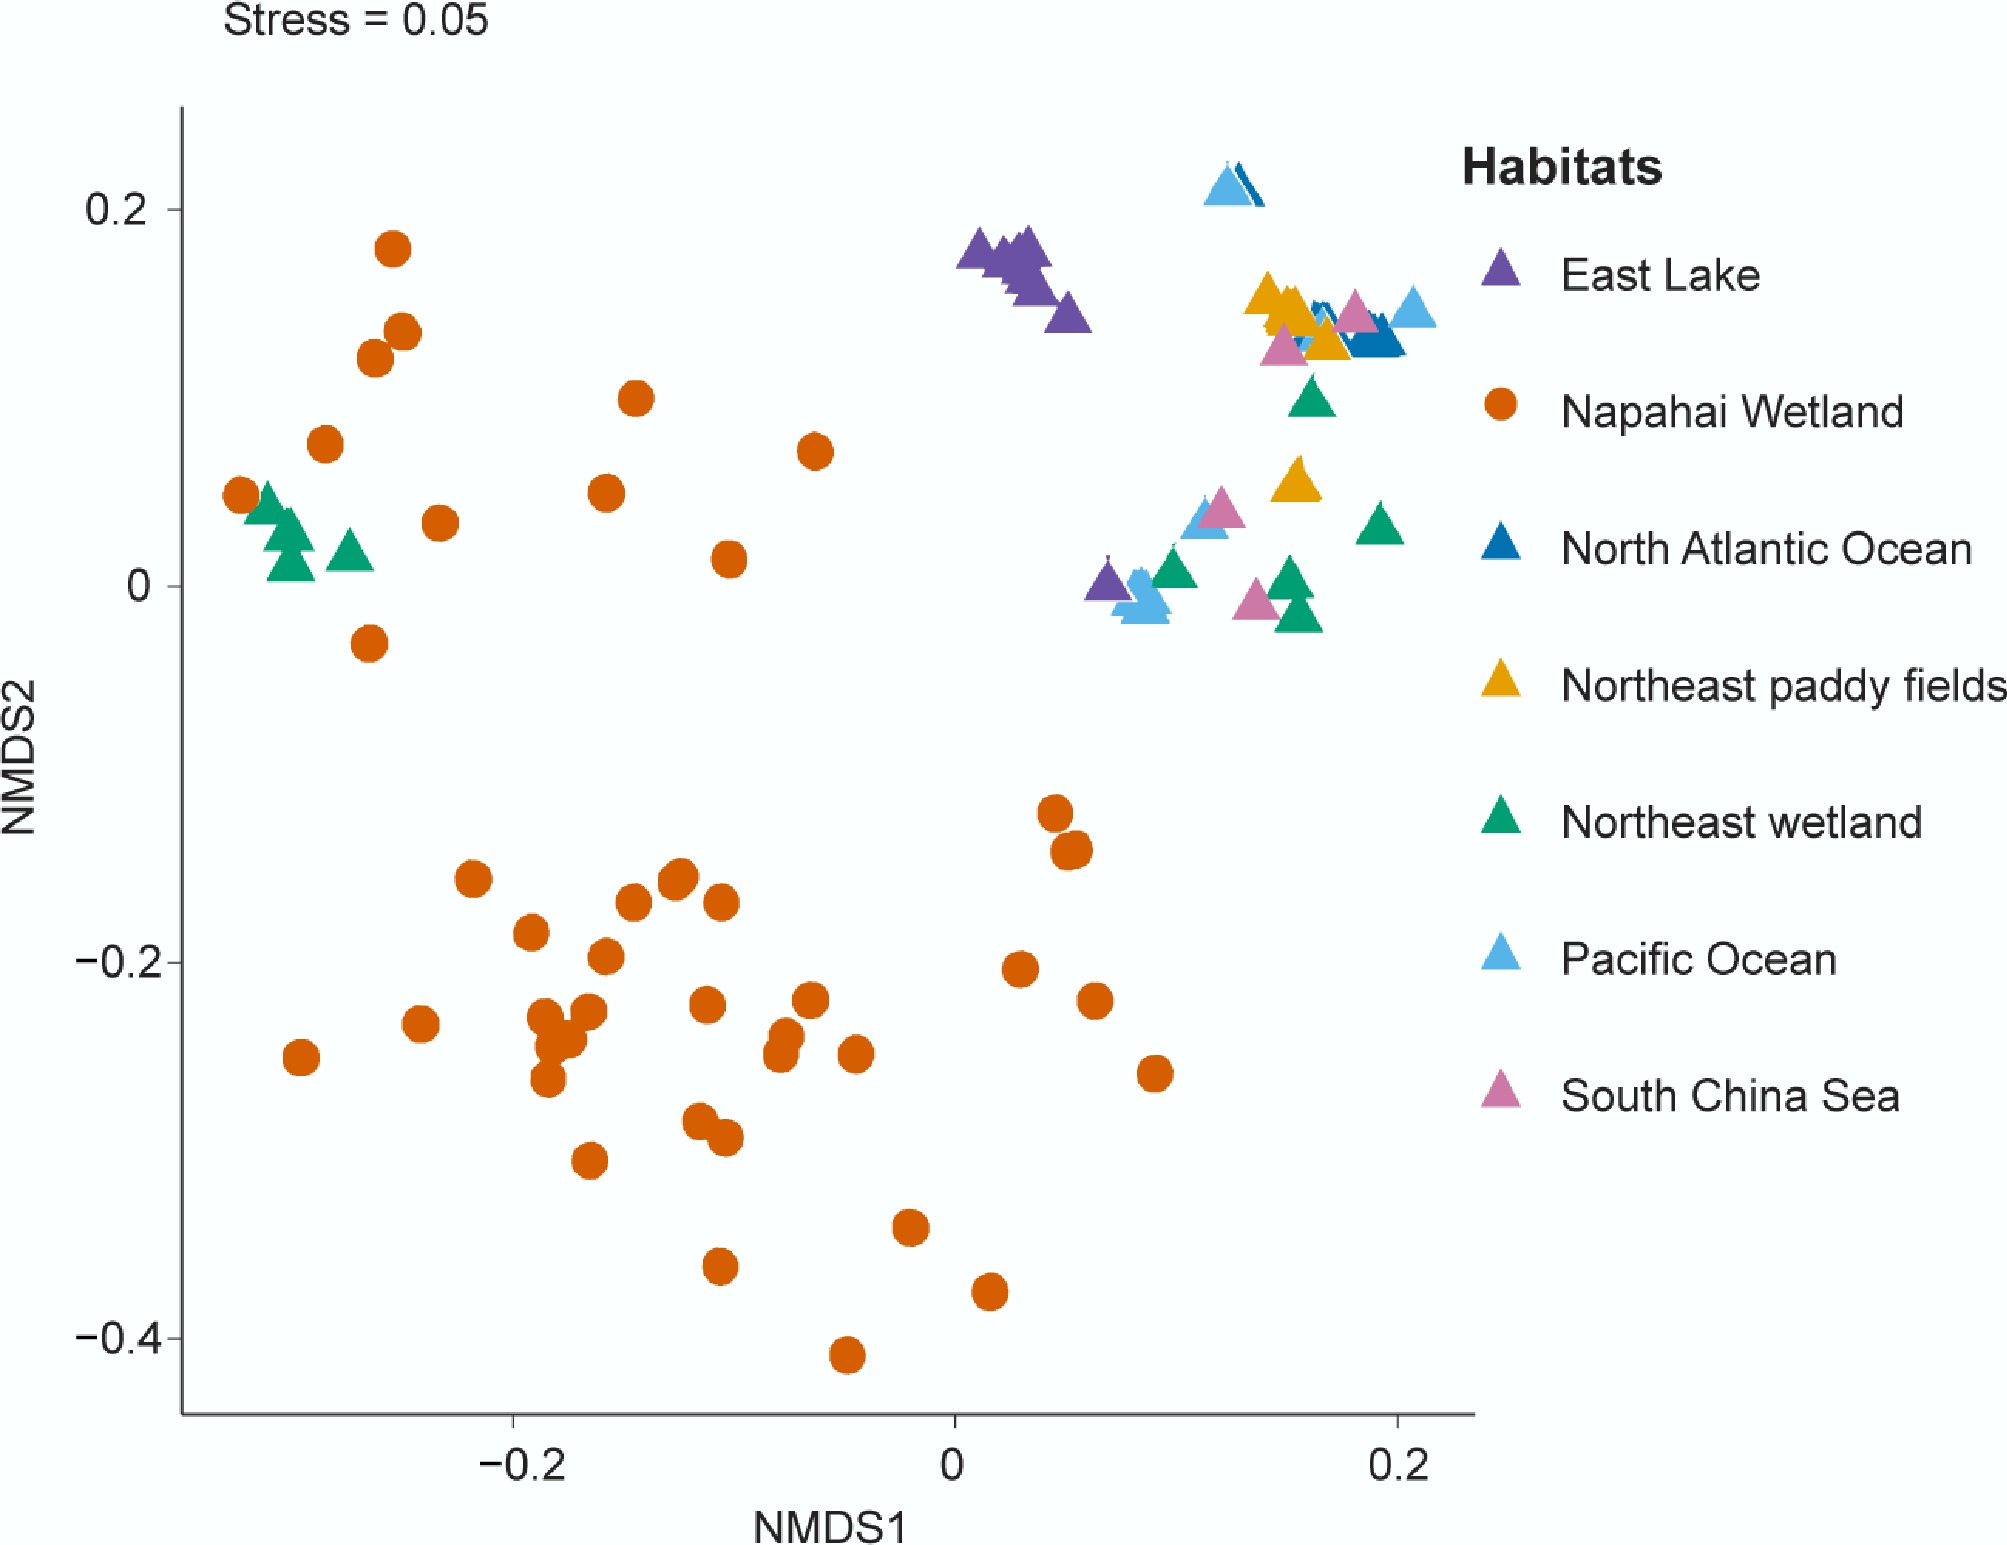
Figure 4.
NMDS analysis of DNA polymerase genes from different habitats. The stress value (0.0545949) and R2 (0.973878) indicate a reliable ordination configuration.
Figures
(4)
Tables
(0)