-
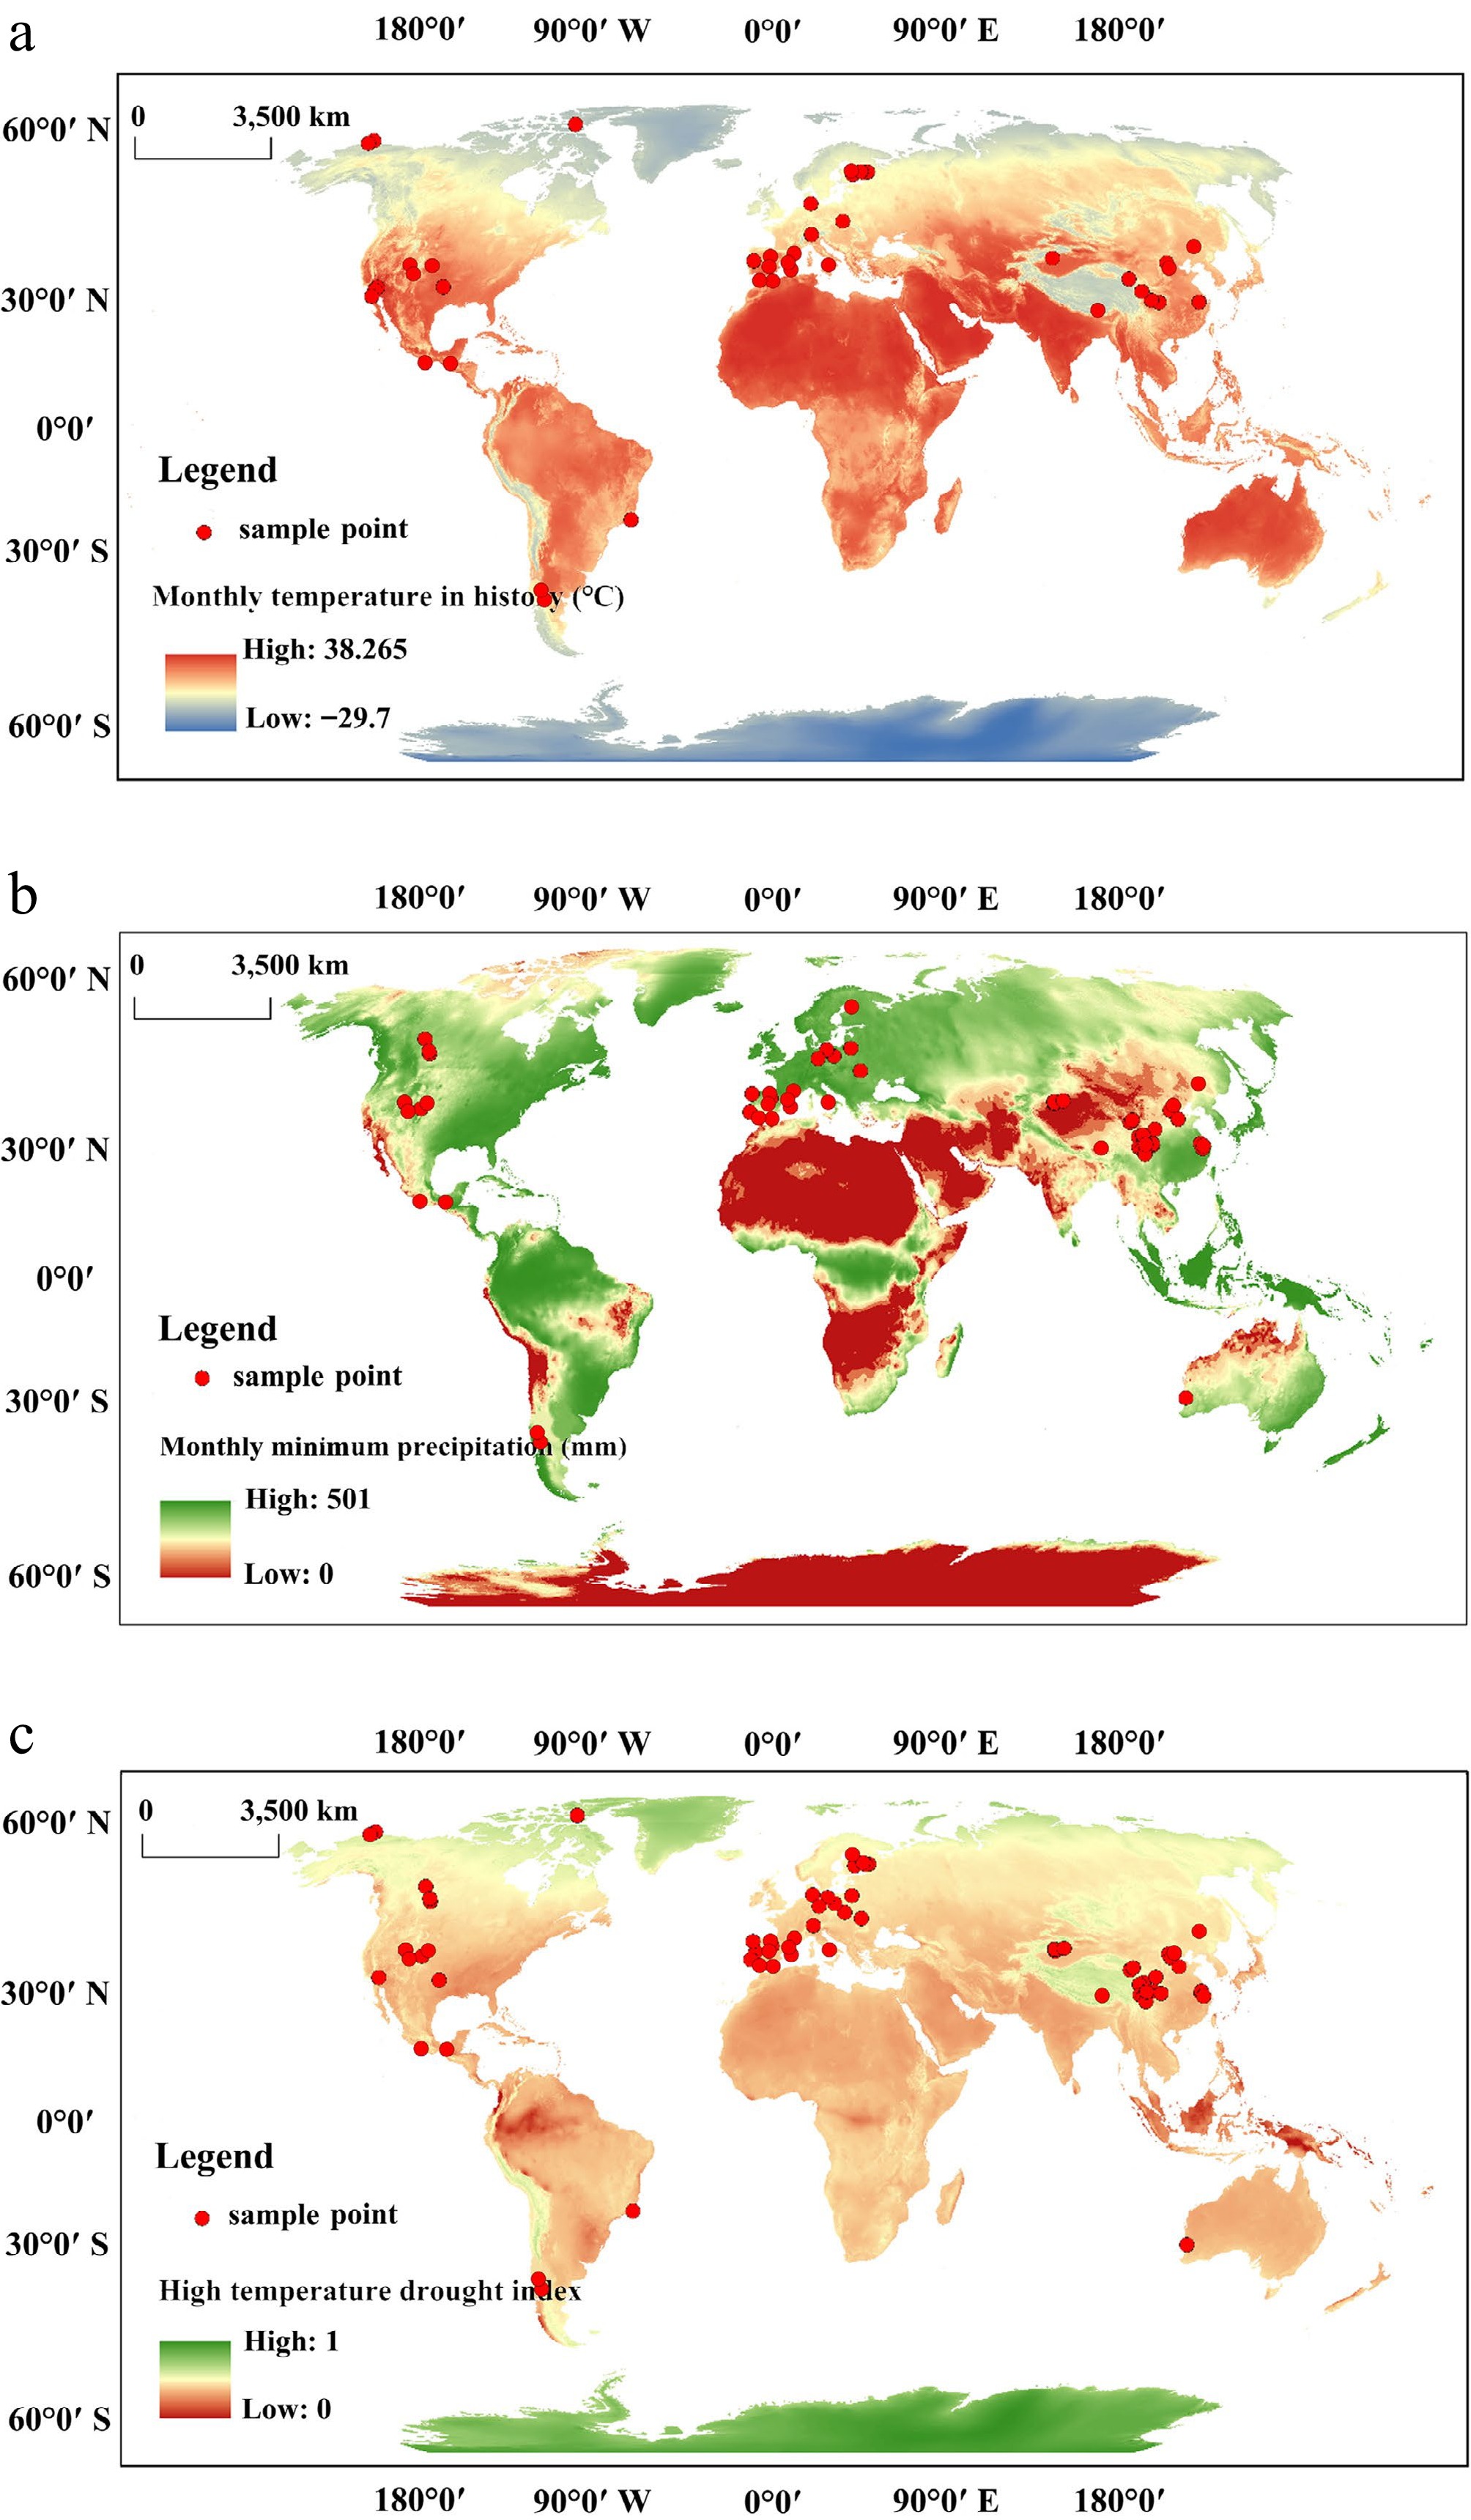
Figure 1.
Geographic distribution of experimental and observational study sites investigating sexual dimorphism in dioecious plants' responses to warming, drought, and combined warming and drought stress across global terrestrial ecosystems. Background climate data represent (a) monthly temperature (historical) (°C) and (b) monthly minimum precipitation (mm) and (c) high temperature drought index calculated from monthly temperature and precipitation data. Red dots indicate sample points.
-
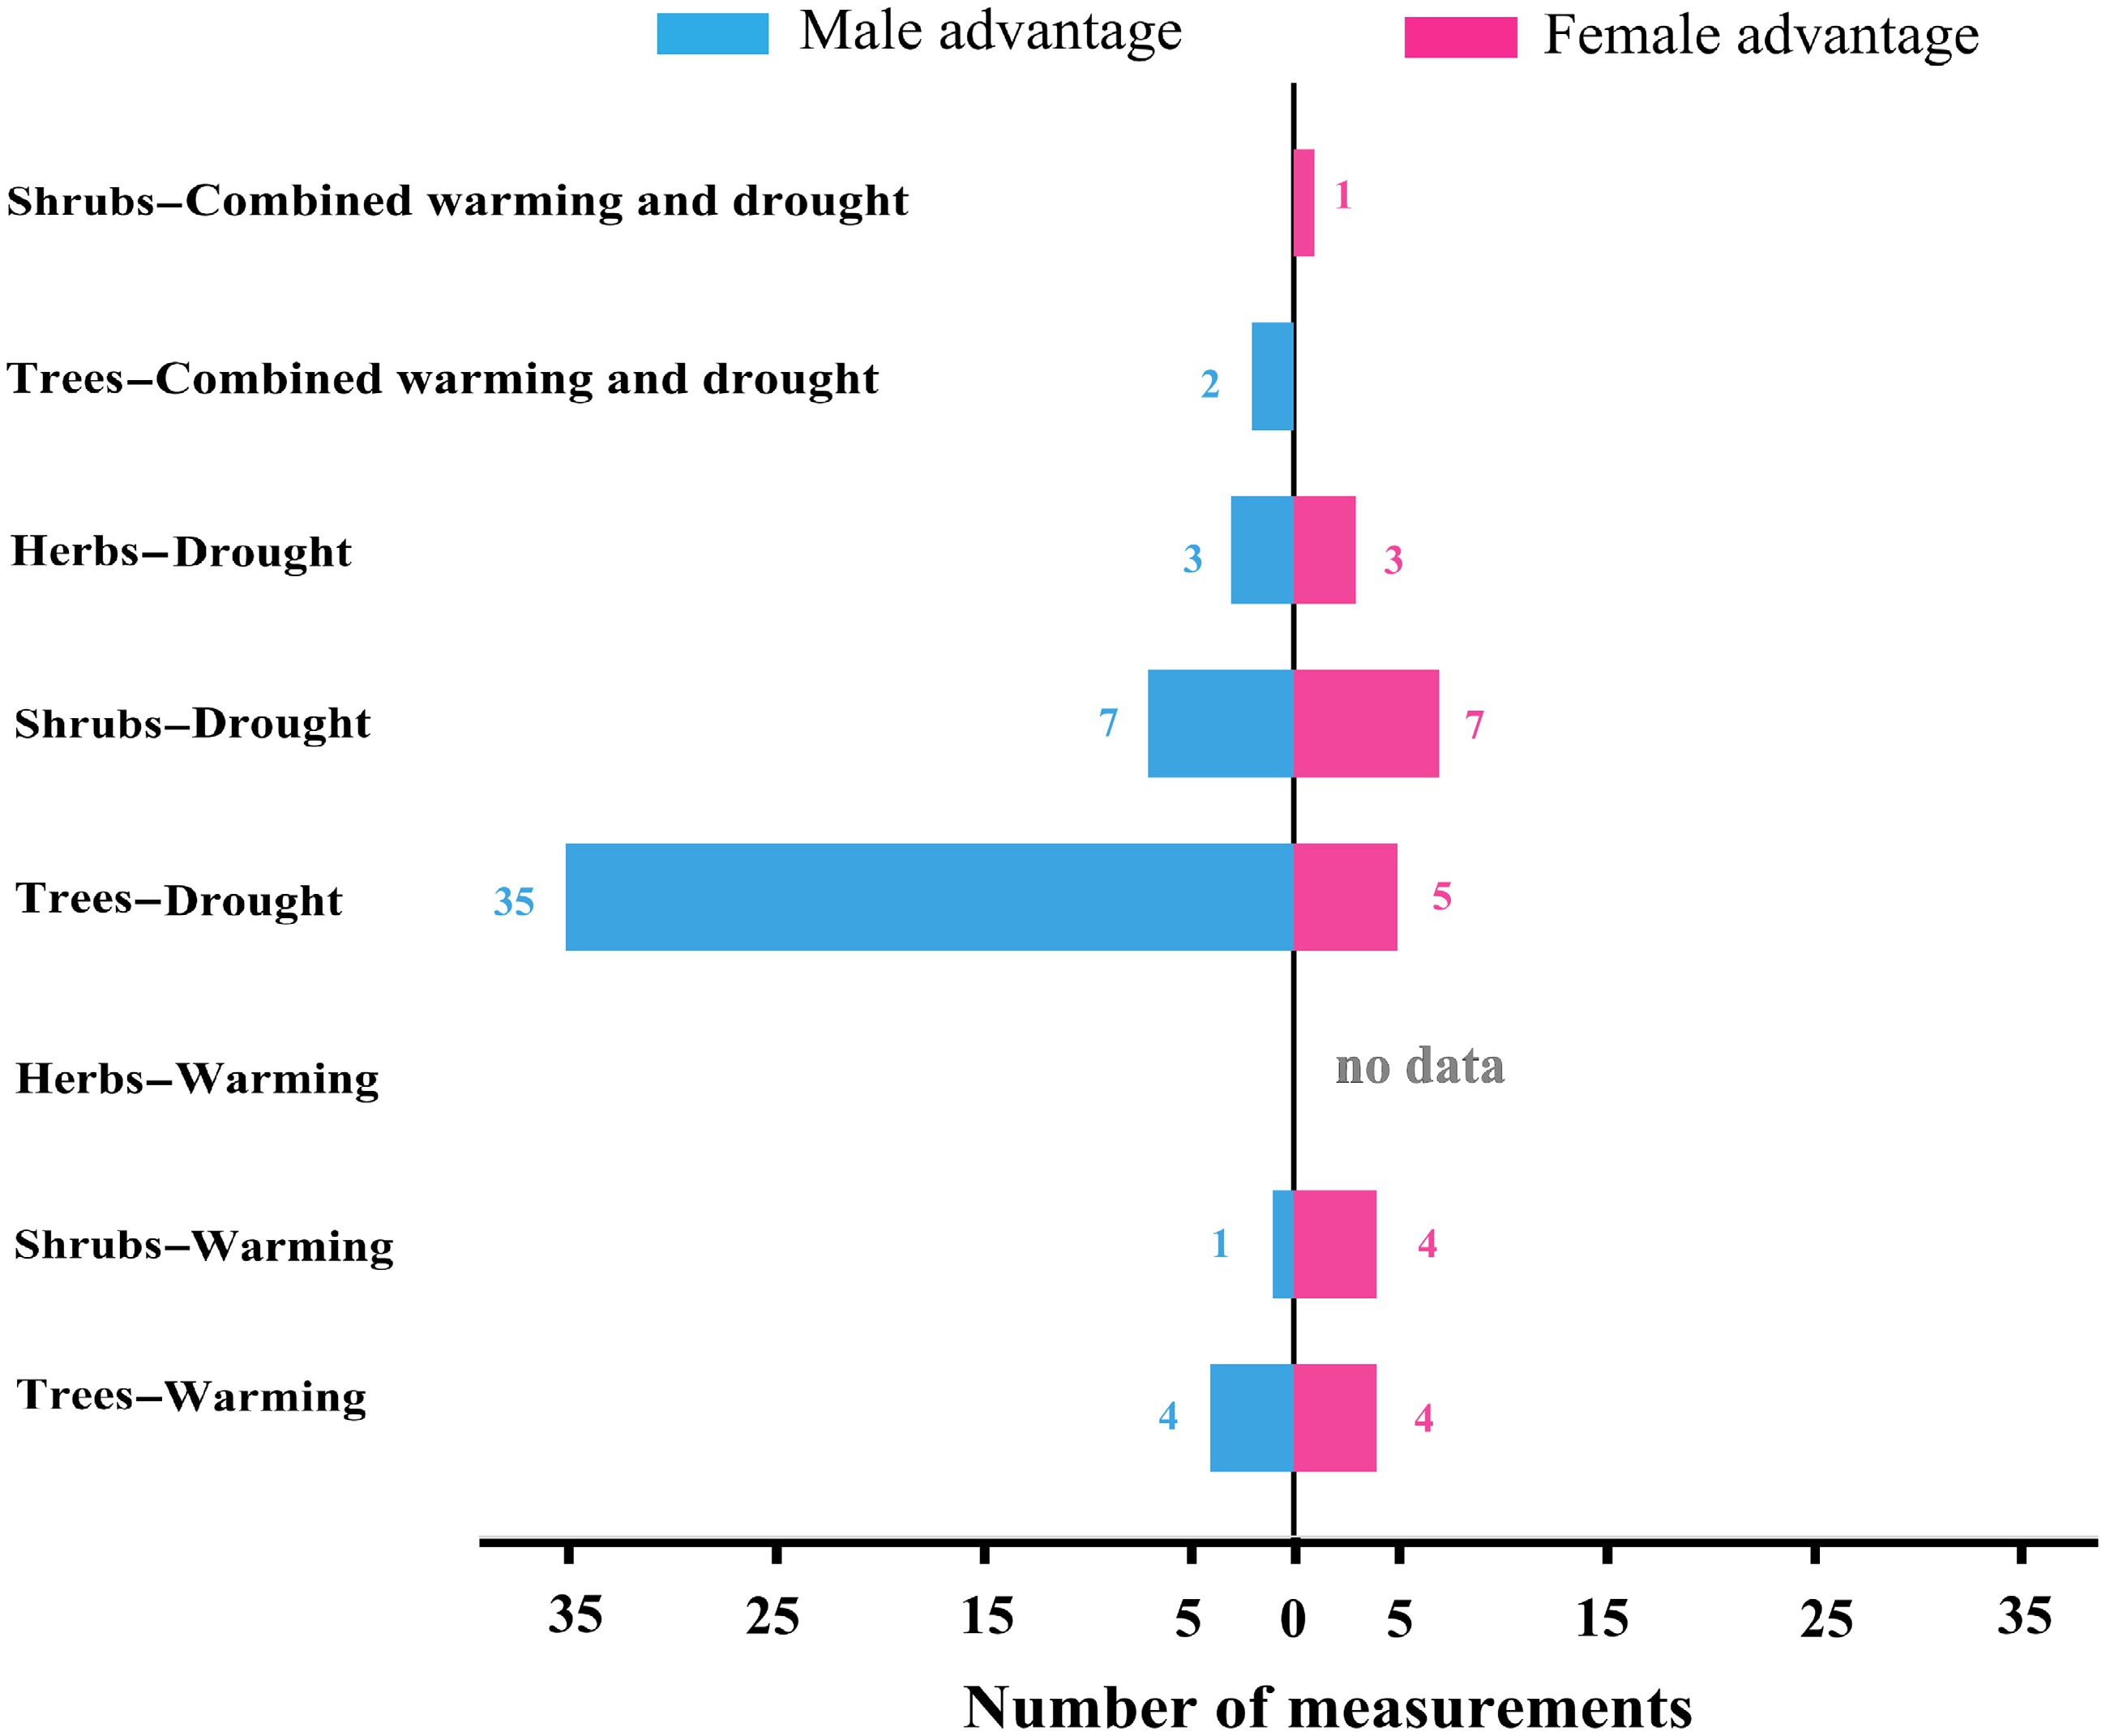
Figure 2.
Vote-counting summary of the direction of sex-specific responses across the three life forms (trees, shrubs herbs) and three stress types (warming alone, drought alone or combined warming and drought). Bars extending to the left (blue) and right (pink) of the central axis indicate the number of measurements showing male advantage and female advantage, respectively, for each life form × stress type combination. The numerals beside the bars give the exact counts. "No data" indicates that no eligible herbaceous warming study was retrieved.
-
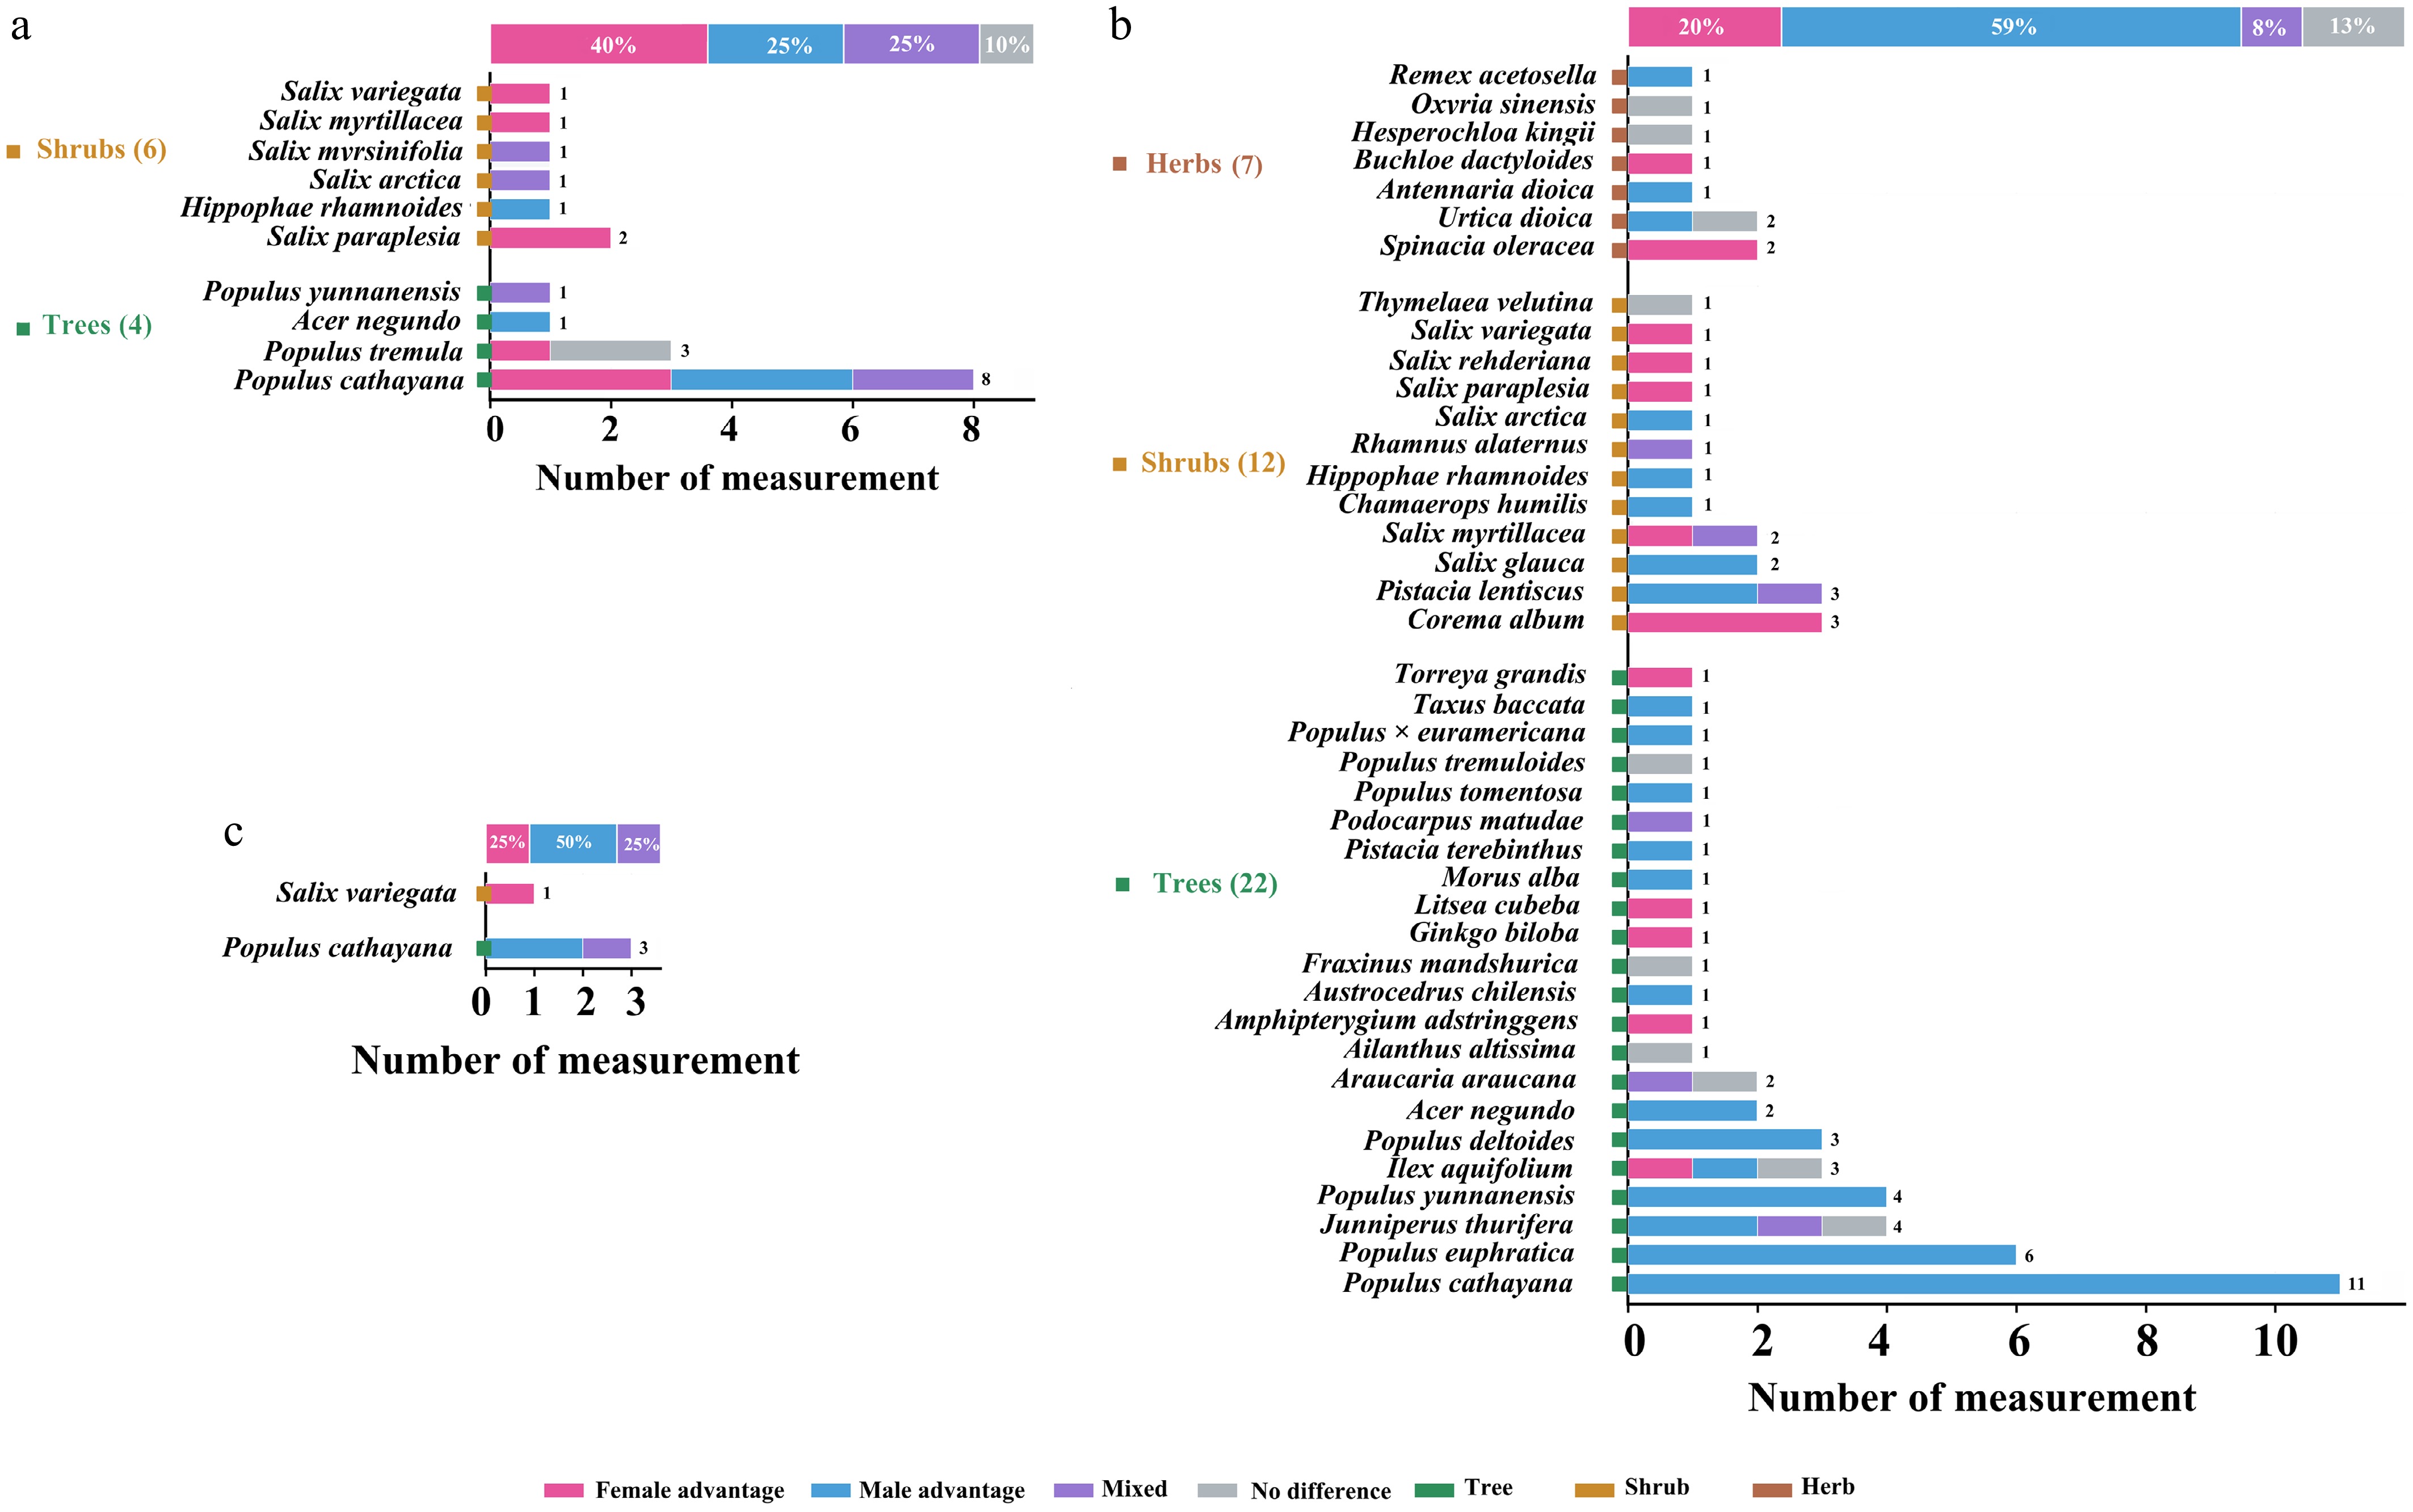
Figure 3.
Species-level synthesis of the direction of sex-specific responses under (a) drought alone, (b) warming alone and (c) combined warming and drought stress. Each horizontal stacked bar represents one species, with the segments' colors denoting the number of measurements coded as female advantage (pink), male advantage (blue), mixed (purple) or no significant difference (grey); the total number of measurements per species is shown at the end of each bar. Colored squares group species by life form (green, trees; orange, shrubs; brown, herbs), and the percentage bars above Panels (a) and (b) and within Panel (c) summarize the overall proportion of measurements in each response category for the corresponding stress type.
-
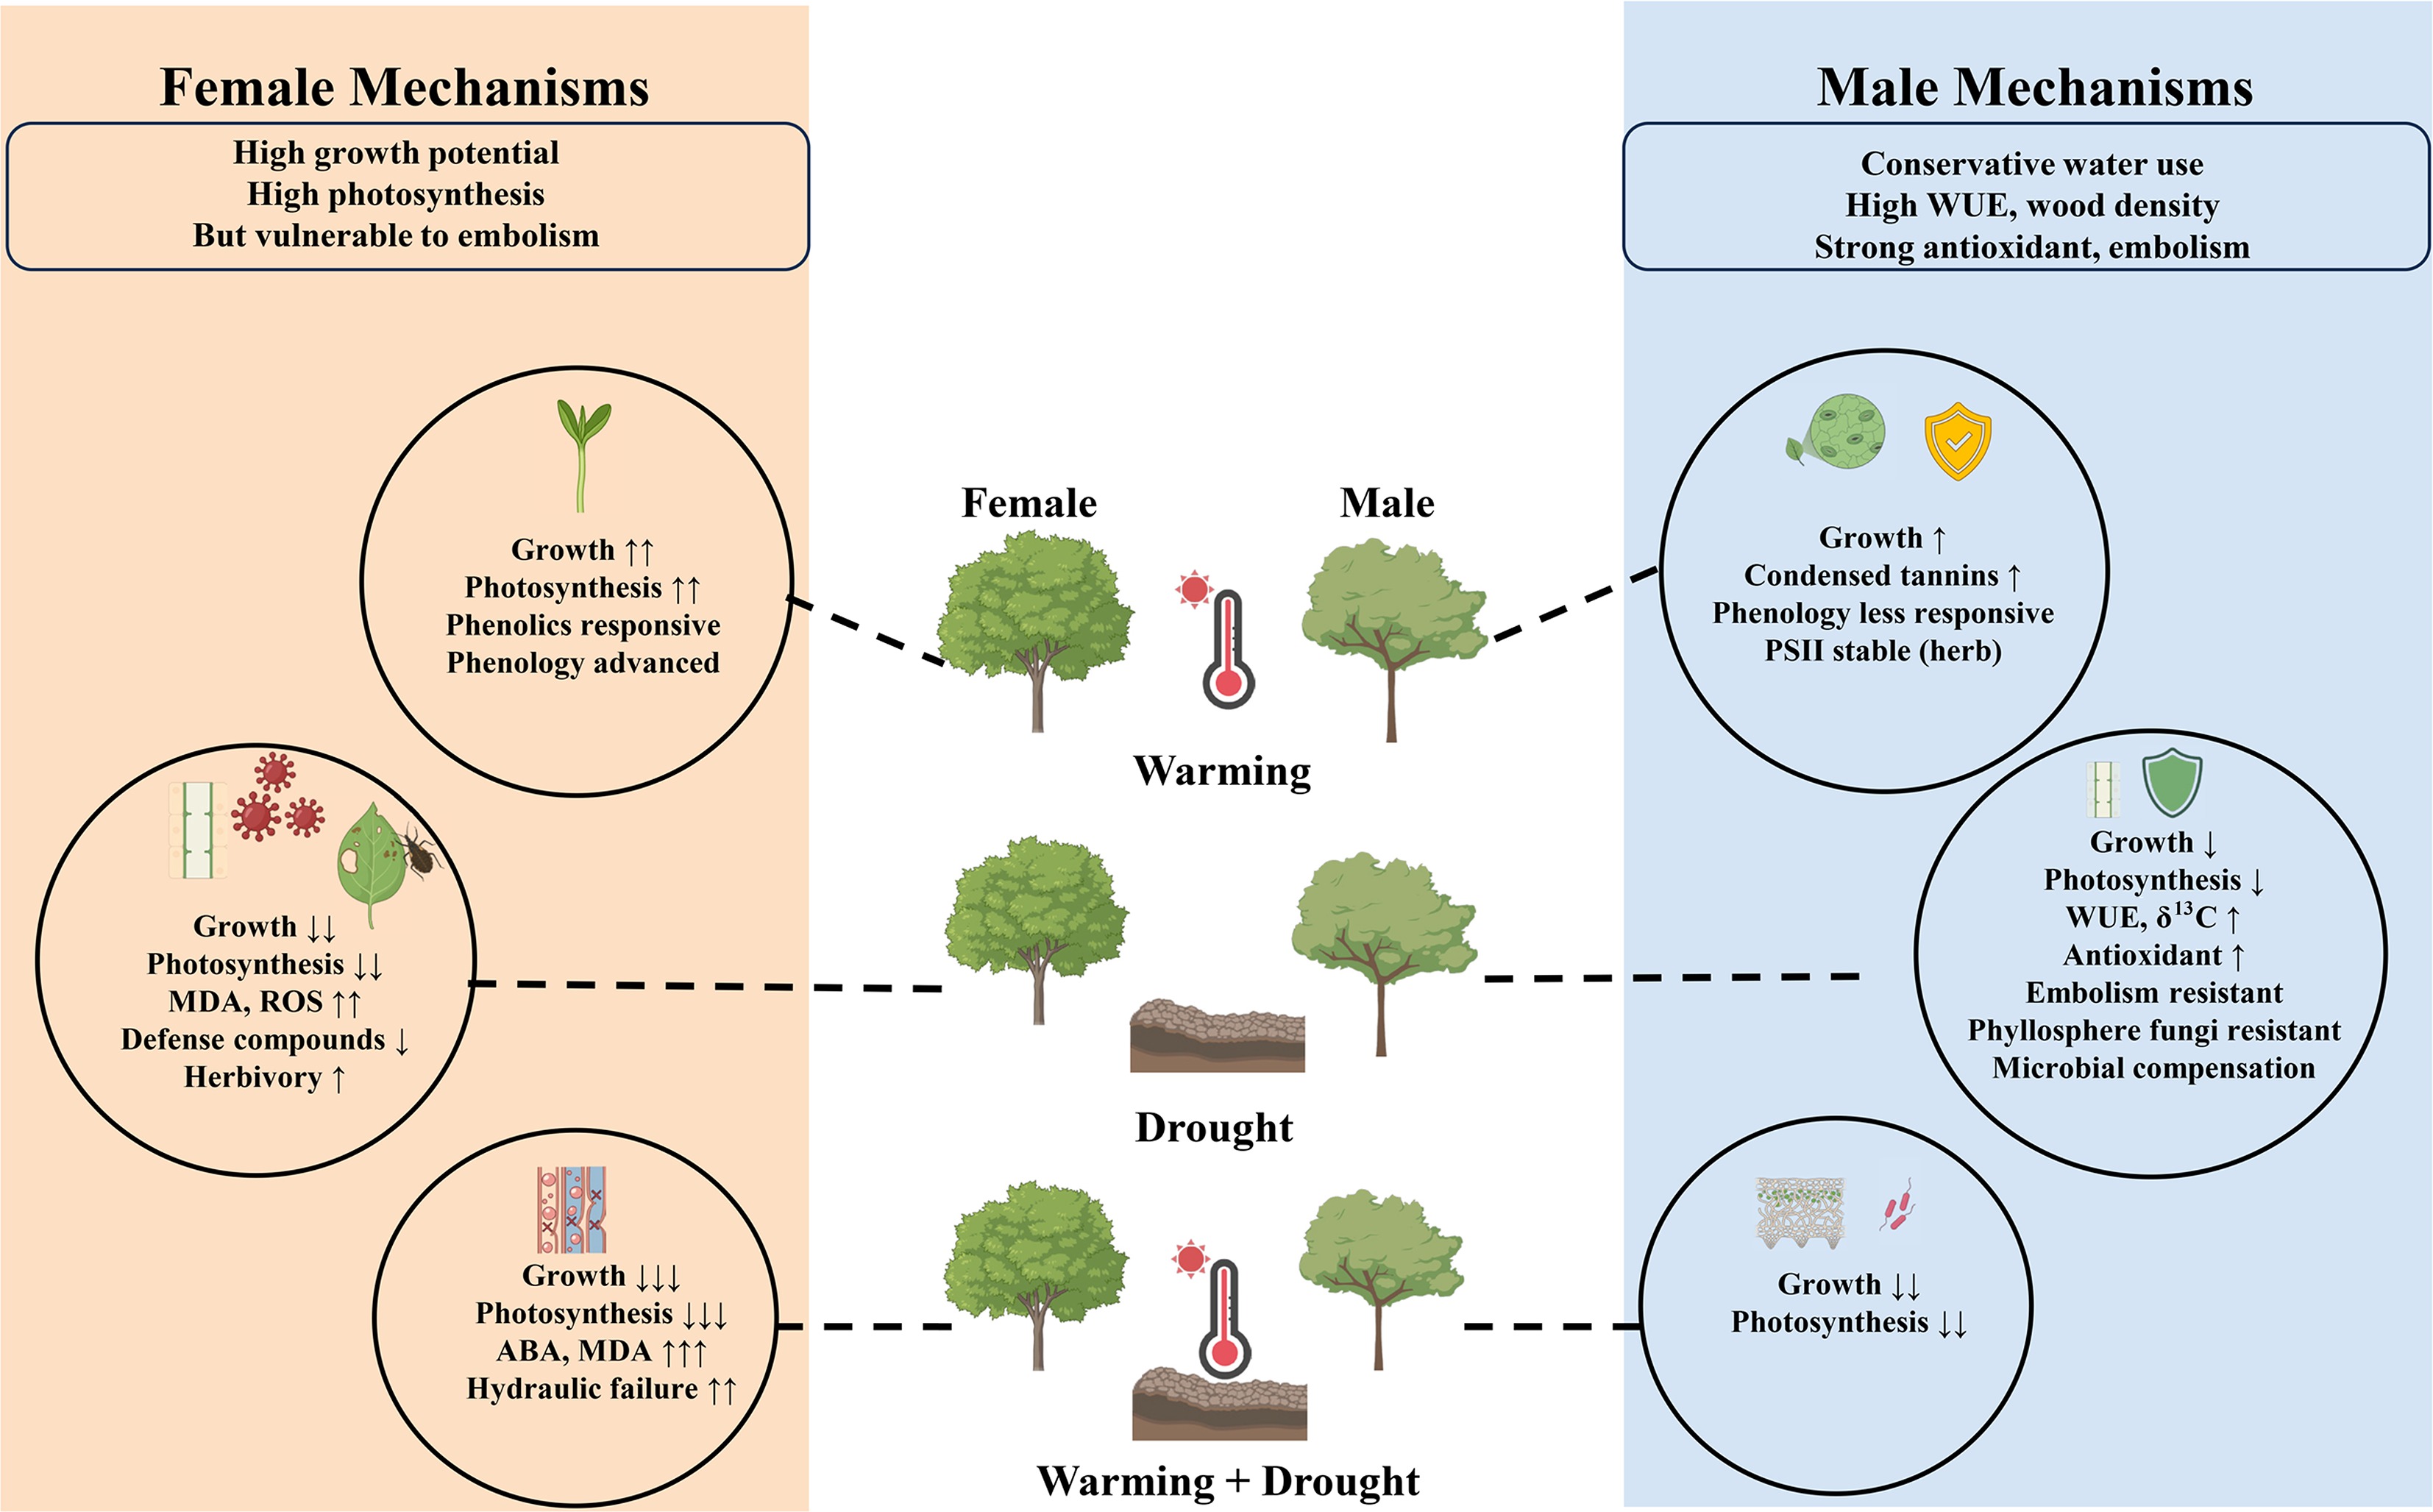
Figure 4.
Conceptual diagram of sex-specific responses of dioecious plants to warming alone, drought alone, and combined warming and drought stress. The diagram integrates the core strategic differences between sexes (see legend) and summarizes the dominant response patterns across the three stress scenarios.
-
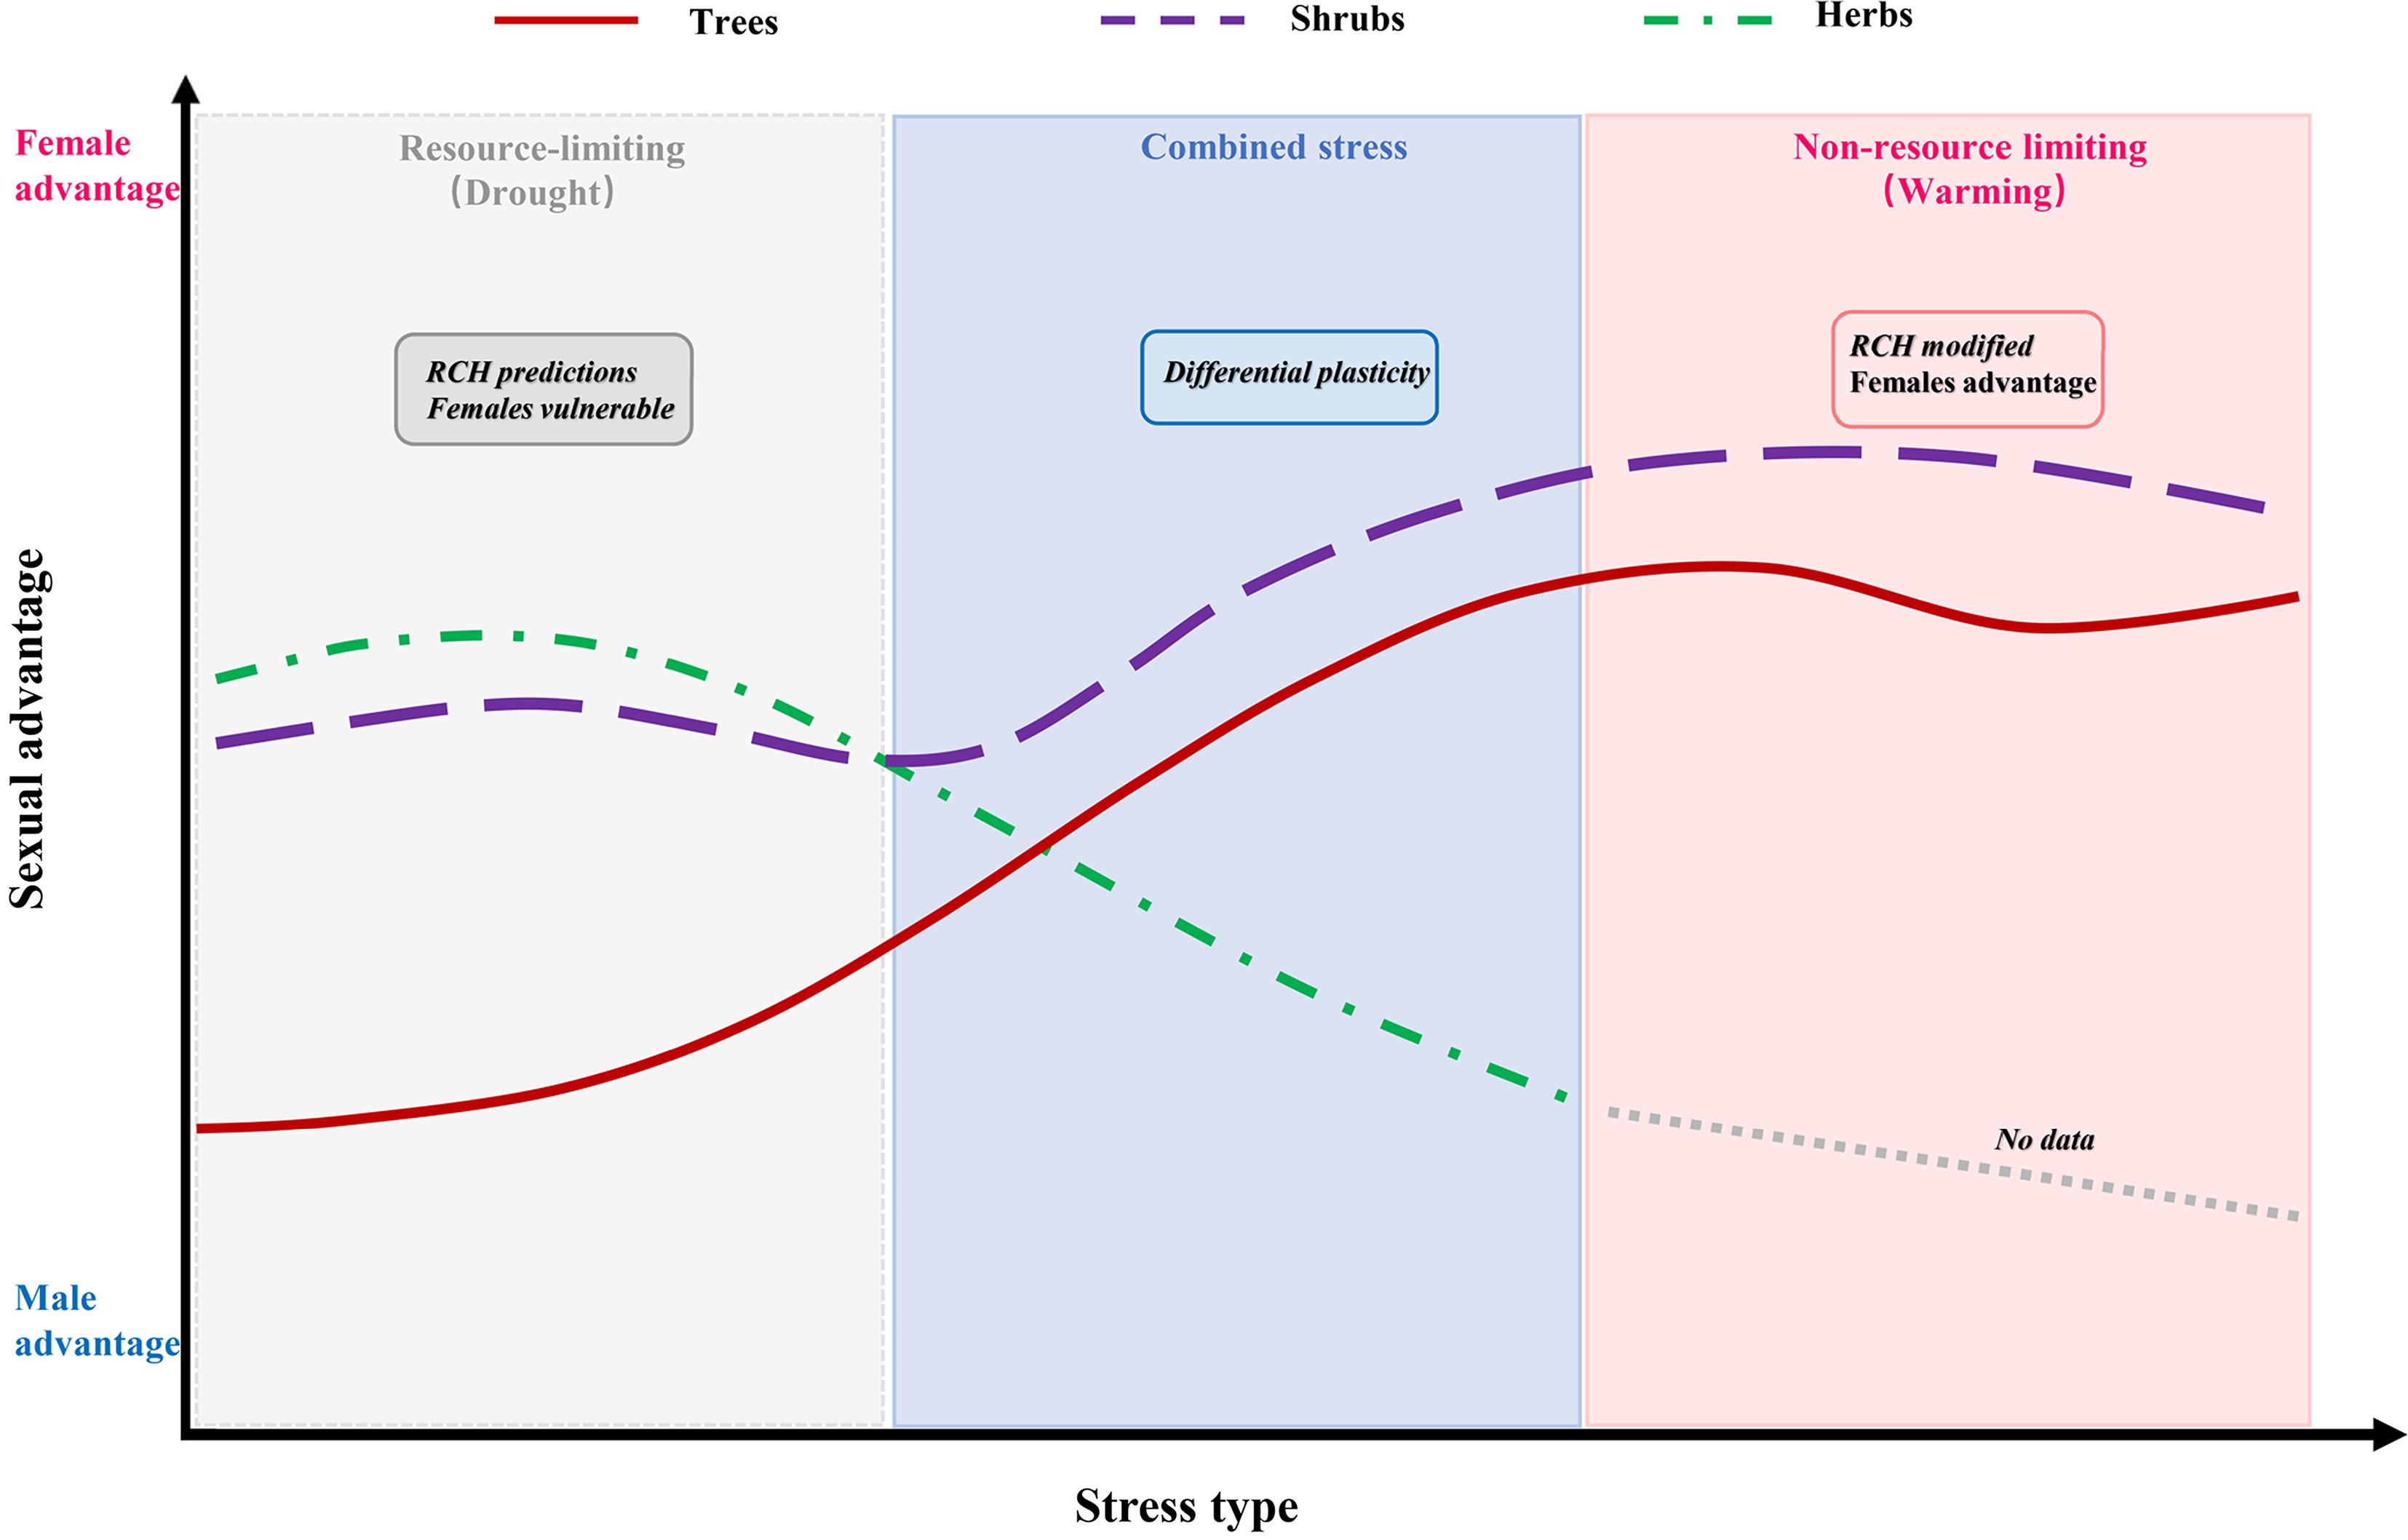
Figure 5.
An integrative framework depicting how the coupling of stress type, resource currency specialization, and life history strategy determines the direction of sex-specific advantages in dioecious plants, revealing the applicability boundary of the RCH.
Figures
(5)
Tables
(0)