-
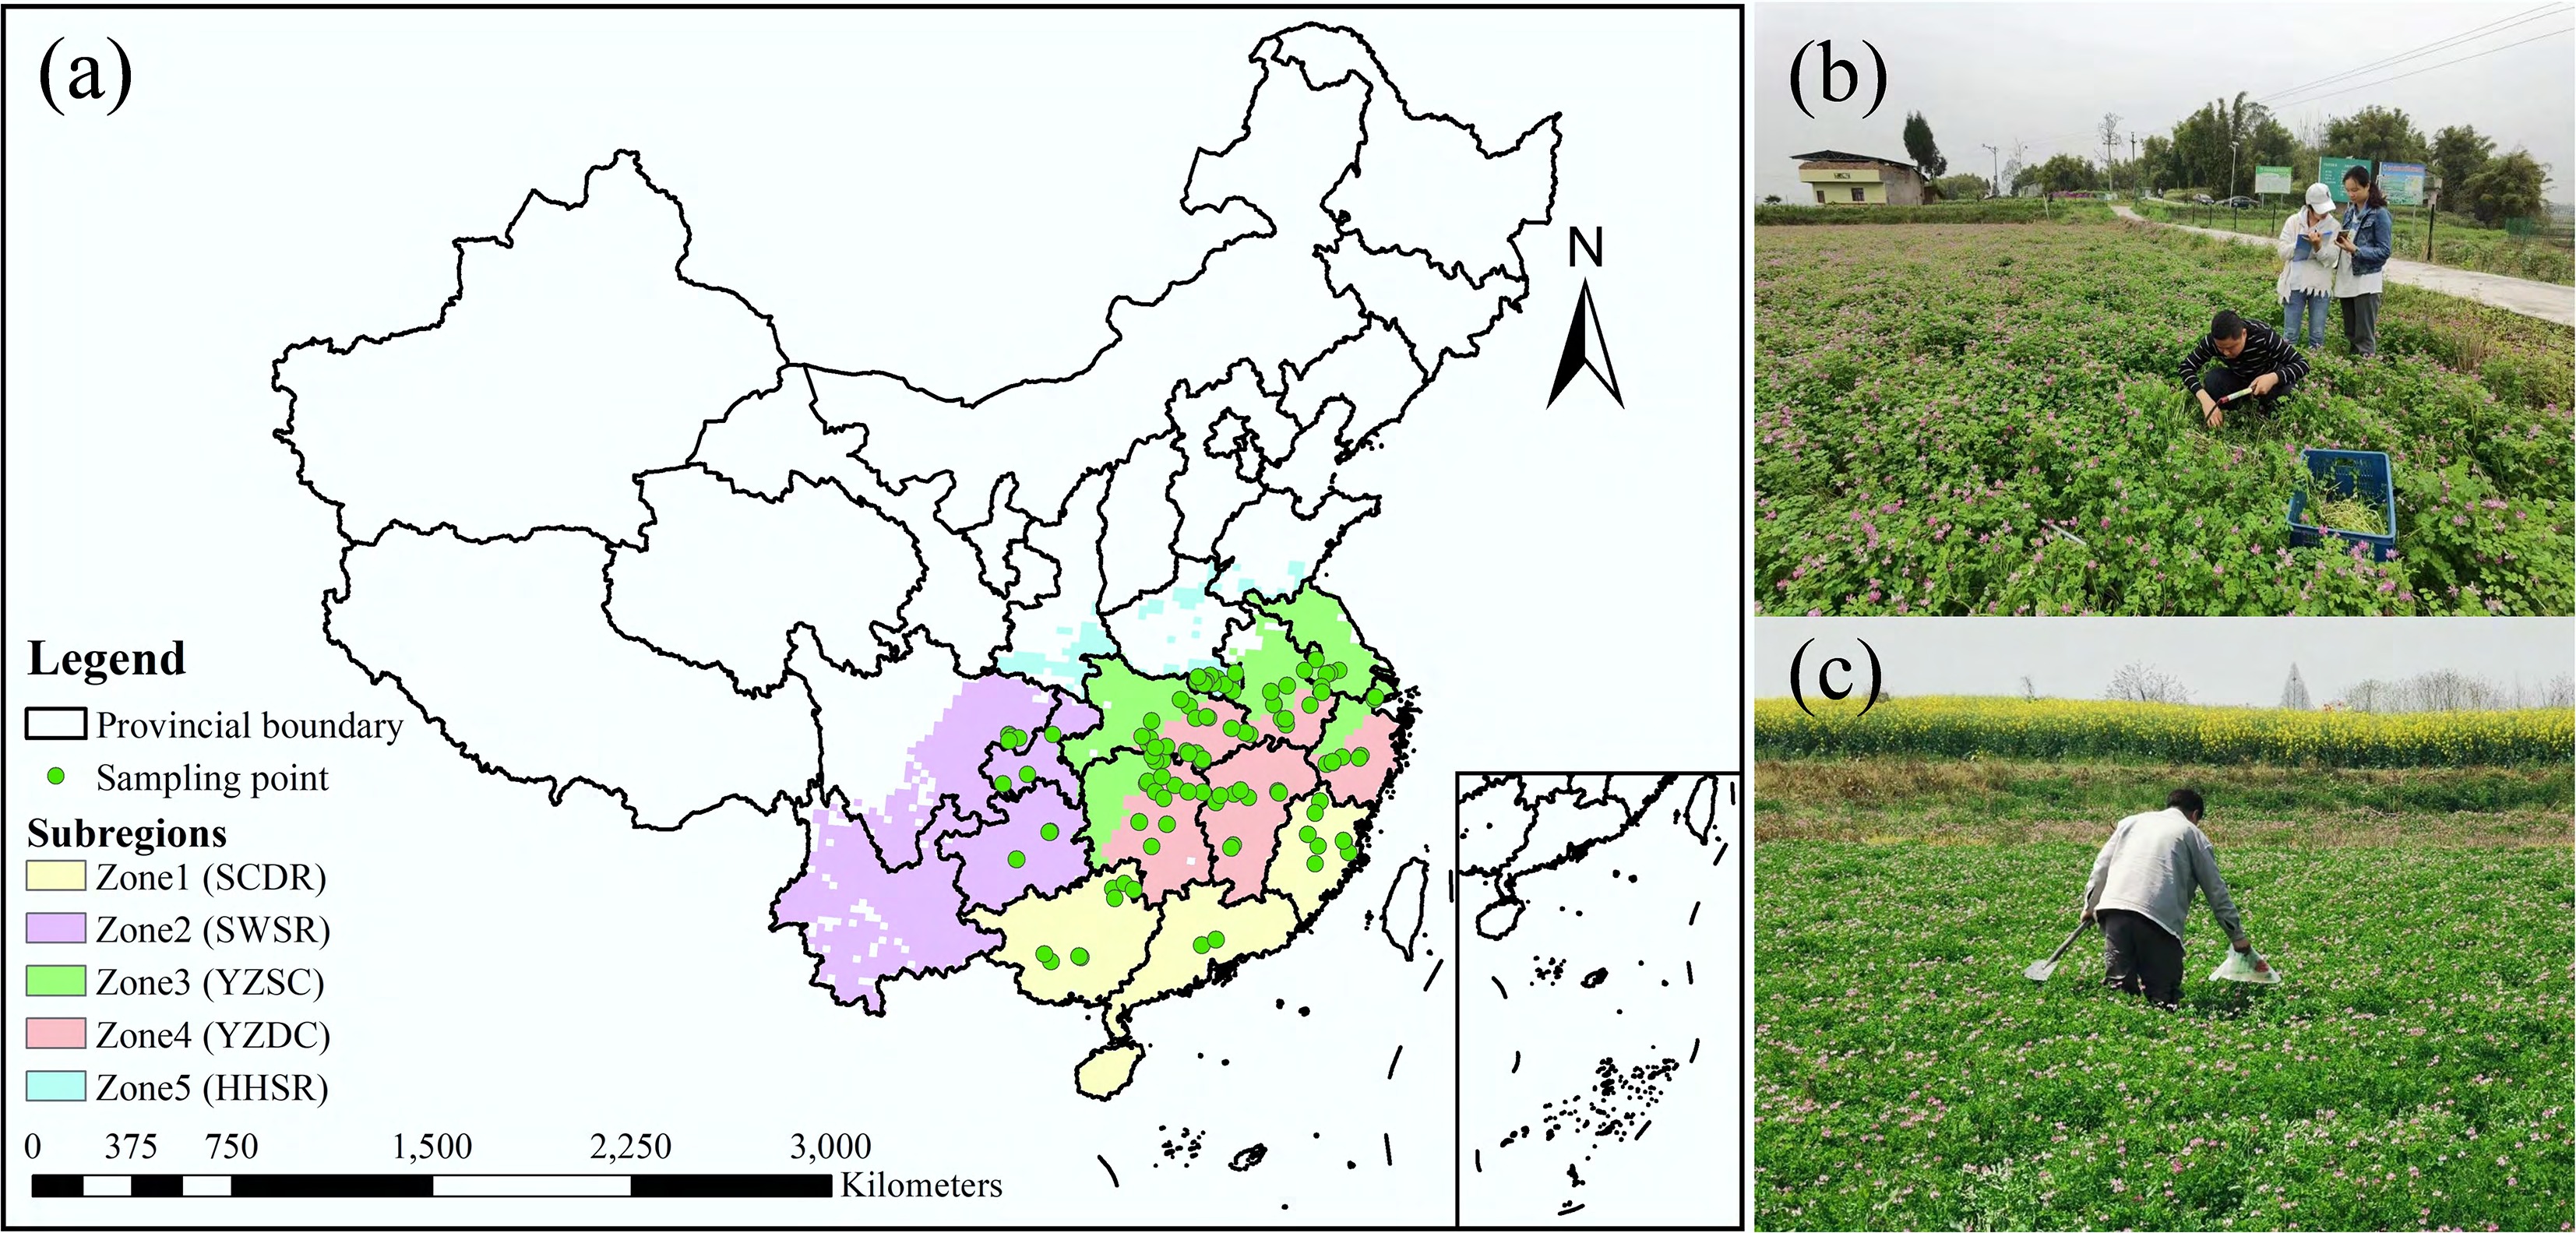
Figure 1.
(a) Base map of the study area (review number: GS(2024)0650) is sourced from the China National Geospatial Information Public Service Platform:
https://cloudcenter.tianditu.gov.cn/administrativeDivision . (b,c) Sampling process. SCDR, South China double-cropping rice region; SWSR, Southwest single-cropping rice region; YZSC, Yangtze River (middle and lower reaches) single-cropping rice region; YZDC, Yangtze River (middle and lower reaches) double-cropping rice region; HHSR, the Huang–Huai–Hai single-cropping rice region. -
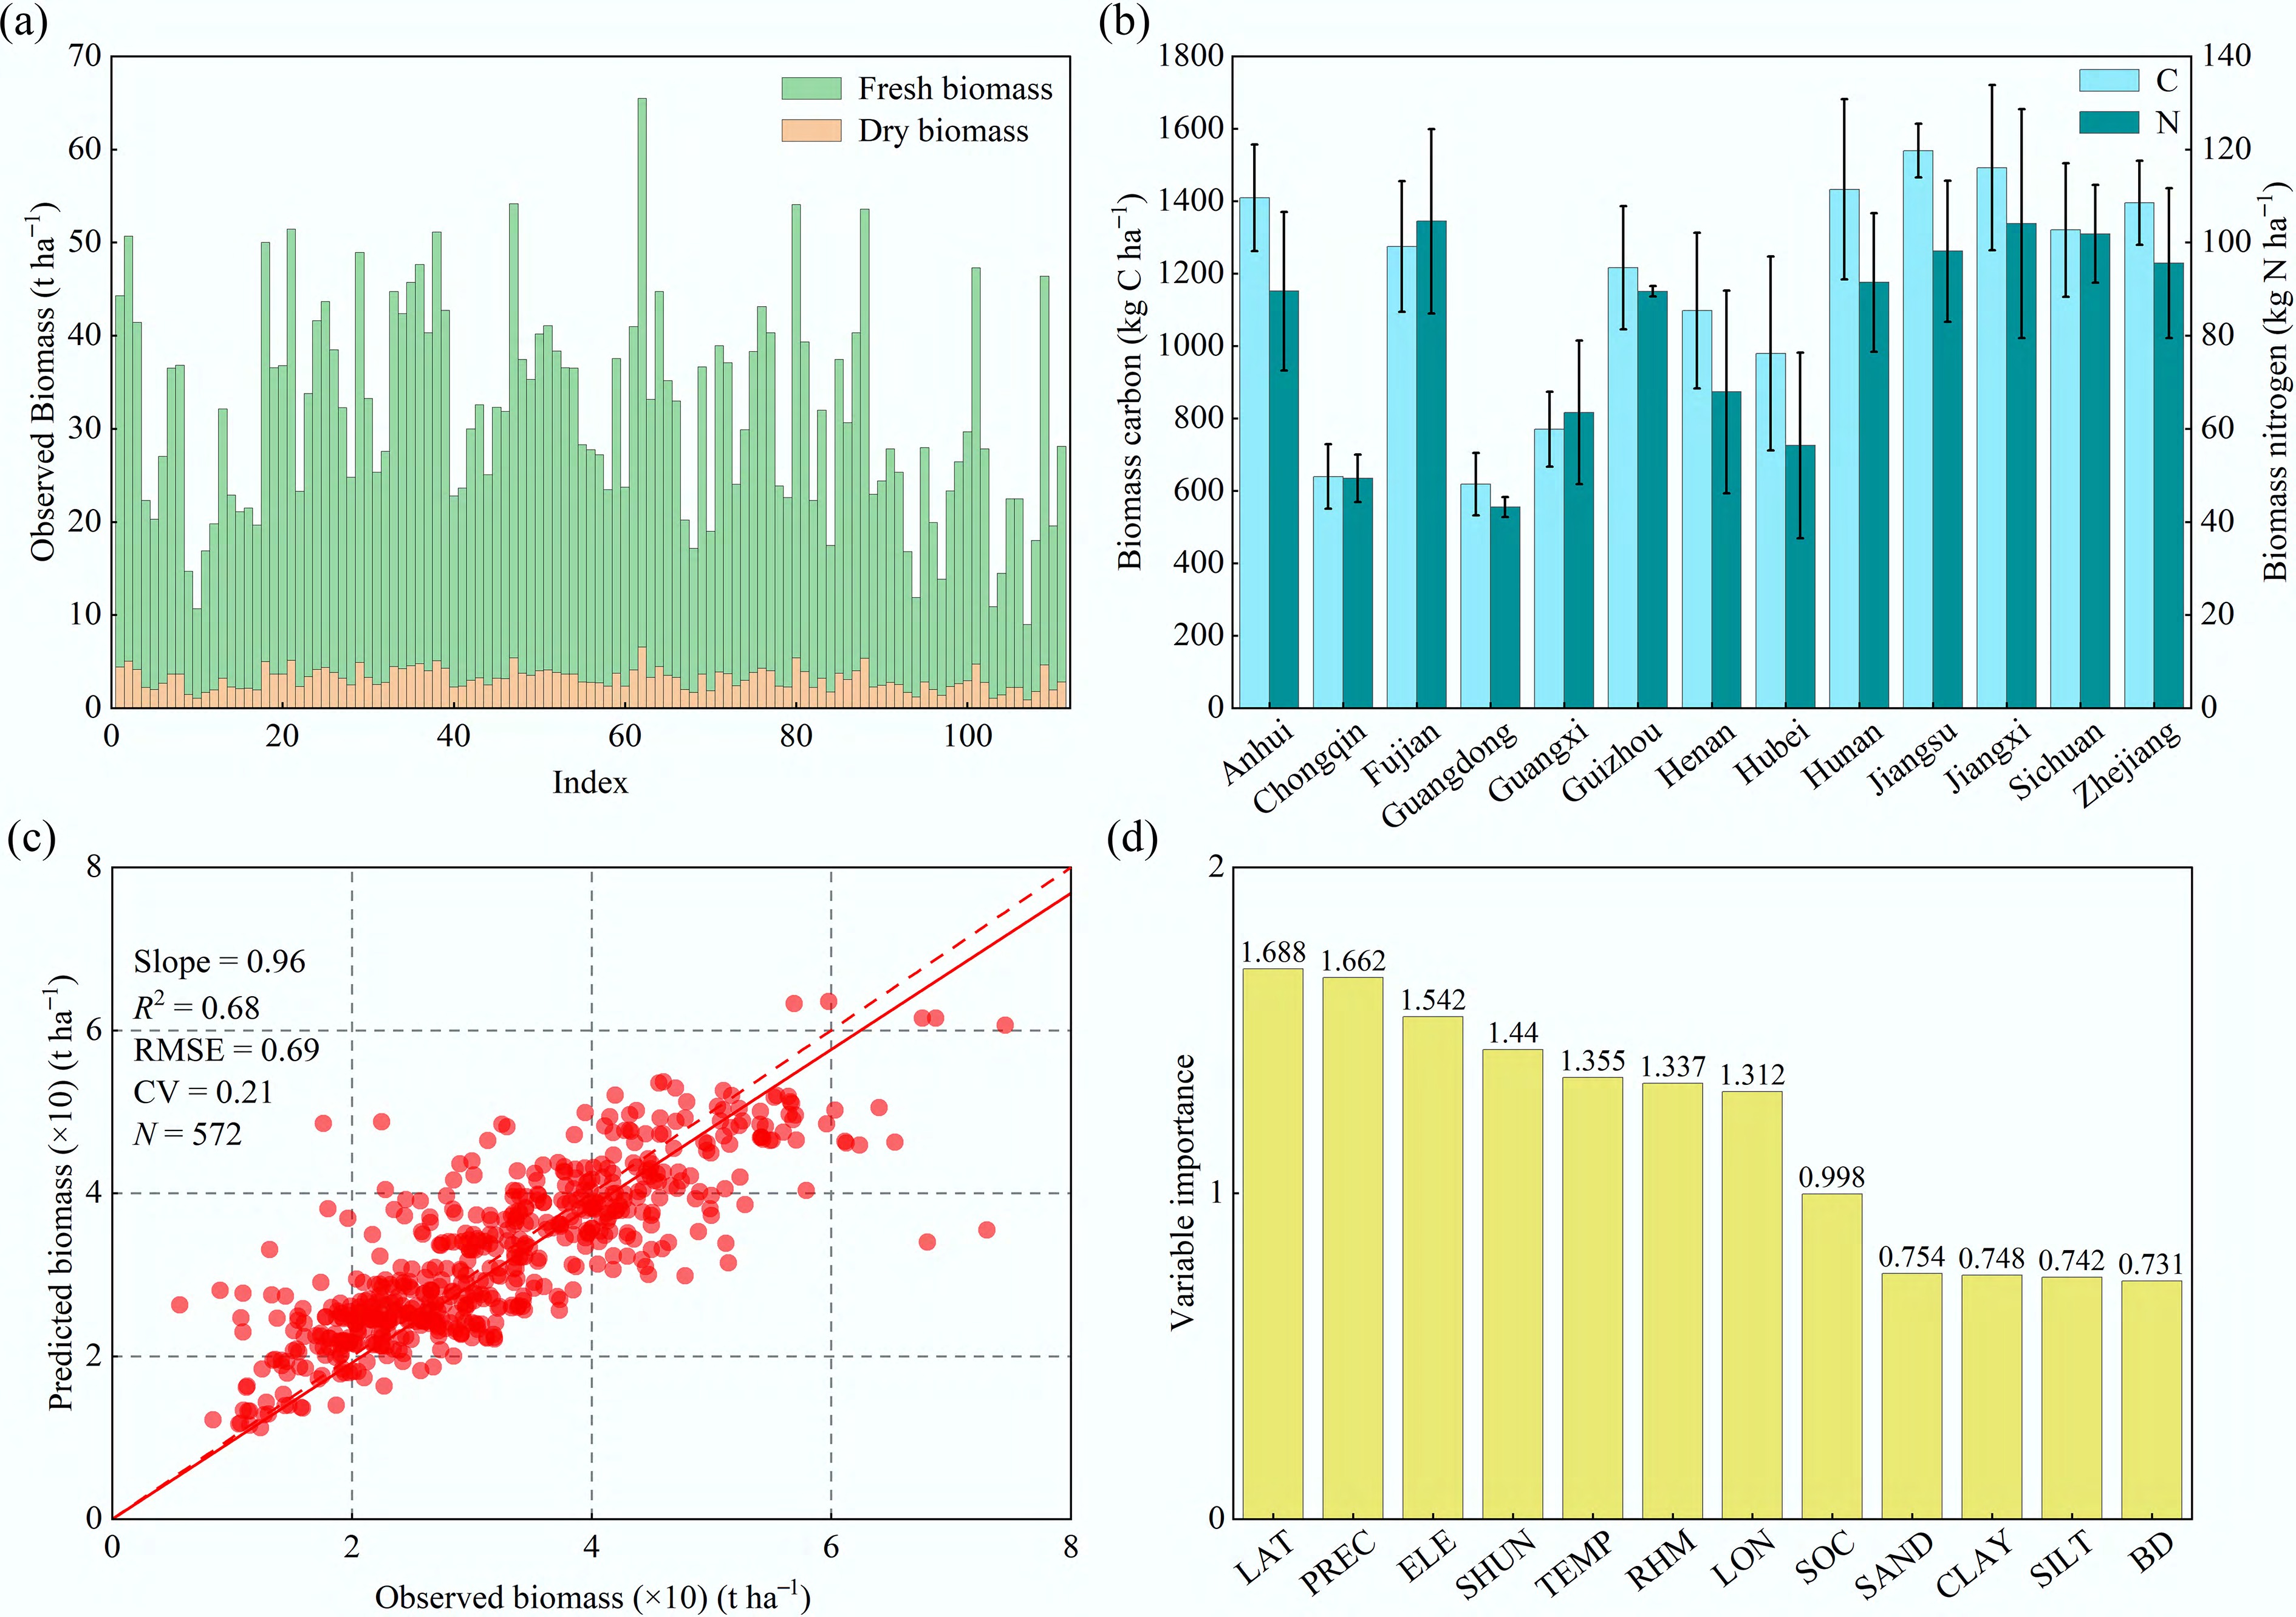
Figure 2.
(a) Field-measured biomass, where x represents the sampling point index and y represents the observed biomass, with a fresh-to-dry conversion factor of 0.1. (b) Provincial carbon and nitrogen accumulation. (c) RF model calibration and validation, both the observed and predicted biomass values were multiplied by 10 for plotting. (d) Key biomass driving factors identified from the RF training datasets.
-
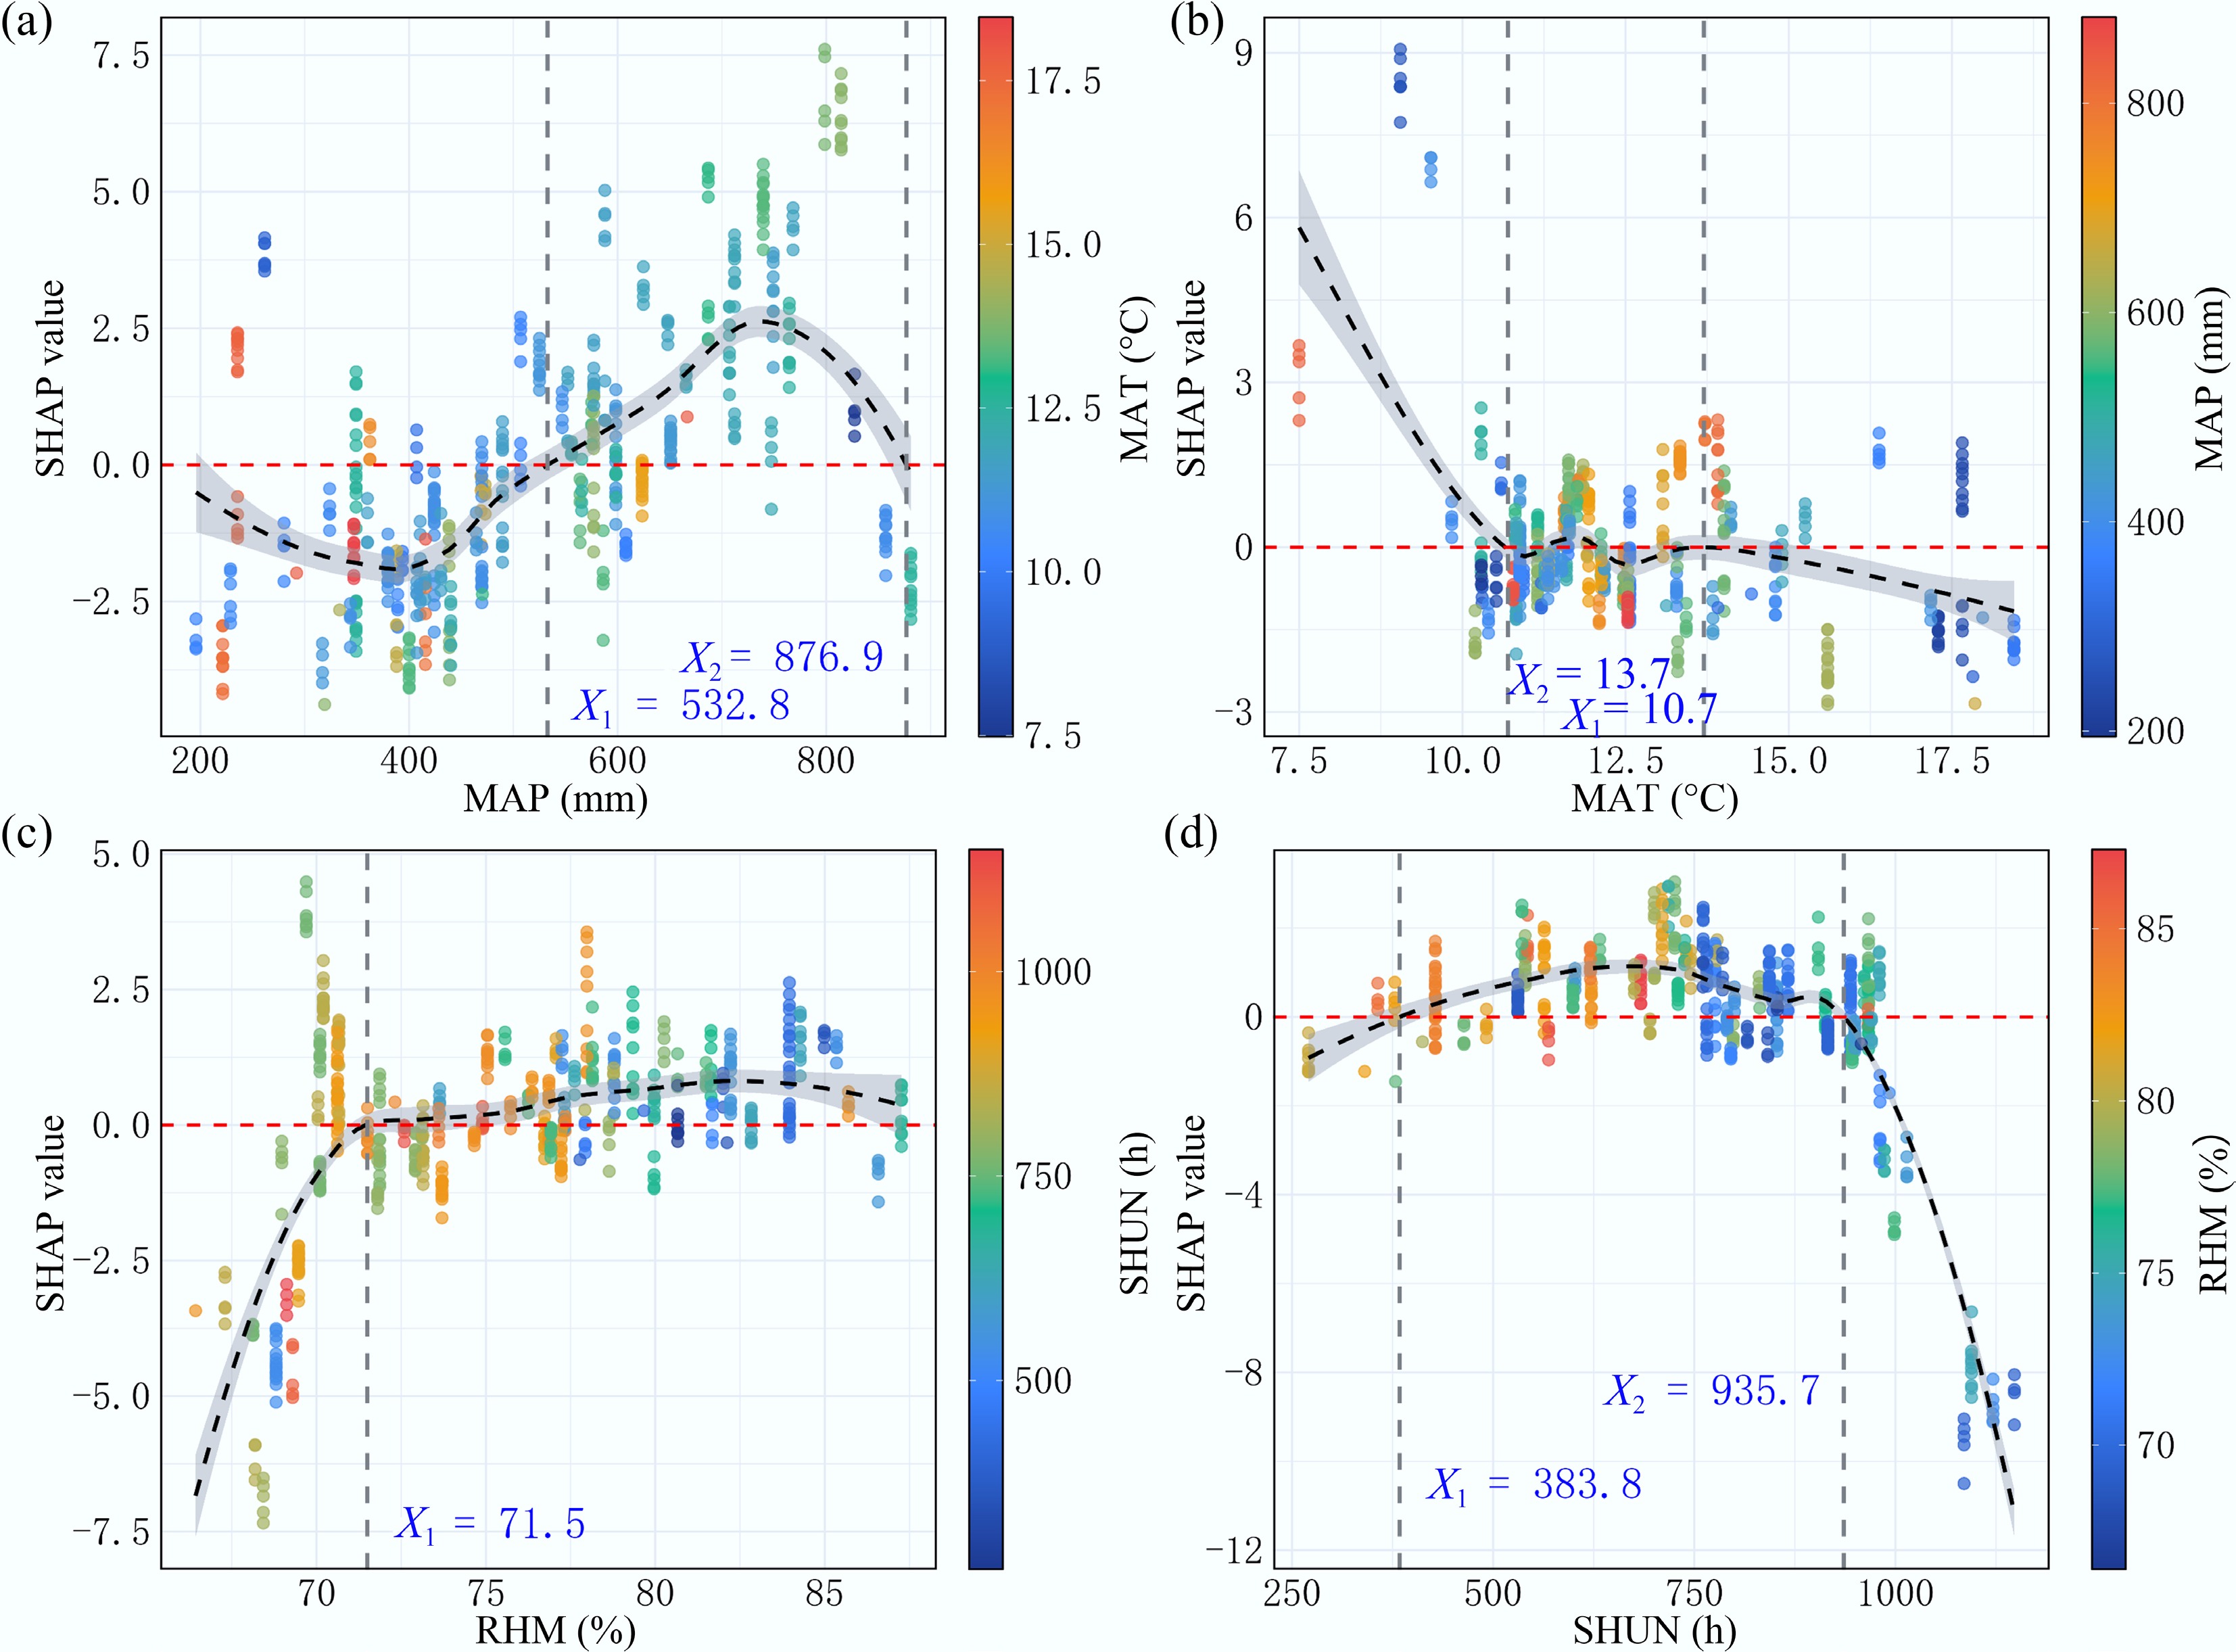
Figure 3.
Climate factor feature dependence plots for (a) growing season precipitation (MAP), (b) growing season mean temperature (MAT), (c) relative humidity (RHM), and (d) sunshine hours (SHUN).
-
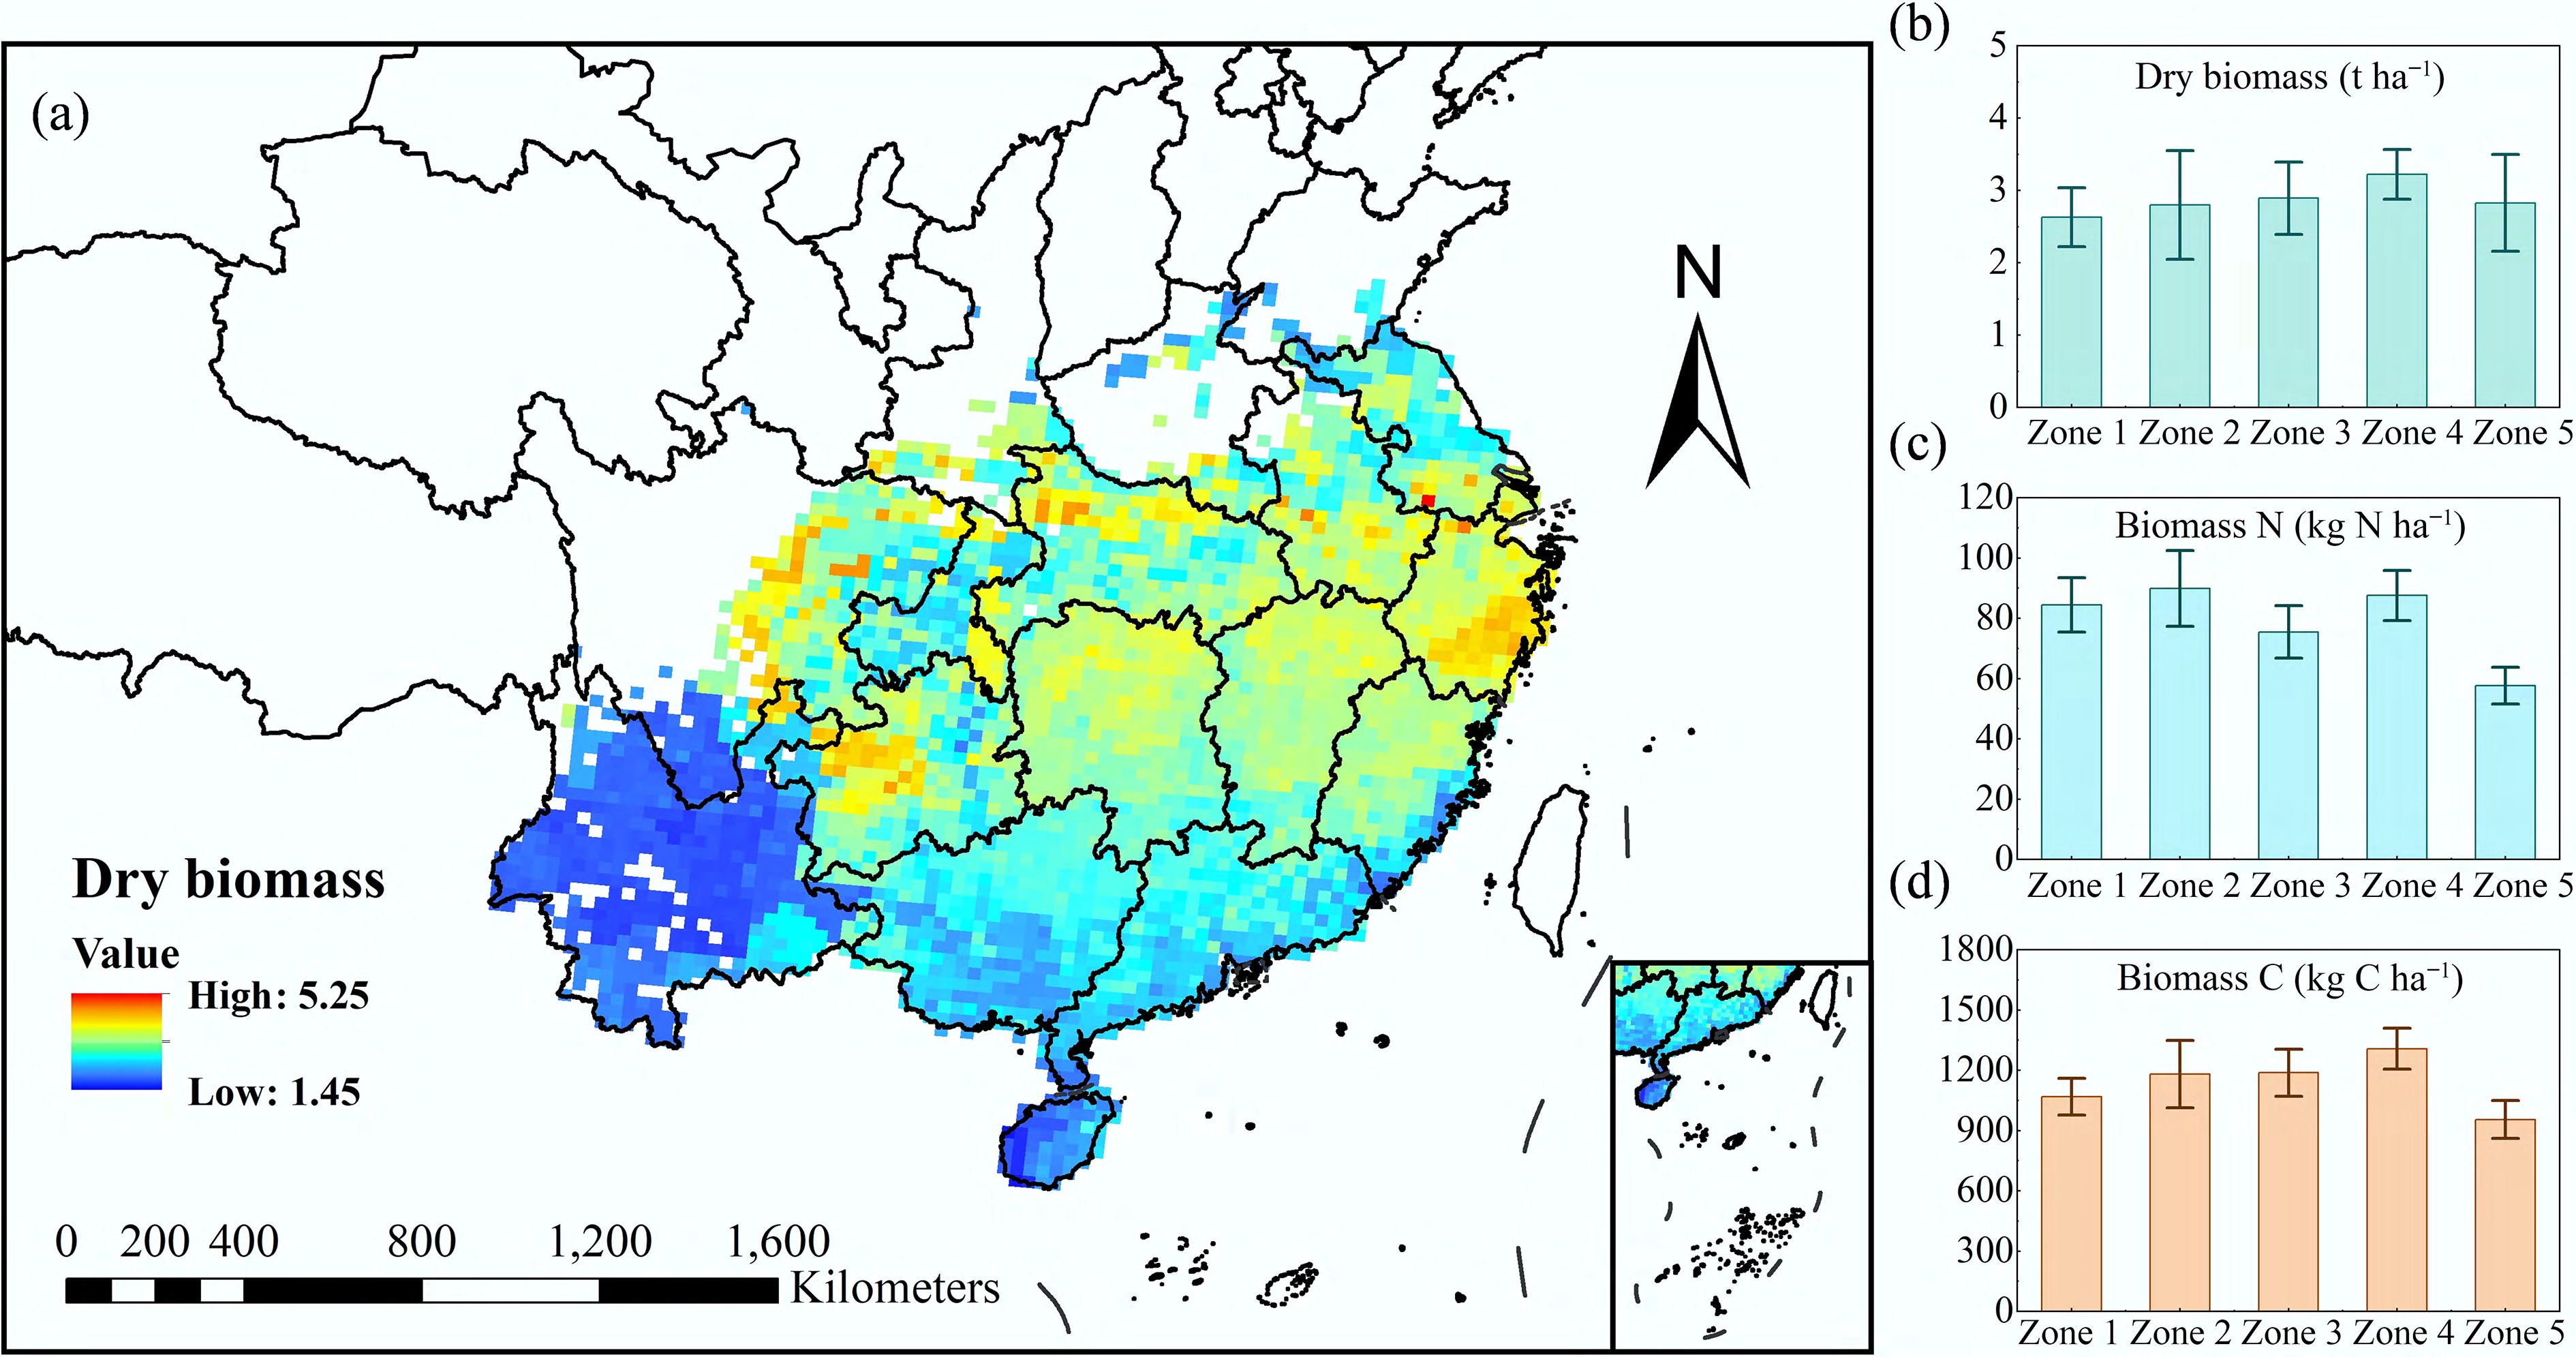
Figure 4.
Spatial pattern inversion of Chinese milk vetch biomass in southern China's paddy fields. (a) Simulated spatial distribution map of milk vetch biomass in southern China in 2019, base map (review number: GS(2024)0650) is sourced from the China National Geospatial Information Public Service Platform:
https://cloudcenter.tianditu.gov.cn/administrativeDivision . (b) Dry biomass of milk vetch in each region. (c) Nitrogen and (d) carbon content of biomass in each region. -
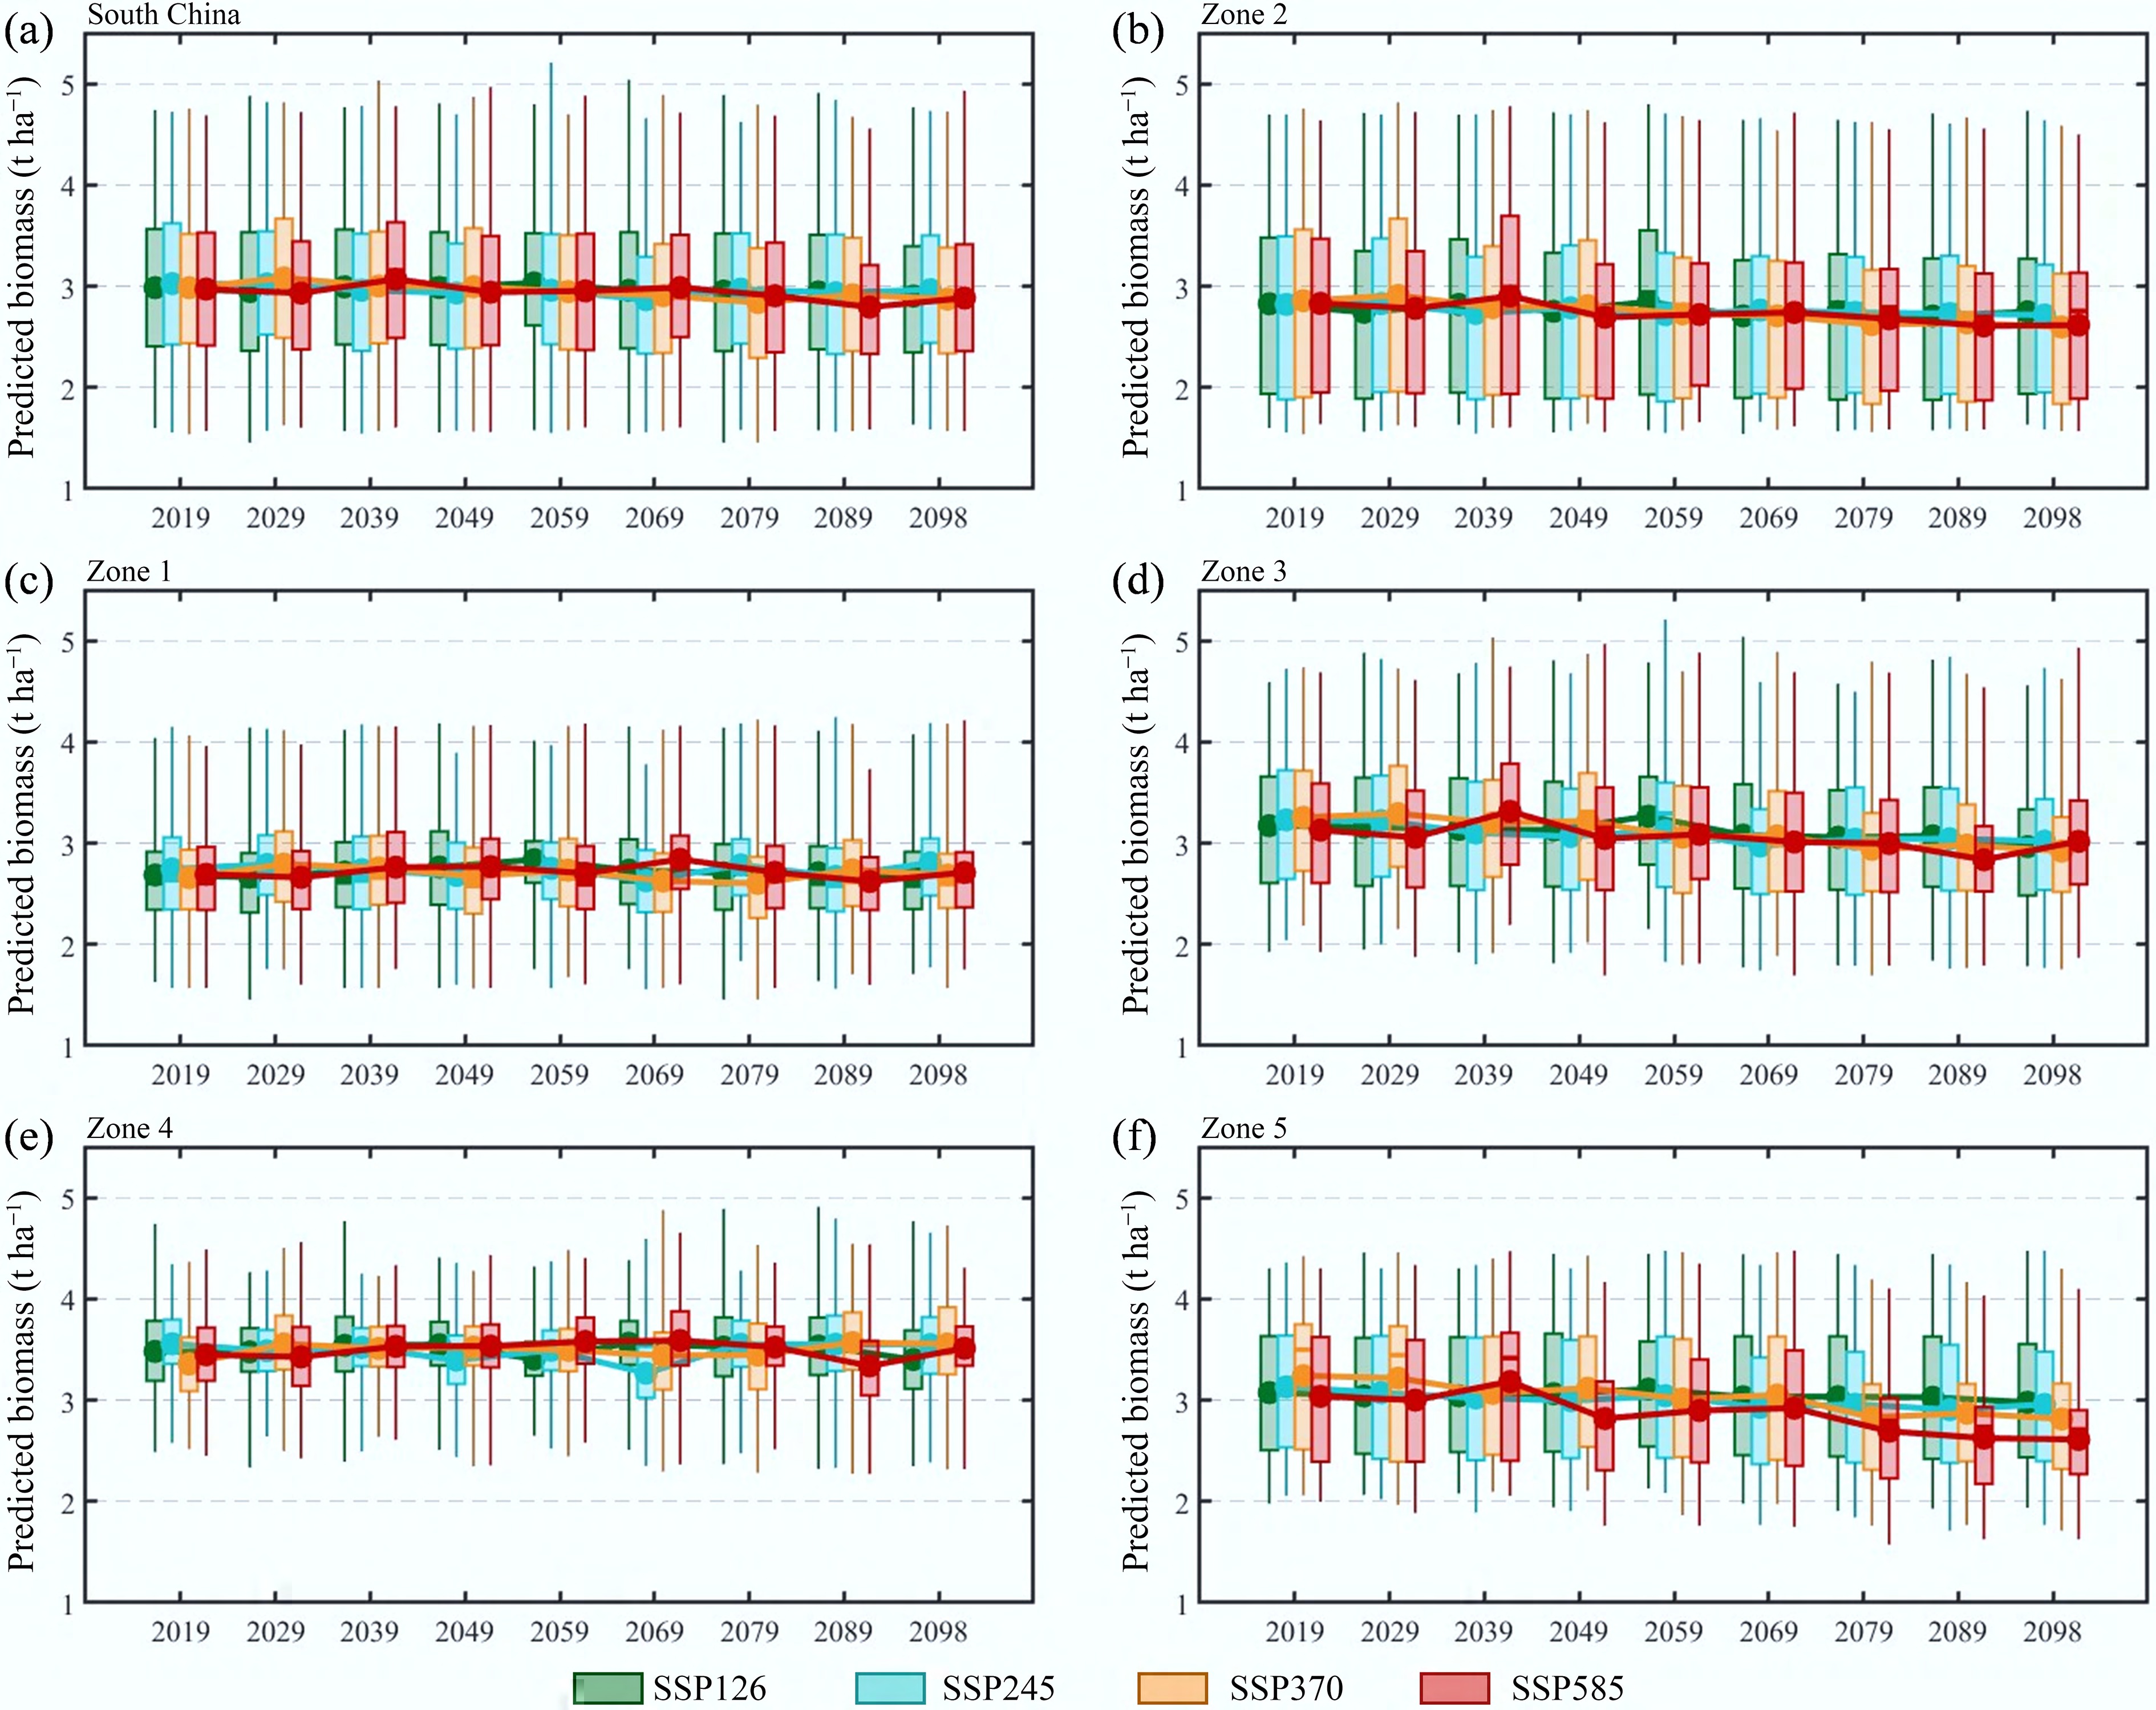
Figure 5.
Time dynamics of Chinese milk vetch biomass in southern China. Temporal dynamics of biomass in (a) southern China and (b–f) Zones 1–5 under the four scenarios (SSP126, SSP245, SSP370, and SSP585).
-
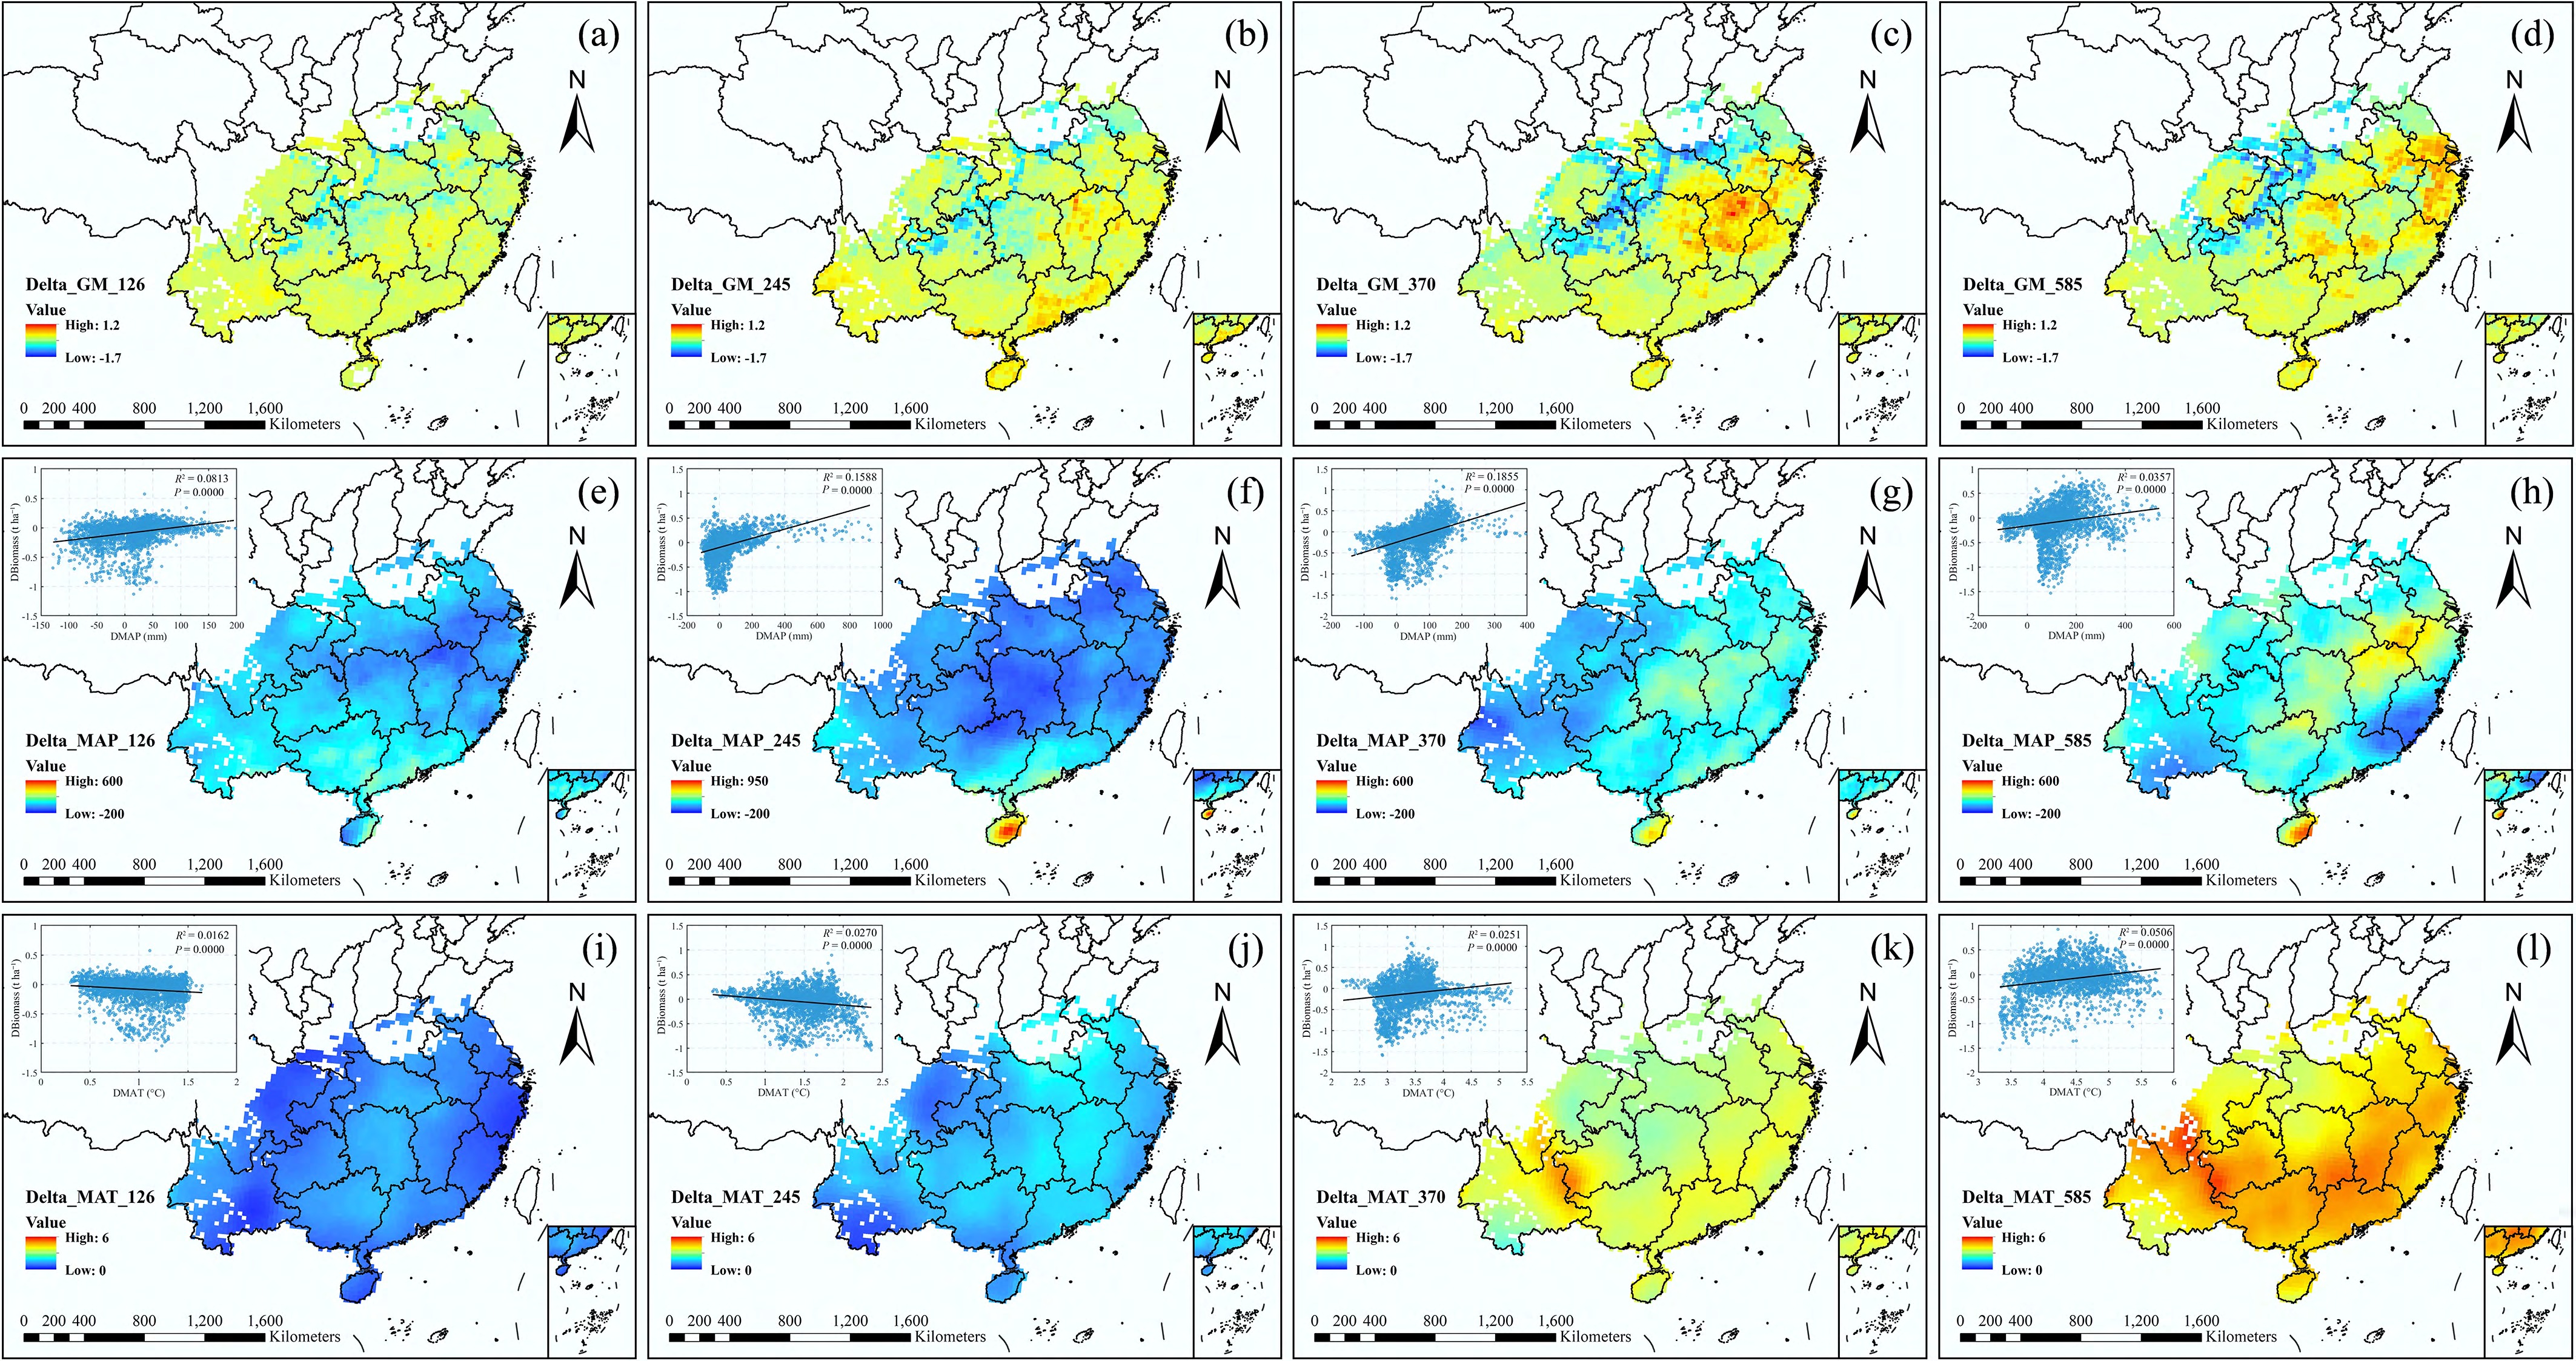
Figure 6.
Spatiotemporal variations of GM biomass, MAP, and MAT in southern China under climate change. The base map (review number: GS(2024)0650) is sourced from the China National Geospatial Information Public Service Platform:
https://cloudcenter.tianditu.gov.cn/administrativeDivision . (a–d) Spatiotemporal variations in GM biomass, (e–h) spatiotemporal variations in MAP and (i–l) spatiotemporal variations in MAT under the four scenarios (SSP126, SSP245, SSP370 and SSP585), respectively. -
Region Biomass (%) MAP (%) MAT (%) SSP126 SSP245 SSP370 SSP585 SSP126 SSP245 SSP370 SSP585 SSP126 SSP245 SSP370 SSP585 South China −2.82 −2.01 −3.74 −2.97 3.12 10.05 14.70 26.96 8.12 12.09 29.06 36.27 Zone 1 −0.55 2.21 0.97 0.69 9.62 23.70 18.23 16.69 6.39 9.08 22.95 29.25 Zone 2 −2.78 −3.67 −9.09 −7.55 8.82 17.96 −3.55 24.09 7.96 11.09 32.33 40.03 Zone 3 −6.52 −6.50 −10.23 −3.54 −3.65 −5.40 18.24 34.67 10.95 17.17 34.47 40.64 Zone 4 −2.30 −0.24 5.87 1.89 −4.40 −0.63 21.10 32.23 9.23 14.34 29.93 38.84 Zone 5 −3.11 −5.53 −13.17 −14.01 10.74 −0.49 18.37 50.43 11.88 23.12 40.54 46.81 Table 1.
Changes in biomass, MAP, and MAT from 2019 to 2098
-
Scenario r r2 p-value Biomass–MAP SSP126 0.2852 0.0813 <0.0001*** SSP245 0.3985 0.1588 <0.0001*** SSP370 0.4307 0.1855 <0.0001*** SSP585 0.1889 0.0357 <0.0001*** Biomass–MAT SSP126 −0.1271 0.0162 <0.0001*** SSP245 −0.1643 0.0270 <0.0001*** SSP370 0.1584 0.0251 <0.0001*** SSP585 0.2250 0.0506 <0.0001*** Note: *** indicates significant differences. Table 2.
Relevant analytical performance indicators
Figures
(6)
Tables
(2)