-
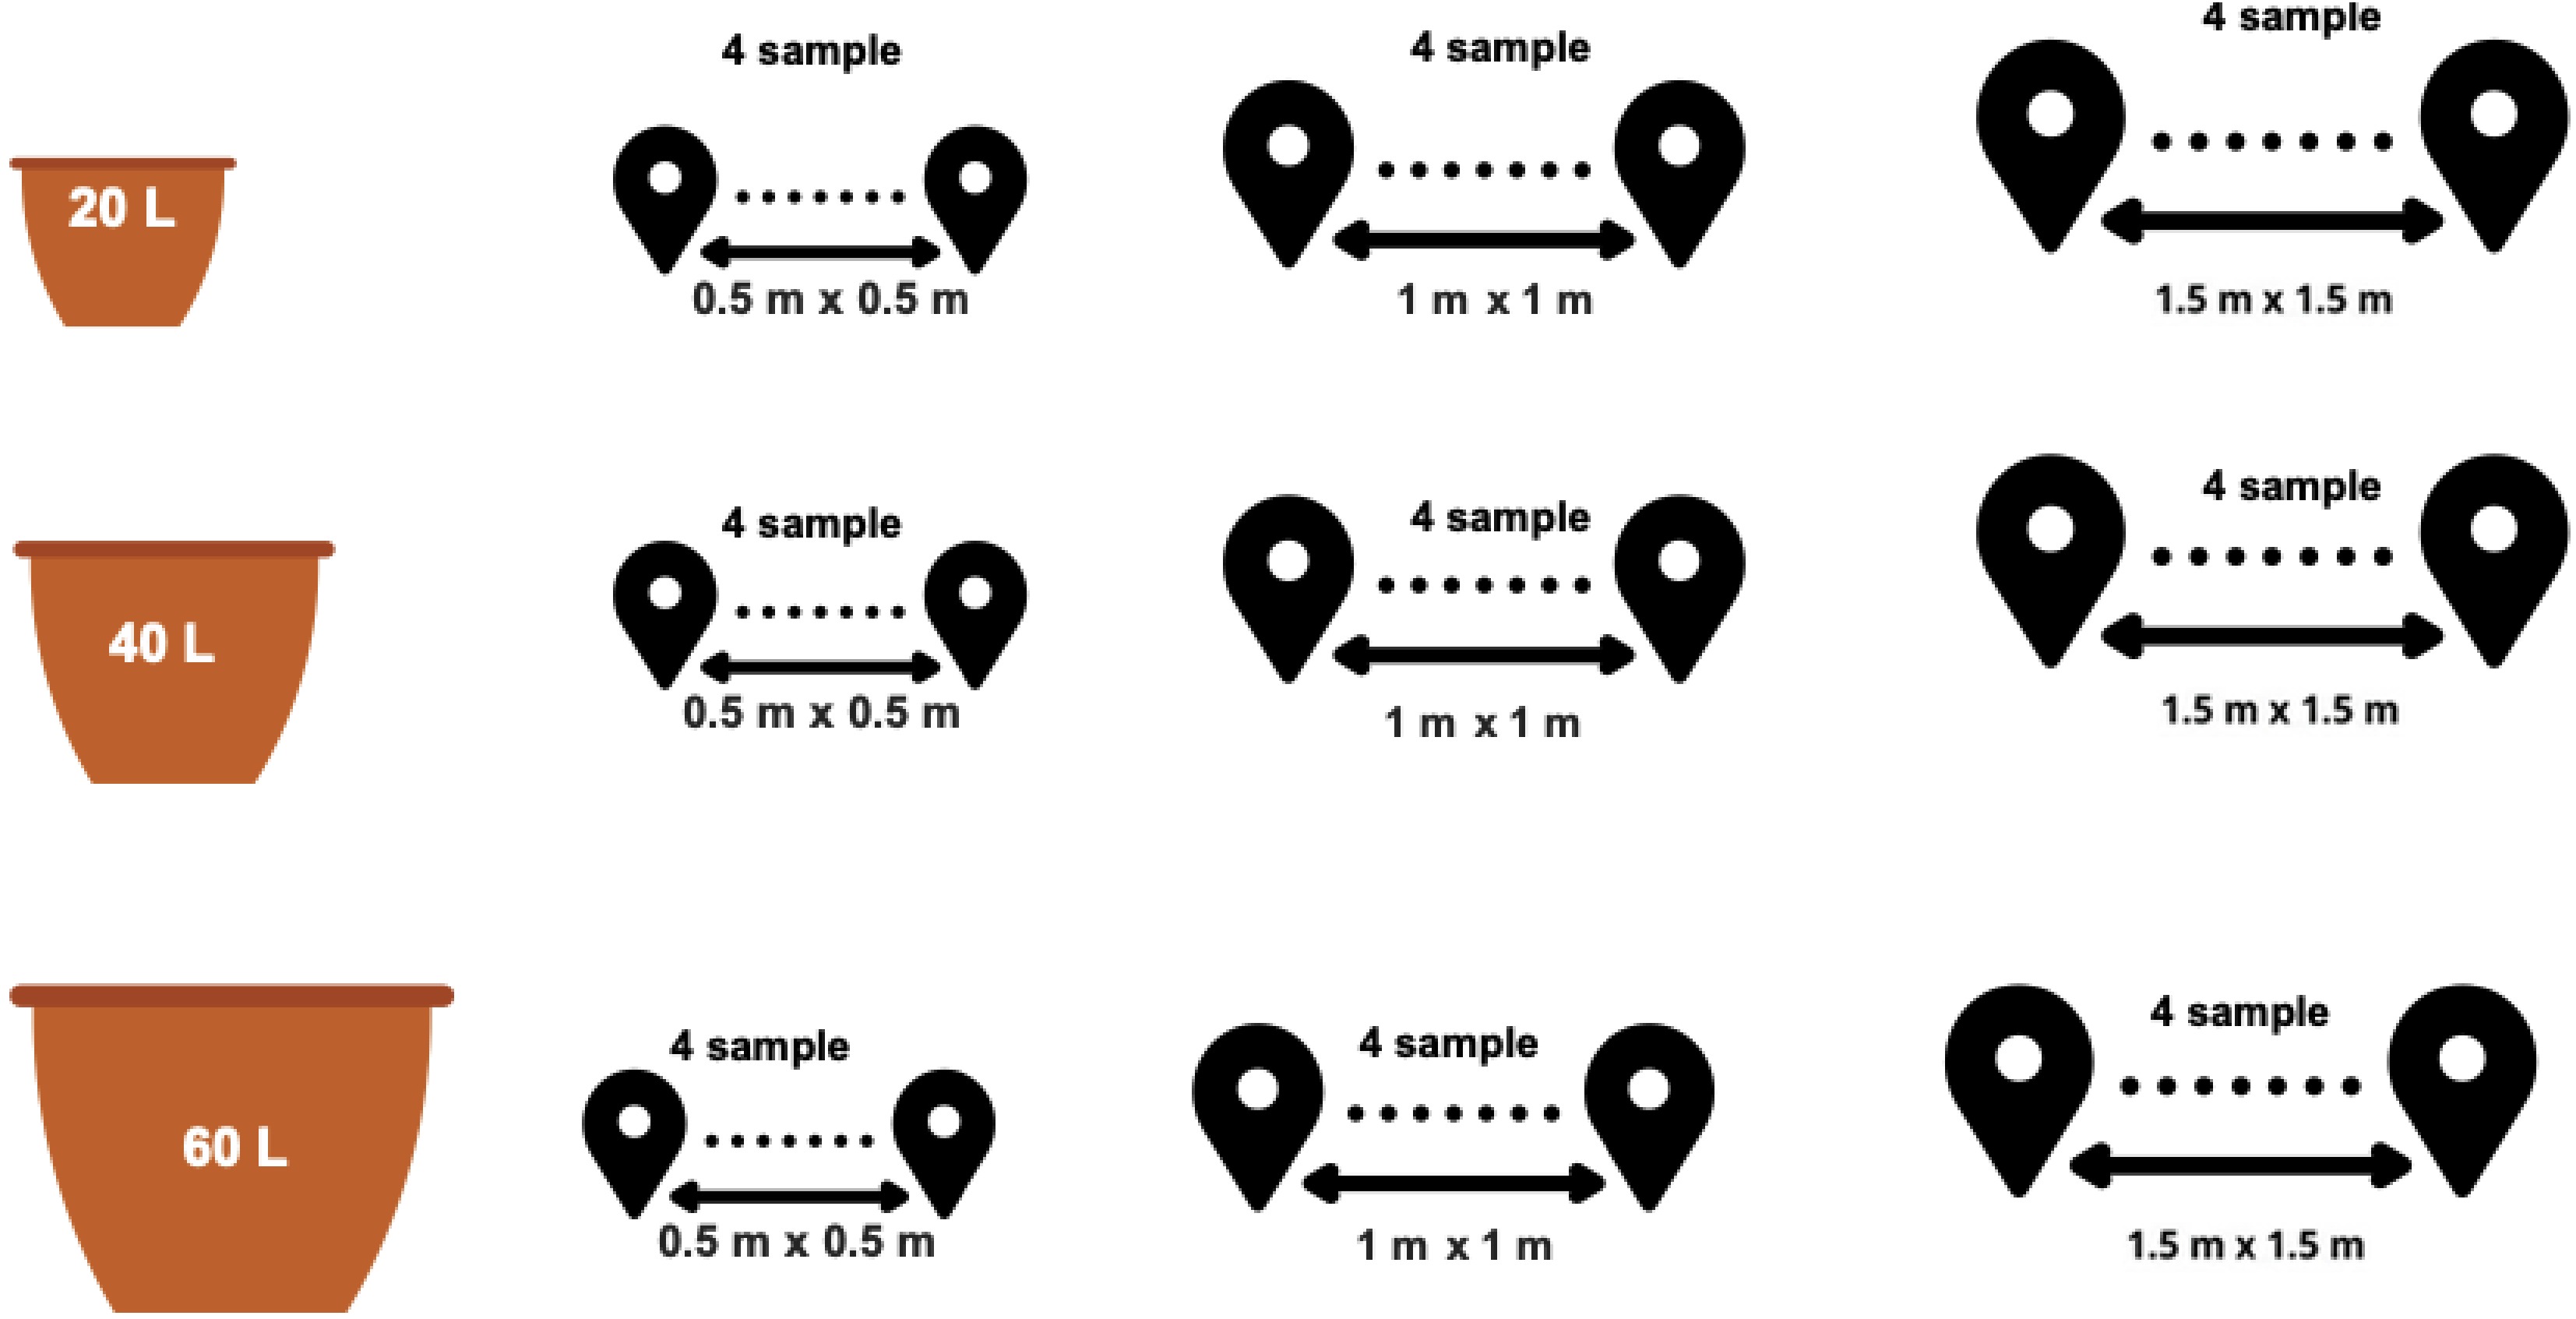
Figure 1.
Experimental design layout used for both hemp cultivars under different pot sizes and plant spacing treatments.
-
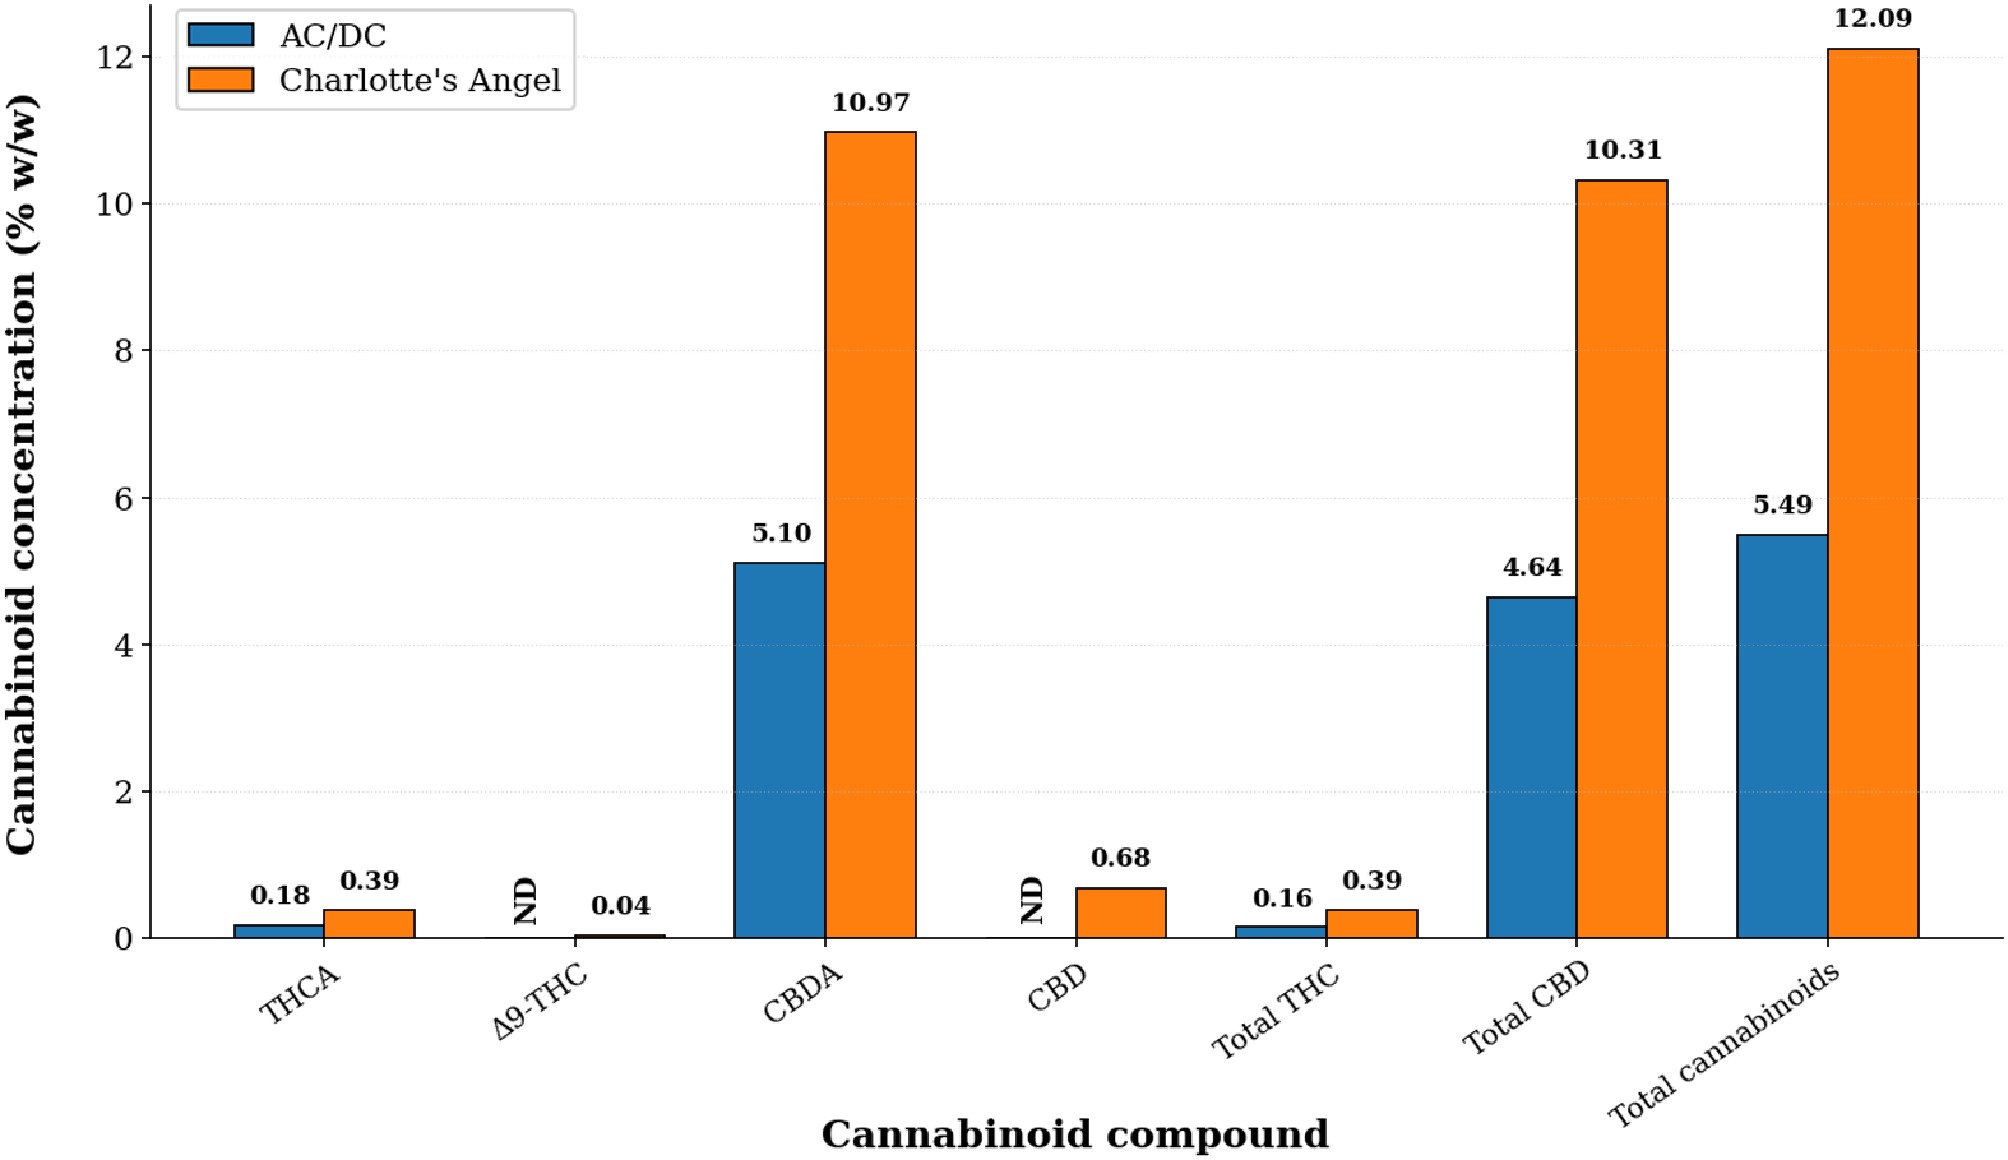
Figure 2.
Cannabinoid profile comparison between the two hemp strains, AC/DC and Charlotte's Angel.
-
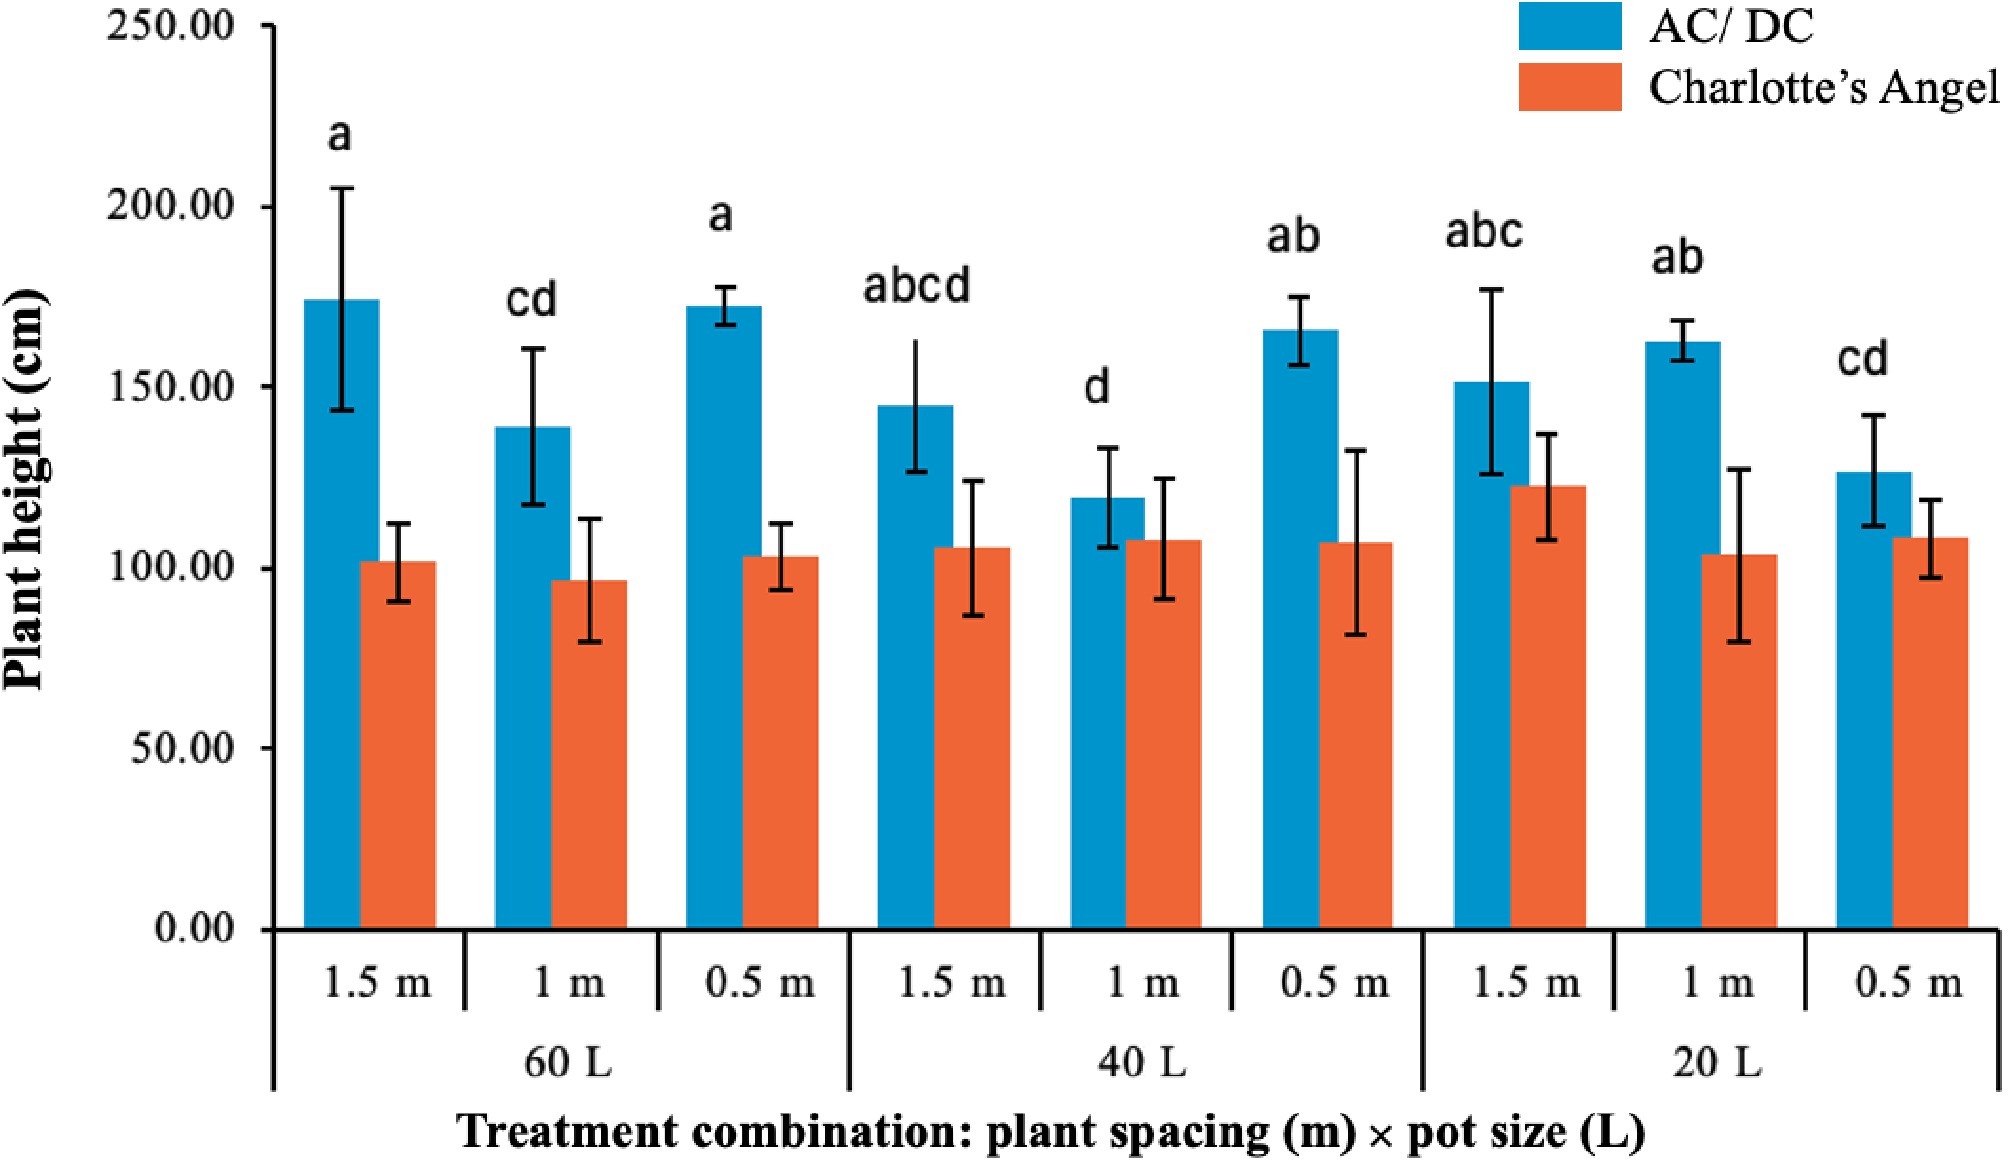
Figure 3.
Plant height of AC/DC and Charlotte's Angel under different pot size and plant spacing treatments. Values are presented as mean ± standard deviation (n = 8). Different lowercase letters indicate statistically significant differences among treatments based on Tukey's HSD test at p < 0.05.
-
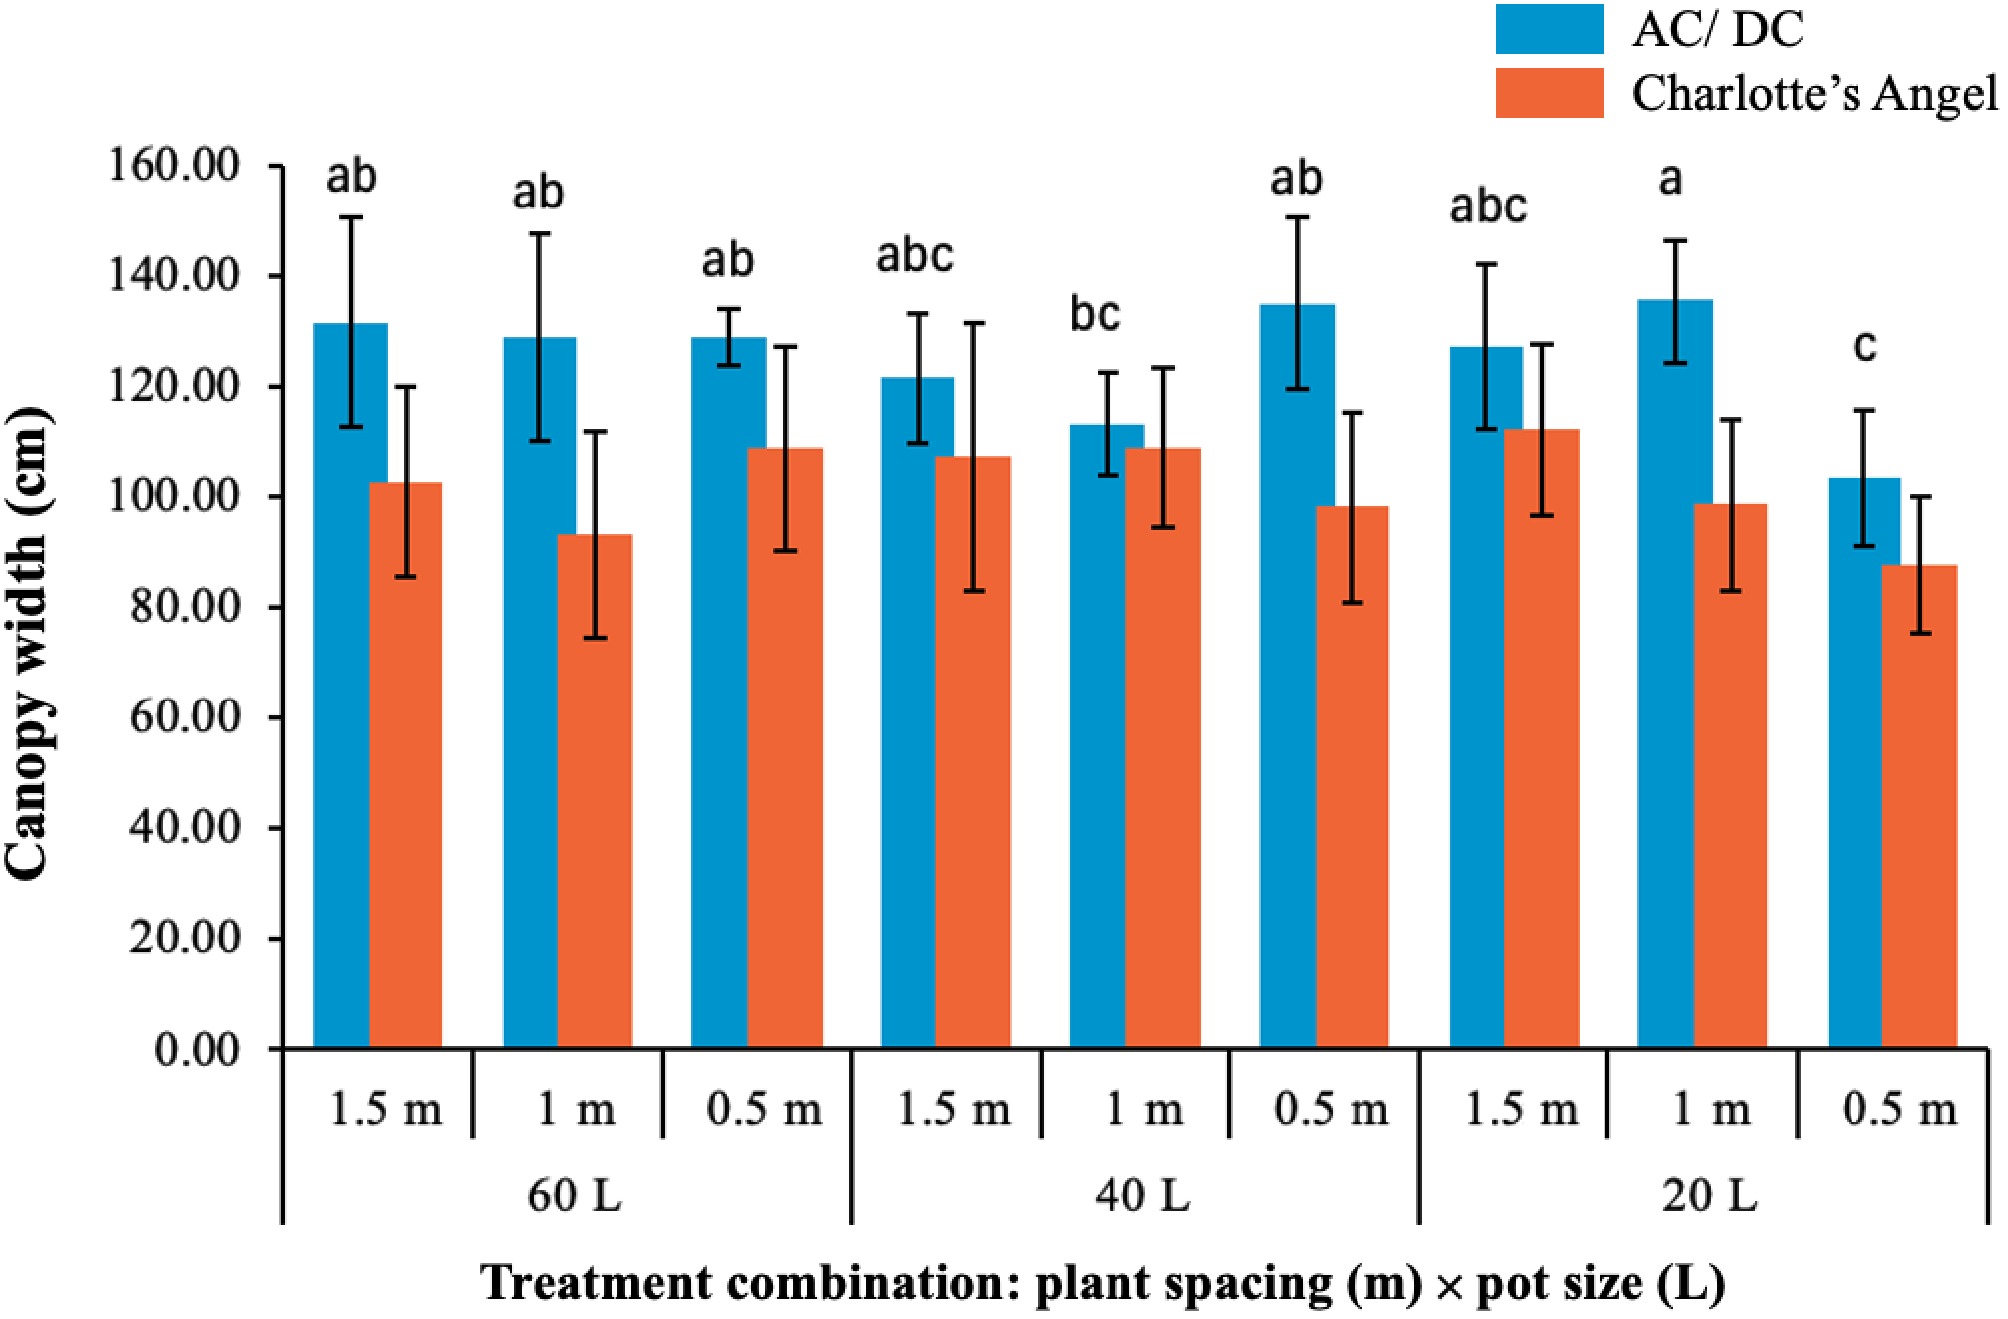
Figure 4.
Canopy width of AC/DC and Charlotte's Angel under different pot sizes and plant spacing treatments. Values are presented as mean ± standard deviation (n = 8). Different lowercase letters indicate statistically significant differences at p < 0.05.
-
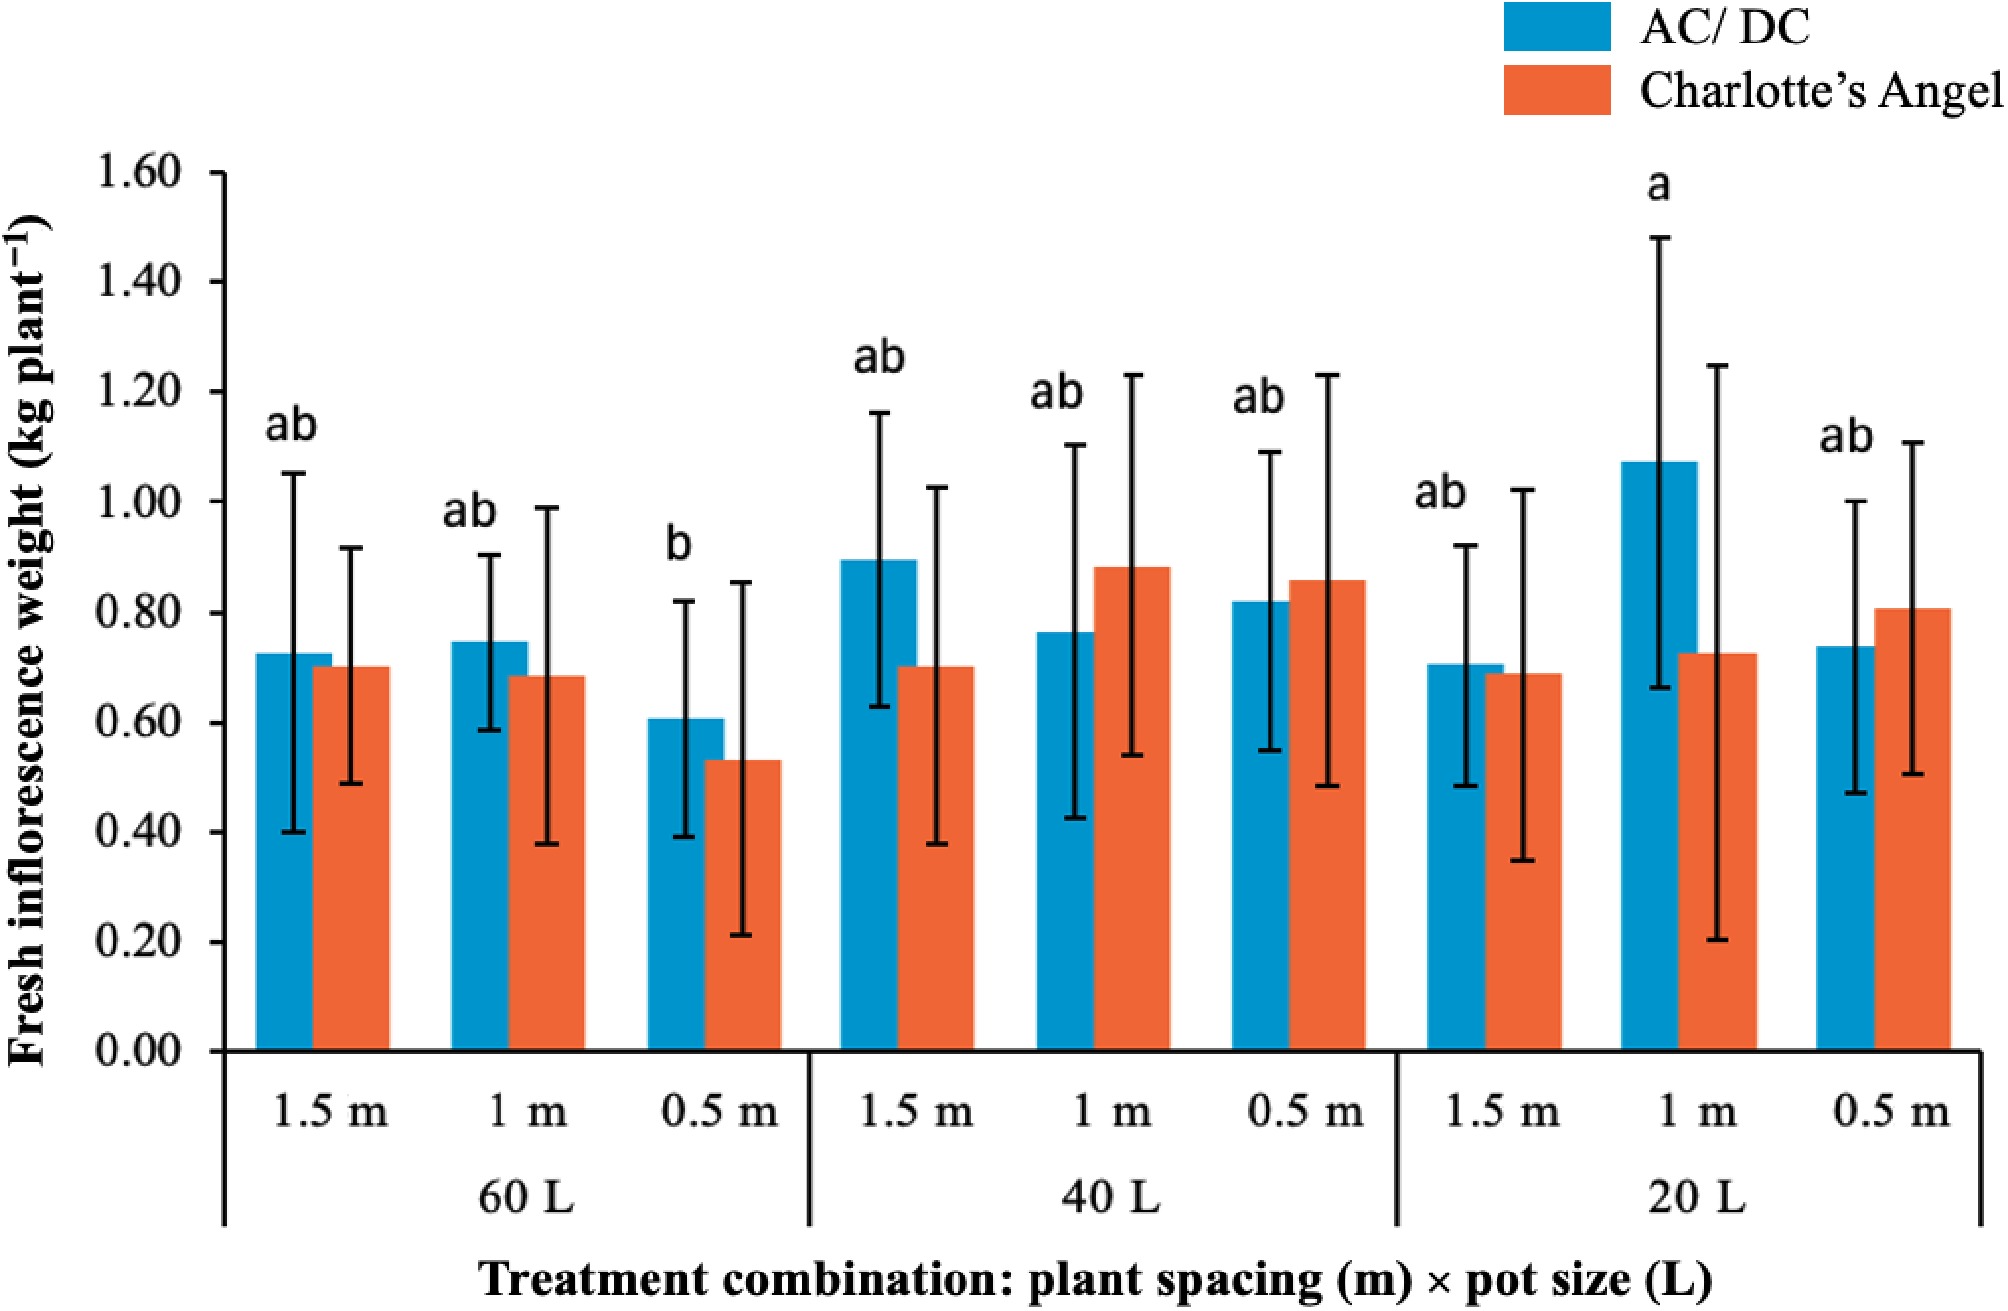
Figure 5.
Fresh inflorescence yield of AC/DC and Charlotte's Angel across treatment combinations. Values are presented as mean ± SD (n = 8). Different lowercase letters indicate statistically significant differences at p < 0.05.
-
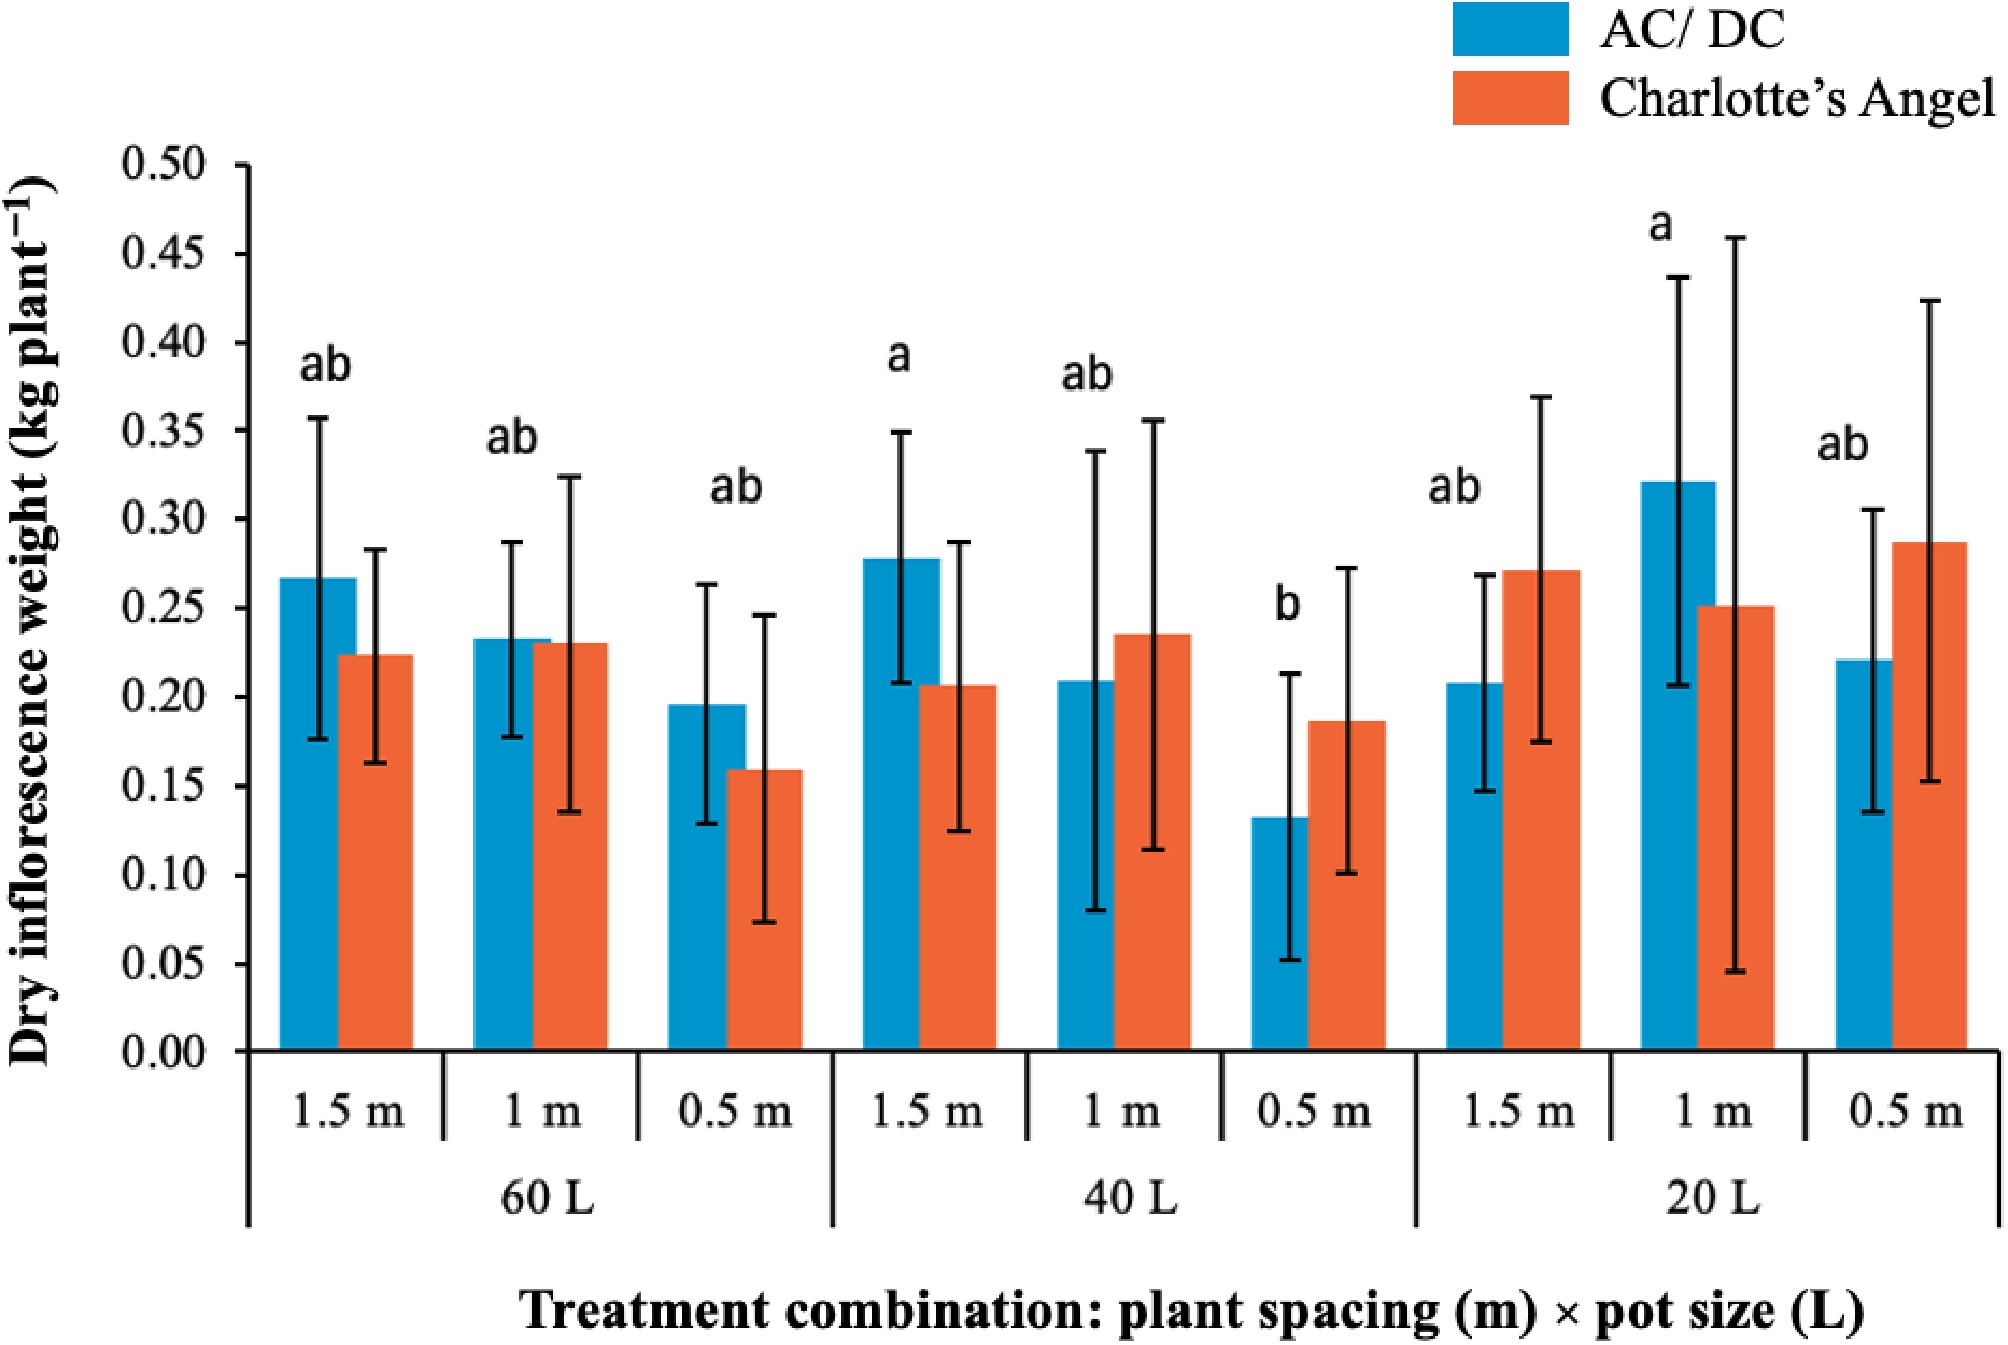
Figure 6.
Dry inflorescence yield of AC/DC and Charlotte's Angel across treatment combinations. Values are presented as mean ± SD (n = 8). Different lowercase letters indicate statistically significant differences at p < 0.05.
-
Solution Type of fertilizer Fertilizer formula Amount used to dissolve in water/10 L A 1. Calcium nitrate (Ca[NO3]•4H2O) 15-0-0 1,200 g 2. Chelated iron (DTPA7%) or DTPA at 50 g + EDTA at 25 g 75 g B 1. Potassium dihydrogen phosphate (KH2PO4) 0-52-34 300 g 2. Potassium nitrate (KNO3) 13-0-46 700 g 3. Magnesium sulfate (MgSO4•7H2O) 500 g 4. Tres-spray 50 g 5. Librel manganese (Mn-EDTA 3%) 10 g 6. Sodium molybdate (Mo-EDTA 39.5%) 1 g 7. Nickel sulfate (Ni-22.3%) 0.5 g Table 1.
The improved hydroponic fertilizer formula.
-
Pot size (L)* 20 L 40 L 60 L Plant spacing (m)* 0.5 m 1 m 1.5 m 0.5 m 1 m 1.5 m 0.5 m 1 m 1.5 m Number of plants (two replications per treatment) 4 × 2 4 × 2 4 × 2 4 × 2 4 × 2 4 × 2 4 × 2 4 × 2 4 × 2 Total sample size 72 plants * L, liter; m, meter. Table 2.
Experimental design for Charlotte's Angel hemp cultivar under different pot sizes and plant spacing treatments.
-
Pot size (L)* 20 L 40 L 60 L Plant spacing (m)* 0.5 m 1 m 1.5 m 0.5 m 1 m 1.5 m 0.5 m 1 m 1.5 m Number of plants (two replications per treatment) 4 × 2 4 × 2 4 × 2 4 × 2 4 × 2 4 × 2 4 × 2 4 × 2 4 × 2 Total sample size 72 plants * L, liter; m, meter. Table 3.
Experimental design for the AC/DC hemp strain under different pot sizes and plant spacing treatments.
-
pH Total nitrogen (N) Total phosphorus (P2O5) Total potassium (K2O) Calcium (Ca) Magnesium (Mg) 8.5 0.8% 1.2% 0.19% 2.1% 0.19% Table 4.
Results of nutrient analysis in planting materials.
-
Heavy metals Standard values (mg·kg−1) Detected values (mg·kg−1) Arsenic < 6.0 0.873 Cadmium < 67 0.044 Chromium < 17.5 10.278 Lead < 400 1.647 Mercury < 22 < 0.018 Copper < 2,920 25.571 Table 5.
Heavy metal concentrations detected in the soil of the hemp plantation.
-
Compounds Species Charlotte's Angel AC/DC Delta 9-tetrahydrocannabinolic acid (THCA) 0.39% 0.18% Delta 9-tetrahydrocannabinol (delta 9-THC) 0.04% ND Cannabidiolic acid (CBDA) 10.97% 5.10% Cannabidiol (CBD) 0.68% ND Delta 8-tetrahydrocannabinol (delta 8-THC) ND ND Cannabinol (CBN) ND ND Cannabigerolic acid (CBGA) ND ND Cannabigerol (CBG) ND ND Tetrahydrocannabivarint (THCV) ND ND Cannabidivarin (CBDV) ND 0.04% Cannabichromene (CBC) ND ND Total potential THC ** 0.39% 0.16% Total potential CBD ** 10.31 4.64 Total Cannabinoids * 12.09 5.49 Note: Total potential THC (**) was calculated as THC + (THCA × 0.877), while total potential CBD (**) was calculated as CBD + (CBDA × 0.877). Total cannabinoids (*) were calculated as the sum of the quantified cannabinoids. Table 6.
Results of the analysis of bioactive compounds in hemp inflorescence samples.
-
Groups Pot
size (L)Plant
spacing (m)Height (cm) Width (cm) AC1 60 1.5 174.25 ± 30.69a 131.63 ± 18.86a,b AC2 40 1.5 145.25 ± 17.56a,b,c,d 121.50 ± 11.05a,b,c AC3 20 1.5 151.50 ± 24.03a,b,c 127.25 ± 14.07a,b AC4 60 1.0 139.38 ± 20.07b,c,d 129.00 ± 17.53a,b AC5 40 1.0 119.38 ± 12.78a 113.13 ± 8.64b,c, AC6 20 1.0 163.00 ± 5.81a,b 135.50 ± 10.34a AC7 60 0.5 162.50 ± 4.89a 129.00 ± 4.80a,b AC8 40 0.5 165.88 ± 8.94a,b 135.00 ± 14.56a,b AC9 20 0.5 127.00 ± 15.51c,d 103.50 ± 11.52c Note: Values are expressed as mean ± SD (n = 8). Data were analyzed using factorial ANOVA followed by Tukey's HSD test for mean separation. Different lowercase letters within a column indicate statistically significant differences among treatment combinations at p < 0.05. Table 7.
Results of growth parameter analysis for the AC/DC hemp strain.
-
Groups Pot size
(L)Plant
spacing (m)Height (cm) Width (cm) CA1 60 1.5 101.75 ± 10.86a 102.75 ± 15.99a,b CA2 40 1.5 105.75 ± 17.32a 107.38 ± 24.18a CA3 20 1.5 122.63 ± 13.78a 112.13 ± 14.44a CA4 60 1.0 96.88 ± 15.85a 93.25 ± 17.61a,b CA5 40 1.0 108.00 ± 15.63a 109.00 ± 13.55a CA6 20 1.0 103.75 ± 22.17a 98.63 ± 14.61a,b CA7 60 0.5 103.13 ± 8.40a 108.75 ± 17.42a CA8 40 0.5 107.38 ± 23.82a 98.13 ± 15.93a,b CA9 20 0.5 108.25 ± 10.17a 87.75 ± 12.30b Note: Values are expressed as mean ± SD (n = 8). Data were analyzed using factorial ANOVA followed by Tukey's HSD test for mean separation. Different lowercase letters within a column indicate statistically significant differences among treatment combinations at p < 0.05. Table 8.
Results of growth analysis of Charlotte's Angel strains.
-
Groups Pot size (L) Plant
spacing (m)Fresh flower
weight (kg)Dry flower
weight (kg)AC1 60 1.5 0.73 ± 0.31a,b 0.27 ± 0.08a,b,c AC2 40 1.5 0.90 ± 0.25a,b 0.28 ± 0.07a,b,c AC3 20 1.5 0.70 ± 0.20a,b 0.21 ± 0.06a,b,c AC4 60 1.0 0.75 ± 0.15a,b 0.23 ± 0.05a,b,c,d AC5 40 1.0 0.76 ± 0.32a,b 0.21 ± 0.12a,b,c,d AC6 20 1.0 1.07 ± 0.38a 0.32 ± 0.11a AC7 60 0.5 0.61 ± 0.20b 0.20 ± 0.06b,c,d AC8 40 0.5 0.82 ± 0.25a,b 0.13 ± 0.08d AC9 20 0.5 0.74 ± 0.25a,b 0.22 ± 0.08a,b,c,d Note: Values are expressed as mean ± SD (n = 8). Data were analyzed using factorial ANOVA followed by Tukey's HSD test for mean separation. Different lowercase letters within a column indicate statistically significant differences among treatment combinations at p < 0.05. Table 9.
Results of fresh and dry inflorescence weight analysis for the AC/DC hemp strain.
-
Groups Pot size (L) Plant spacing (m) Fresh flower weight (kg) Dry flower weight (kg) CA1 60 1.5 0.70 ± 0.22a,b 0.20 ± 0.06a,b CA2 40 1.5 0.70 ± 0.21a,b 0.30 ± 0.08a CA3 20 1.5 0.69 ± 0.27a,b 0.32 ± 0.09a,b CA4 60 1.0 0.69 ± 0.23a,b 0.29 ± 0.09a,b CA5 40 1.0 0.88 ± 0.24a,b 0.23 ± 0.11a,b CA6 20 1.0 0.73 ± 0.25a 0.49 ± 0.19a CA7 60 0.5 0.53 ± 0.16b 0.30 ± 0.08a,b CA8 40 0.5 0.86 ± 0.19a,b 0.18 ± 0.08b CA9 20 0.5 0.81 ± 0.29a,b 0.28 ± 0.13a,b Note: Values are expressed as mean ± SD (n = 8). Data were analyzed using factorial ANOVA followed by Tukey's HSD test for mean separation. Different lowercase letters within a column indicate statistically significant differences among treatment combinations at p < 0.05. Table 10.
Results of weight analysis of fresh and dry inflorescences of Charlotte's Angel.
-
Treatment AC/DC
fresh (kg·m−2)AC/DC
dry (kg·m−2)Charlotte
fresh (kg·m−2)Charlotte
dry (kg·m−2)1.5 m; 60 L 0.32 0.12 0.31 0.09 1.5 m; 40 L 0.40 0.12 0.31 0.13 1.5 m; 20 L 0.31 0.09 0.31 0.14 1.0 m; 60 L 0.75 0.23 0.69 0.29 1.0 m; 40 L 0.76 0.21 0.88 0.32 1.0 m; 20 L 1.07 0.32 0.73 0.49 0.5 m; 60 L 2.44 0.80 2.12 1.20 0.5 m; 40 L 3.28 0.52 3.44 1.40 0.5 m; 20 L 2.96 0.88 3.24 1.12 Table 11.
Yield per unit area.
Figures
(6)
Tables
(11)