-
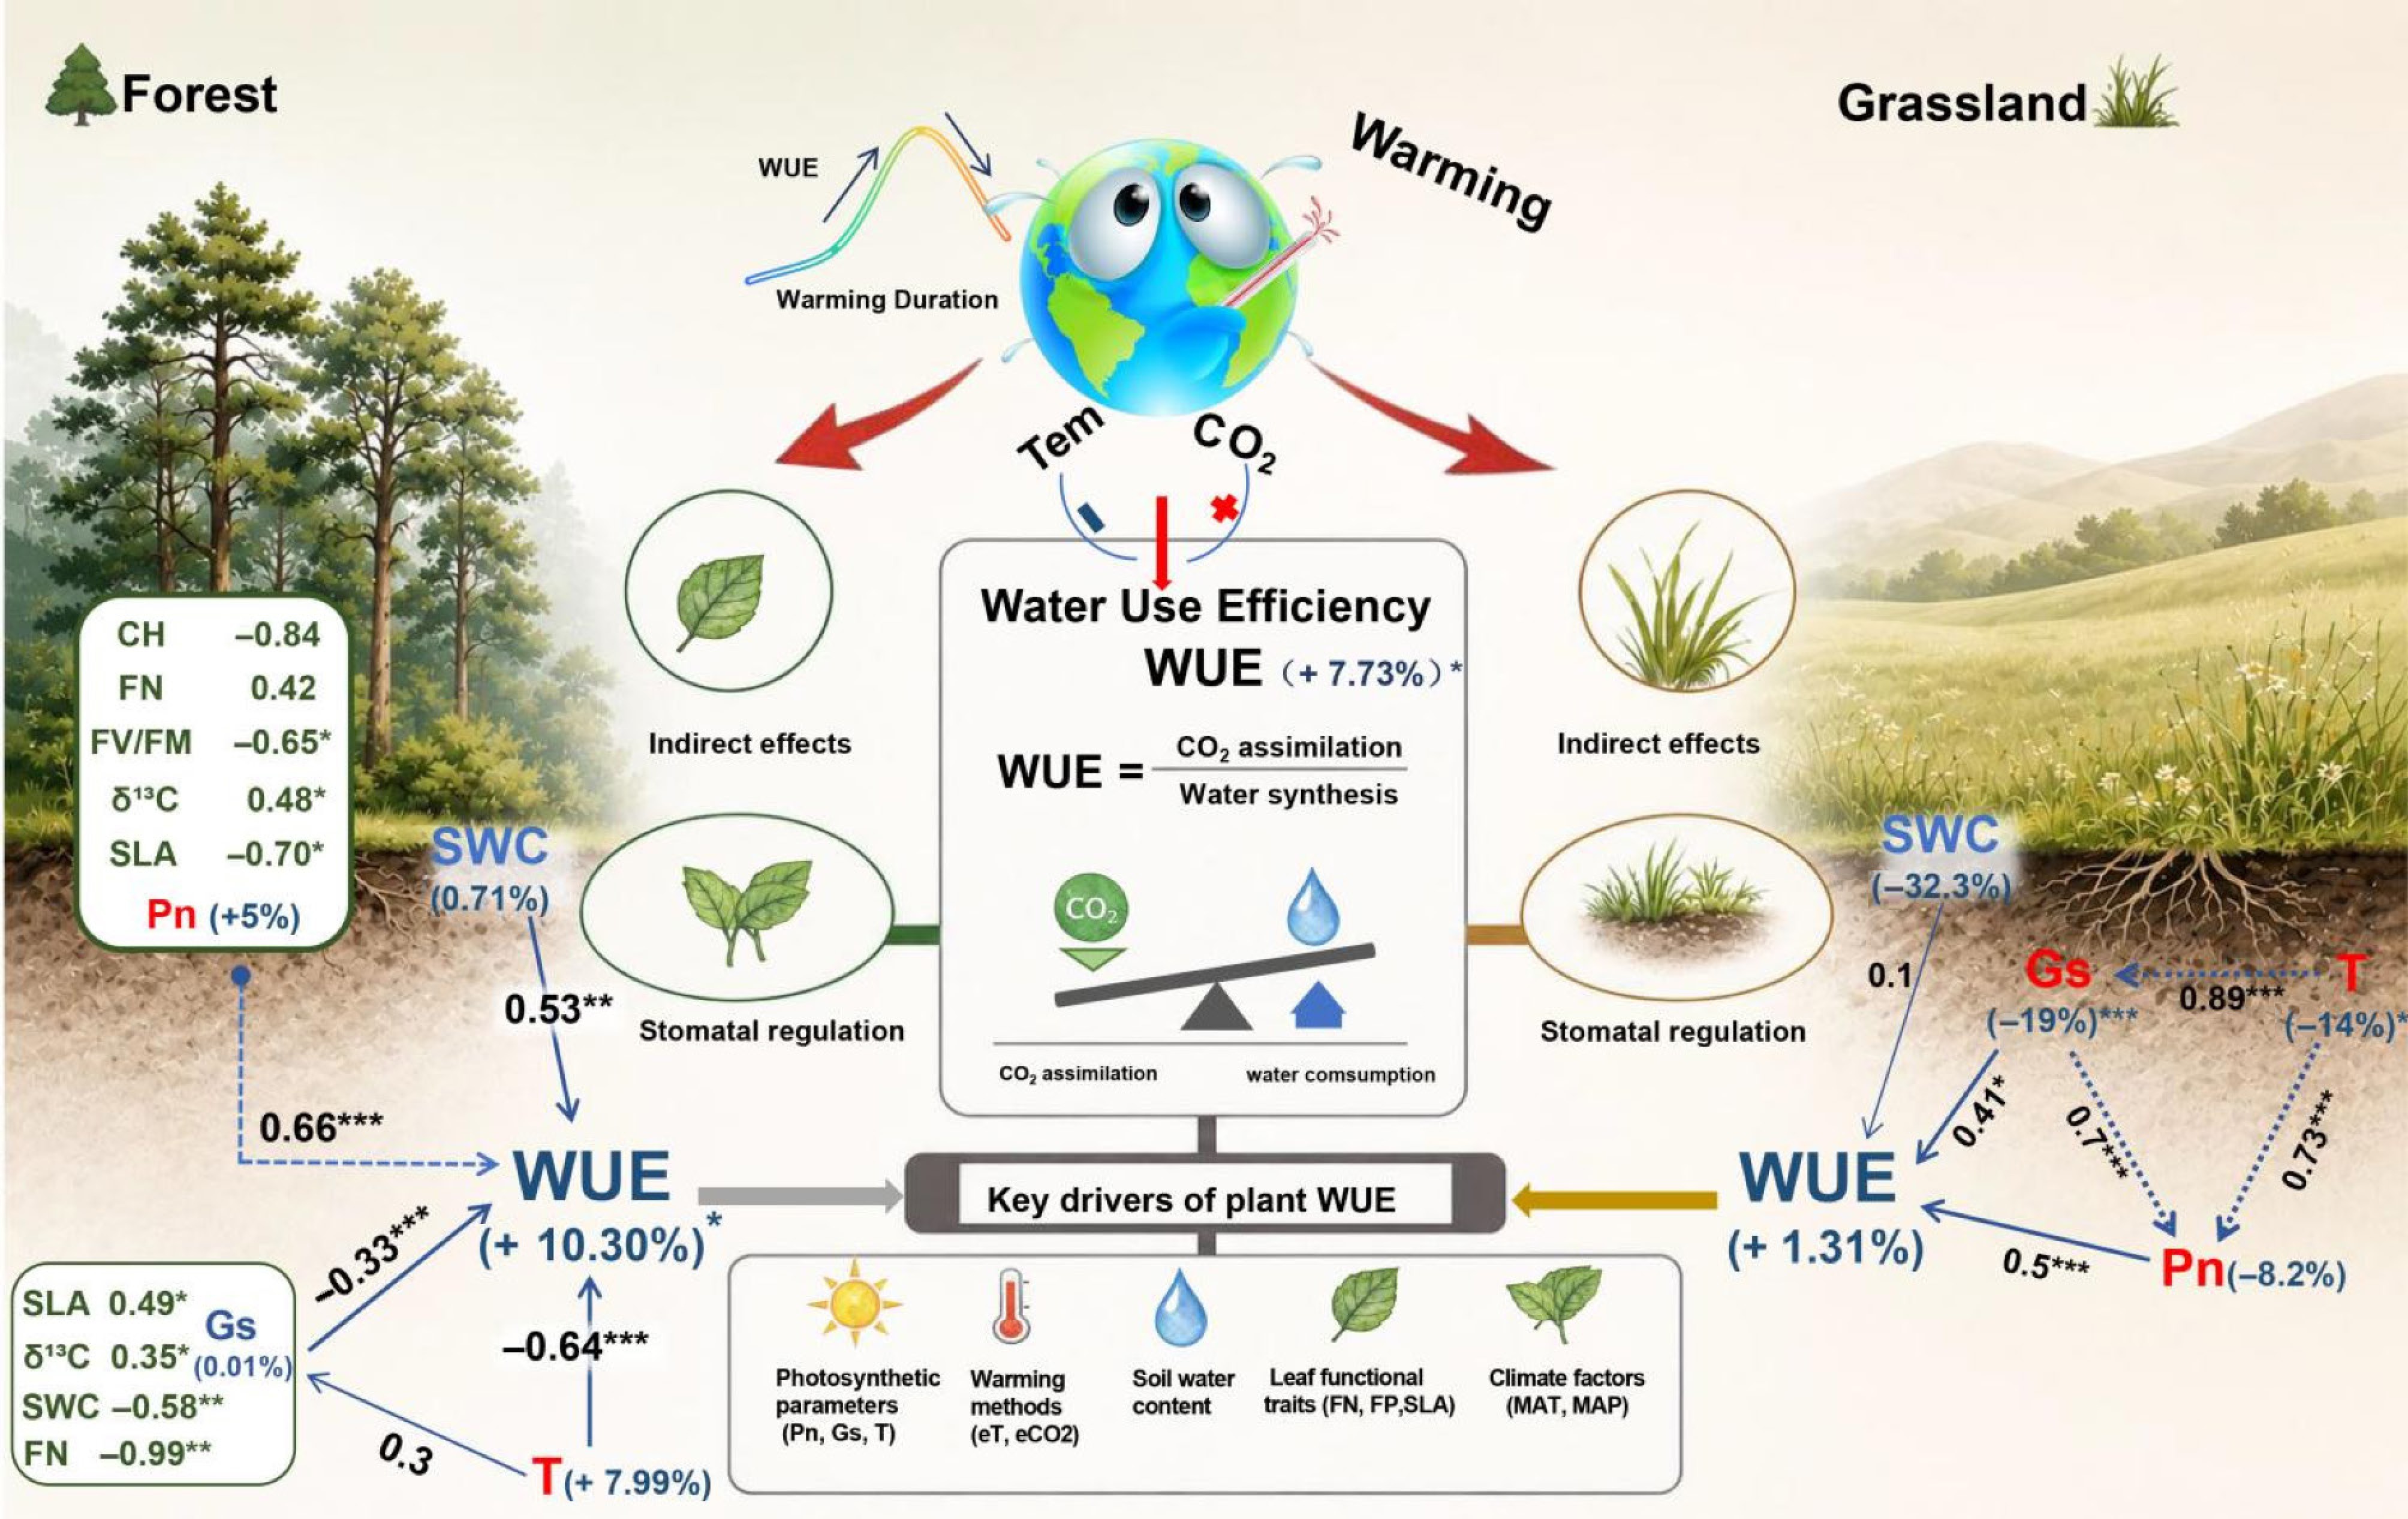
Figure 1.
Conceptual diagram showing warming effects on the processes affecting plant WUE in forest and grassland ecosystems. * Indicates a significant correlation at the p < 0.05 level, ** indicates an extremely significant correlation at the p < 0.01 level, and *** indicates an extremely significant correlation at the p < 0.001 level. '+' and '−' indicate expected positive and negative effects, respectively. WUE, water use efficiency; δ13 C, carbon stable isotope composition; Pn, net photosynthetic rate; Gs, stomatal conductance; T, transpiration rate; FV/FM, maximum quantum yield of PSII; CH, chlorophyll; SWC, soil water content; FN, foliar nitrogen; FP, foliar phosphorus; SLA, specific leaf area; eT, elevated temperature; eCO2, elevated CO2 concentration; MAT, mean annual temperature; MAP, mean annual precipitation.
-
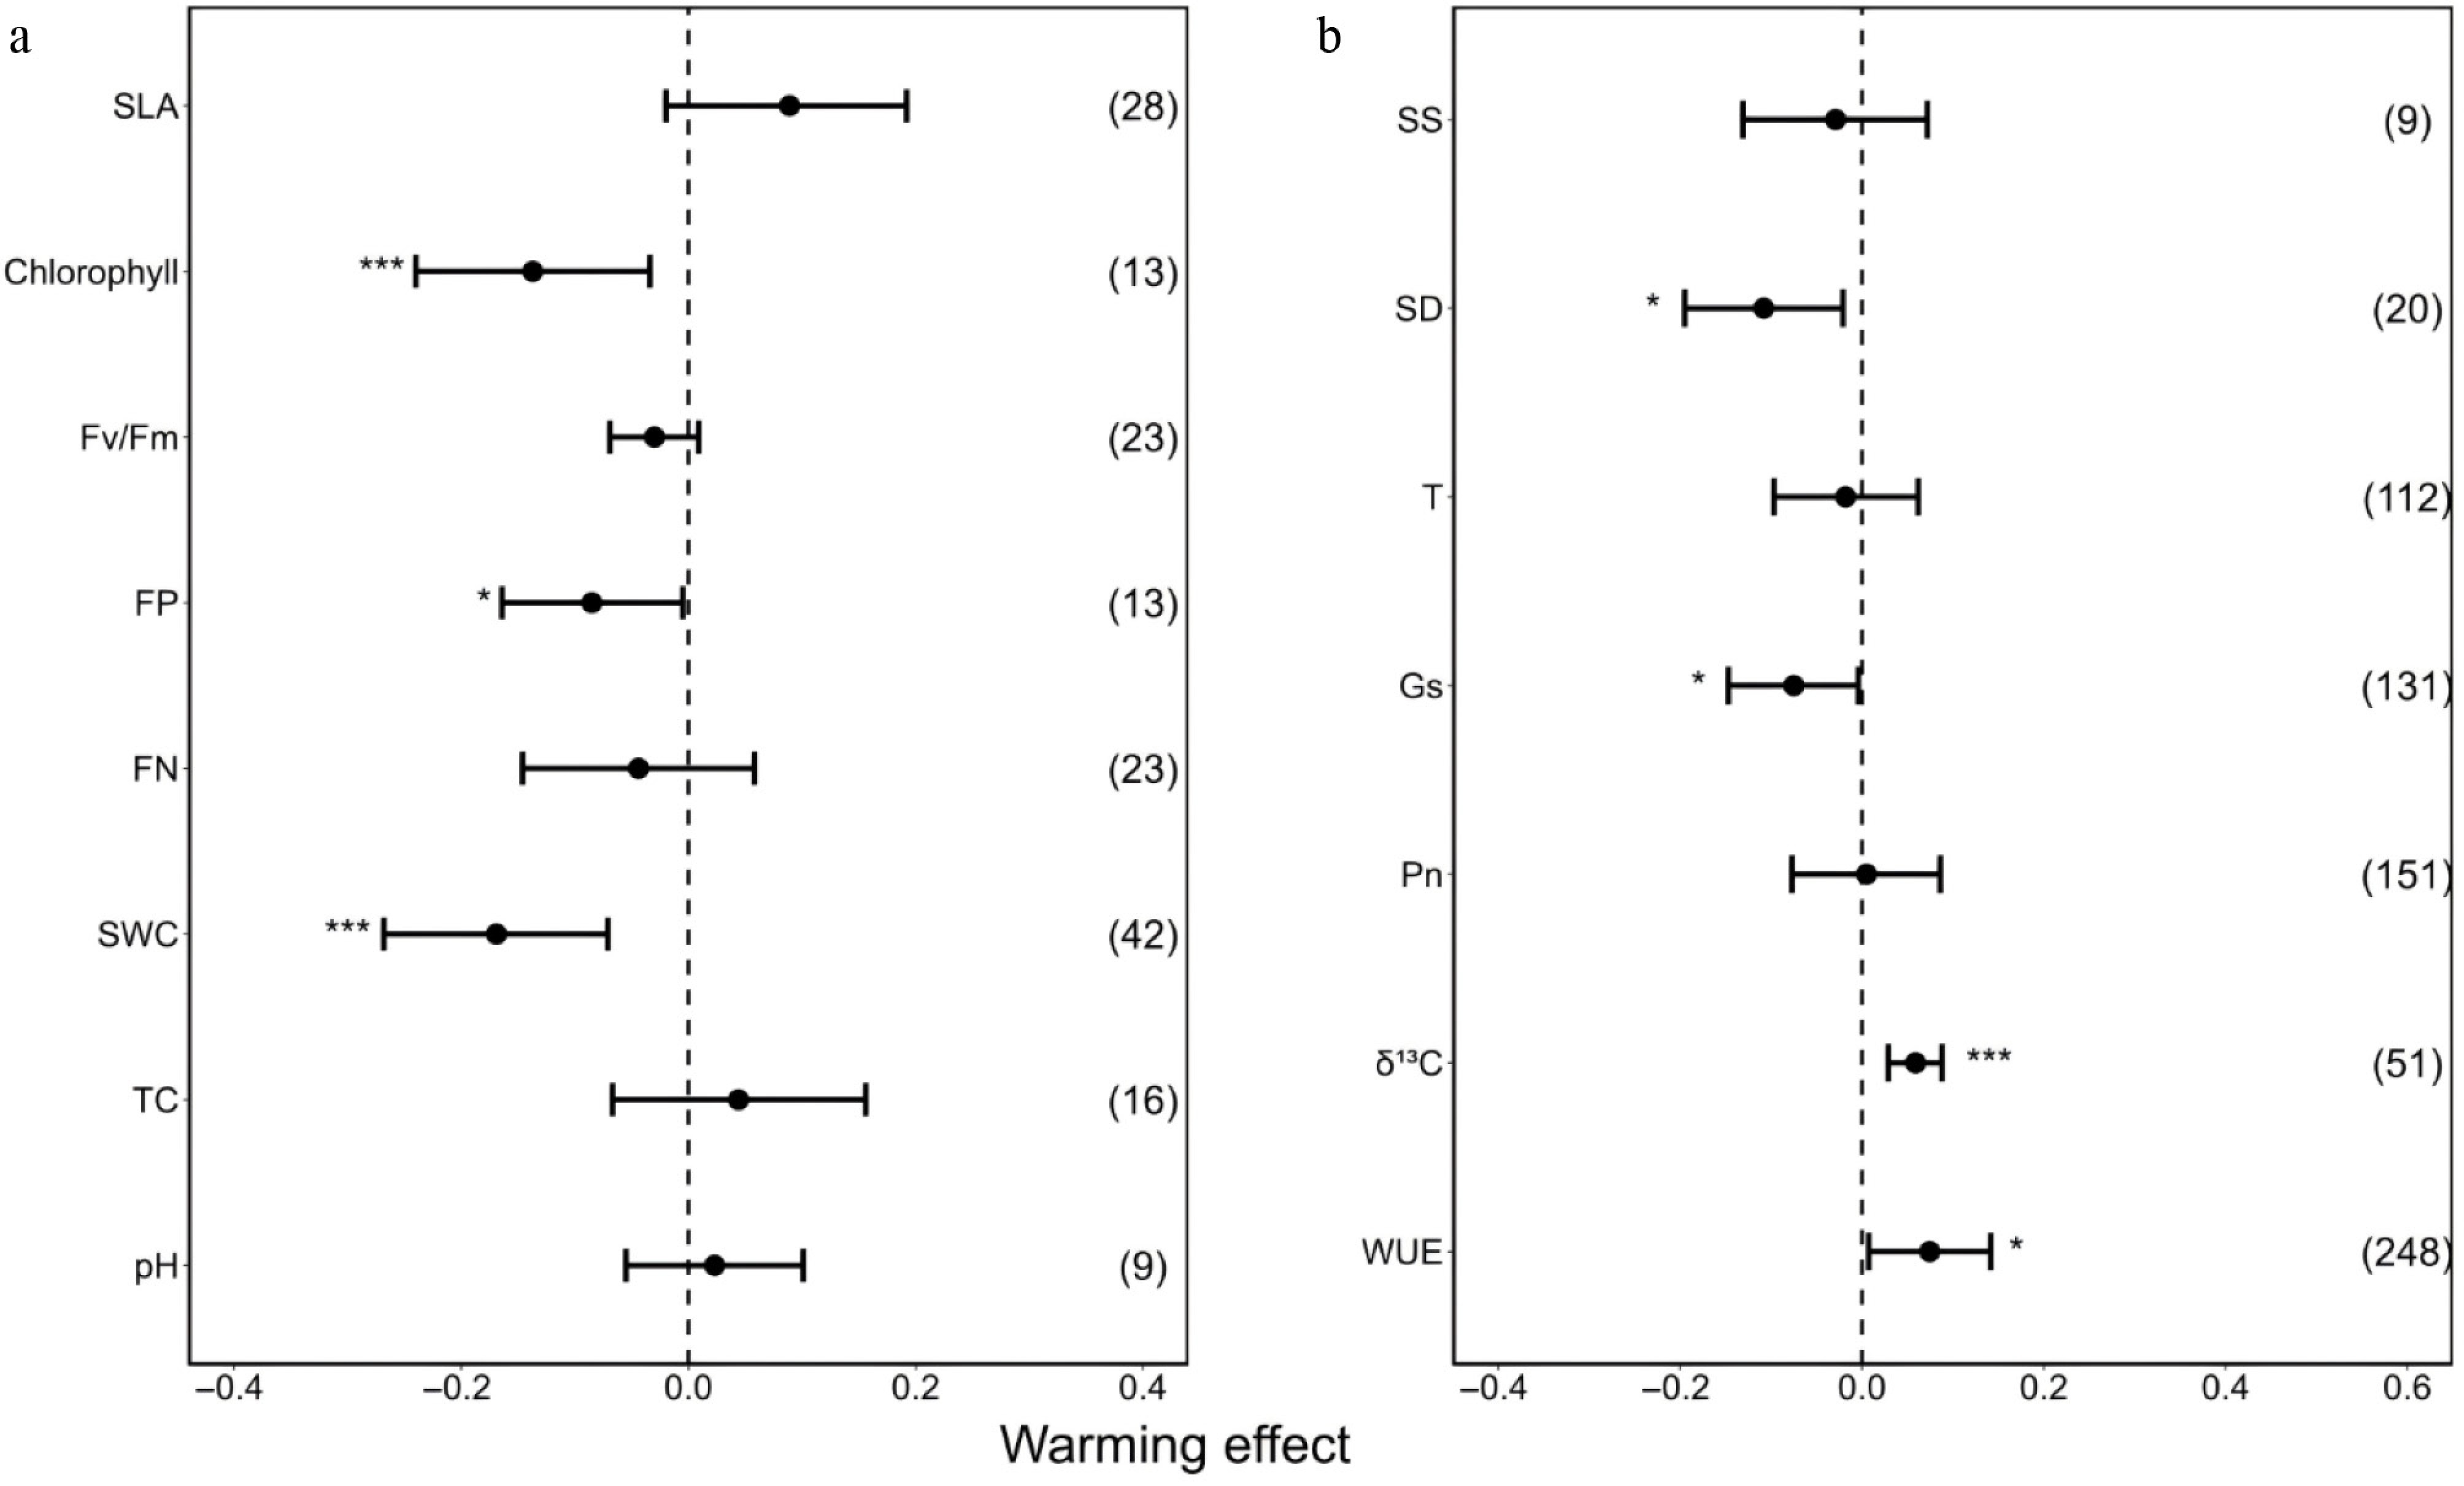
Figure 2.
Overall effect size of warming on plant WUE and related factors in (a) forests and (b) grasslands. Values represent means and 95% CIs. Numbers inside parentheses indicate observation numbers. * Indicates a significant correlation at the p < 0.05 level, ** indicates an extremely significant correlation at the p < 0.01 level, and *** indicates an extremely significant correlation at the p < 0.001 level. WUE, water use efficiency; δ13 C, carbon stable isotope composition; Pn, net photosynthetic rate; Gs, stomatal conductance; T, transpiration rate; SD, stomatal density; SS, stomatal size; TC, total carbon; SWC, soil water content; FN, foliar nitrogen; FP, foliar phosphorus; FV/FM, Maximum quantum yield of PSII; SLA, specific leaf area.
-
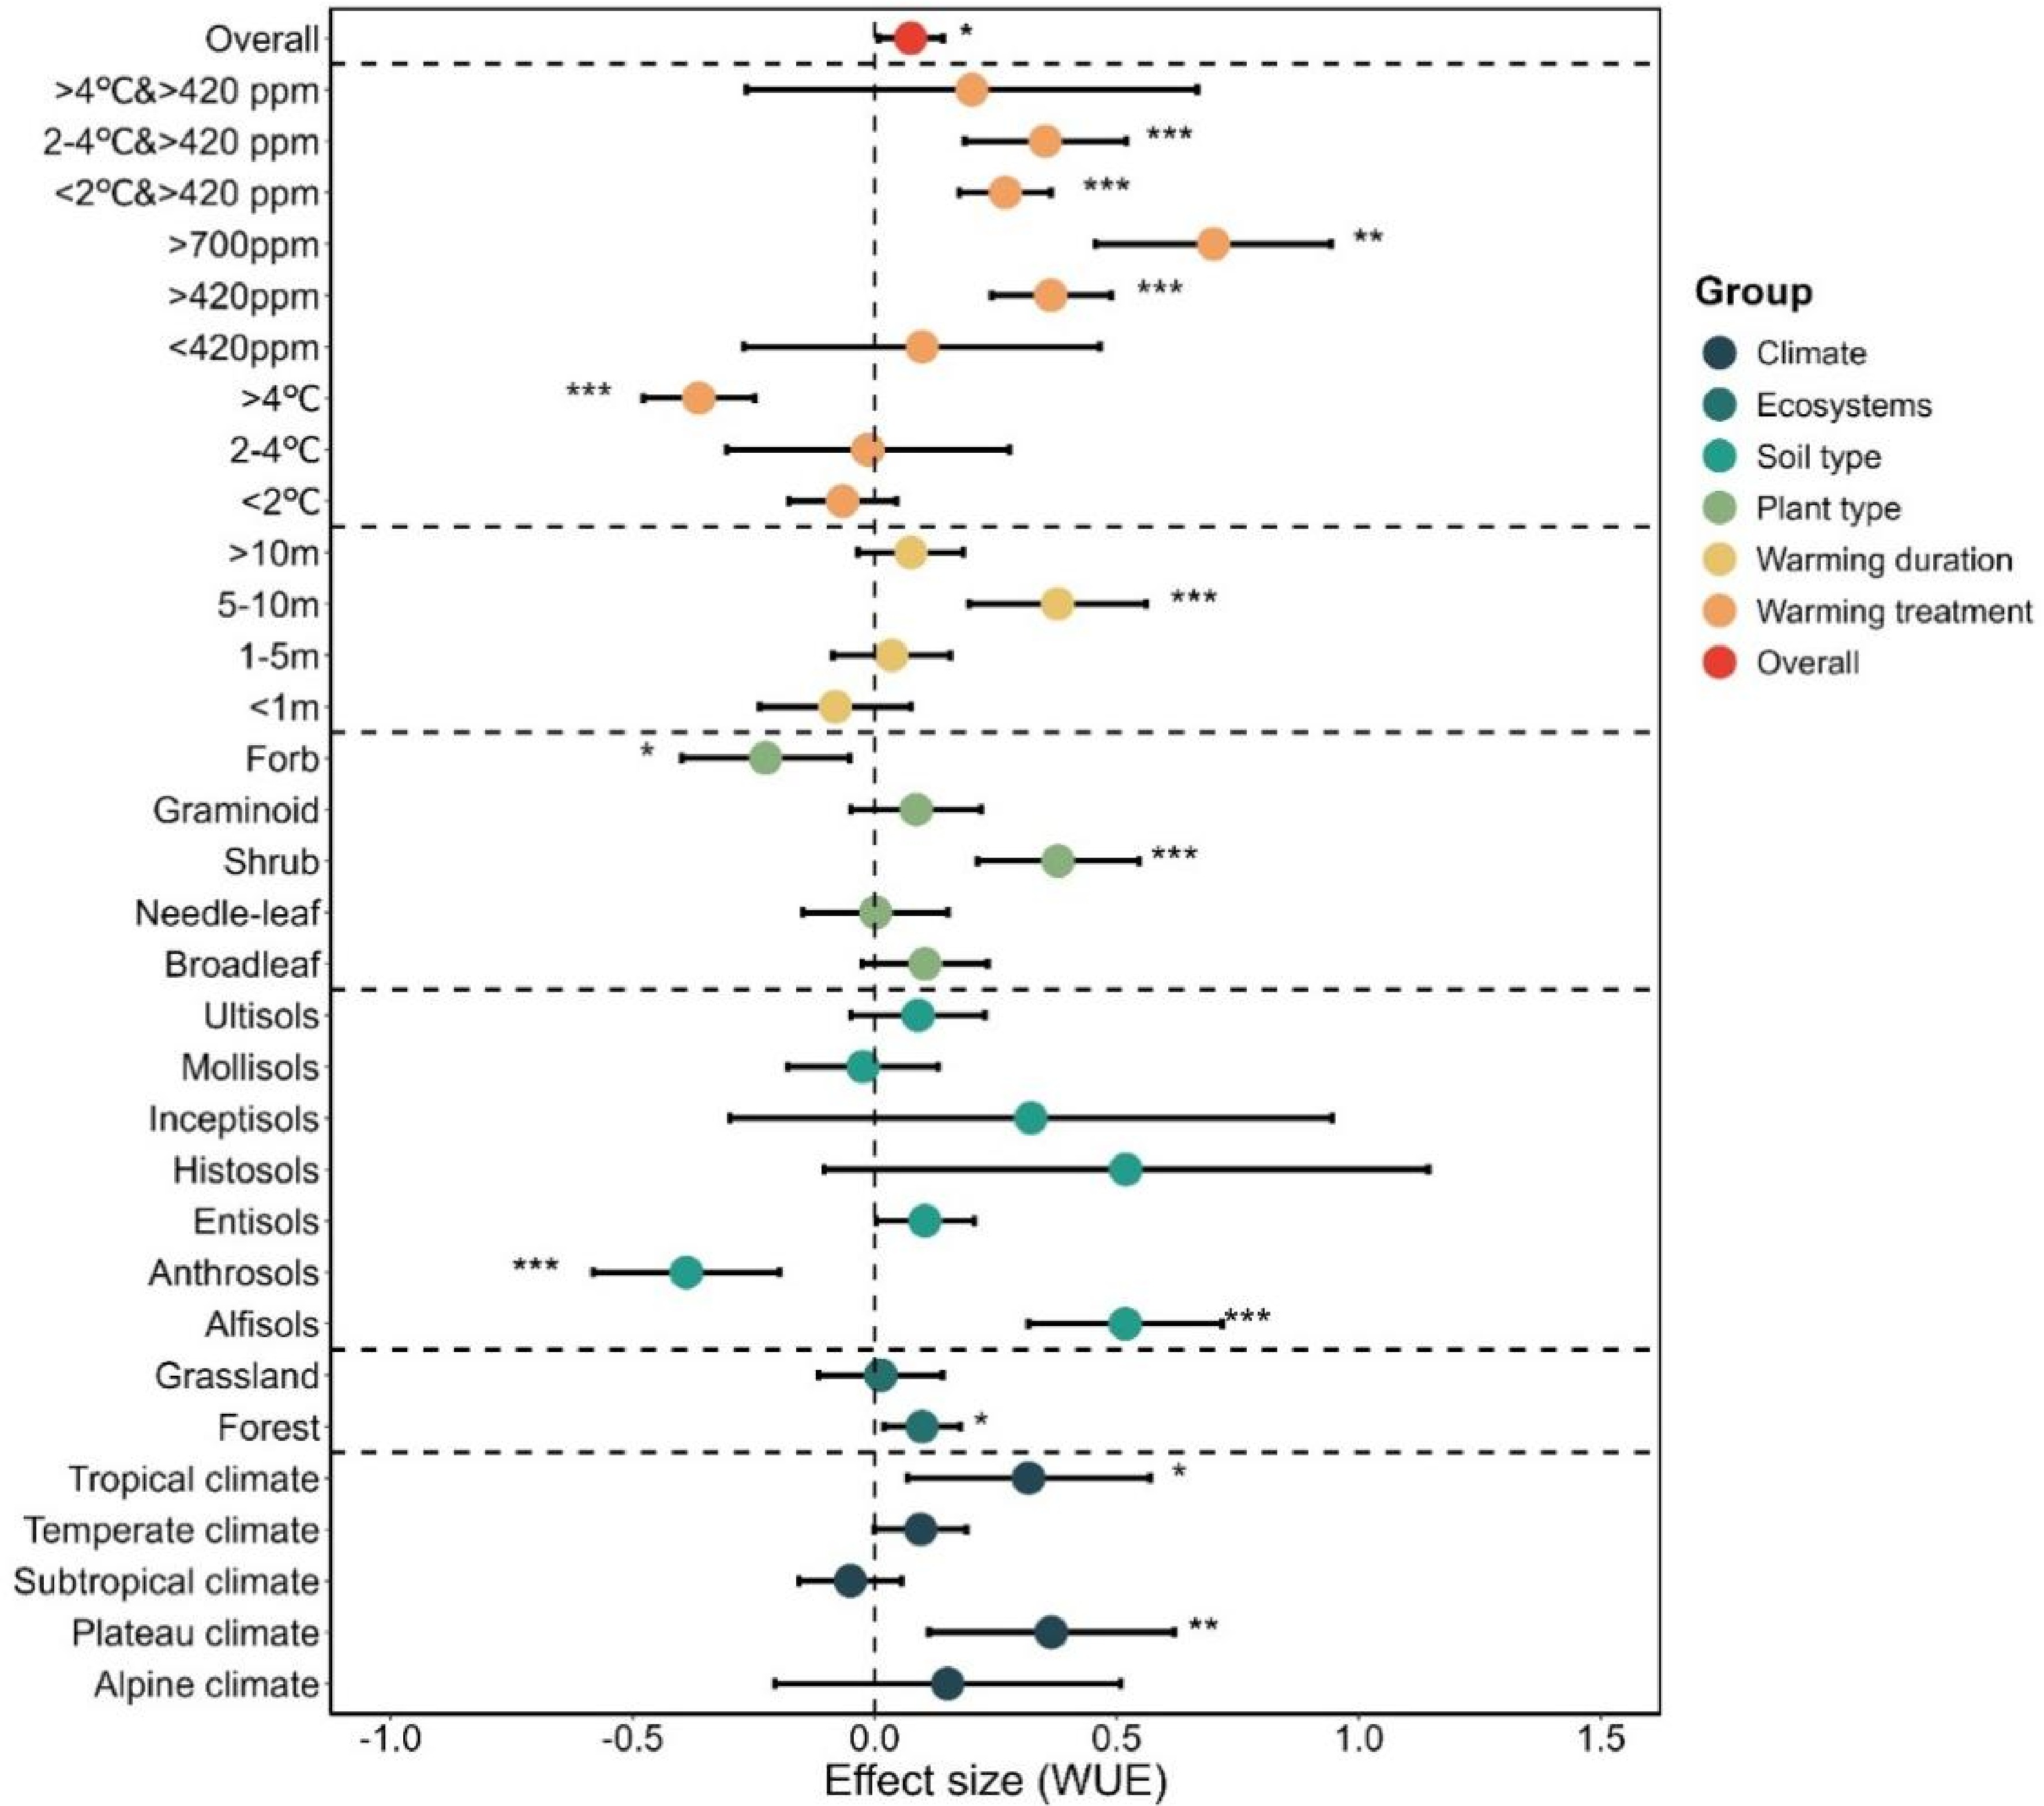
Figure 3.
Subgroup effect size of warming treatment (intensity and duration), ecosystems, soil texture, and plant types on plant WUE in forests and grasslands. Values represent lnRR and 95% CIs. * Indicates a significant correlation at the p < 0.05 level, ** indicates an extremely significant correlation at the p < 0.01 level, and *** indicates an extremely significant correlation at the p < 0.001 level.
-
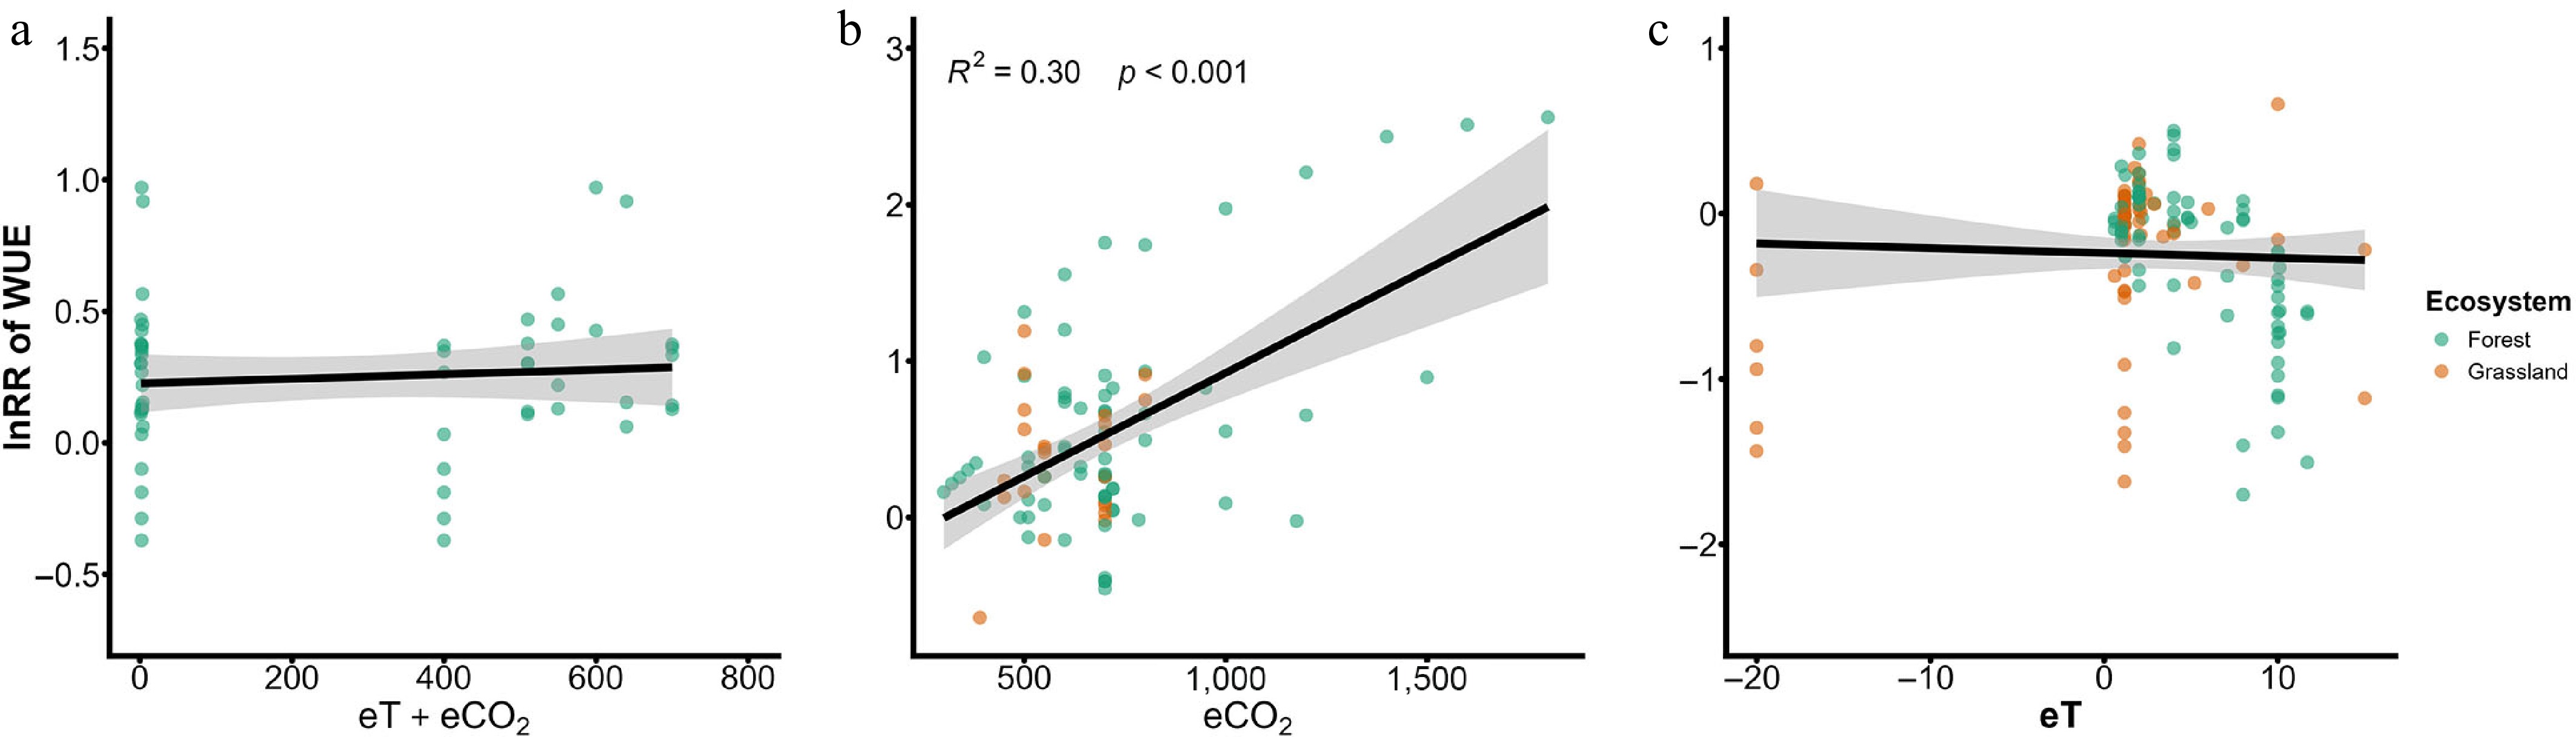
Figure 4.
Effects of different warming (eT, eCO2, and eT + eCO2) on WUE in forests and grasslands. The points represent the values predicted by the partial regression approach of warming treatments. Dashed lines show the average lnRR of WUE, whereas black lines show the mean responses with the 95% CI shaded.
-
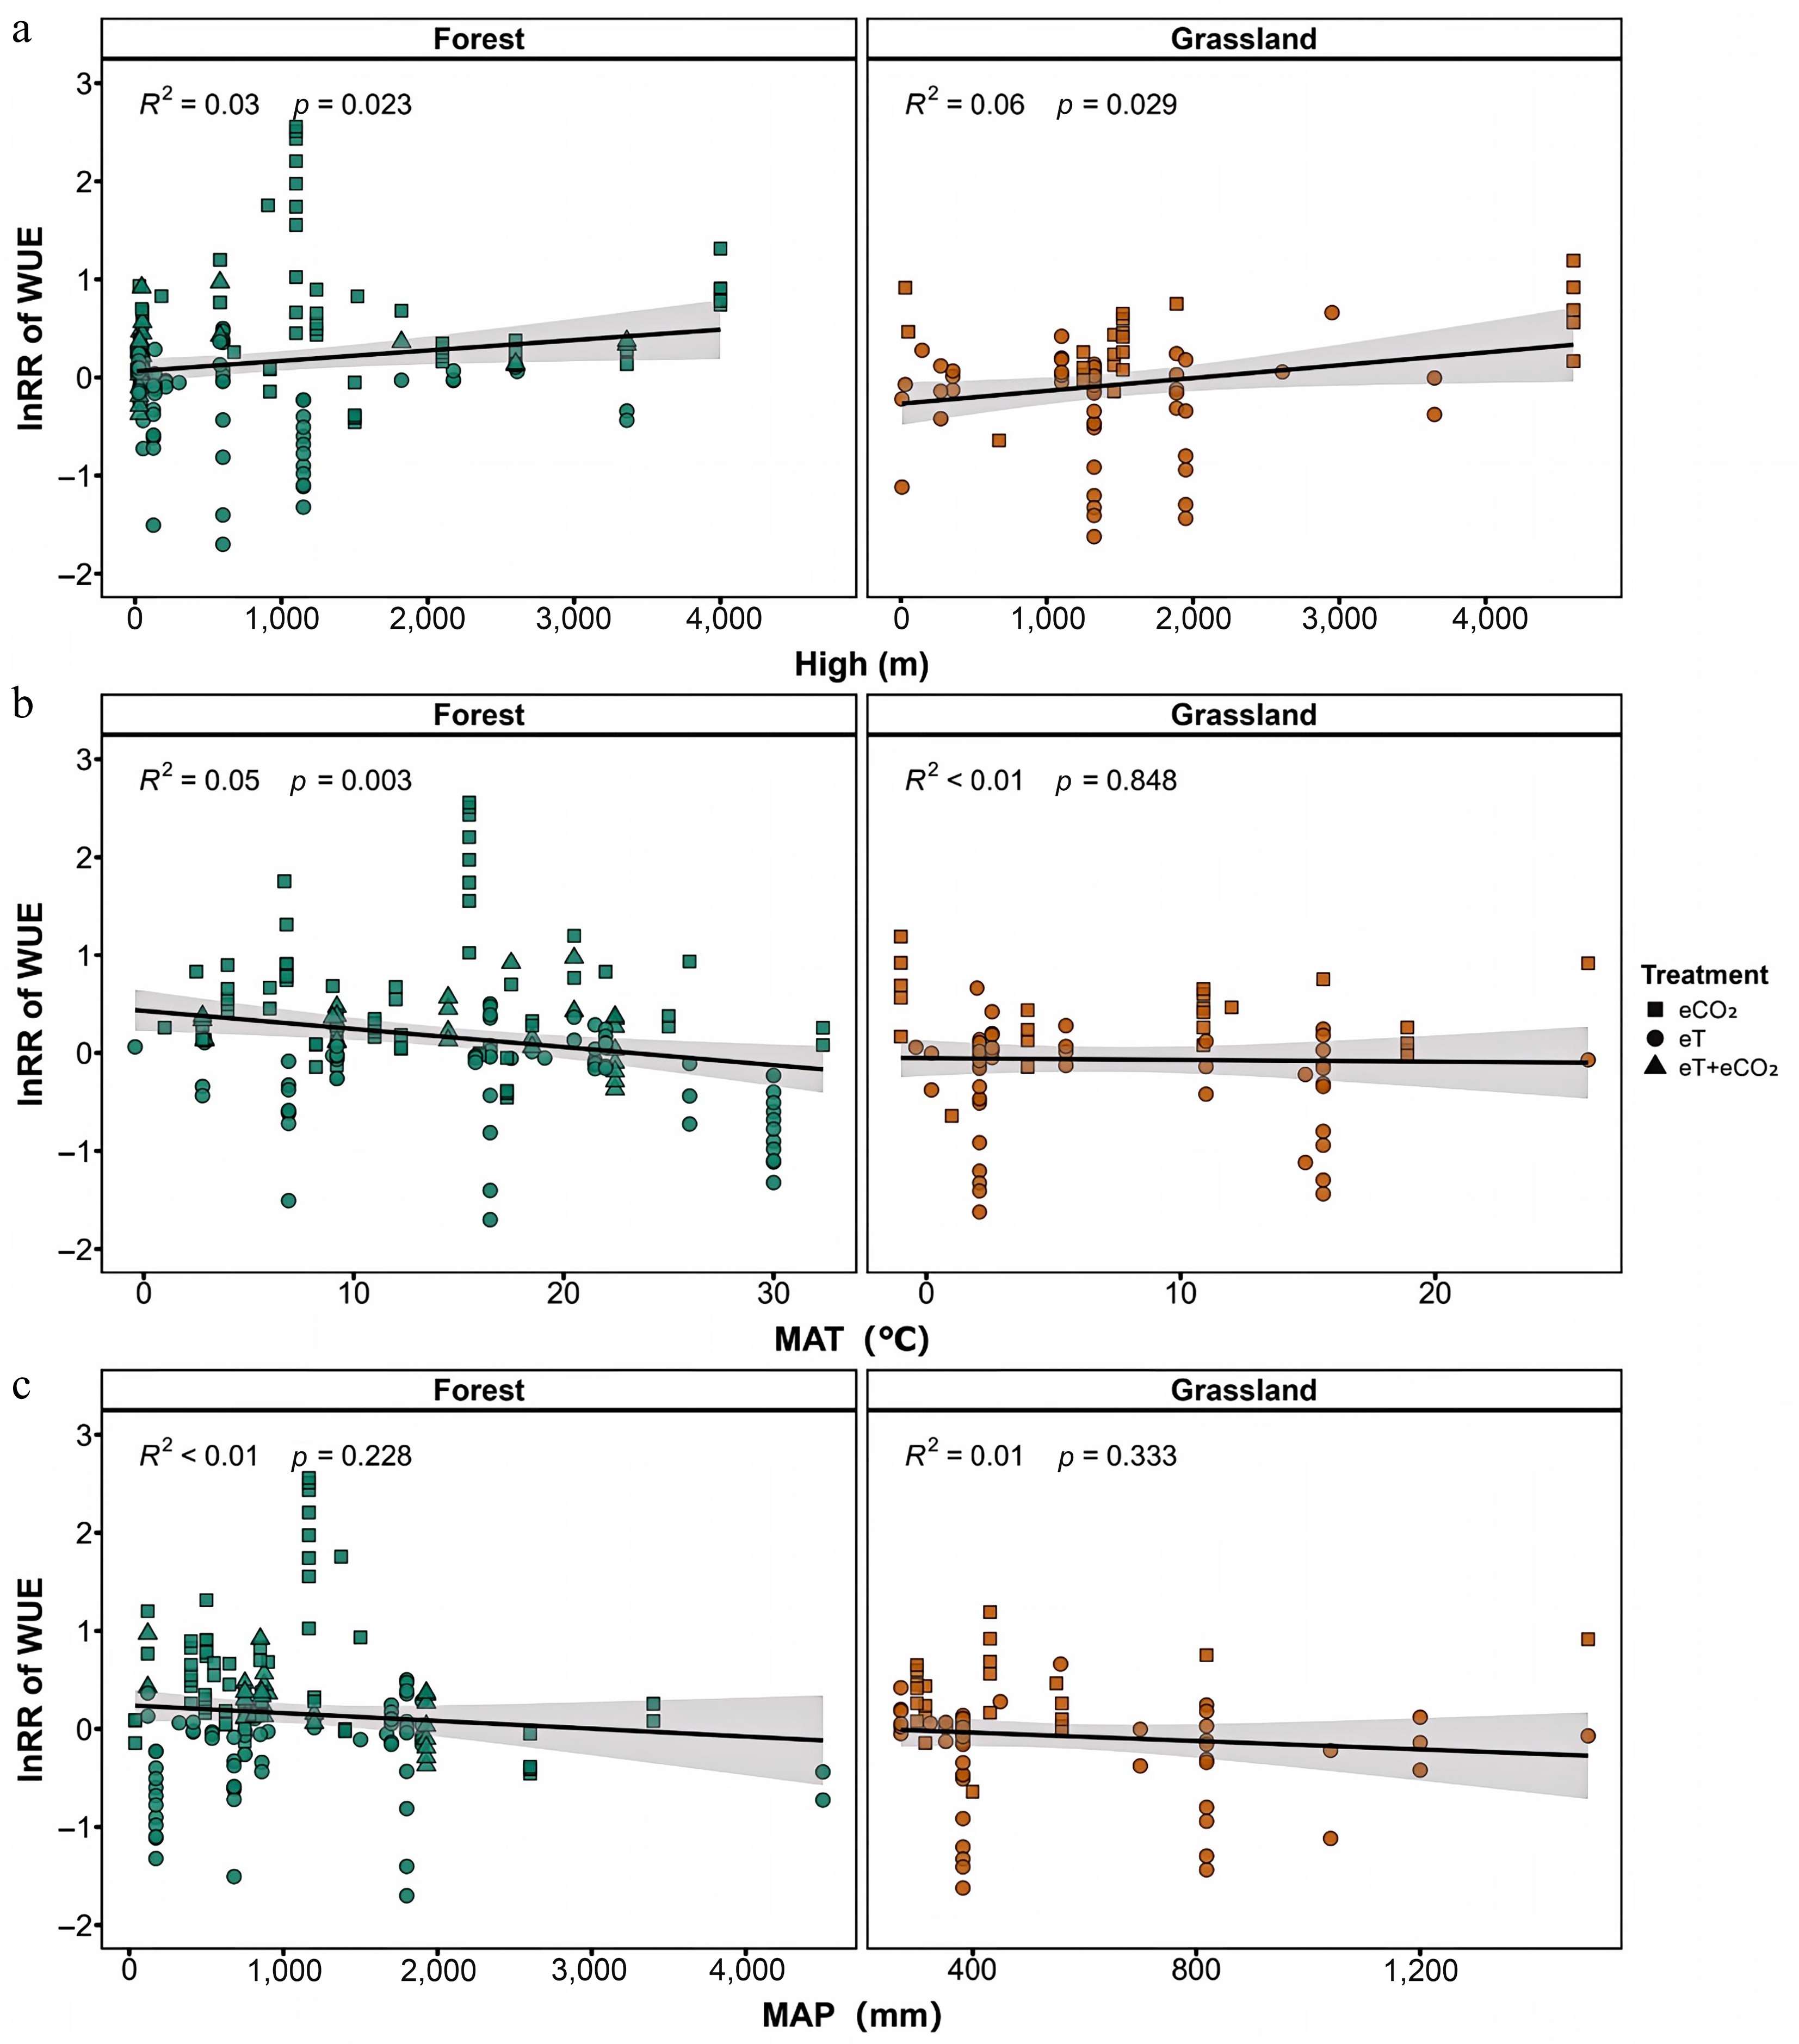
Figure 5.
Effects of MAT, MAP, and high on WUE in forests and grasslands. The points represent the values predicted by the partial regression approach of environmental factors. MAT, mean annual temperature; MAP, mean annual precipitation. Dashed lines show the average lnRR of WUE, whereas black lines show the mean responses with the 95% CI shaded.
-
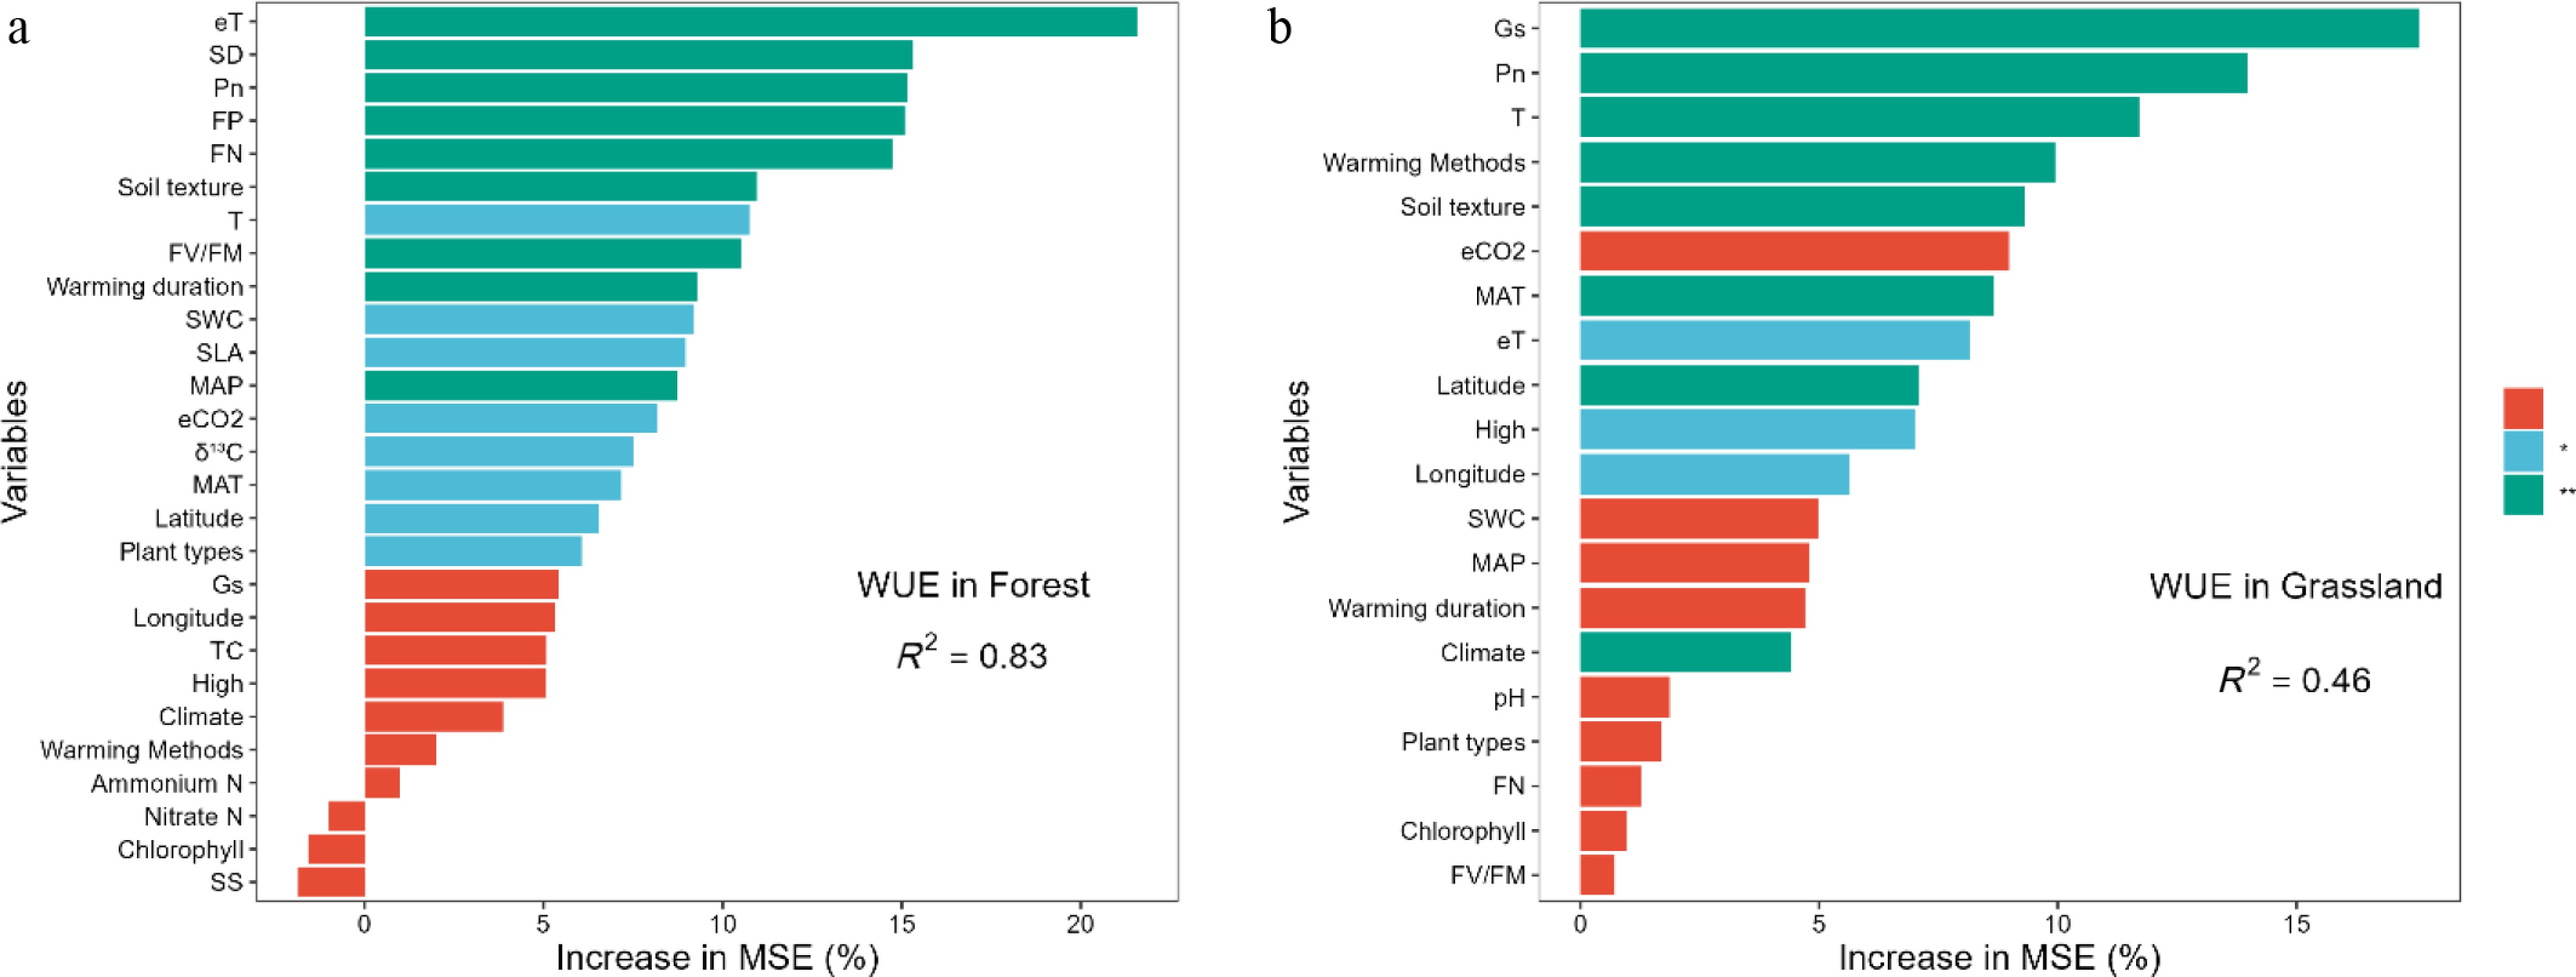
Figure 6.
Variable importance of explanatory factors based on the Random Forest model in (a) forests and (b) grasslands. WUE, water use efficiency; δ13 C, carbon stable isotope composition; Pn, net photosynthetic rate; Gs, stomatal conductance; T, transpiration rate; SD, stomatal density; SS, stomatal size; TC, total carbon; SWC, soil water content; FN, foliar nitrogen; FP, foliar phosphorus; FV/FM, Maximum quantum yield of PSII; SLA, specific leaf area; eT, elevated temperature; eCO2, elevated CO2 concentration; MAT, mean annual temperature; MAP, mean annual precipitation.
-
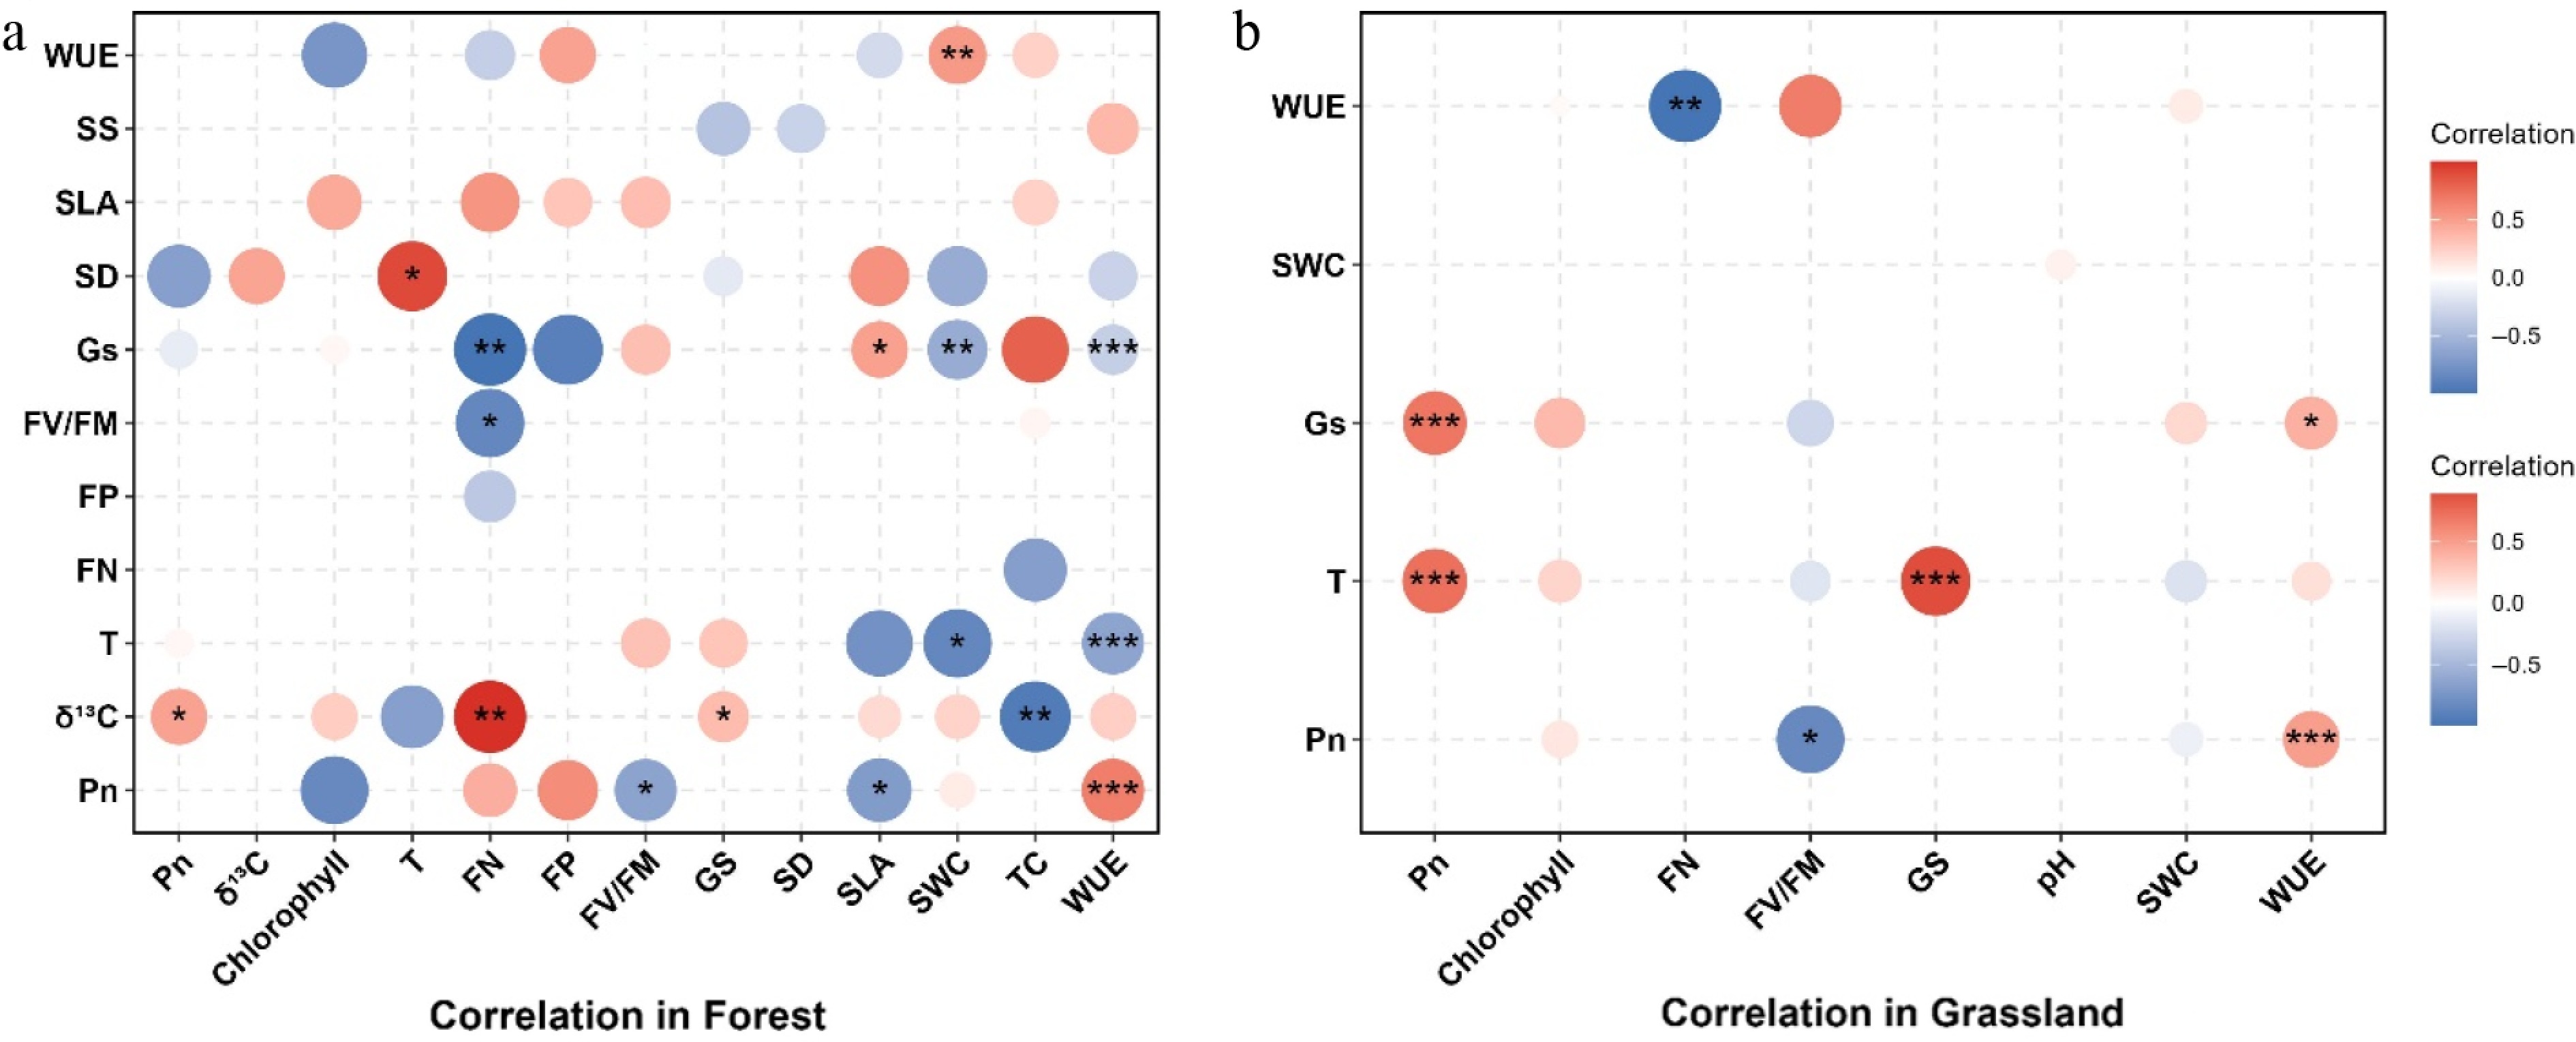
Figure 7.
The correlation between plant WUE and abiotic factors under warming treatment in (a) forests and (b) grasslands. The numbers in the box indicate the correlation coefficient and significance.
Figures
(7)
Tables
(0)