-
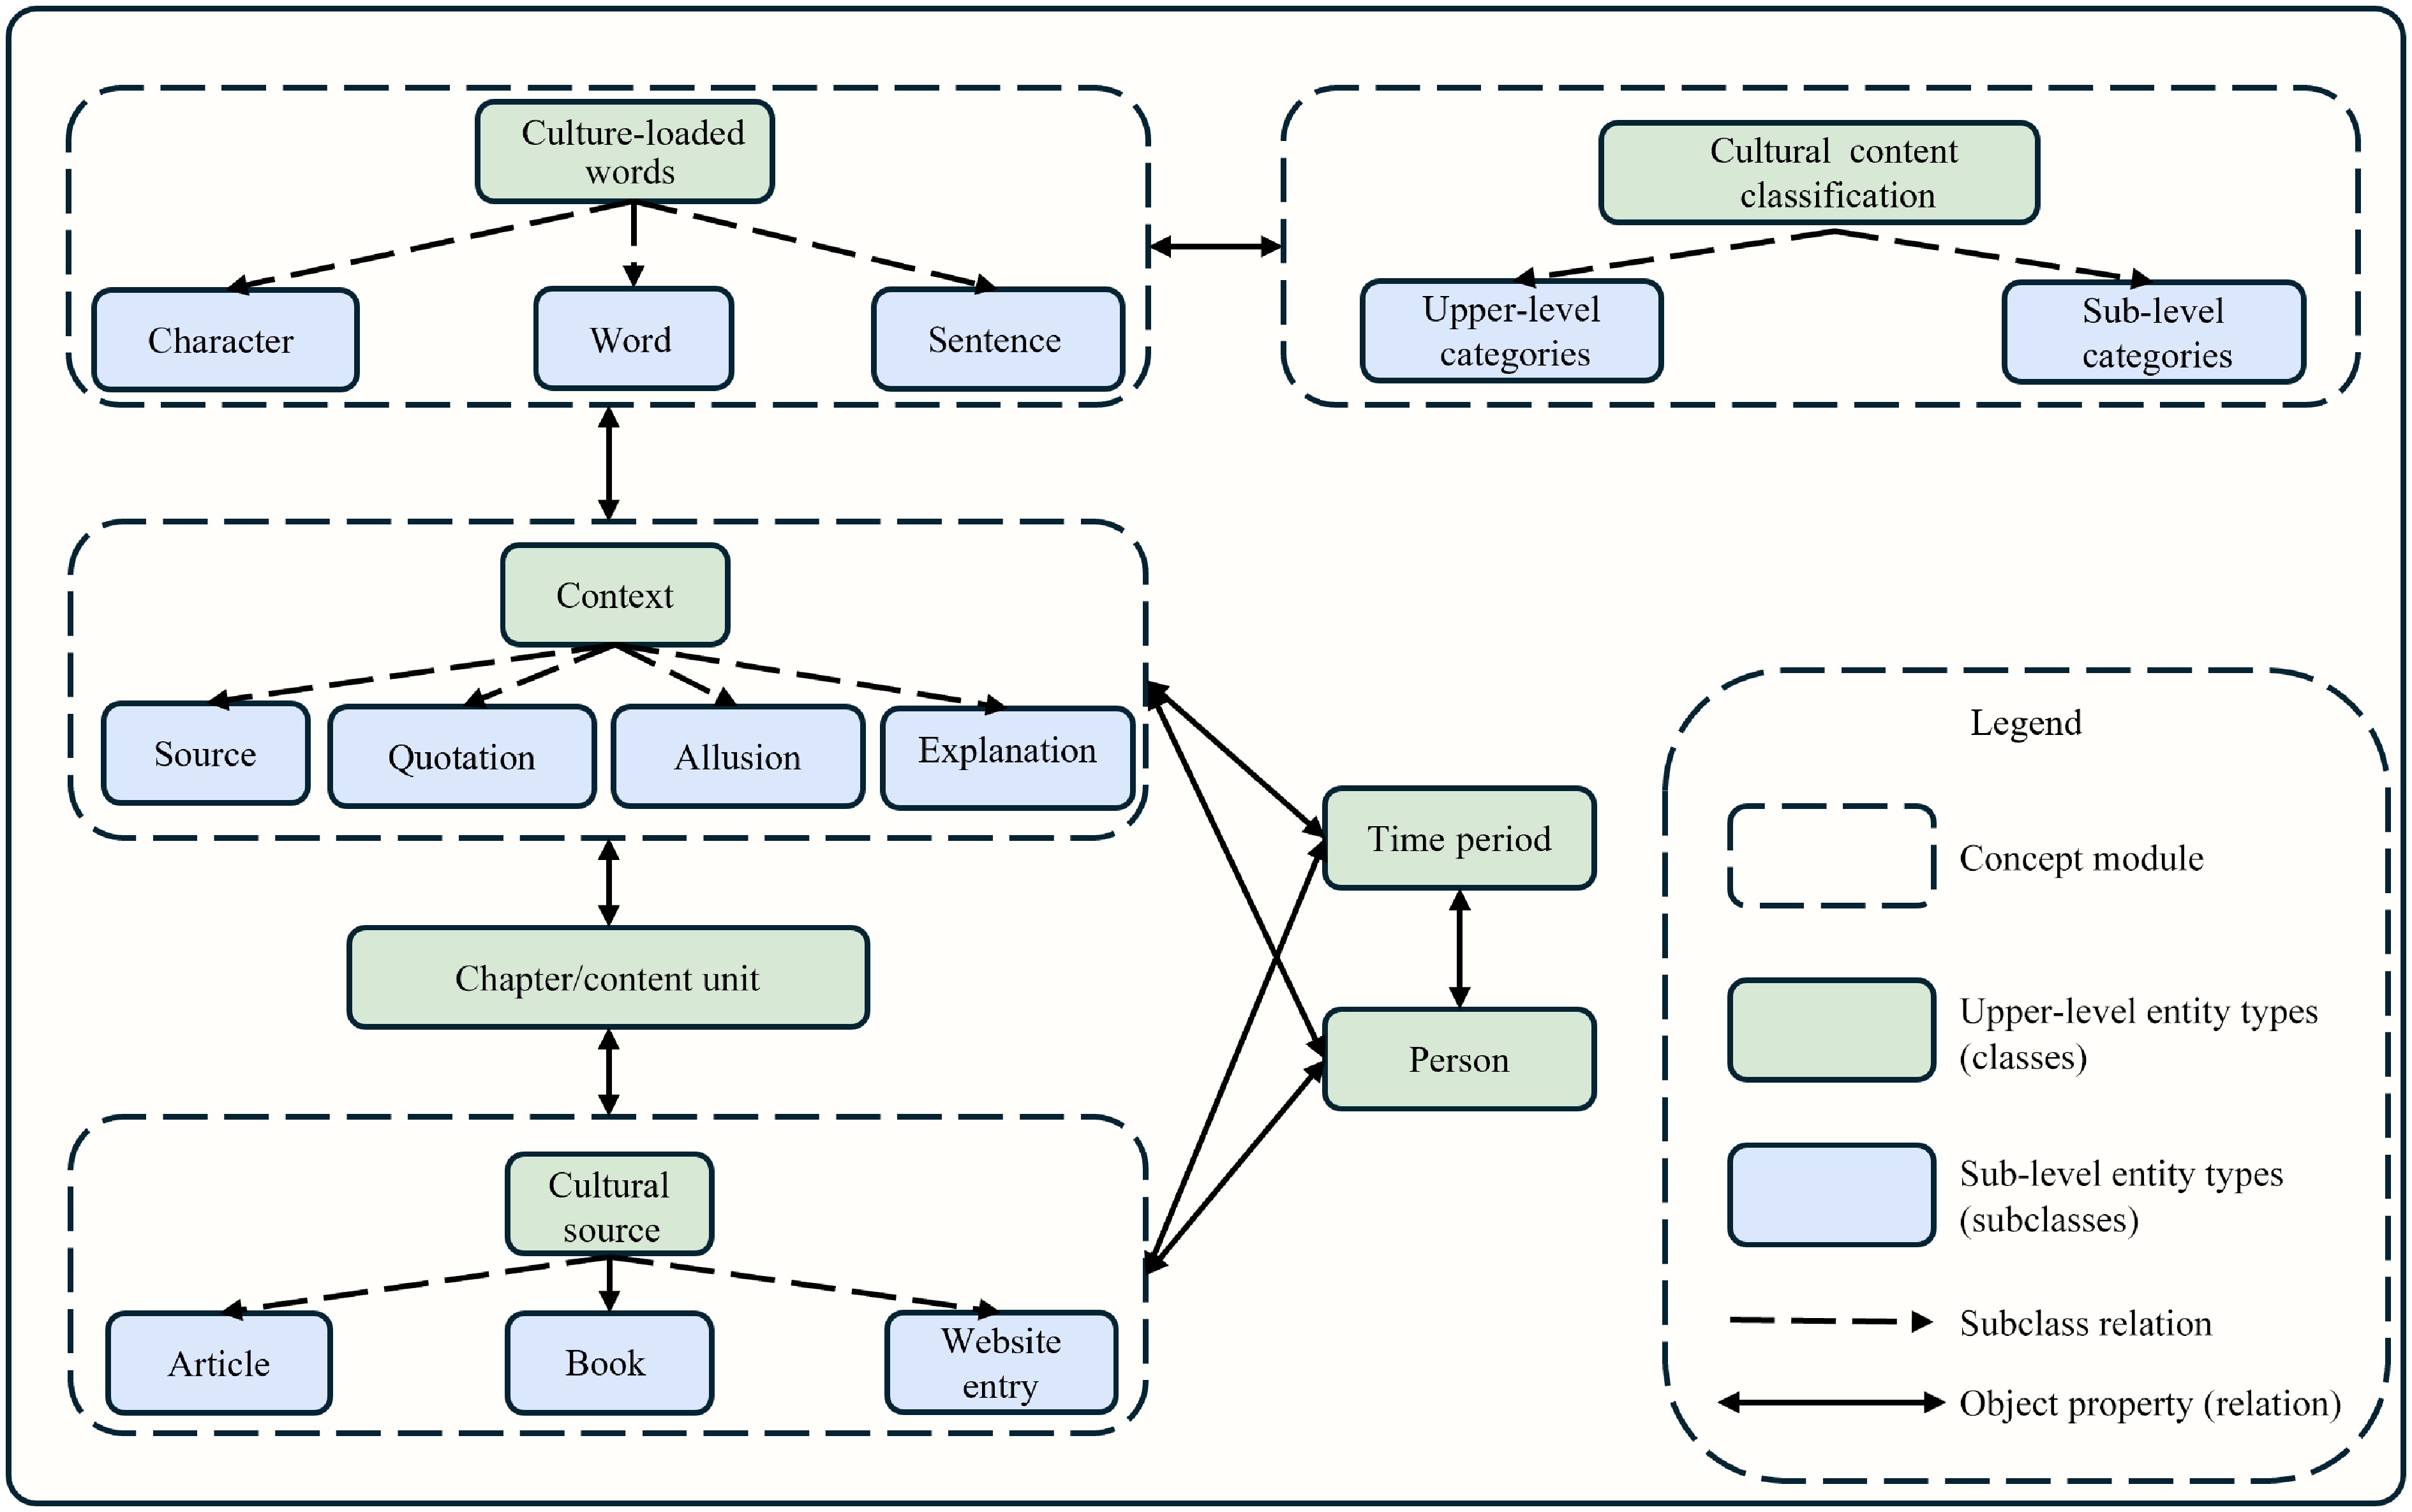
Figure 1.
Schematic diagram of the ontology structure of the Chinese culture-loaded words knowledge graph. The figure illustrates the hierarchical and object property relations among culture-loaded words, context, cultural content classification, and source chains.
-
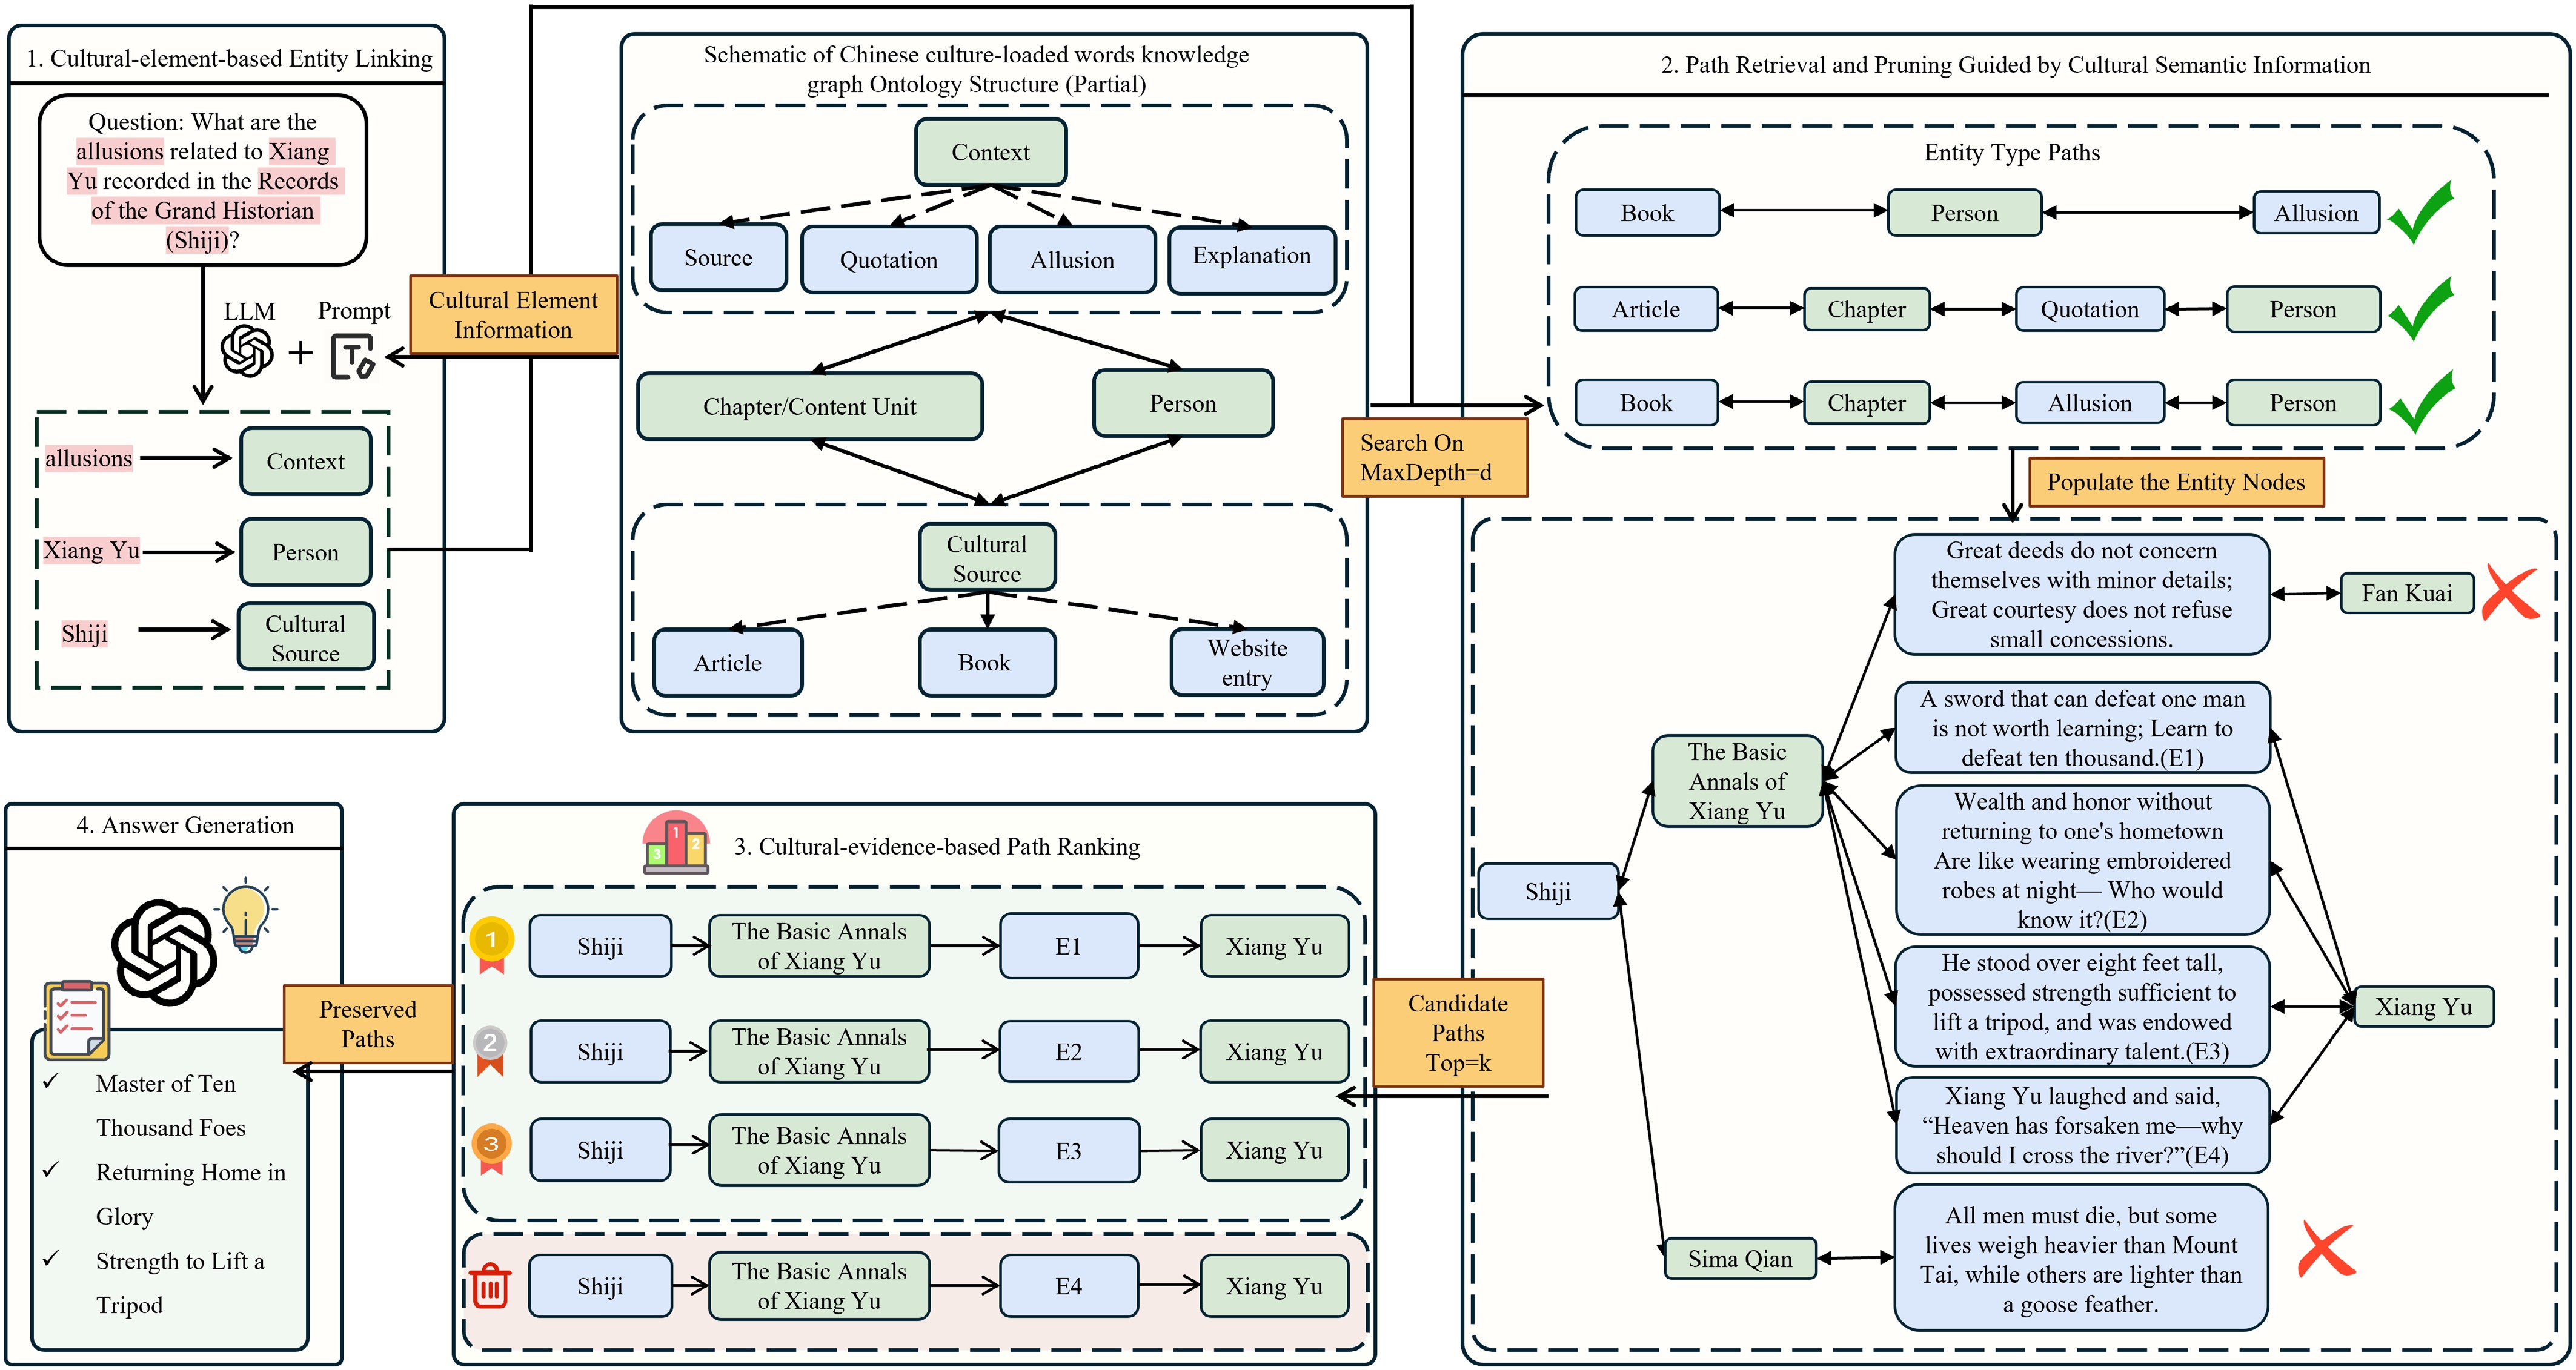
Figure 2.
Overall architecture of the proposed CEAF-CLWQA framework: an LLM first identifies cultural elements and links entities under constraints, then retrieves and prunes candidate knowledge-graph paths with cultural semantic guidance (within a maximum depth, d), ranks the resulting cultural evidence paths, and finally generates a traceable answer grounded in the selected evidence. An example question about the allusions related to Xiang Yu recorded in Shiji is shown to illustrate the end-to-end workflow.
-
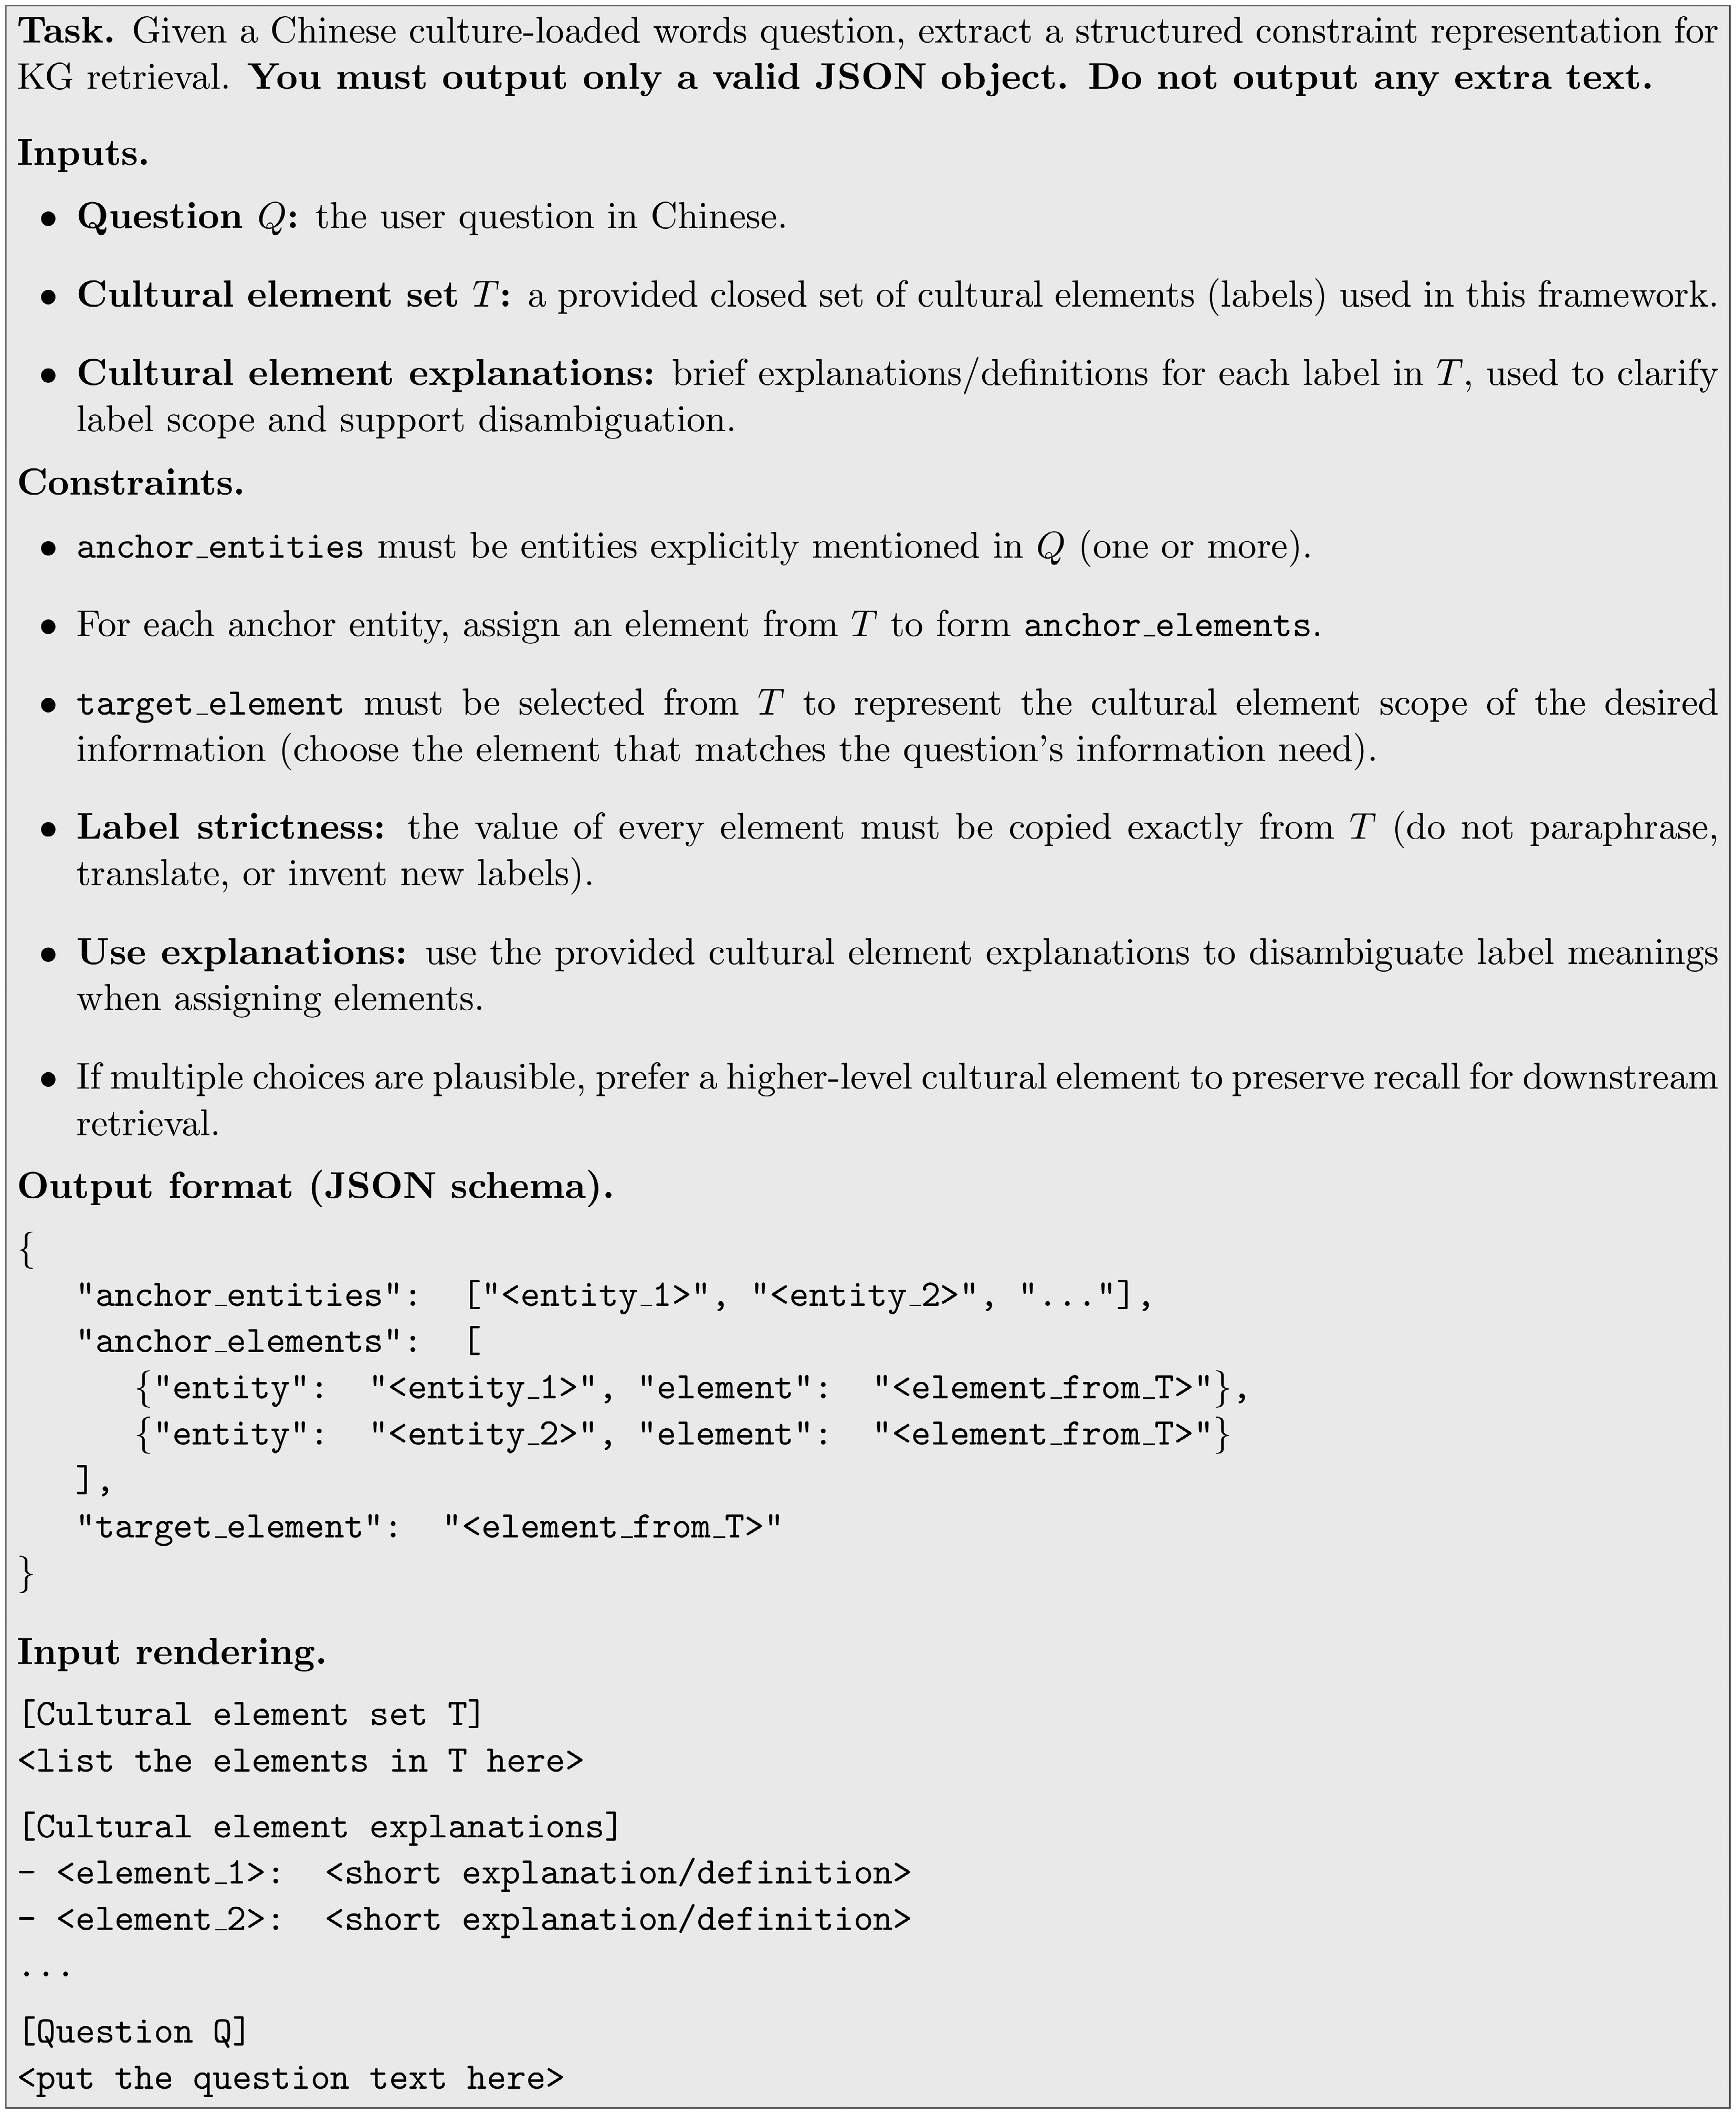
Figure 3.
A cultural-element–guided prompt template for entity linking.
-
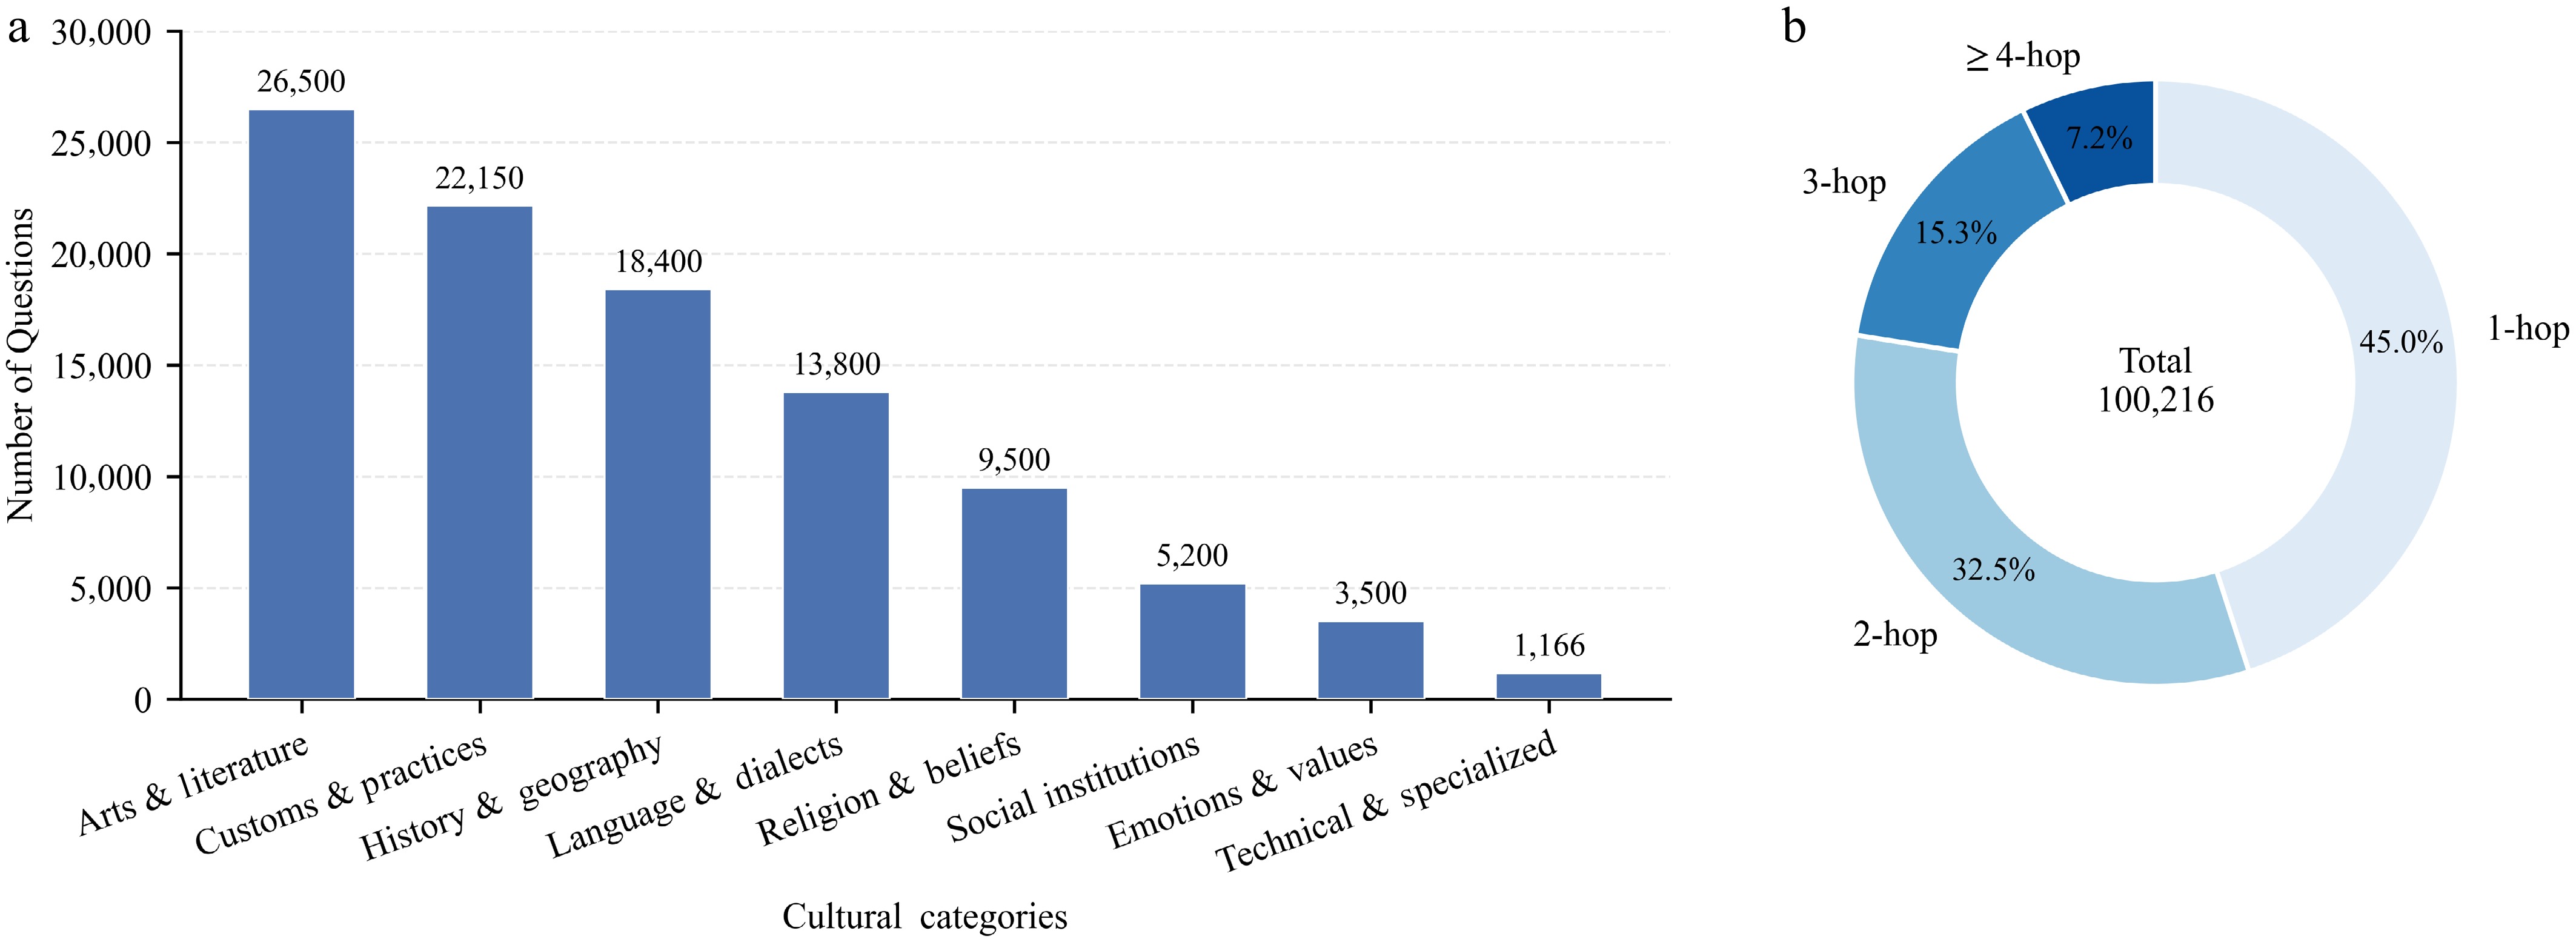
Figure 4.
Distribution statistics of the QA dataset. (a) Distribution of questions across cultural content categories; the horizontal axis represents the eight cultural categories, and the vertical axis represents the number of questions per category. (b) Distribution of questions by reasoning hops; the inner circle indicates the total number of questions, while the outer ring displays the percentages of 1-hop, 2-hop, 3-hop, and ≥ 4-hop questions.
-
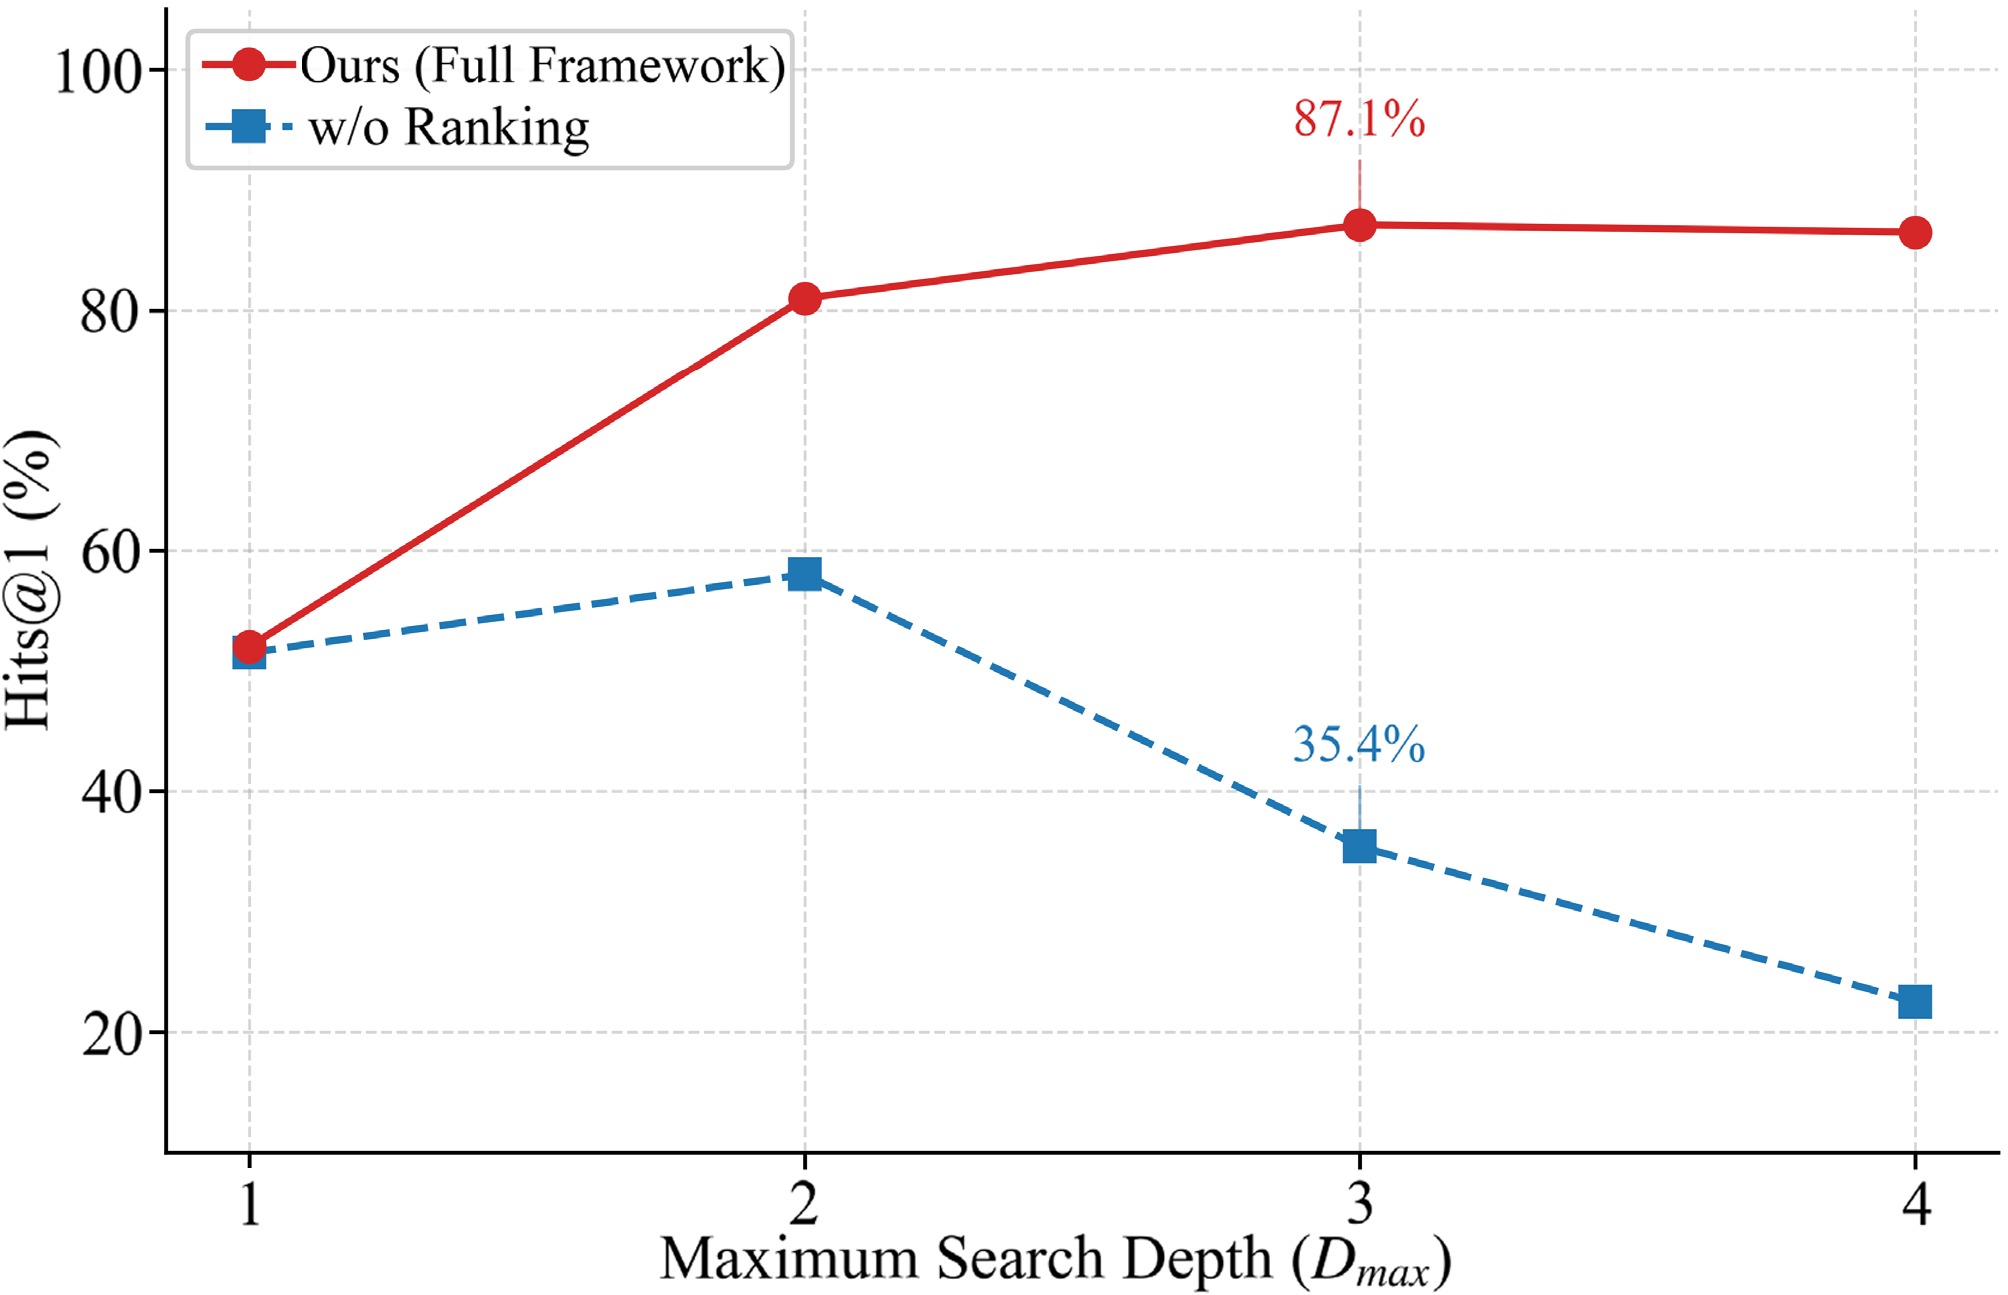
Figure 5.
Impact of maximum search depth (Dmax) on Hits@1 performance. The figure illustrates the performance comparison between our full framework and the variant without ranking as the search depth increases. All results are obtained on DeepSeek-V3 with K = 3.
-
Category Hyperparameter Value Model
architectureBackbone model hfl/chinese-roberta-wwm-ext Node-type embedding dimension 64 Fully connected layers (768+64) → 256 → 64 → 1 Dropout rate 0.3 Optimizer Optimizer type AdamW Learning rate 2e-5 Weight decay 0.01 Gradient clipping (max norm) 1.0 Training
controlBatch size 16 Max epochs 20 Early-stopping patience 3 Table 1.
Hyperparameter settings for the node scoring model.
-
Method type Method GLM-4-Flash DeepSeek-V3 Qwen-Plus Hits@1 Precision Recall F1 Hits@1 Precision Recall F1 Hits@1 Precision Recall F1 LLM-only Zero-Shot 46.7 37.2 32.2 34.5 52.4 38.9 33.9 36.2 49.5 36.8 31.8 34.1 CoT 52.1 44.1 39.2 41.5 54.8 41.8 36.8 39.1 53.9 44.1 39.1 41.4 KG–LLM MindMap 67.9 48.9 53.9 51.3 76.2 60.0 65.0 62.4 74.4 56.1 61.1 58.5 ToG 64.3 50.1 55.1 52.5 70.5 54.5 59.5 56.9 67.1 51.4 56.4 53.8 BYOKG-RAG 69.5 53.2 52.8 53.0 80.2 61.5 66.2 63.8 76.5 59.8 64.5 62.1 GraphRAG 70.1 57.8 54.1 55.9 84.6 63.1 68.2 65.6 79.4 62.2 67.1 64.5 PoG 73.6 59.1 64.1 61.5 85.7 63.7 68.7 66.1 80.3 62.8 67.8 65.2 CEAF-CLWQA (ours) 76.3 60.2 55.2 57.6 87.1 65.9 70.9 68.3 82.5 63.4 68.4 65.8 Note: Hits@1 denotes the proportion of questions for which at least one gold answer is ranked first; Precision denotes the proportion of predicted answers that are correct; Recall denotes the proportion of gold answers successfully retrieved; and F1 is the harmonic mean of Precision and Recall. All values are reported as percentages (%). Bold values indicate the best result for each metric among all compared methods under the same LLM backbone. Table 2.
Performance comparison of different methods on three LLM backbones.
-
Backbone Hop group PoG Hits@1 PoG F1 CEAF Hits@1 CEAF F1 GLM-4-Flash 1-hop 79.9 65.1 83.5 65.1 2-hop 73.9 62.3 76.7 56.8 3-hop 64.4 56.2 65.4 47.2 ≥ 4-hop 52.3 46.9 53.1 36.7 DeepSeek-V3 1-hop 89.4 69.4 90.0 70.0 2-hop 86.7 67.3 88.2 69.7 3-hop 79.9 60.5 82.0 64.8 ≥ 4-hop 71.3 52.1 73.2 58.7 Qwen-Plus 1-hop 84.5 68.3 85.6 68.5 2-hop 80.6 66.0 83.2 66.6 3-hop 74.4 60.3 78.1 61.5 ≥ 4-hop 64.7 52.7 69.1 54.8 Note: Hits@1 denotes the proportion of questions for which at least one gold answer is ranked first; F1 denotes the harmonic mean of Precision and Recall. All values are reported as percentages (%). The hop groups are defined according to the length of the standard reasoning path: 1-hop, 2-hop, 3-hop, and ≥ 4-hop. Table 3.
Hop-wise comparison between PoG and CEAF-CLWQA on the three LLM backbones.
-
Model Top-1 Top-2 Top-3 Top-4 Top-5 GLM-4-Flash 54.1 55.4 57.6 57.2 54.5 DeepSeek-V3 62.3 66.1 68.3 67.1 64.8 Qwen-Plus 61.8 62.4 65.8 63.3 60.4 Note: Top-K denotes the number of retained cultural evidence paths. All values are F1 scores reported as percentages (%). Bold values indicate the highest F1 score among the evaluated Top-K settings for each LLM backbone. Table 4.
F1 score (%) under different Top-K settings.
-
Category Method Hits@1 F1 Full method Our method 87.1% 68.3% Module ablation w/o cultural-element-based entity linking 72.1% 58.5% w/o cultural-evidence-based path ranking 35.4% 21.2% Scoring-model
ablationw/o cultural-element embeddings 60.2% 43.7% Generic semantic-similarity ranking 55.8% 39.9% Note: All values are reported as percentages (%). Bold values indicate the best performance among the full method and all ablation variants. Table 5.
Ablation results (based on DeepSeek-V3).
-
Diagnostic metric GLM-4-Flash DeepSeek-V3 Anchor-entity set F1 88.4% 94.3% Element-label match 84.1% 91.0% Answer-supporting path coverage after retrieval 87.6% 94.8% Top-3 retention given Stage-2 coverage 91.6% 95.3% Complete-answer coverage on multi-answer questions 44.8% 58.6% Final Hits@1 76.3% 87.1% Final F1 57.6% 68.3% Table 6.
Stage-wise diagnosis across backbone strengths.
-
Setting Hits@1 Precision Recall F1 CEAF-CLWQA (original) 76.3% 60.2% 55.2% 57.6% + Gold anchor entities 79.4% 60.9% 60.1% 60.5% + Gold cultural elements 78.6% 60.6% 59.1% 59.8% + Gold full Stage-1 constraints 81.1% 61.8% 63.0% 62.4% + constraint relaxation 75.9% 59.8% 58.6% 59.2% Table 7.
Controlled analyses of Stage-1 constraints and a lightweight constraint relaxation strategy on GLM-4-Flash.
-
Method Avg. LLM calls/query Avg. latency (s/query) Zero-Shot 1 5.50 ToG 7.8 32.92 CEAF-CLWQA (ours) 2 29.14 Table 8.
Computational efficiency comparison of CEAF-CLWQA and baselines.
-
Stage LLM involved? Avg. latency (s/query) Share Cultural-element-based entity linking Yes 7.62 26.1% Path retrieval and pruning No 3.24 11.2% Node scoring and path ranking No 9.76 33.5% Answer generation Yes 8.52 29.2% Total − 29.14 100.0% Table 9.
Component-wise inference latency breakdown of CEAF-CLWQA.
Figures
(5)
Tables
(9)