-
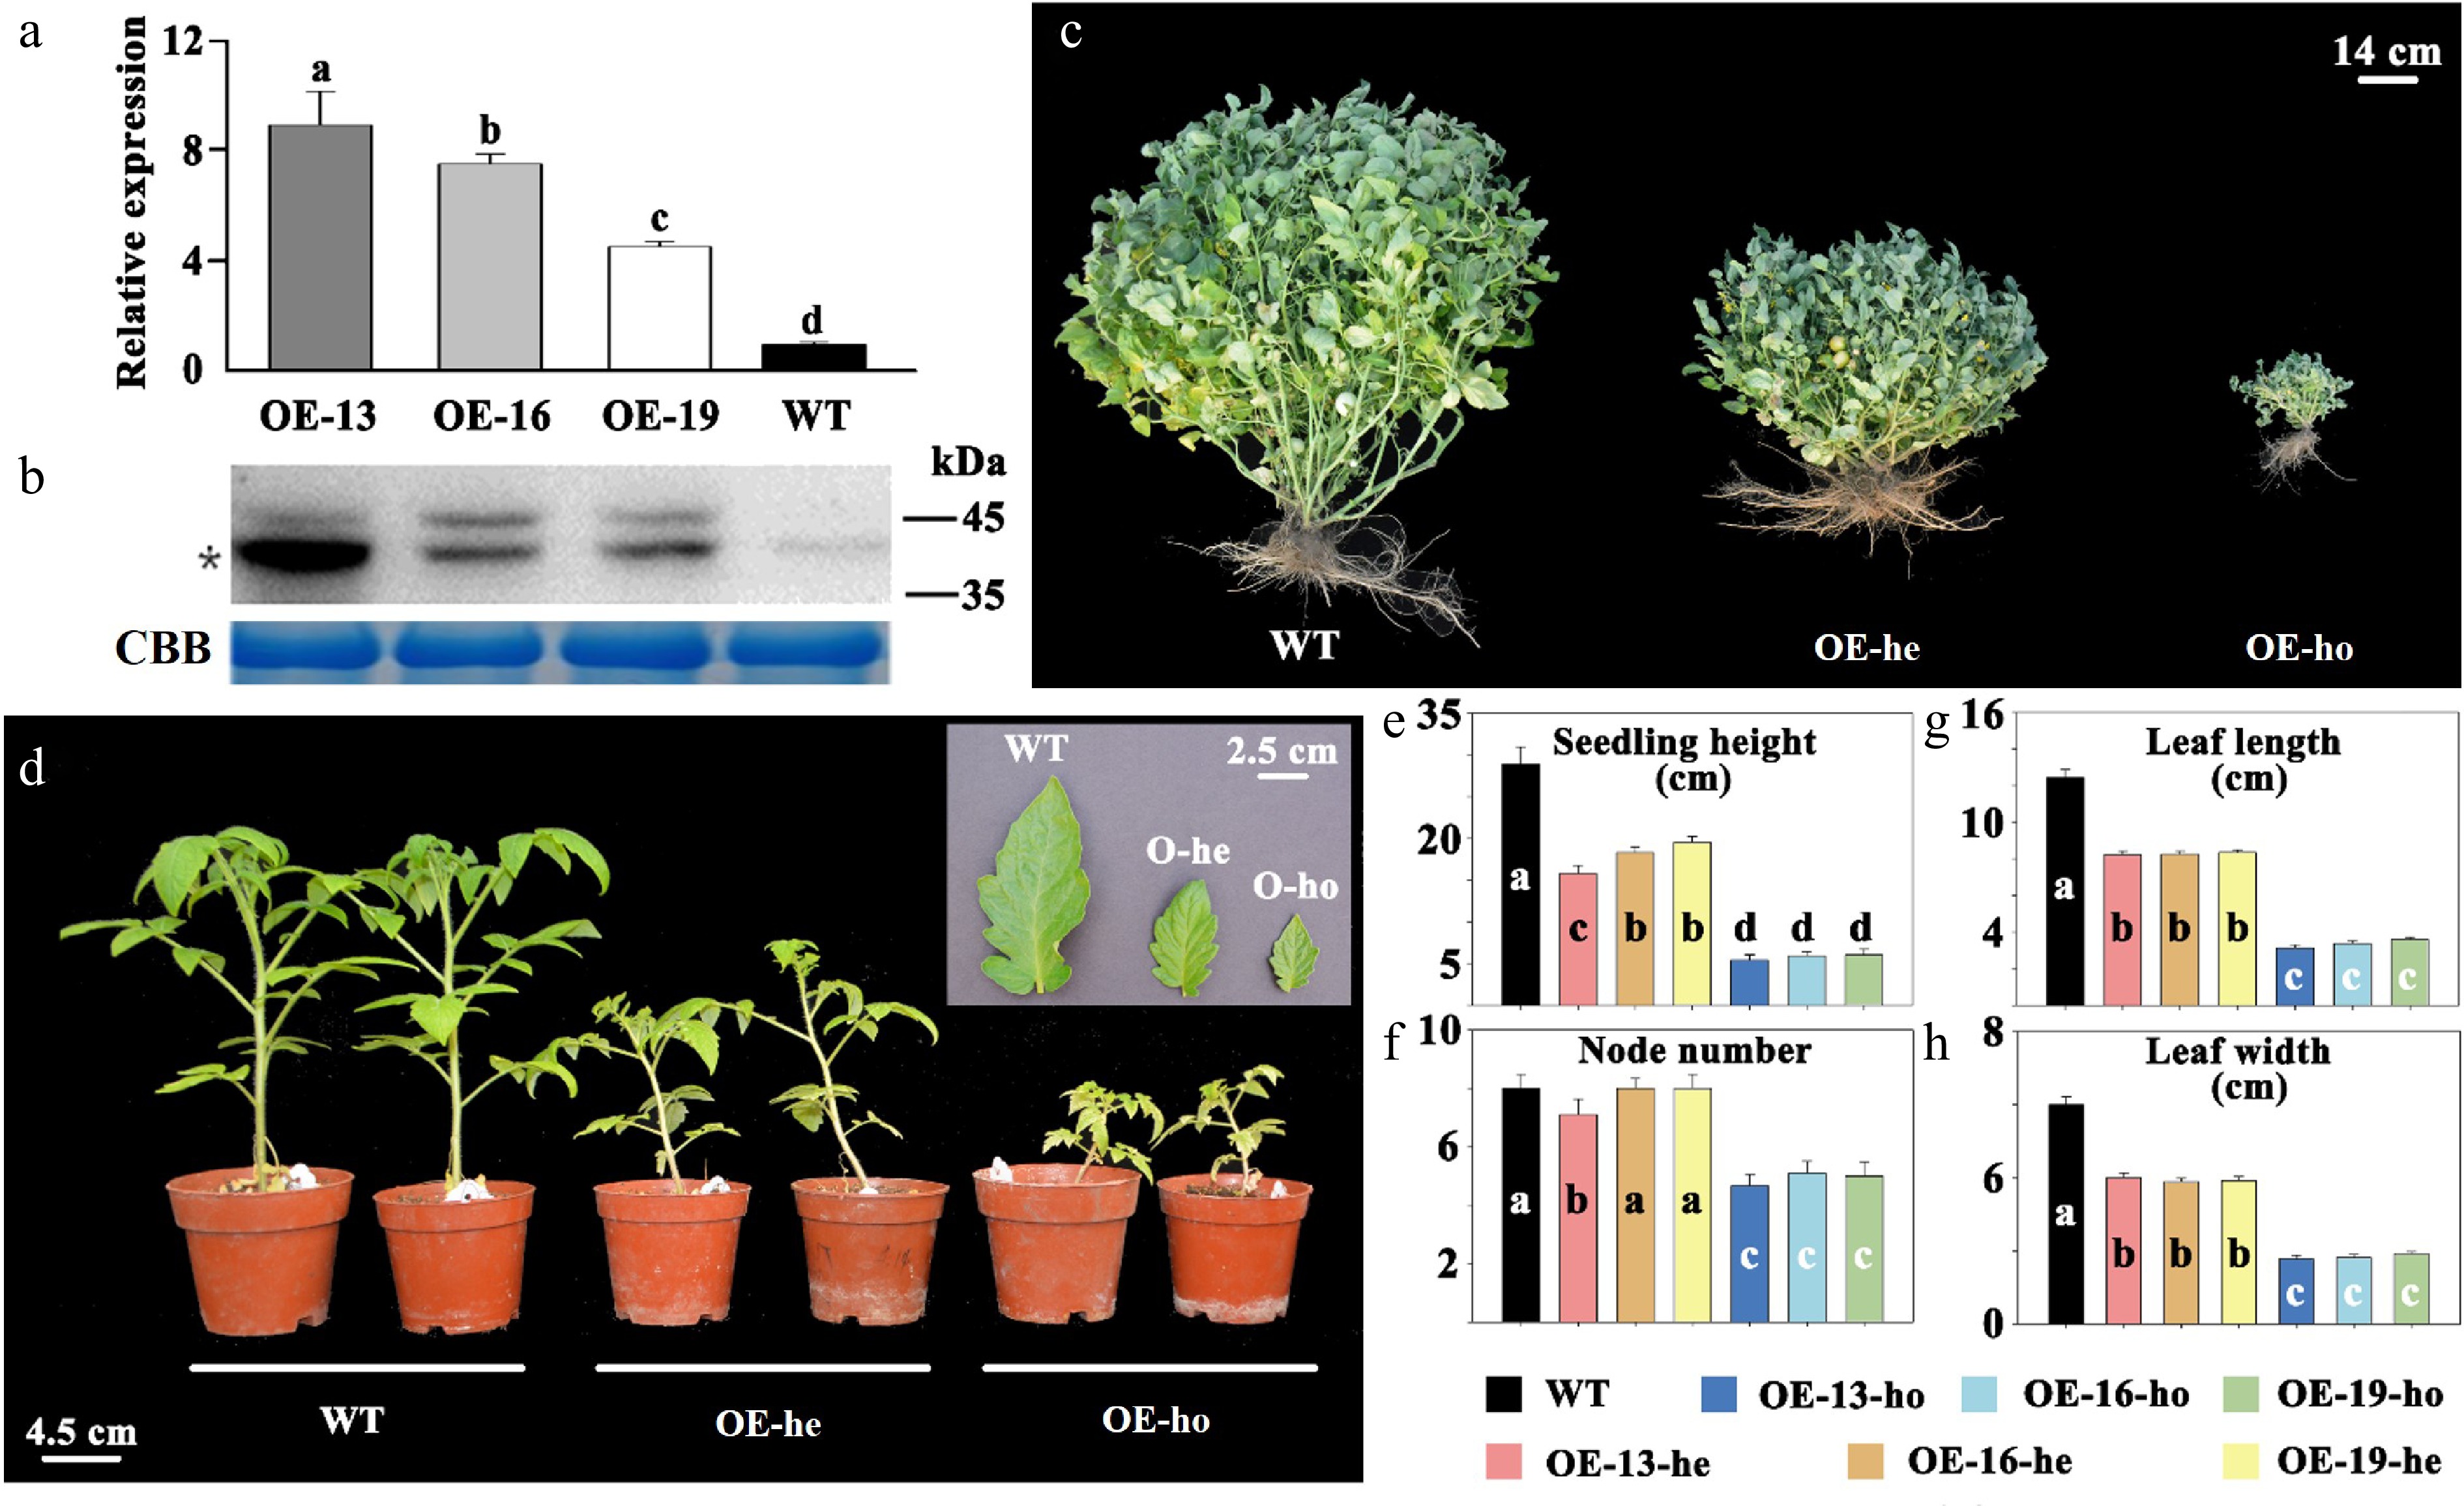
Figure 1.
Changes in plant traits in lines with overexpression (OE) of the SlPsy1 gene in the tomato inbred line Ohio 88,119 (wild type, WT). (a) Quantitative RT-PCR analysis of SlPsy1 expression in immature (IM) fruit (10 d post-anthesis) of T0 plants. The data are shown as mean ± SD (n = 3). (b) Western blot analysis using antibodies to verify the expression of SlPsy1 in IM fruit of T0 plants. The concentration of total protein is monitored by Coomassie brilliant blue (CBB) staining. The asterisk indicates the position of mature phytoene synthase. (c) Representative plants at the fruit set stage of WT and OE T2 lines. (d) Representative 12-week-old seedlings from the WT and OE T2 lines grown in the greenhouse. (e), (f) Height and node numbers of 12-week-old seedlings of WT and OE T2 lines. The data are shown as mean ± SD (n = 10). (g), (h) Leaf length and width of WT and OE T2 lines. The data are shown as mean ± SD (n = 30). he: heterozygote. ho: homozygote. Means with the same letter indicate no significant difference at 0.05 (Duncan's test).
-
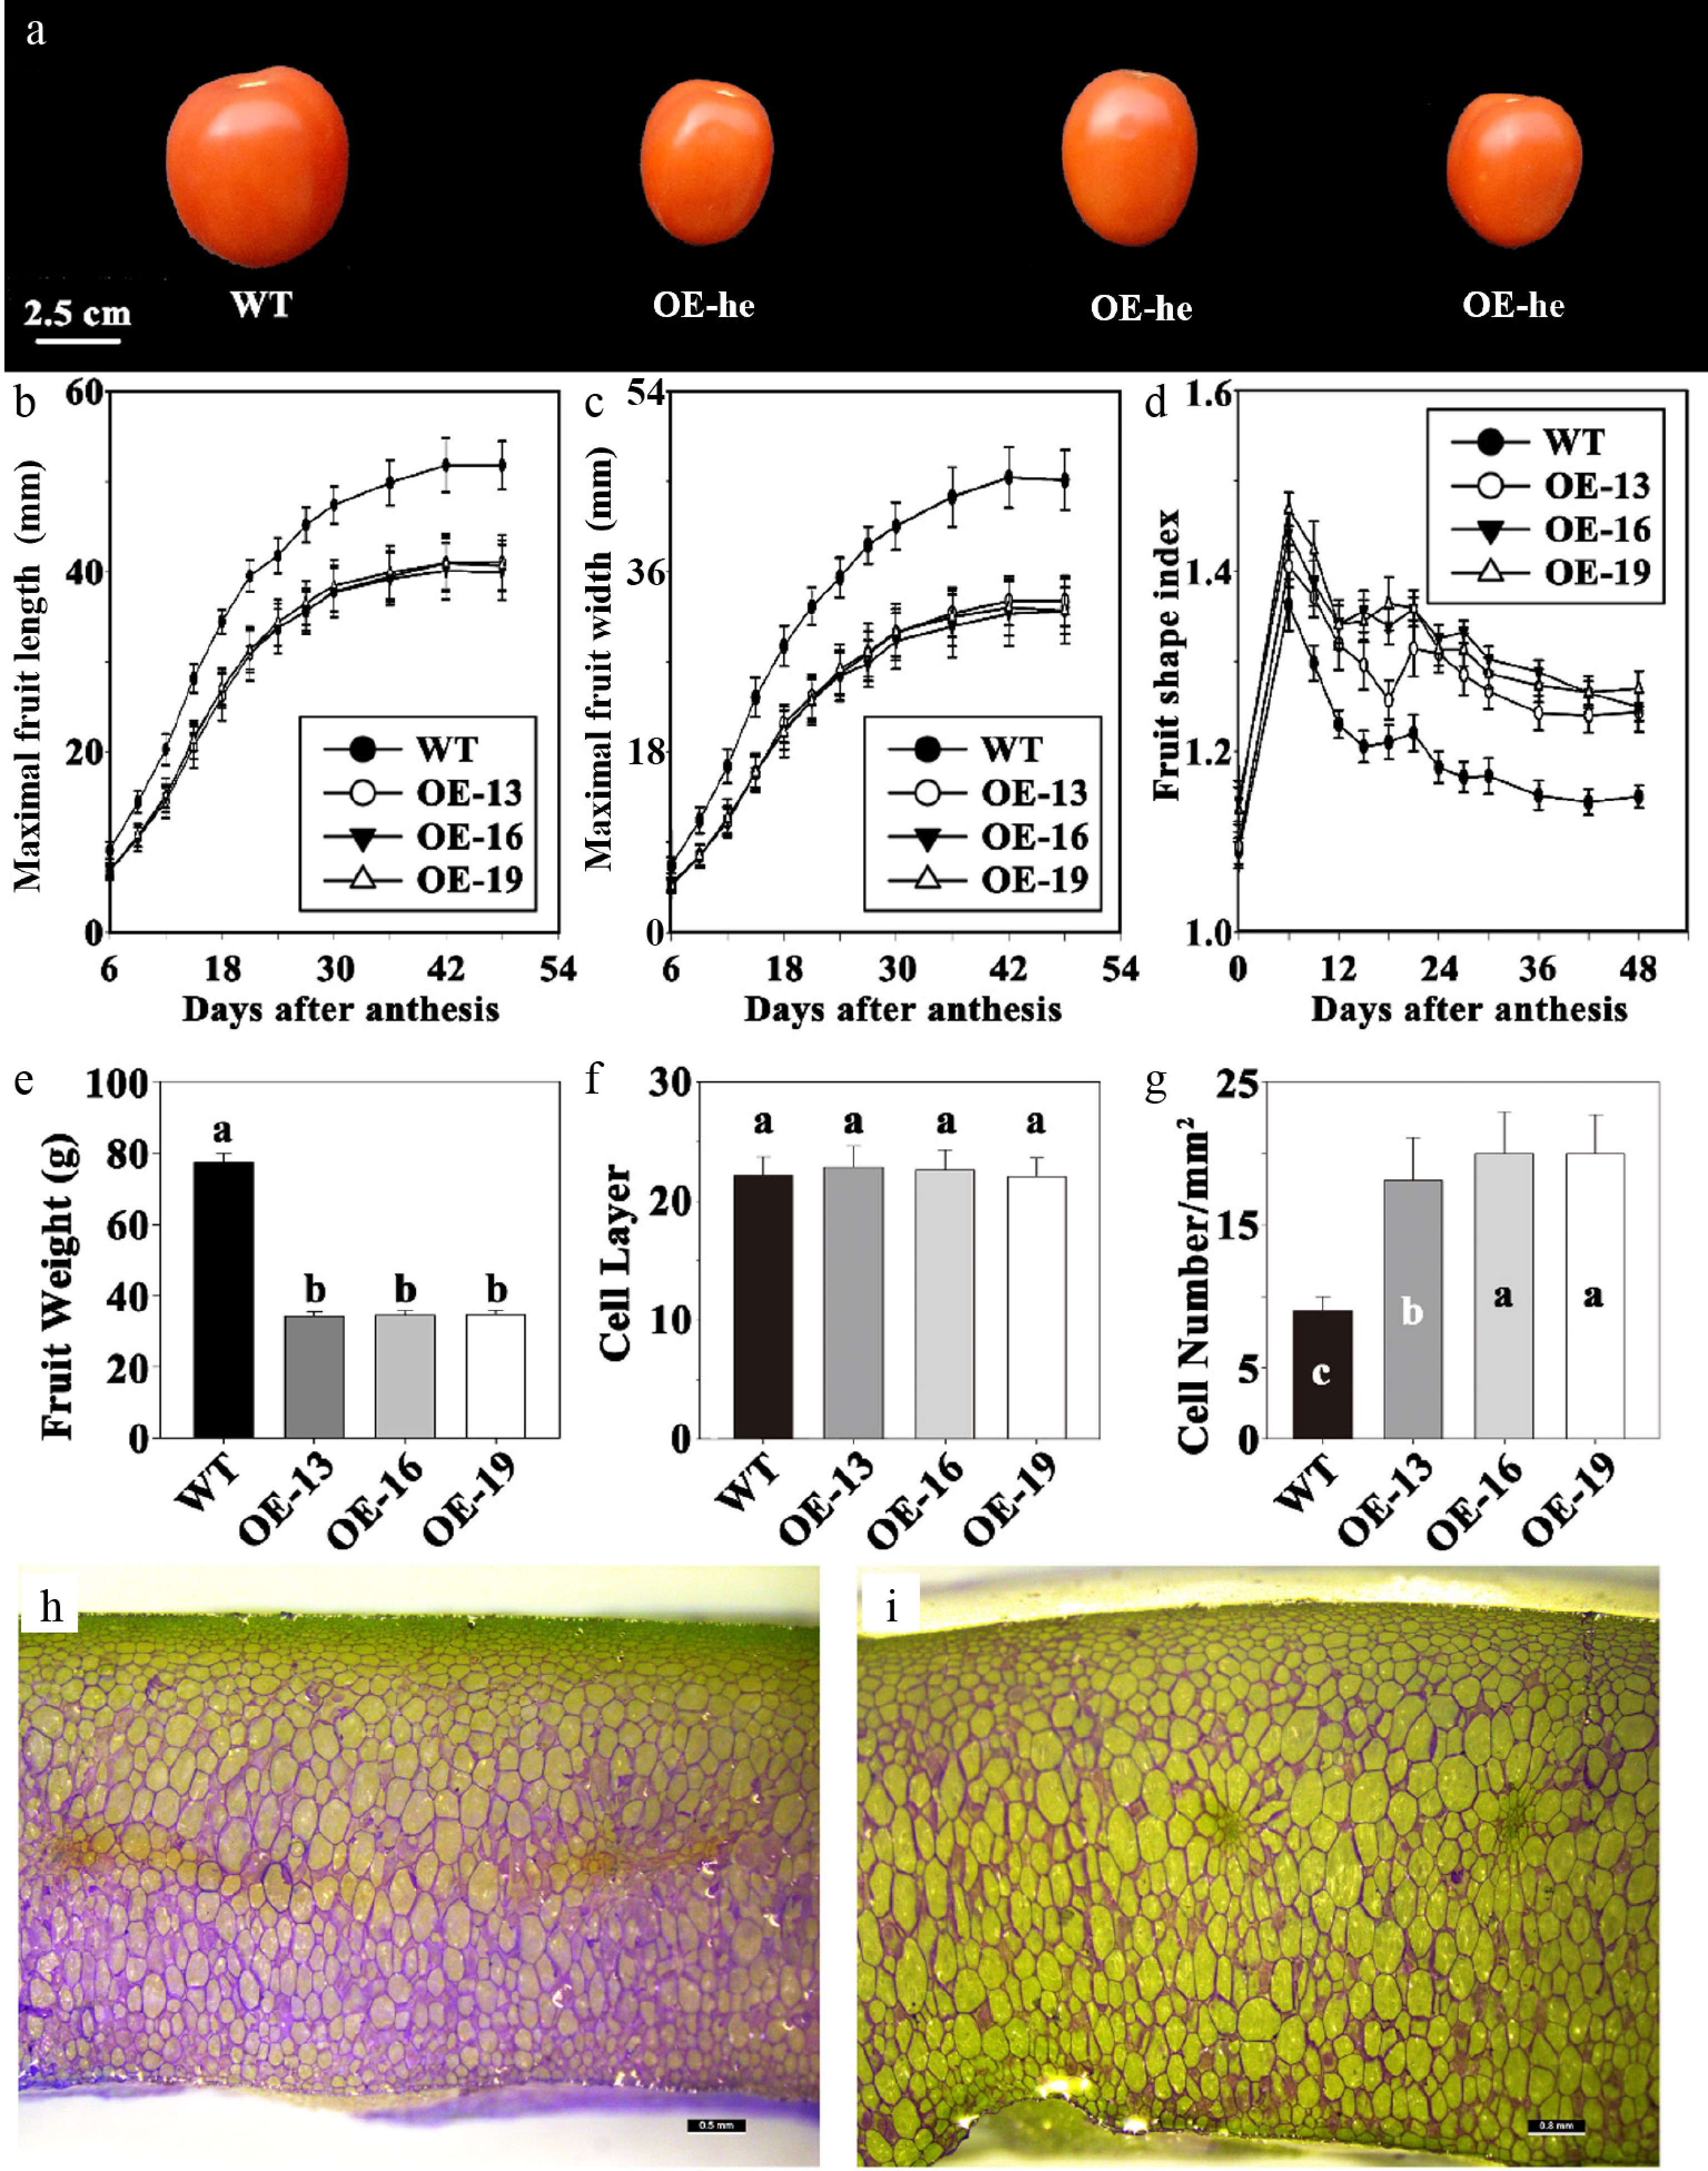
Figure 2.
Changes in fruit traits in heterozygous (he) plants of T2 lines with overexpression (OE) of the SlPsy1 gene in the tomato inbred line Ohio 88,119 (wild type, WT). (a) Representative fruit at the red-ripe stage. (b), (c) Dynamic changes in fruit maximal length and maximal width at various fruit developmental periods. (d) Dynamic changes in fruit shape index at various fruit developmental periods. (e) Fruit weight at the red-ripe stage. (f) Number of cell layers in fruit mesocarp at the mature green (MG) stage. (g) Cell numbers per mm2 at the MG stage. (h) Representative freehand sections of WT fruit at the MG stage (scale bar: 0.5 mm). (i) Representative freehand sections of OE fruit at the MG stage (scale bar: 0.8 mm). Means with the same letter indicate no significant difference at 0.05 (Duncan's test).
-
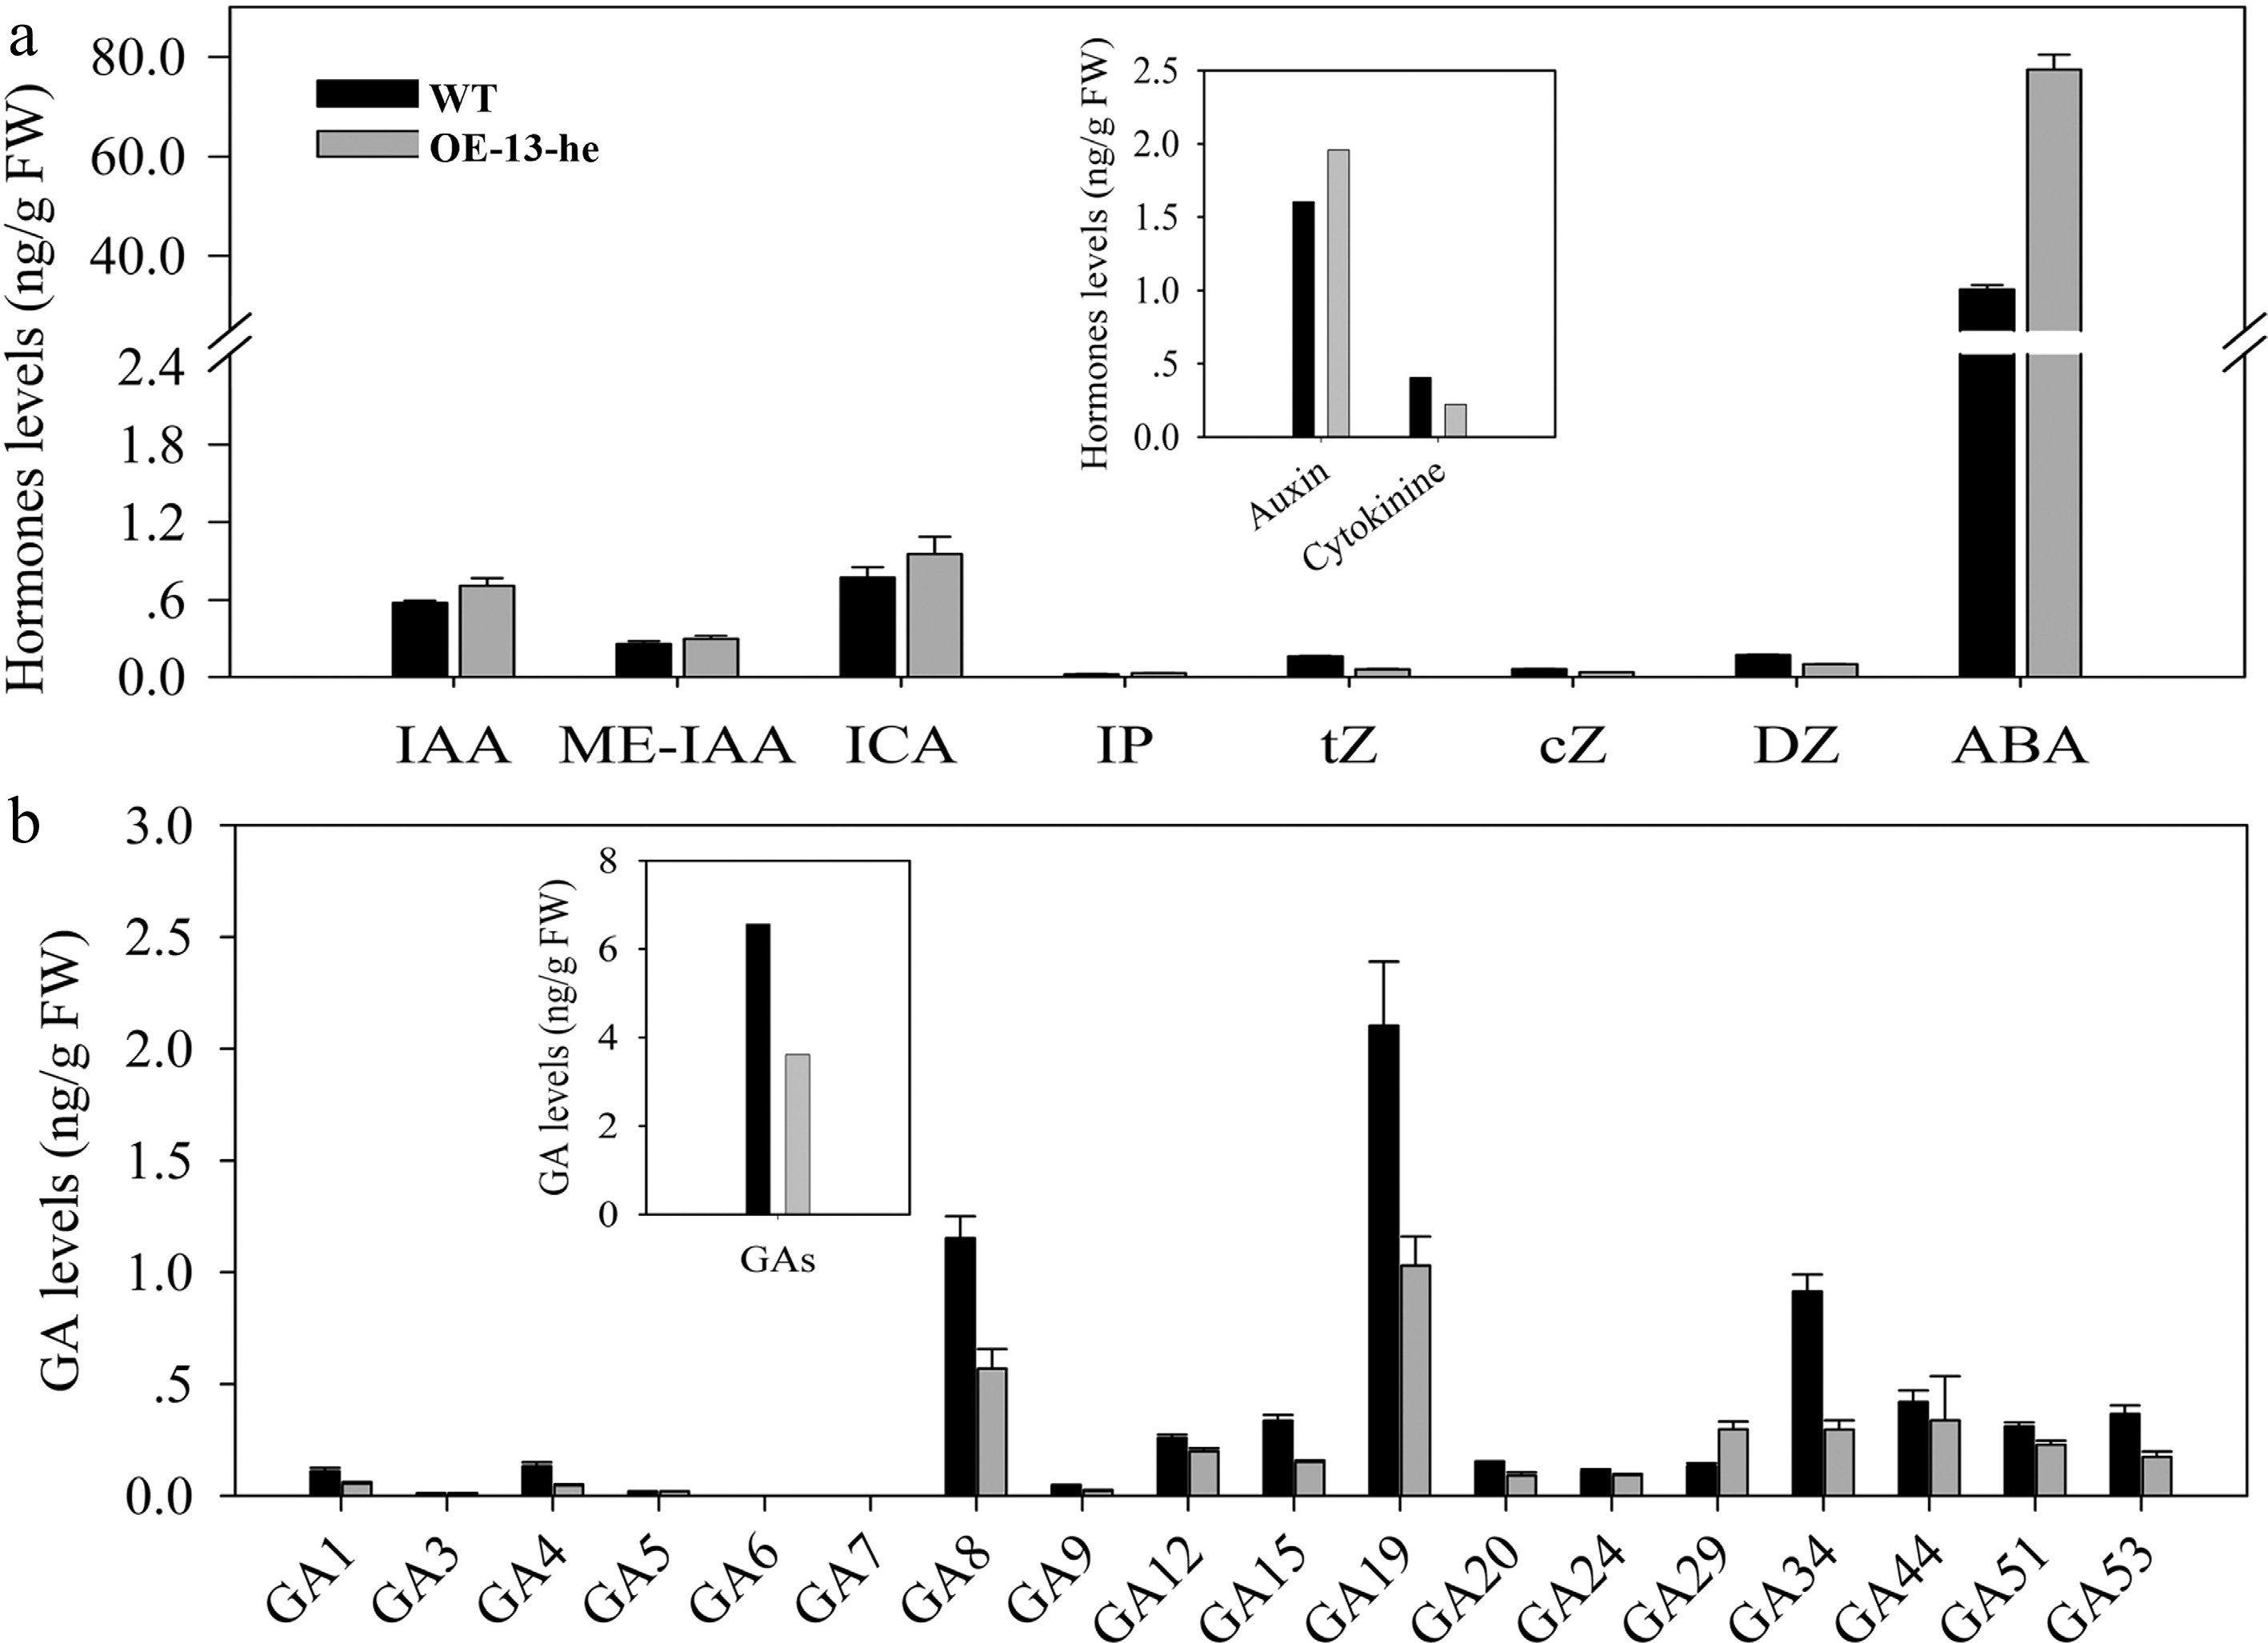
Figure 3.
Hormone content in heterozygous (he) plants of OE-13-he T2 lines with overexpression (OE) of the SlPsy1 gene in the tomato inbred line Ohio 88,119 (wild type, WT). (a) Content of GAs in 20-day-old seedlings. (b) Auxin, cytokinin, and abscisic acid content in young leaves. IAA, indole-3-acetic acid. ME-IAA, methyl indole-3-acetate. ICA, indole-3-carboxaldehyde. IP, N6-isopentenyladenine. tZ, trans-zeatin. cZ, cis-zeatin. DZ, dihydrozeatin. ABA, abscisic acid. The data are shown as mean ± SD (n = 3).
-
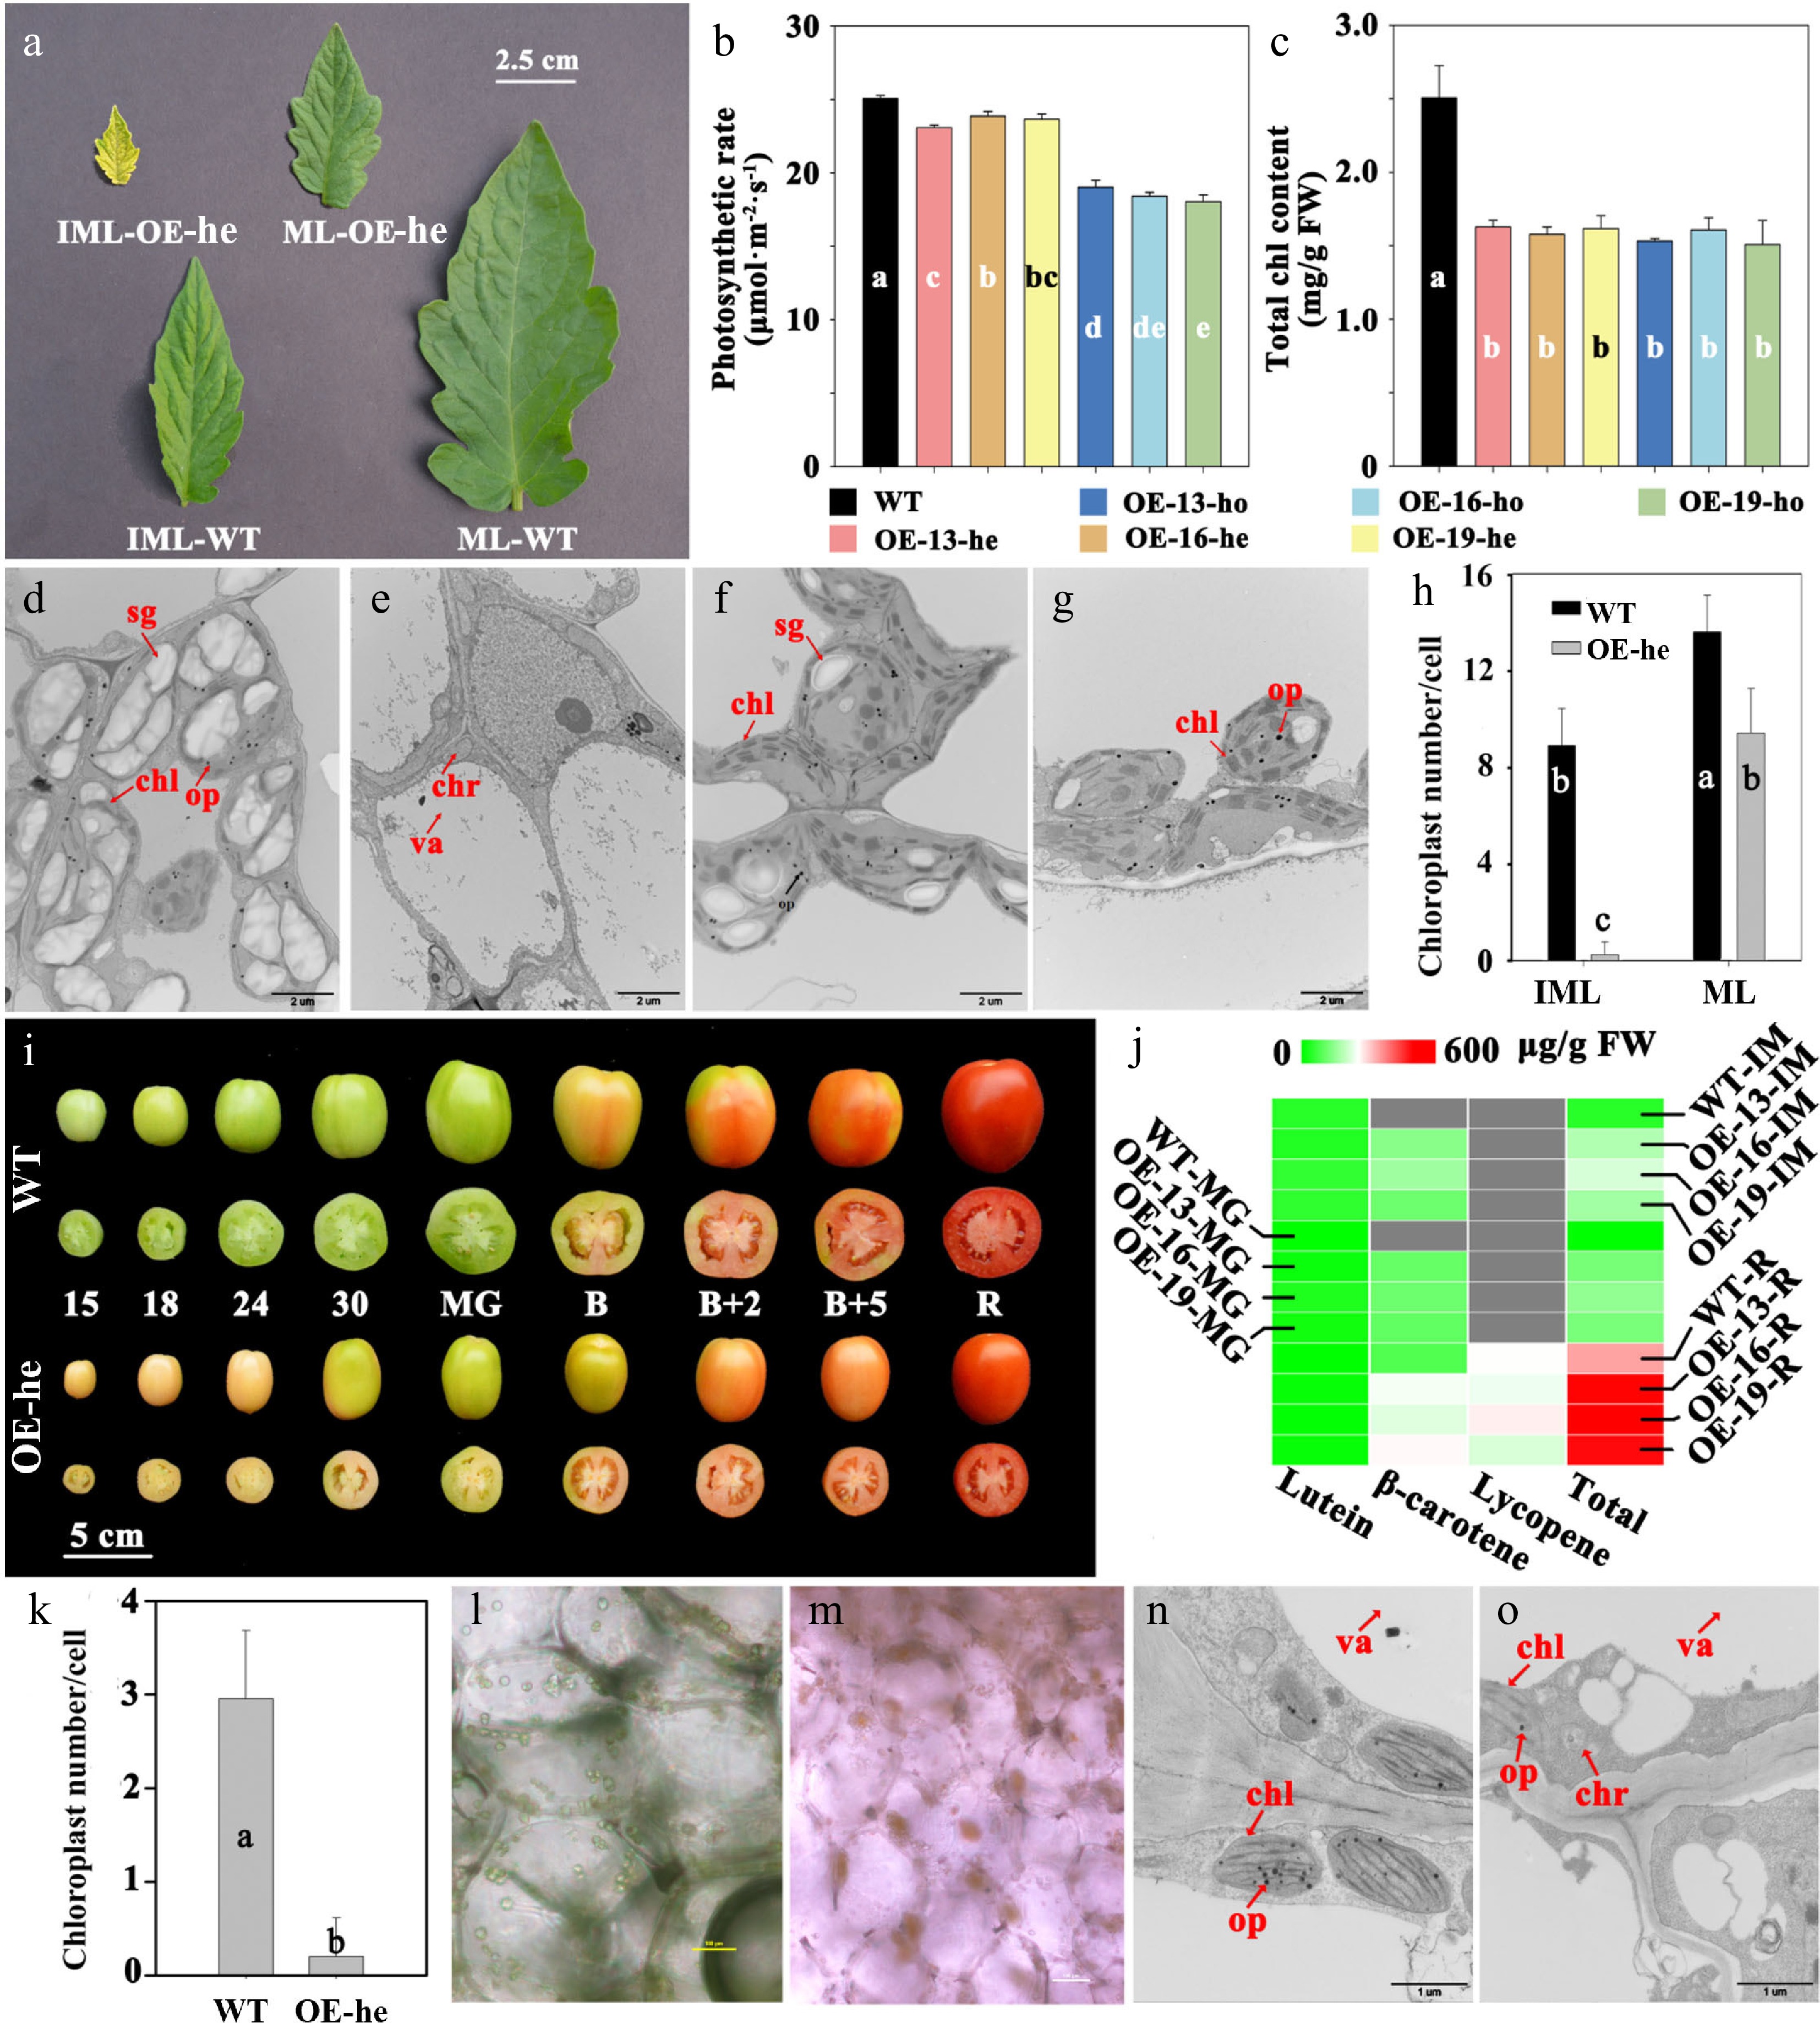
Figure 4.
Pigment-related analysis and observation in fruit and leaves of heterozygous (he) plants of T2 lines with overexpression (OE) of the SlPsy1 gene in the tomato inbred line Ohio 88,119 (wild type, WT). (a) Color of immature leaves (IML) and mature leaves (ML). (b) Photosynthetic rate in mature leaves (n = 4). (c) Total chlorophyll content in mature leaves (n = 3). (d), (e) Plastids in young leaves (scale bar: 2 μm). (f), (g) Plastids in mature leaves (scale bar: 2 μm). (h) Chloroplast number per cell in IML and ML. (i) Dynamic development of fruit in various periods. (j) Carotenoid content in immature (IM) fruit (15 DPA), mature green (MG, 39 DPA), and red stage (R, 52 DPA). (k) Chloroplast number per cell in IM fruit. (l), (m) Bright-field visible light microscopy of mesocarp cells in IM fruit (scale bar: 100 μm). (n), (o) Plastids in IM fruit by TEM (scale bar: 1 μm). Sg, starch grain; Chl, chloroplast; Chr, chromoplast; Op, osmiophilic plastoglobules; Va, vacuole; he, heterozygote; ho, homozygote. Means with the same letter indicate no significant difference at 0.05 (Duncan's test).
-
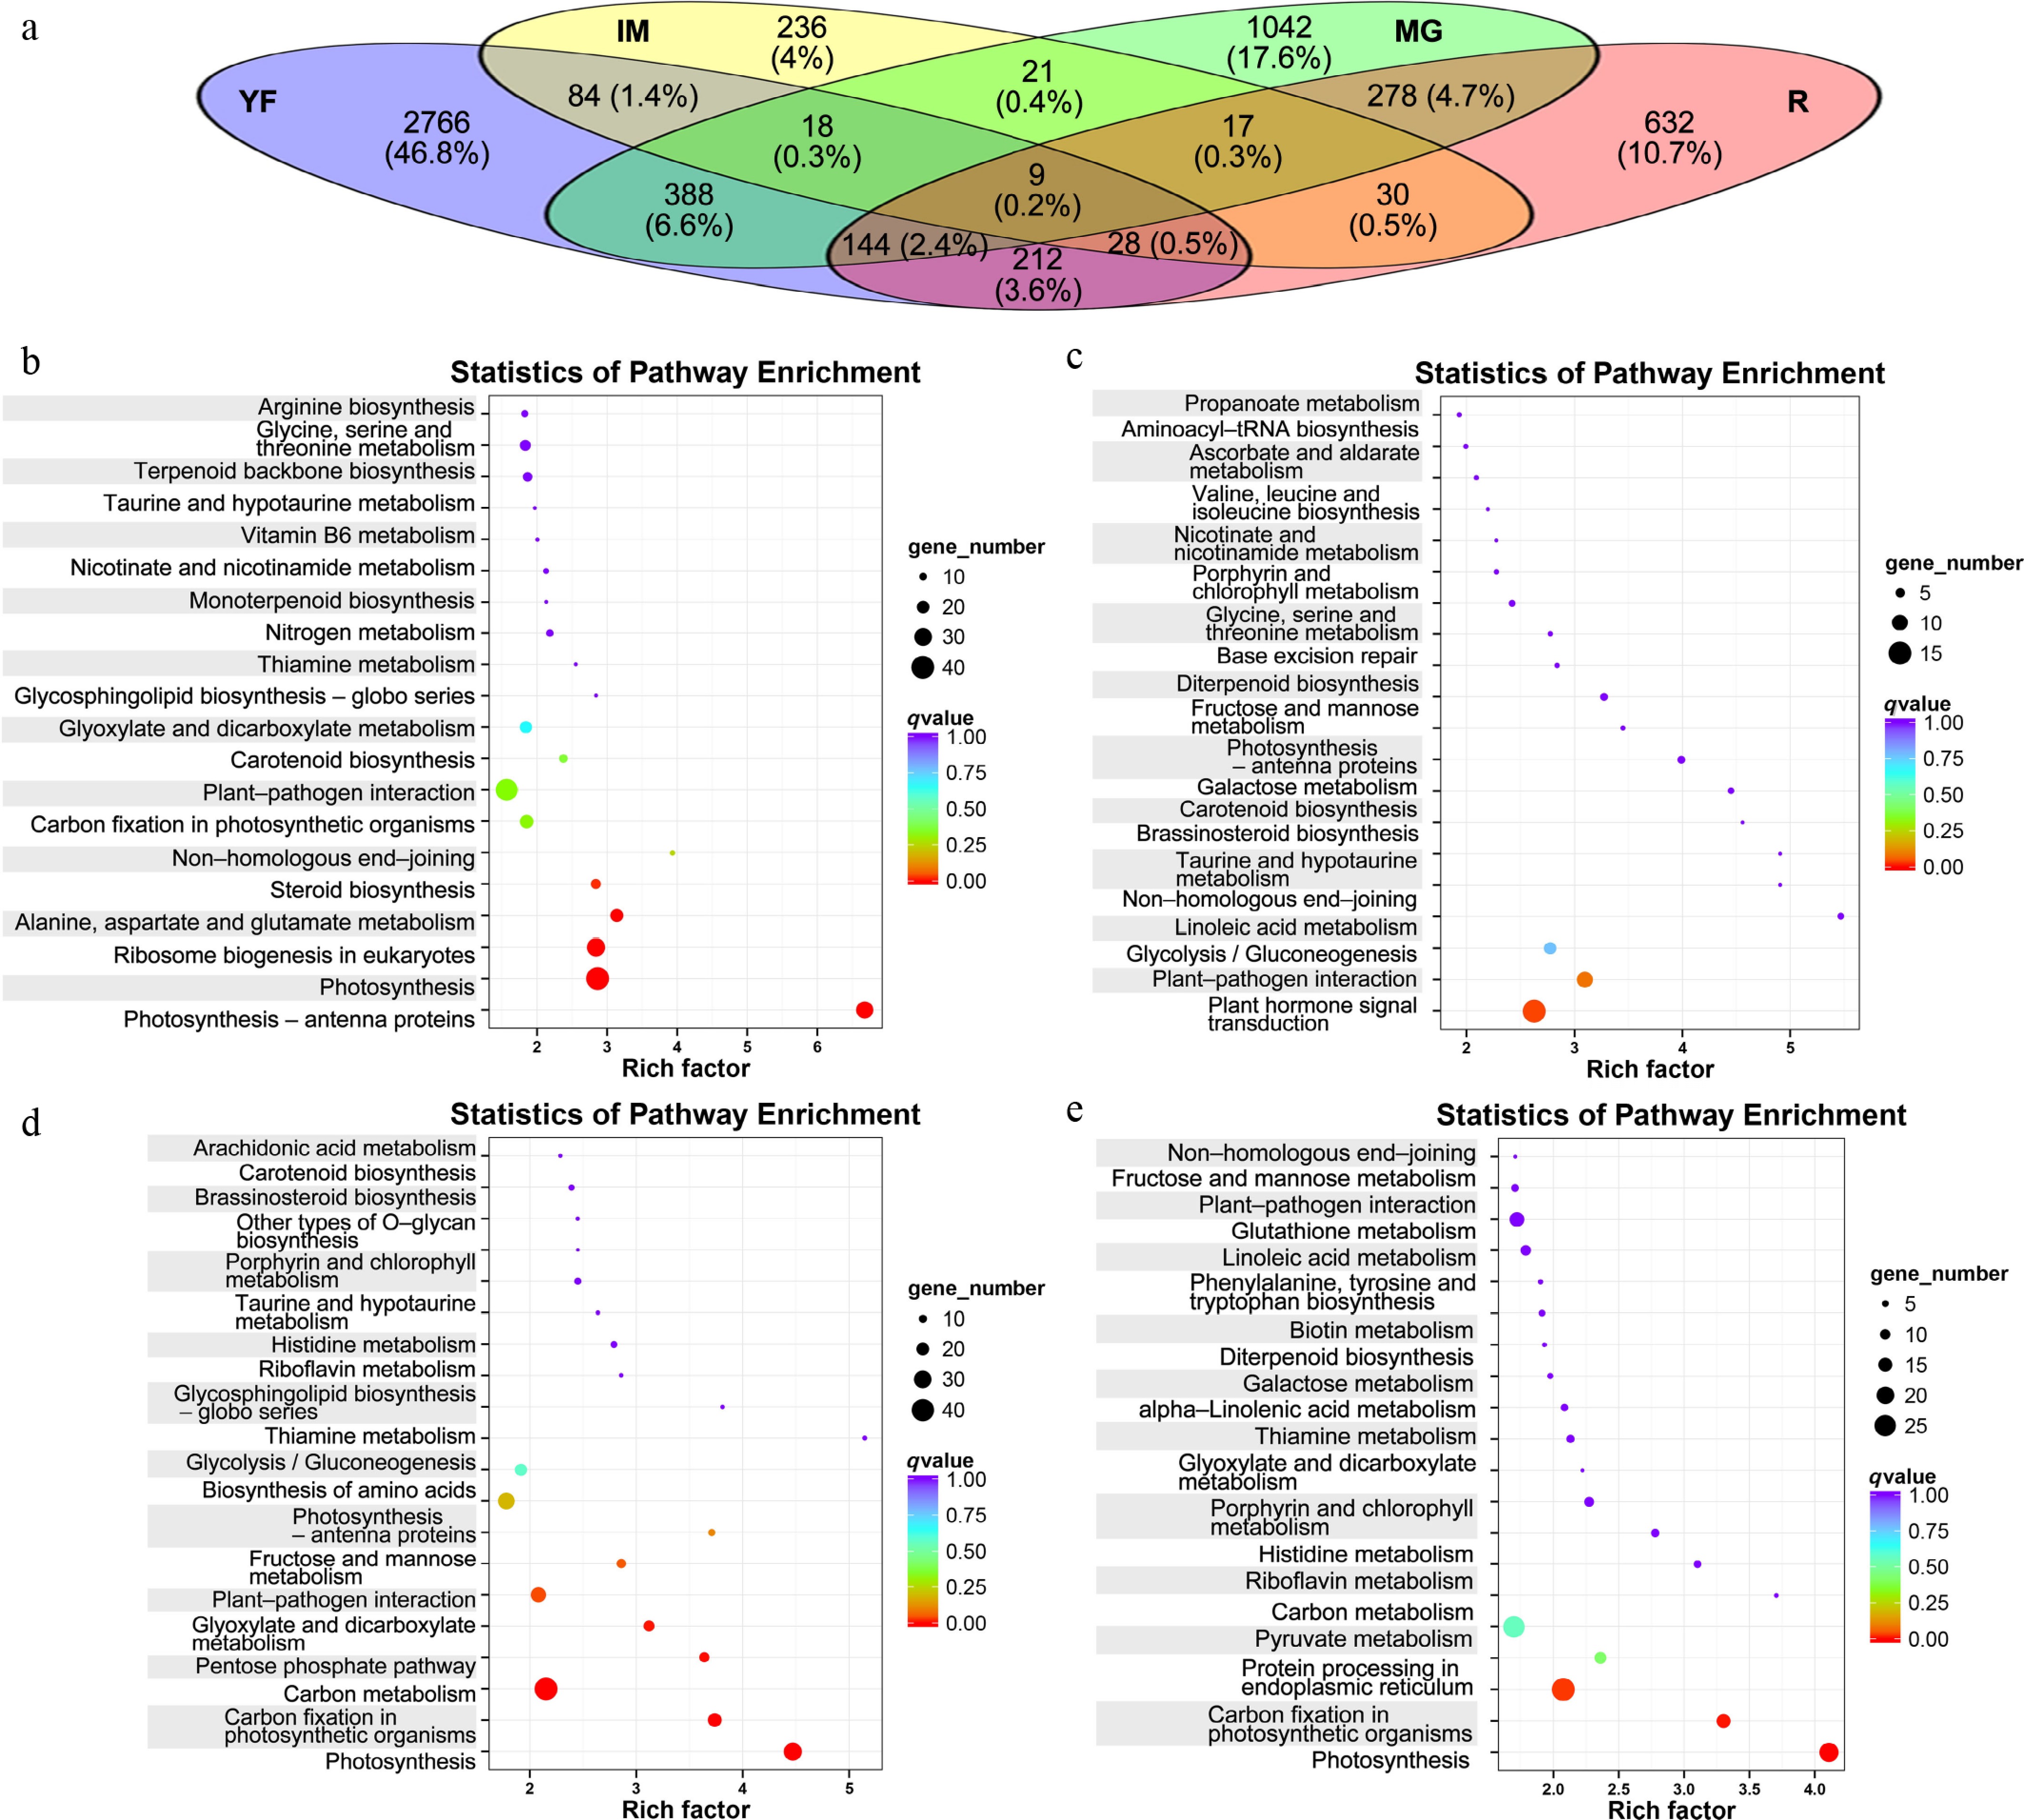
Figure 5.
(a) Venn diagram and (b) enriched KEGG pathways of the relationships between differentially expressed genes in young leaves (YF), as well as (c) immature (IM), (d) mature green (MG), and (e) ripe (R) stage fruit. Bubble plots showing enriched KEGG pathways of DEGs derived from (b) young leaves (YF), (c) immature fruit (IM), (d) mature green fruit (MG), and (e) red ripe fruit (R). The horizontal axis represents the enrichment factor; the size of each bubble corresponds to the number of enriched genes, and bubble color represents the q-value.
-
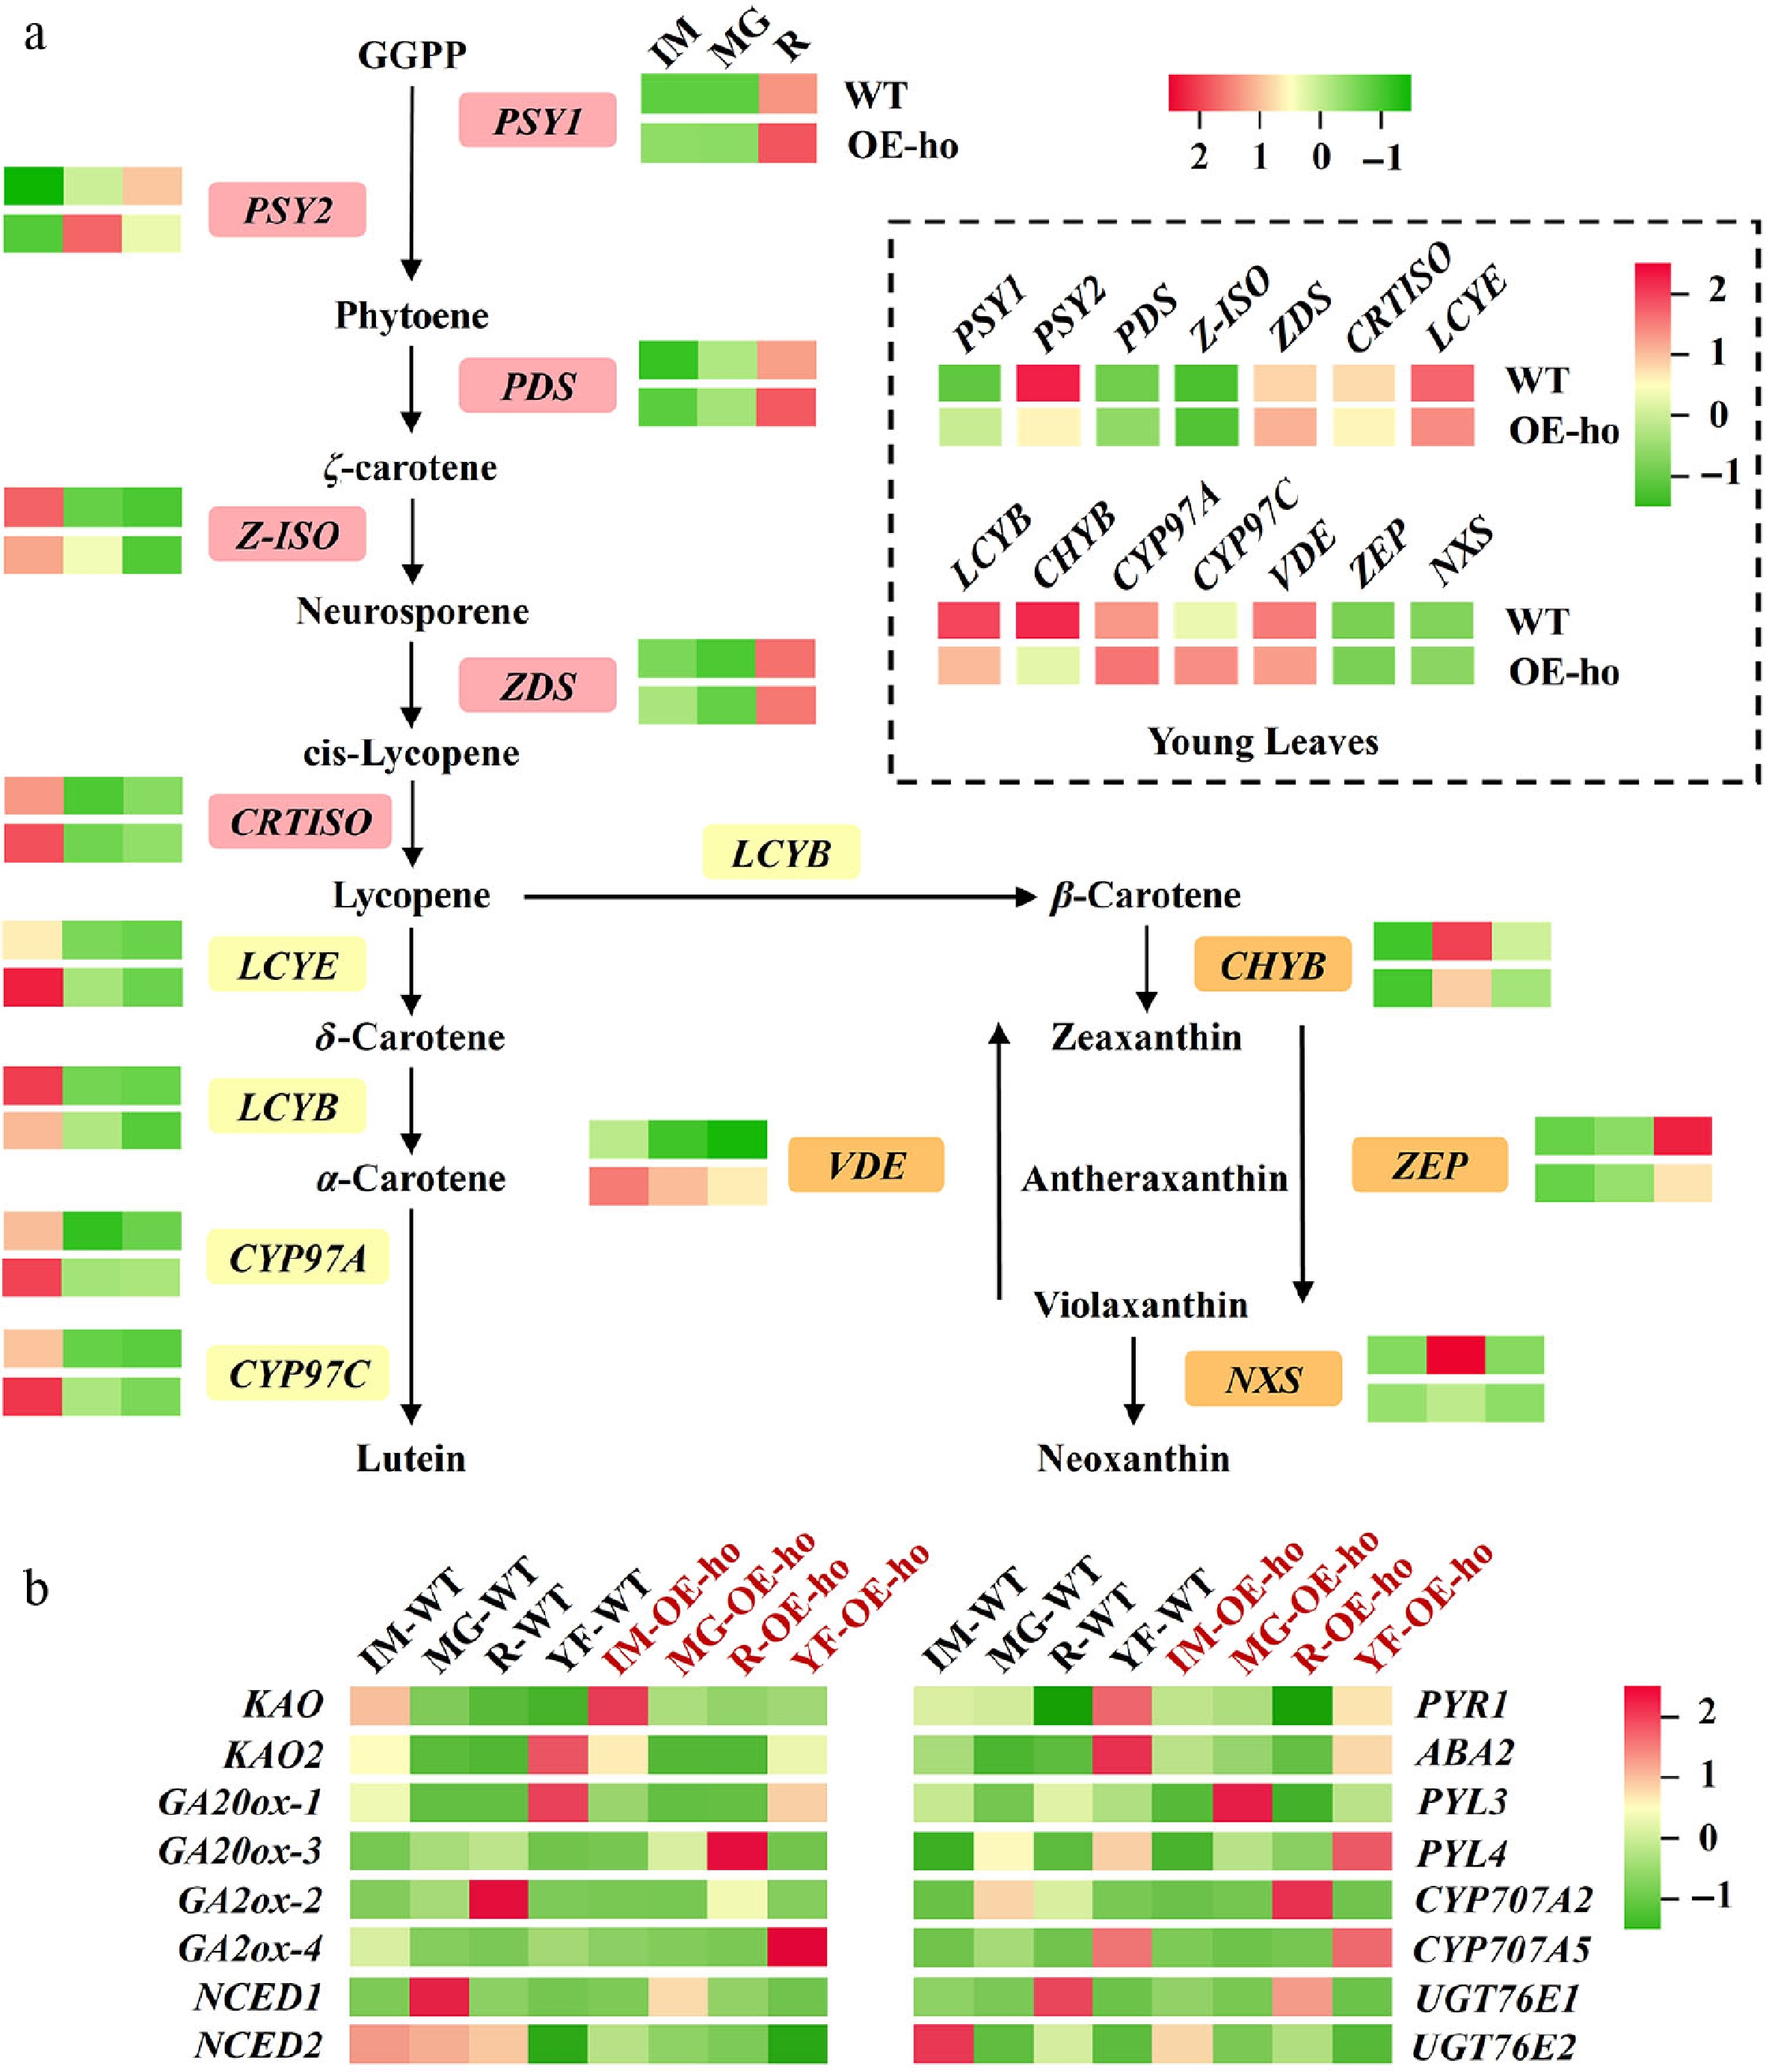
Figure 6.
Heatmap of genes related to (a) the carotenoid pathway and (b) the GA synthesis pathway, created by RNA-seq analysis using fruit at the immature (IM), mature green (MG), and red-ripe (R) stages in OE-ho lines and WT. Solid lines with arrows indicate the direction of metabolic pathways. The dashed box in (a) shows the expression pattern of genes in young leaves. Genes in panel (a): PSY1, phytoene synthase 1, PSY2, phytoene synthase 2; PDS, phytoene desaturase; Z-ISO, ζ-carotene isomerase; ZDS, ζ-carotene desaturase; CRTISO, carotenoid isomerase; LCYE, lycopene ε-cyclase; LCYB, lycopene β-cyclase; CHYB, β-carotene hydroxylase; CYP97A, cytochrome P450 97A; CYP97C, cytochrome P450 97C; VDE, violaxanthin de-epoxidase; ZEP, zeaxanthin epoxidase; NXS, neoxanthin synthase. Genes in panel (b): KAO, ent-kaurenoic acid oxidase; KAO2, ent-kaurenoic acid oxidase 2; GA20ox-1, gibberellin 20-oxidase 1; GA20ox-3, gibberellin 20-oxidase 3; GA2ox-2, gibberellin 2-oxidase 2; GA2ox-4, gibberellin 2-oxidase 4; NCED1, 9-cis-epoxycarotenoid dioxygenase 1; NCED2, 9-cis-epoxycarotenoid dioxygenase 2; PYR1, pyrabactin resistance 1; ABA2, abscisic acid deficient 2; PYL3, PYR-like 3; PYL4, PYR-like 4.
-
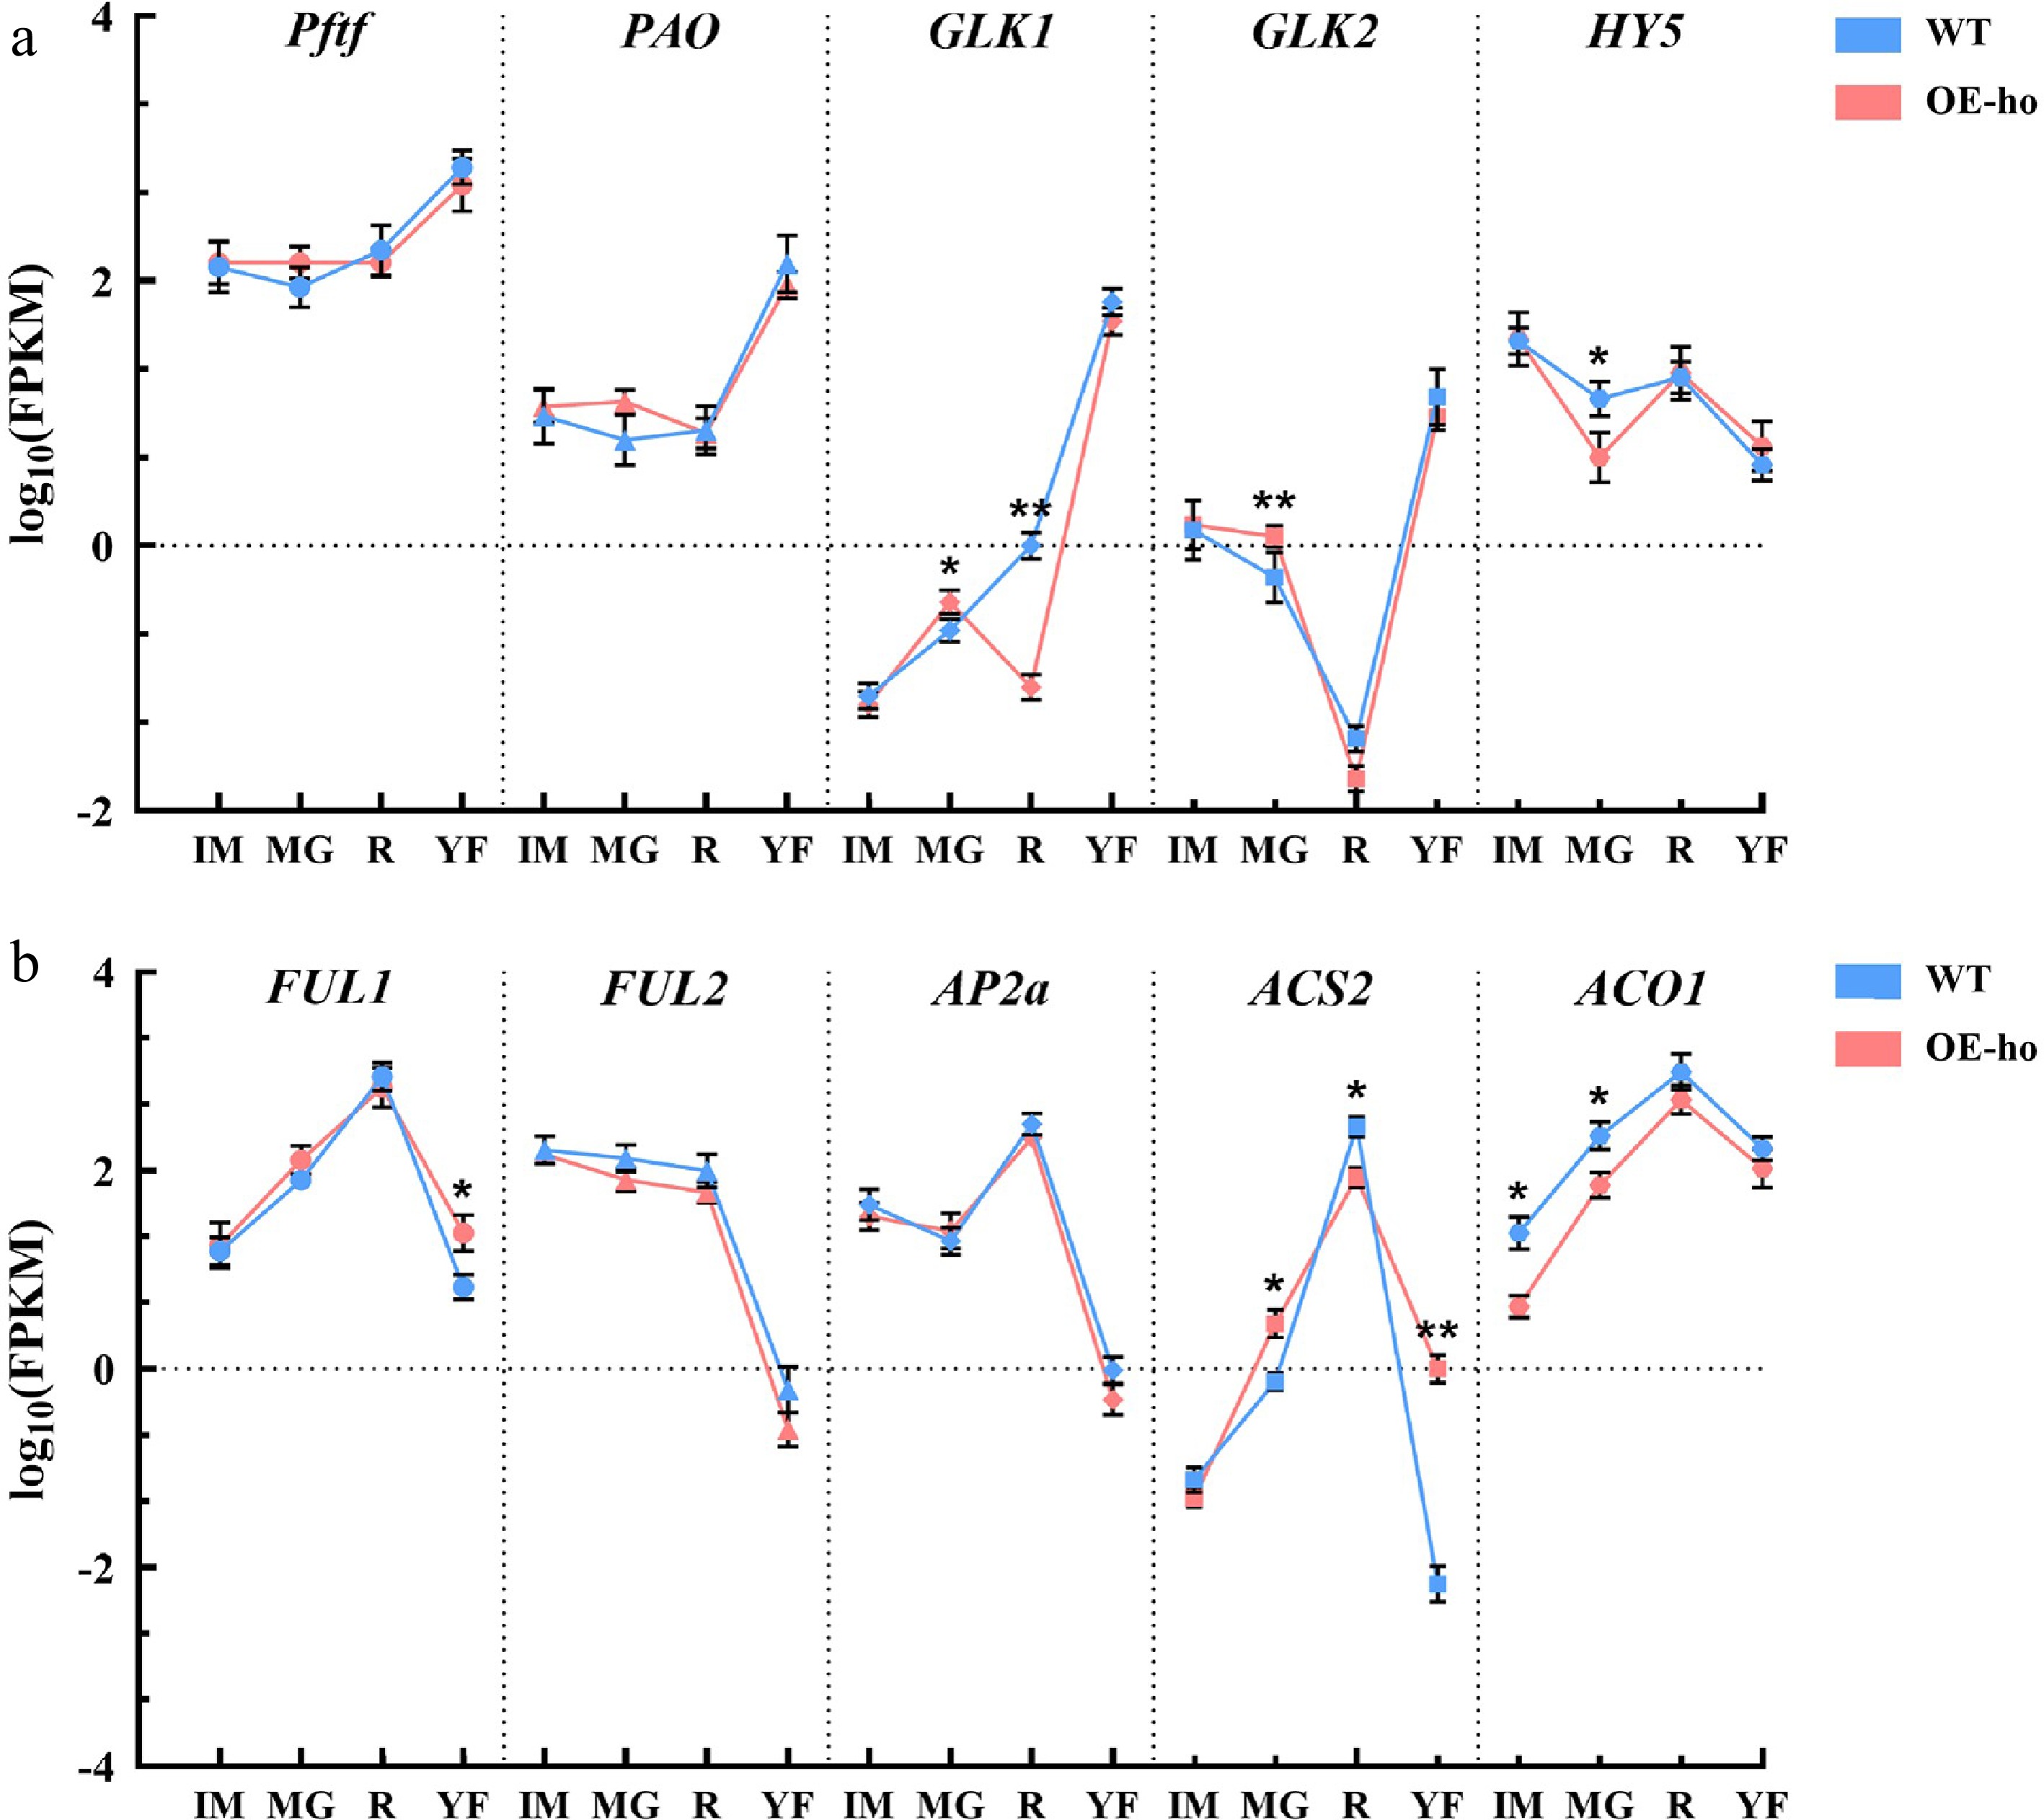
Figure 7.
The expression of genes involved in (a) plastid development and differentiation and (b) fruit ripening from RNA-seq data in immature (IM), mature green (MG), and red-ripe (R) fruit, as well as young leaves (YF), in OE-13-ho plants and WT. Pftf, plastid fusion and/or translocation factor; PAO, pheide a oxygenase; GLK1, golden 2-like 1; GLK2, golden 2-like 2; HY5, ELONGATED HYPOCOTYL 5; FUL1, FRUITFULL 1; FUL2, FRUITFULL 2; AP2a, APETALA2a; ACS2, 1-Aminocyclopropane-1-carboxylic acid synthase 2; and ACO1, 1-Aminocyclopropane-1-carboxylic acid oxidase 1. The data are shown as means ± SD (n = 3). Significant differences between WT and OE-ho at the same developmental stage were analyzed using a t-test. * p < 0.05, ** p < 0.01.
-
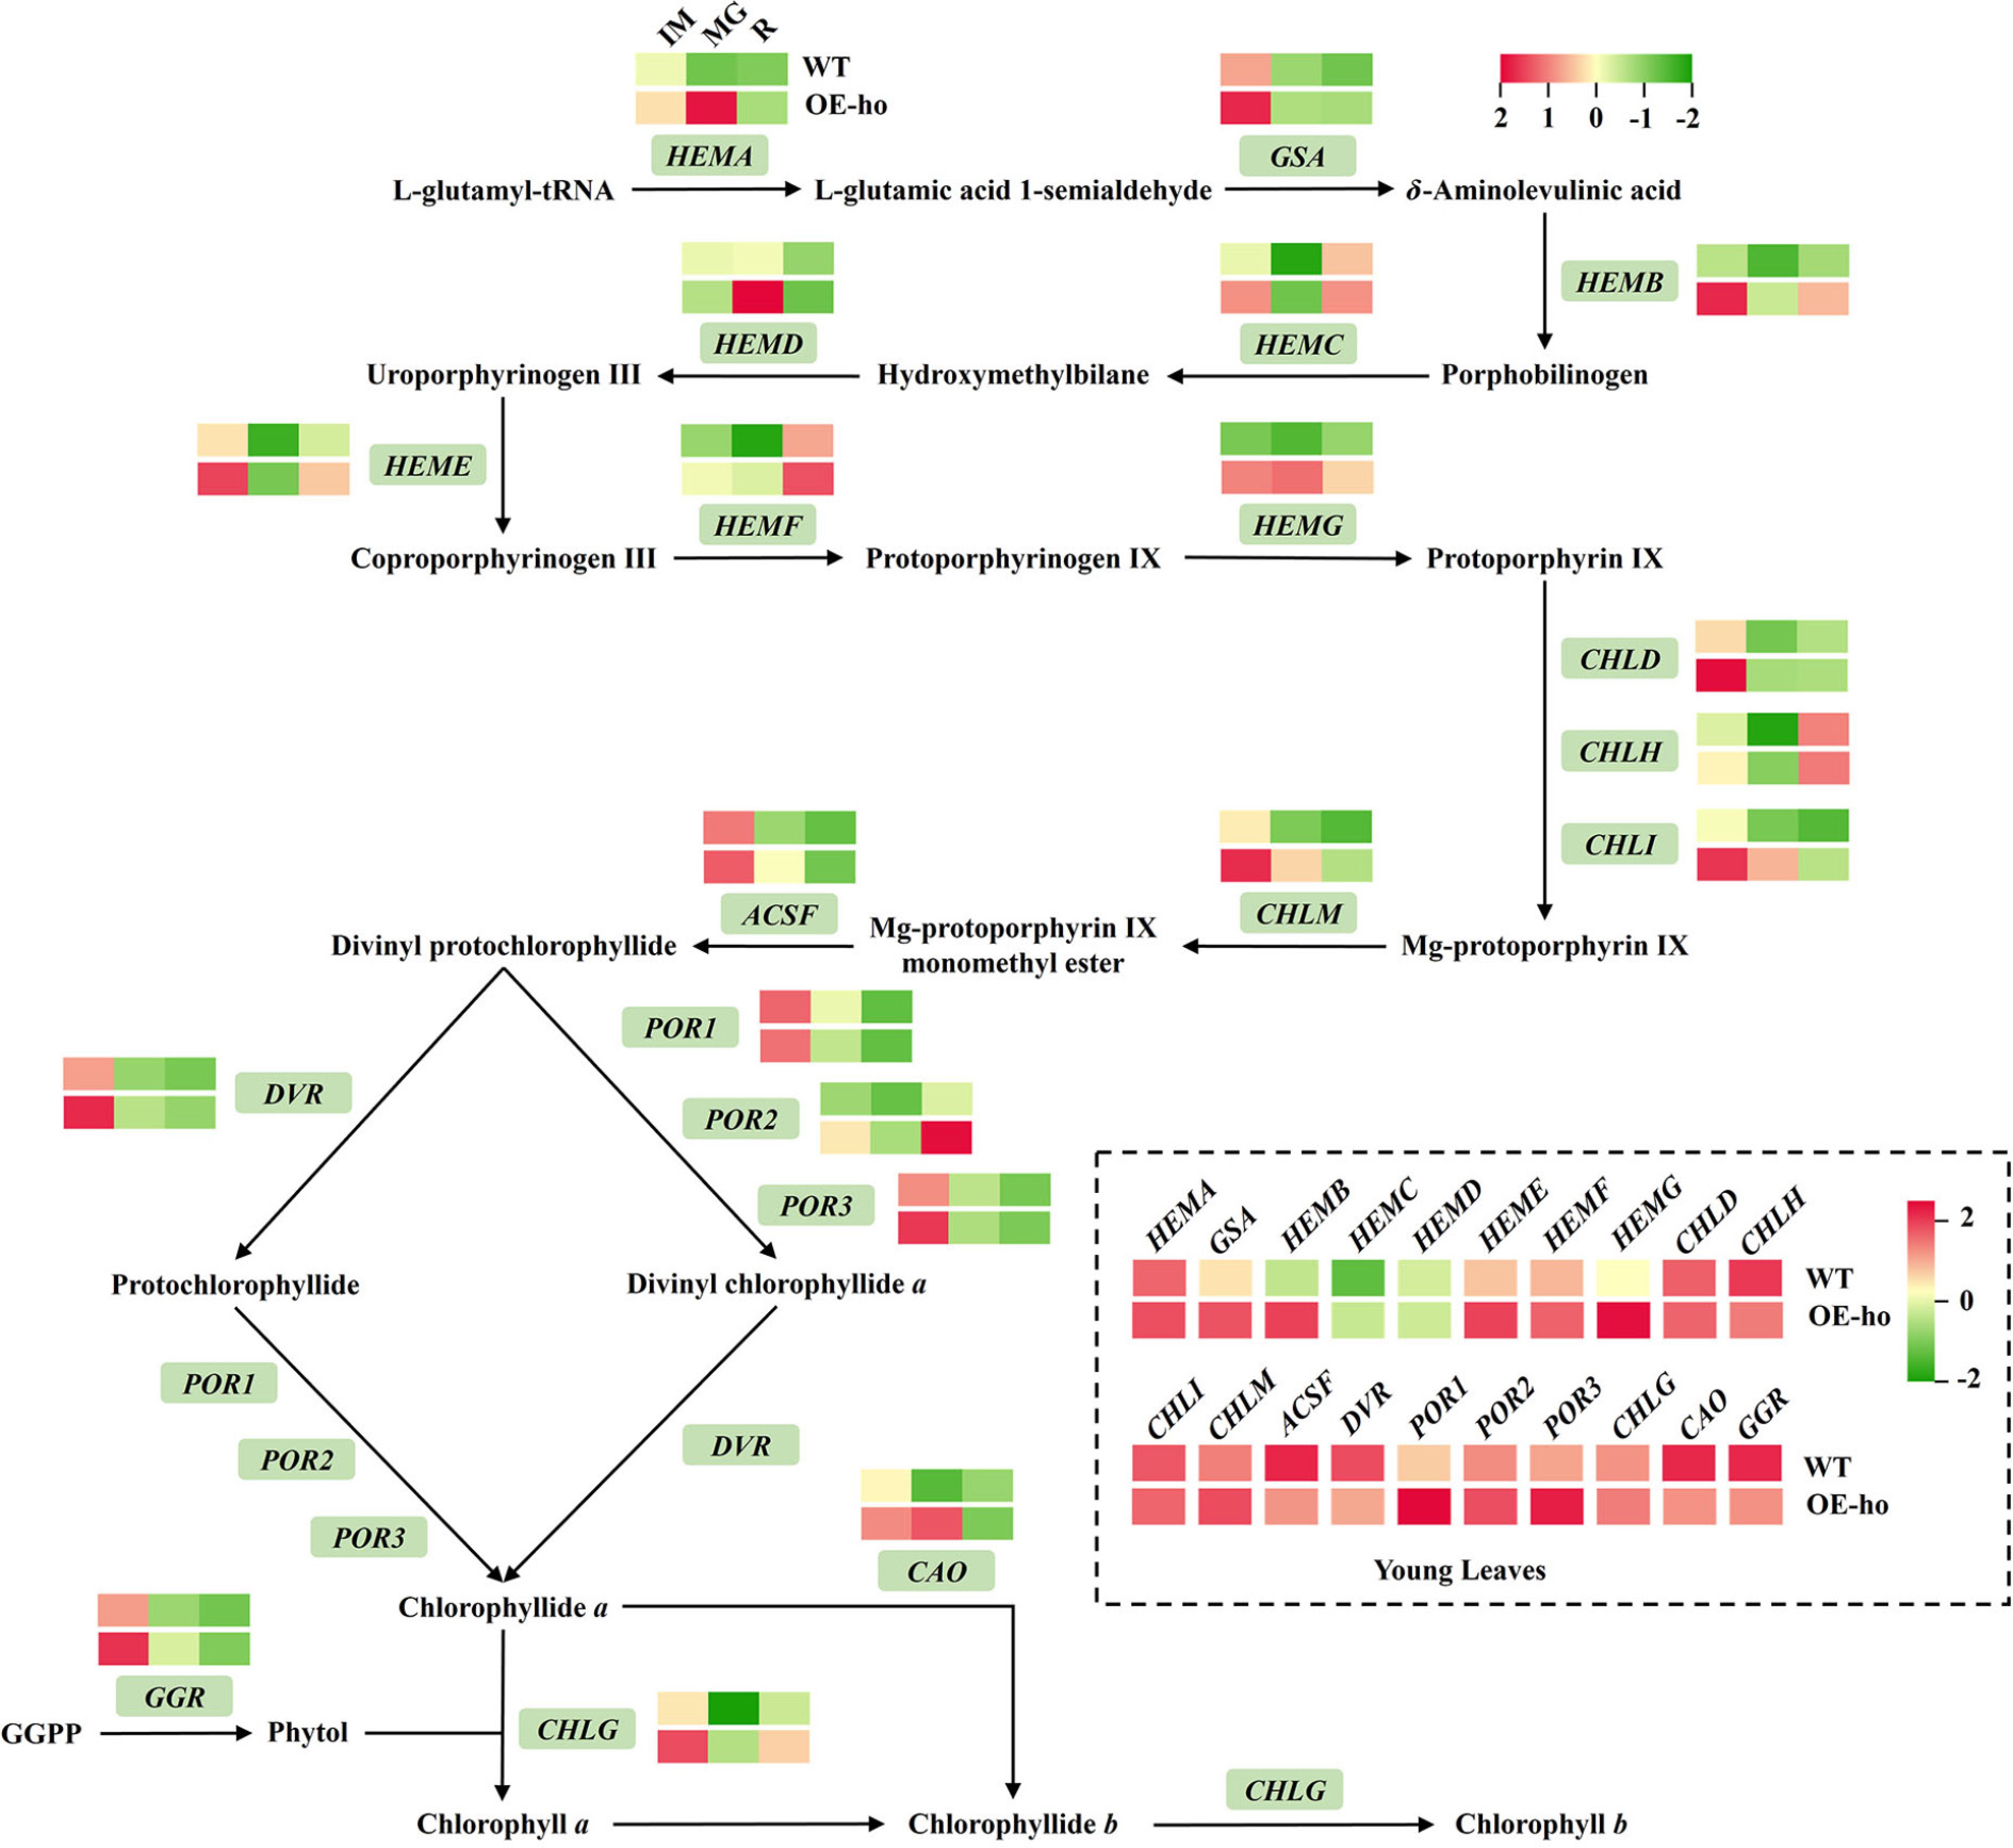
Figure 8.
Heatmap showing the expression pattern of genes related to the chlorophyll metabolism pathway from RNA-seq data at the immature (IM), mature green (MG), and red-ripe (R) fruit developmental stages, as well as young leaves. Solid lines with arrows present the direction of metabolic pathways. The dashed box exhibits expression patterns of chlorophyll metabolic genes in young leaves. HEMA, glutamyl-tRNA reductase; GSA, glutamate-1-semialdehyde aminotransferase; HEMB, 5-aminolevulinic acid dehydratase; HEMC, porphobilinogen deaminase; HEMD, uroporphyrinogen III synthase; HEME, uroporphyrinogen III decarboxylase; HEMF, coproporphyrinogen III oxidase; HEMG, protoporphyrinogen IX oxidase; CHLD, Mg-protoporphyrin IX chelatase D subunit; CHLH, Mg-protoporphyrin IX chelatase H subunit; CHLI, Mg-protoporphyrin IX chelatase I subunit; CHLM, Mg-protoporphyrin IX methyltransferase; ACSF, Mg-protoporphyrin IX monomethylester cyclase; POR1, protochlorophyllide oxidoreductase 1; POR2, protochlorophyllide oxidoreductase 2; POR3, protochlorophyllide oxidoreductase 3; DVR, divinyl chlorophyllide a 8-vinyl-reductase; CAO, chlorophyllide a oxygenase; CHLG, chlorophyll synthase; and GGR, geranylgeranyl reductase.
Figures
(8)
Tables
(0)