-
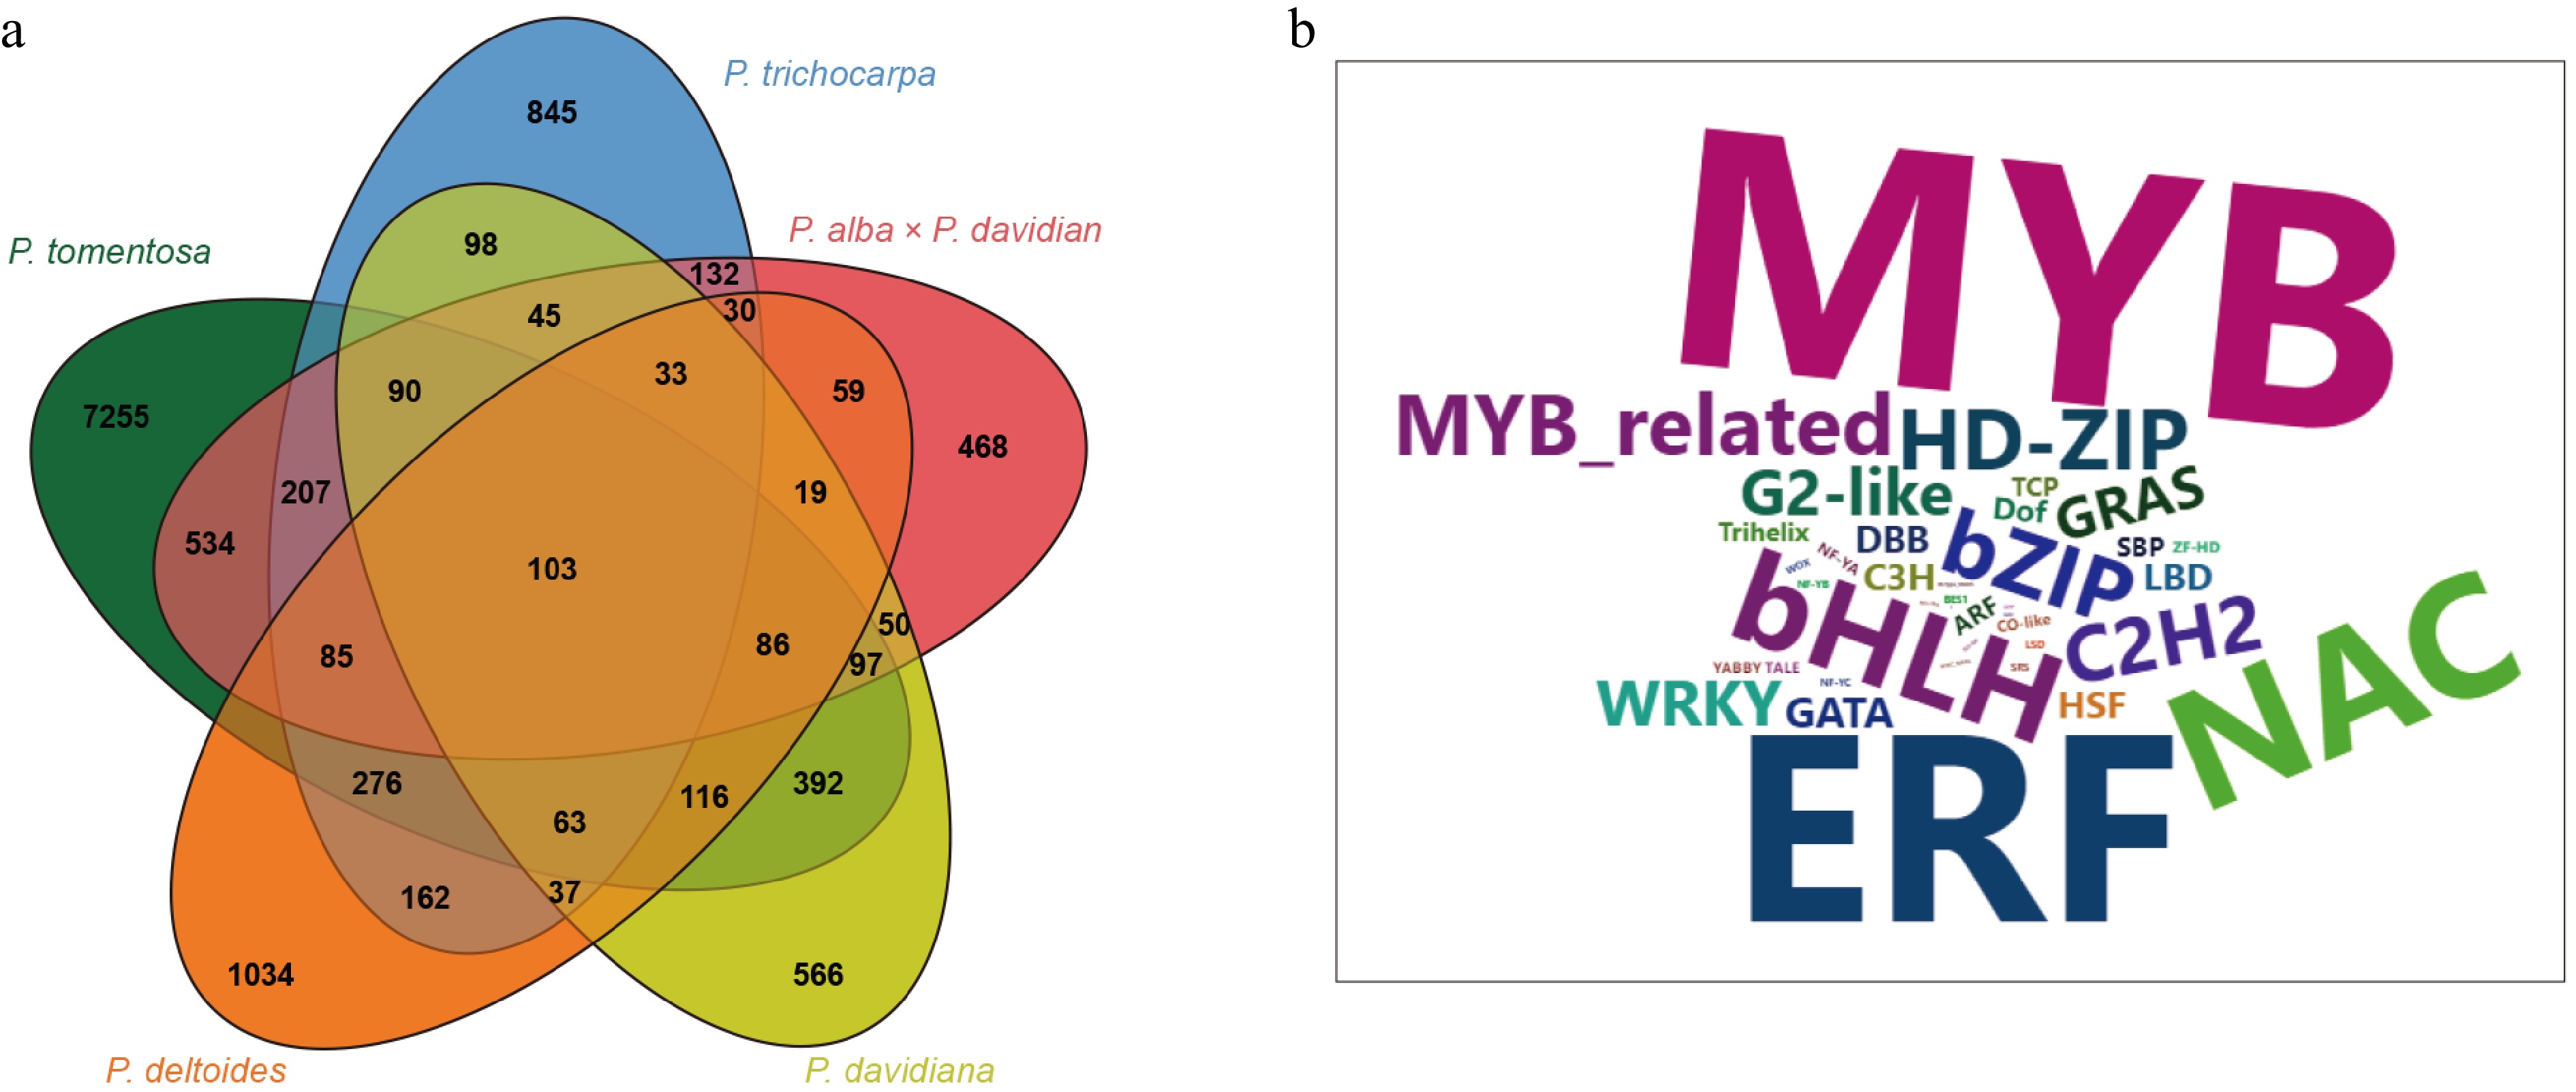
Figure 1.
Ethylene-responsive factors (ERFs) are key transcription factors involved in drought stress responses in Populus. (a) Venn diagram showing the overlap of differentially expressed genes (DEGs) under drought stress among five Populus taxa: P. tomentosa, P. trichocarpa, P. alba × P. davidiana, P. davidiana, and P. deltoides. (b) Word cloud showing all differentially expressed transcription factors (TFs). Font size reflects the frequency of occurrence, with larger fonts denoting higher representation across species.
-
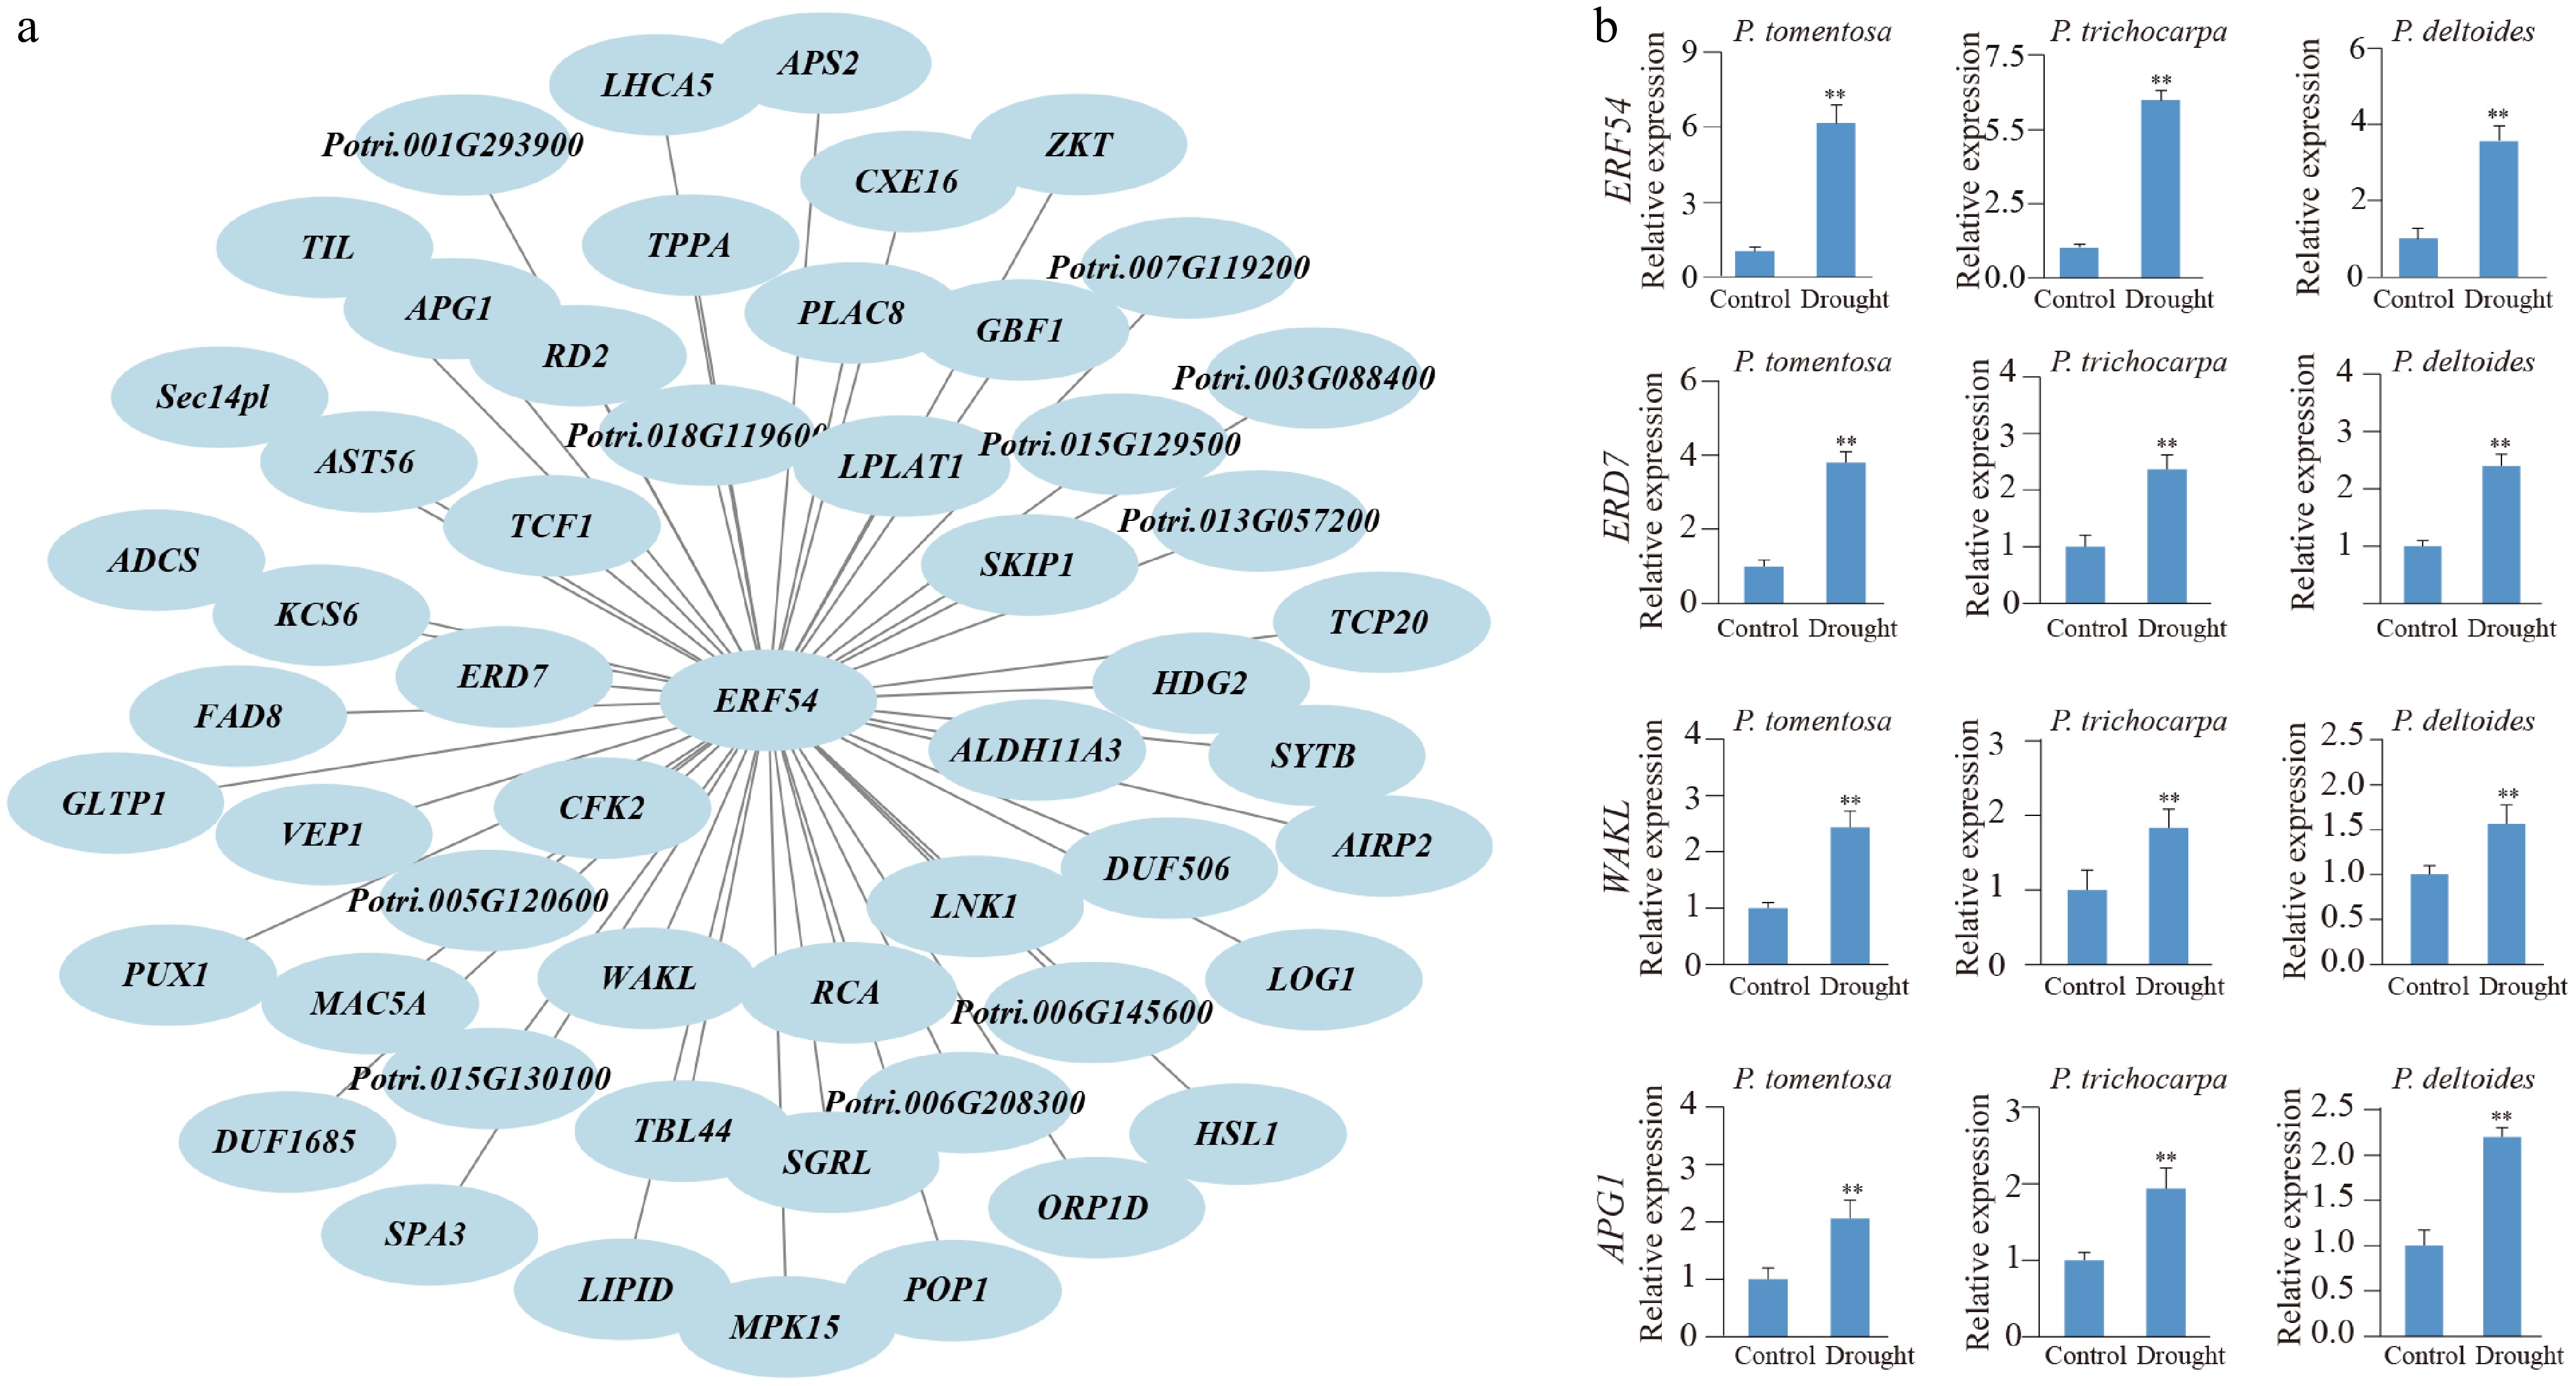
Figure 2.
Co-expression network centered on ERF54 and expression validation across Populus species. (a) Drought-responsive gene co-expression network centered on ERF54, constructed using weighted gene co-expression network analysis across five Populus taxa. Nodes represent genes, and edges indicate significant co-expression relationships. (b)–(e) Reverse transcription-quantitative polymerase chain reaction validation of ERF54 and selected co-expressed genes (ERD7, WAKL, and APG1) in P. tomentosa, P. trichocarpa, and P. deltoides under drought stress. Data represent means ± SE (n = 3 biological replicates, each with four technical replicates). Asterisks denote significant differences compared with the control: ** p < 0.01.
-
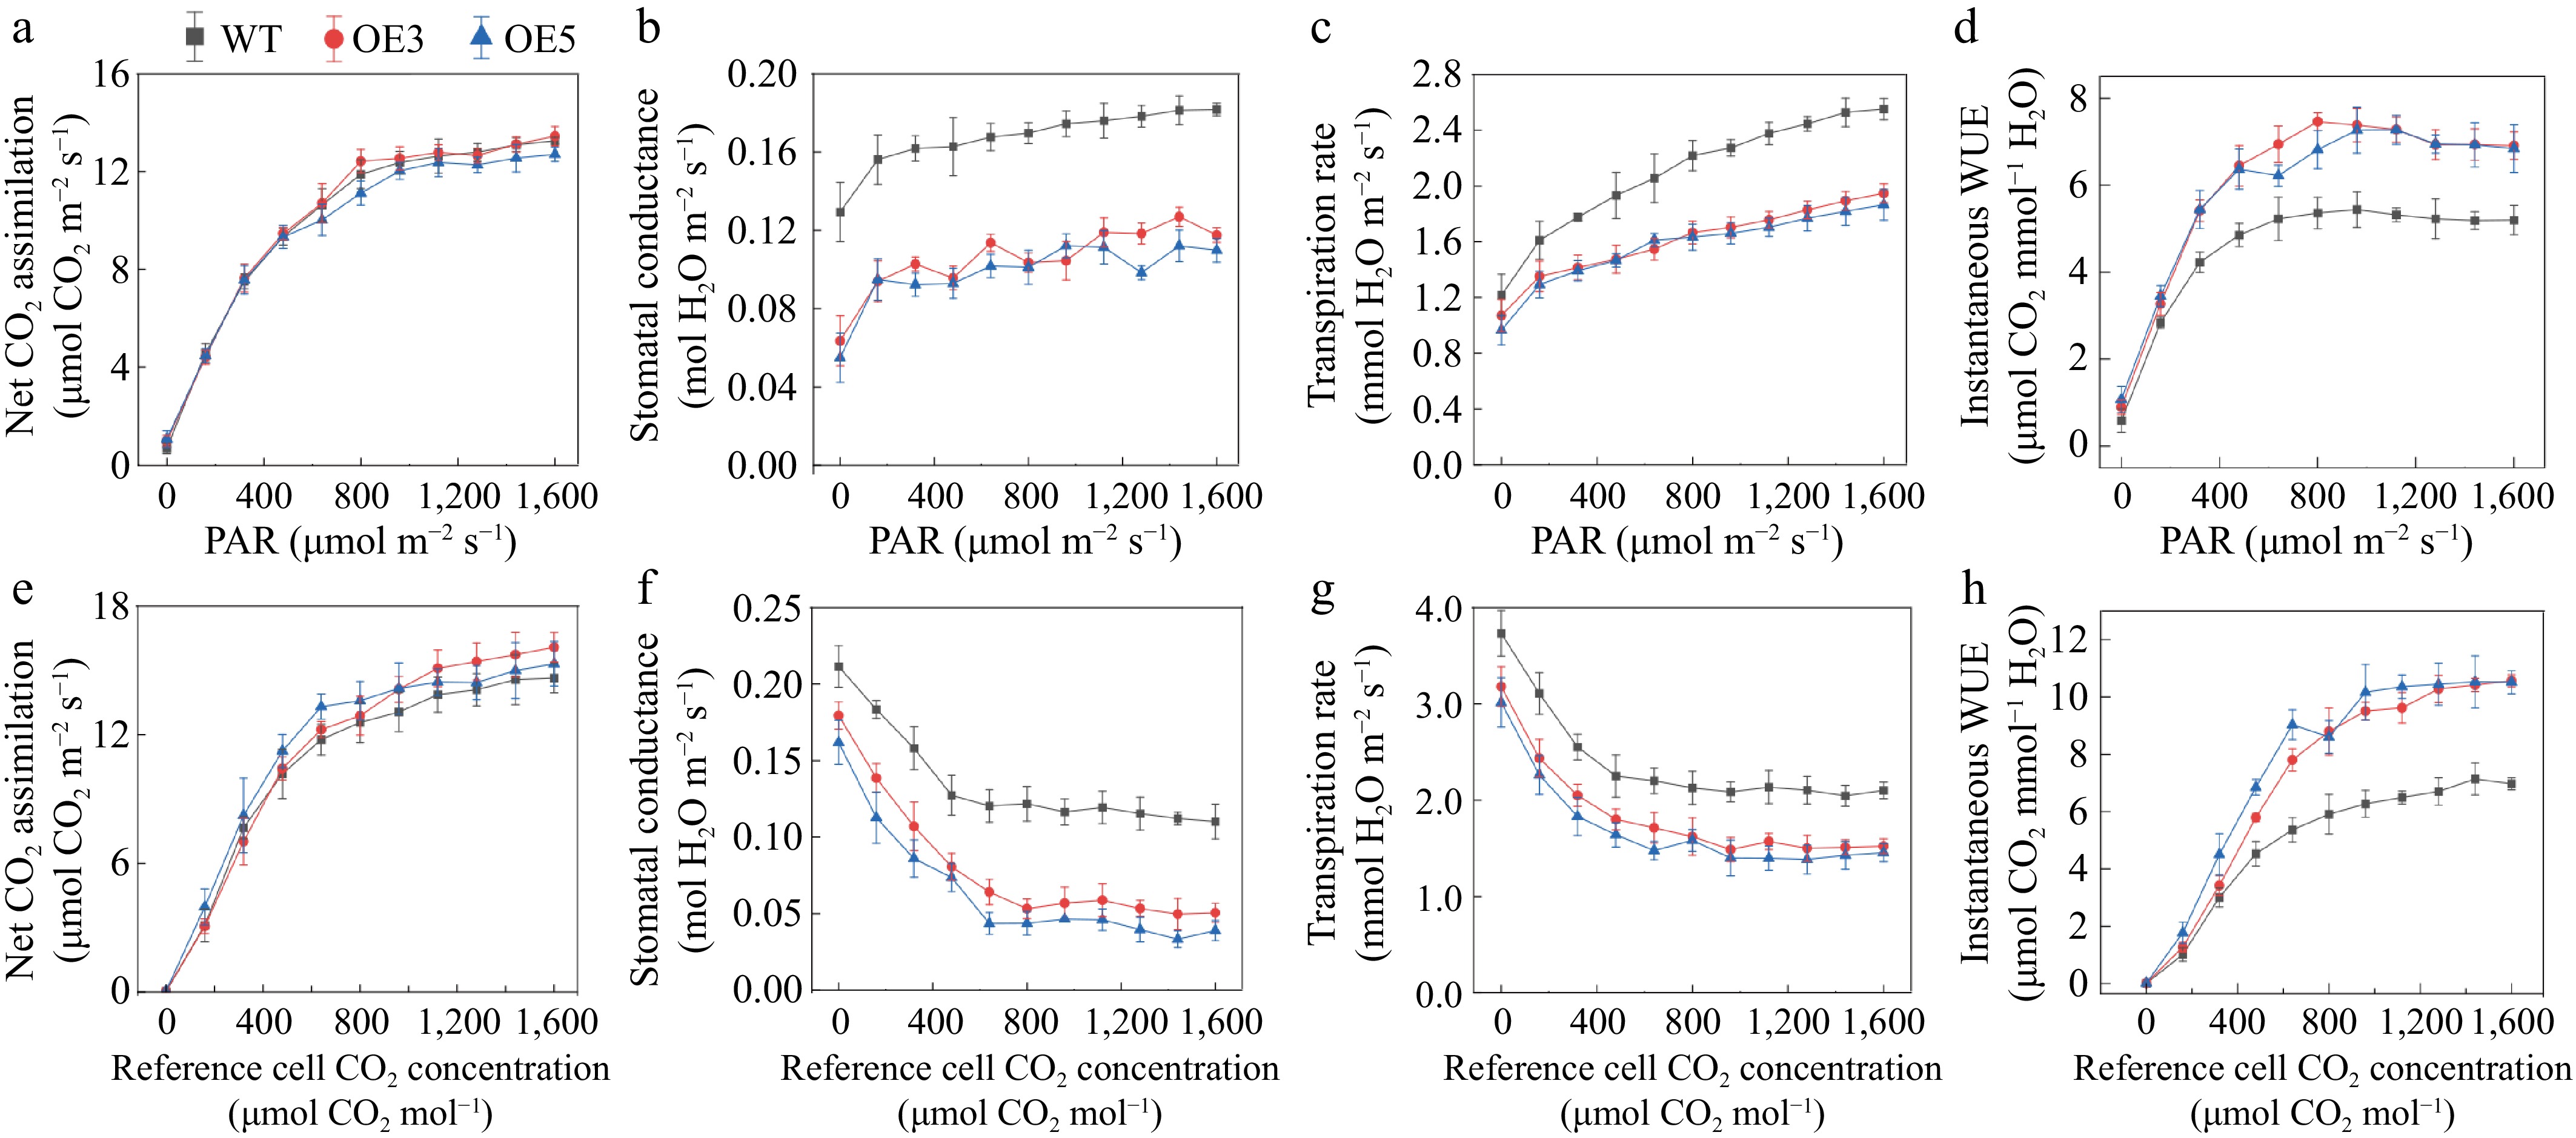
Figure 3.
PtrERF54 overexpression improves iWUE. Light response curves of (a) net photosynthetic rate (Pn), (b) stomatal conductance (Gs), (c) transpiration rate (Tr), and (d) instantaneous water-use efficiency (iWUE). CO2 response curves of (e) Pn, (f) Gs, (g) Tr, and (h) iWUE. Data represent means ± SE (n = 3 biological replicates, each with three technical replicates).
-
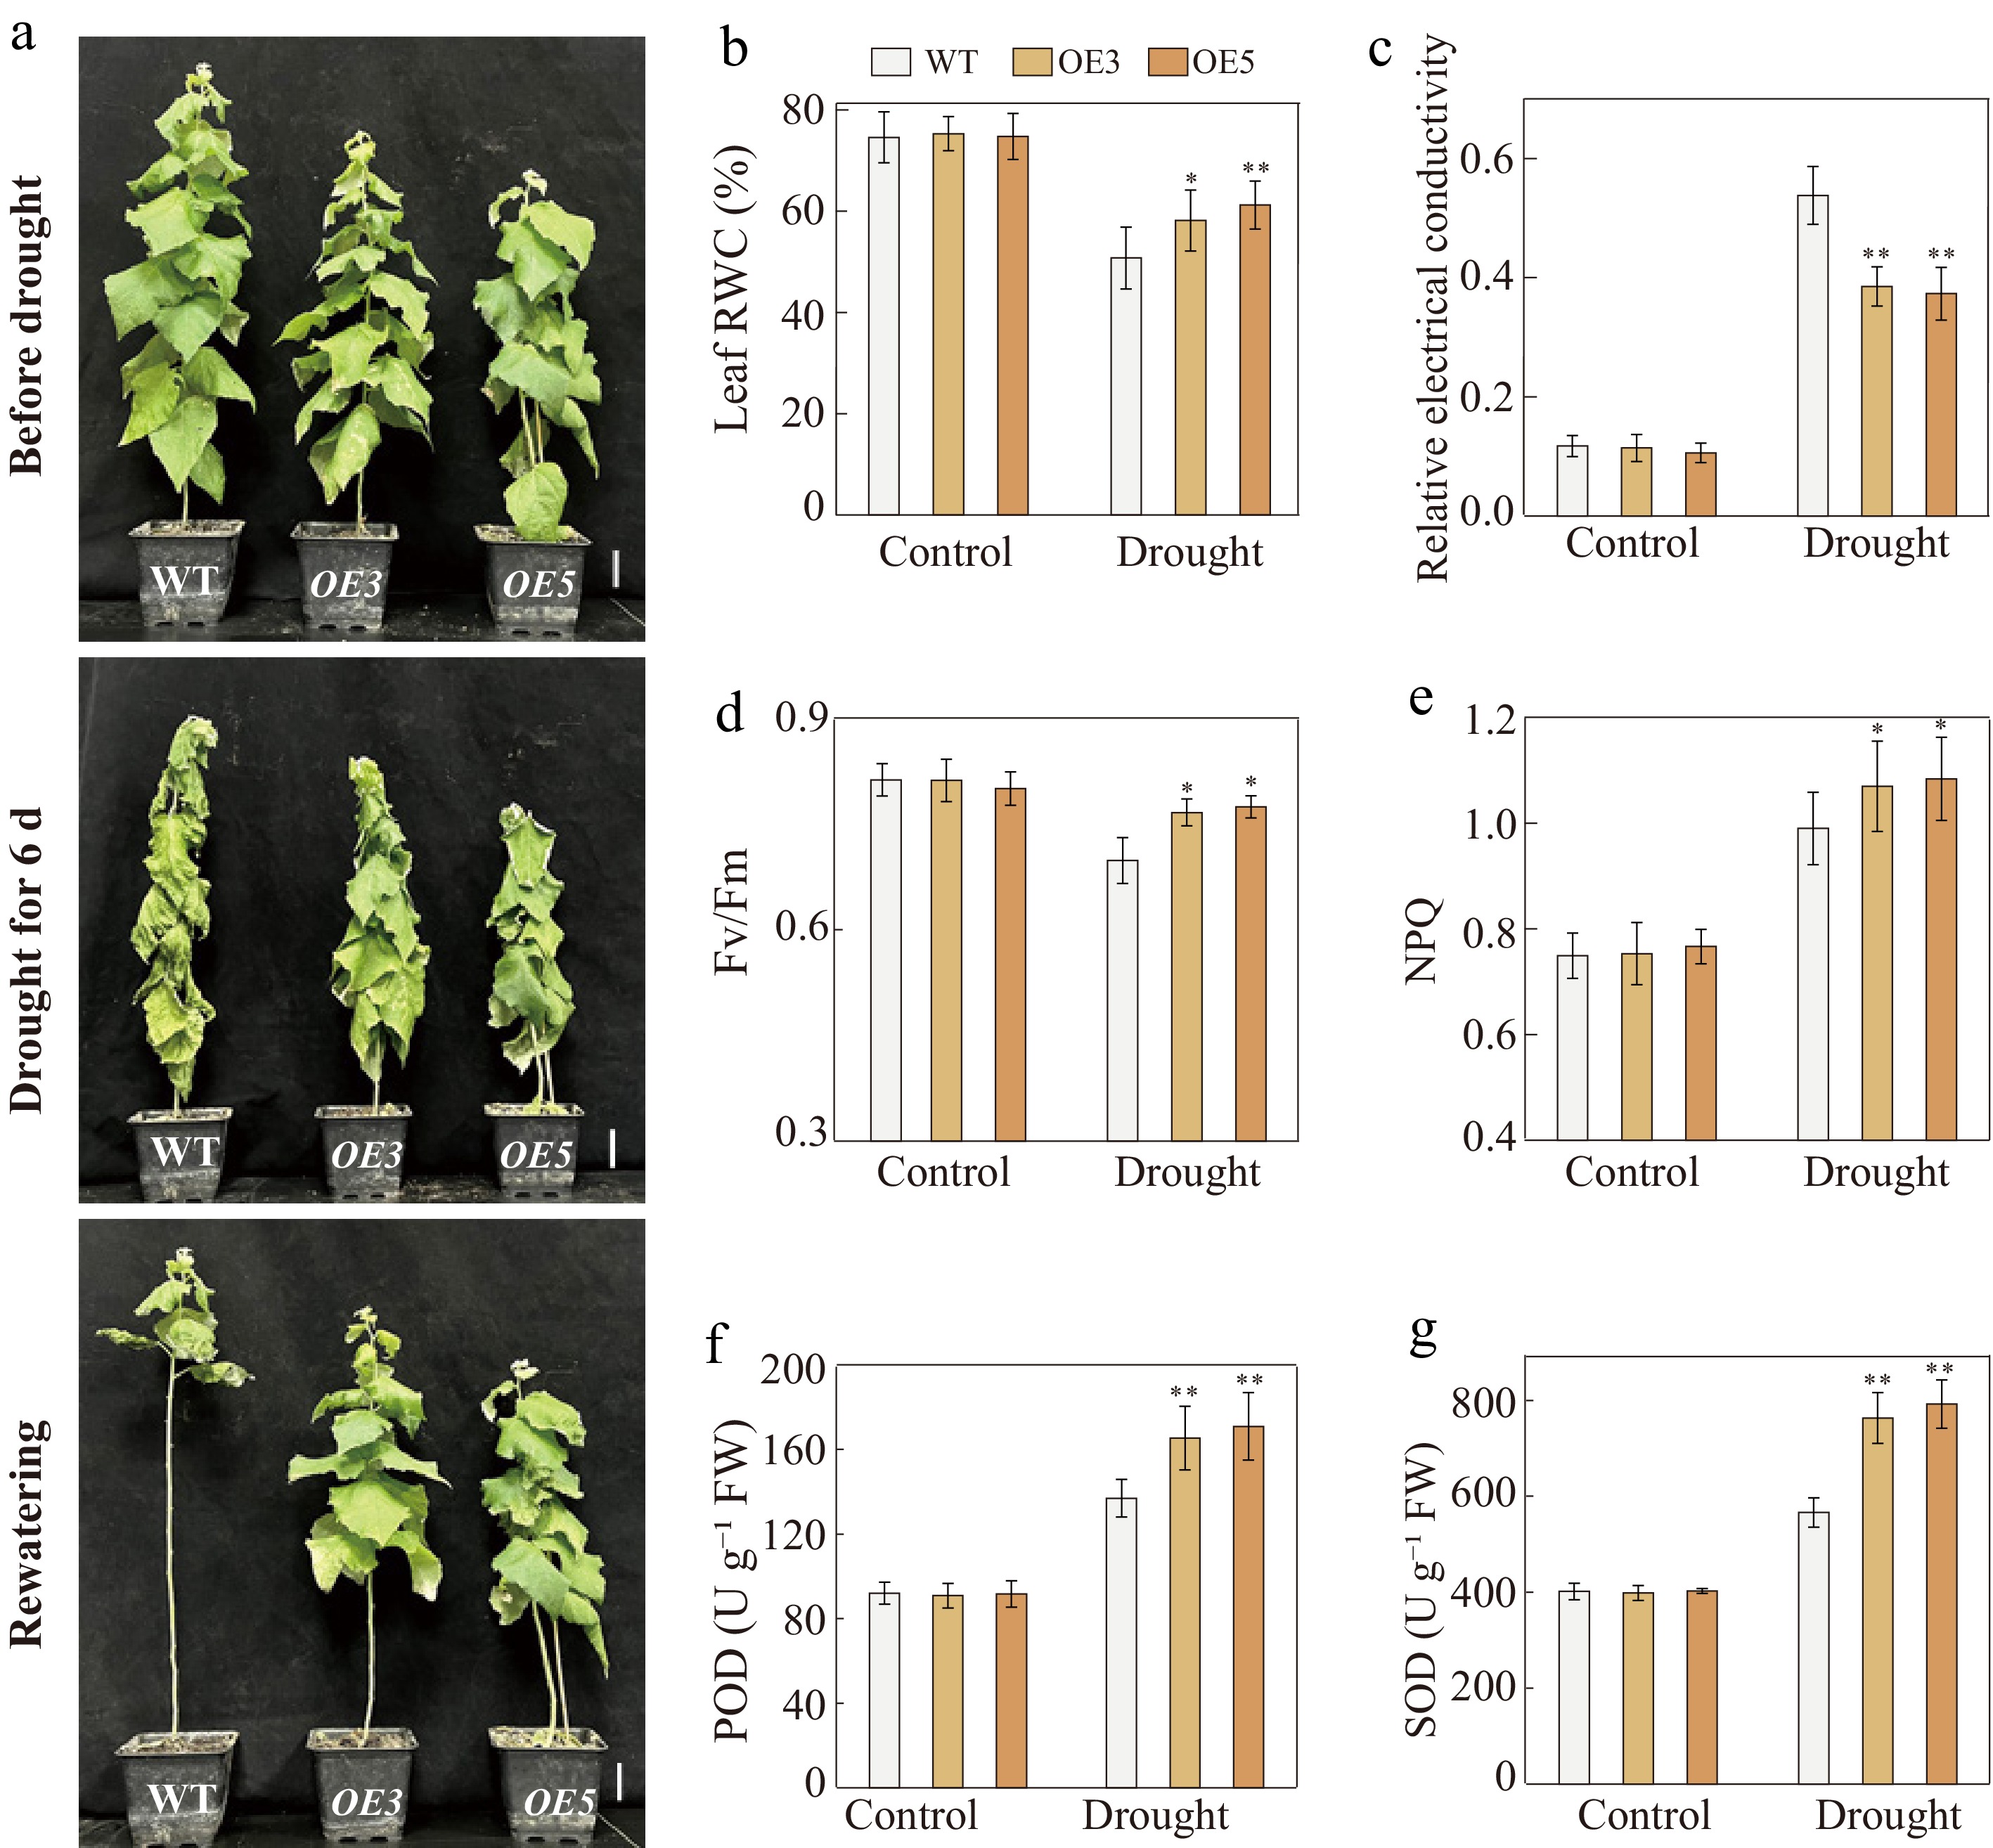
Figure 4.
PtrERF54 enhances drought tolerance in poplar. (a) Morphological comparison between wild-type (WT) and PtrERF54-overexpressing (PtrERF54-OE) poplar lines following drought stress. Scale bar = 5 cm. (b) Leaf relative water content (RWC) and (c) relative electrical conductivity (REC), indicating water status and membrane integrity. (d) Maximum photochemical efficiency of photosystem II (Fv/Fm) and (e) non-photochemical quenching (NPQ) under drought stress. Enzymatic activities of (f) peroxidase (POD) and (g) superoxide dismutase (SOD) as indicators of antioxidant responses. Data represent means ± SE (n = 3 biological replicates, each with four technical replicates). Asterisks denote significant differences compared with the control: * p < 0.05; ** p < 0.01.
-
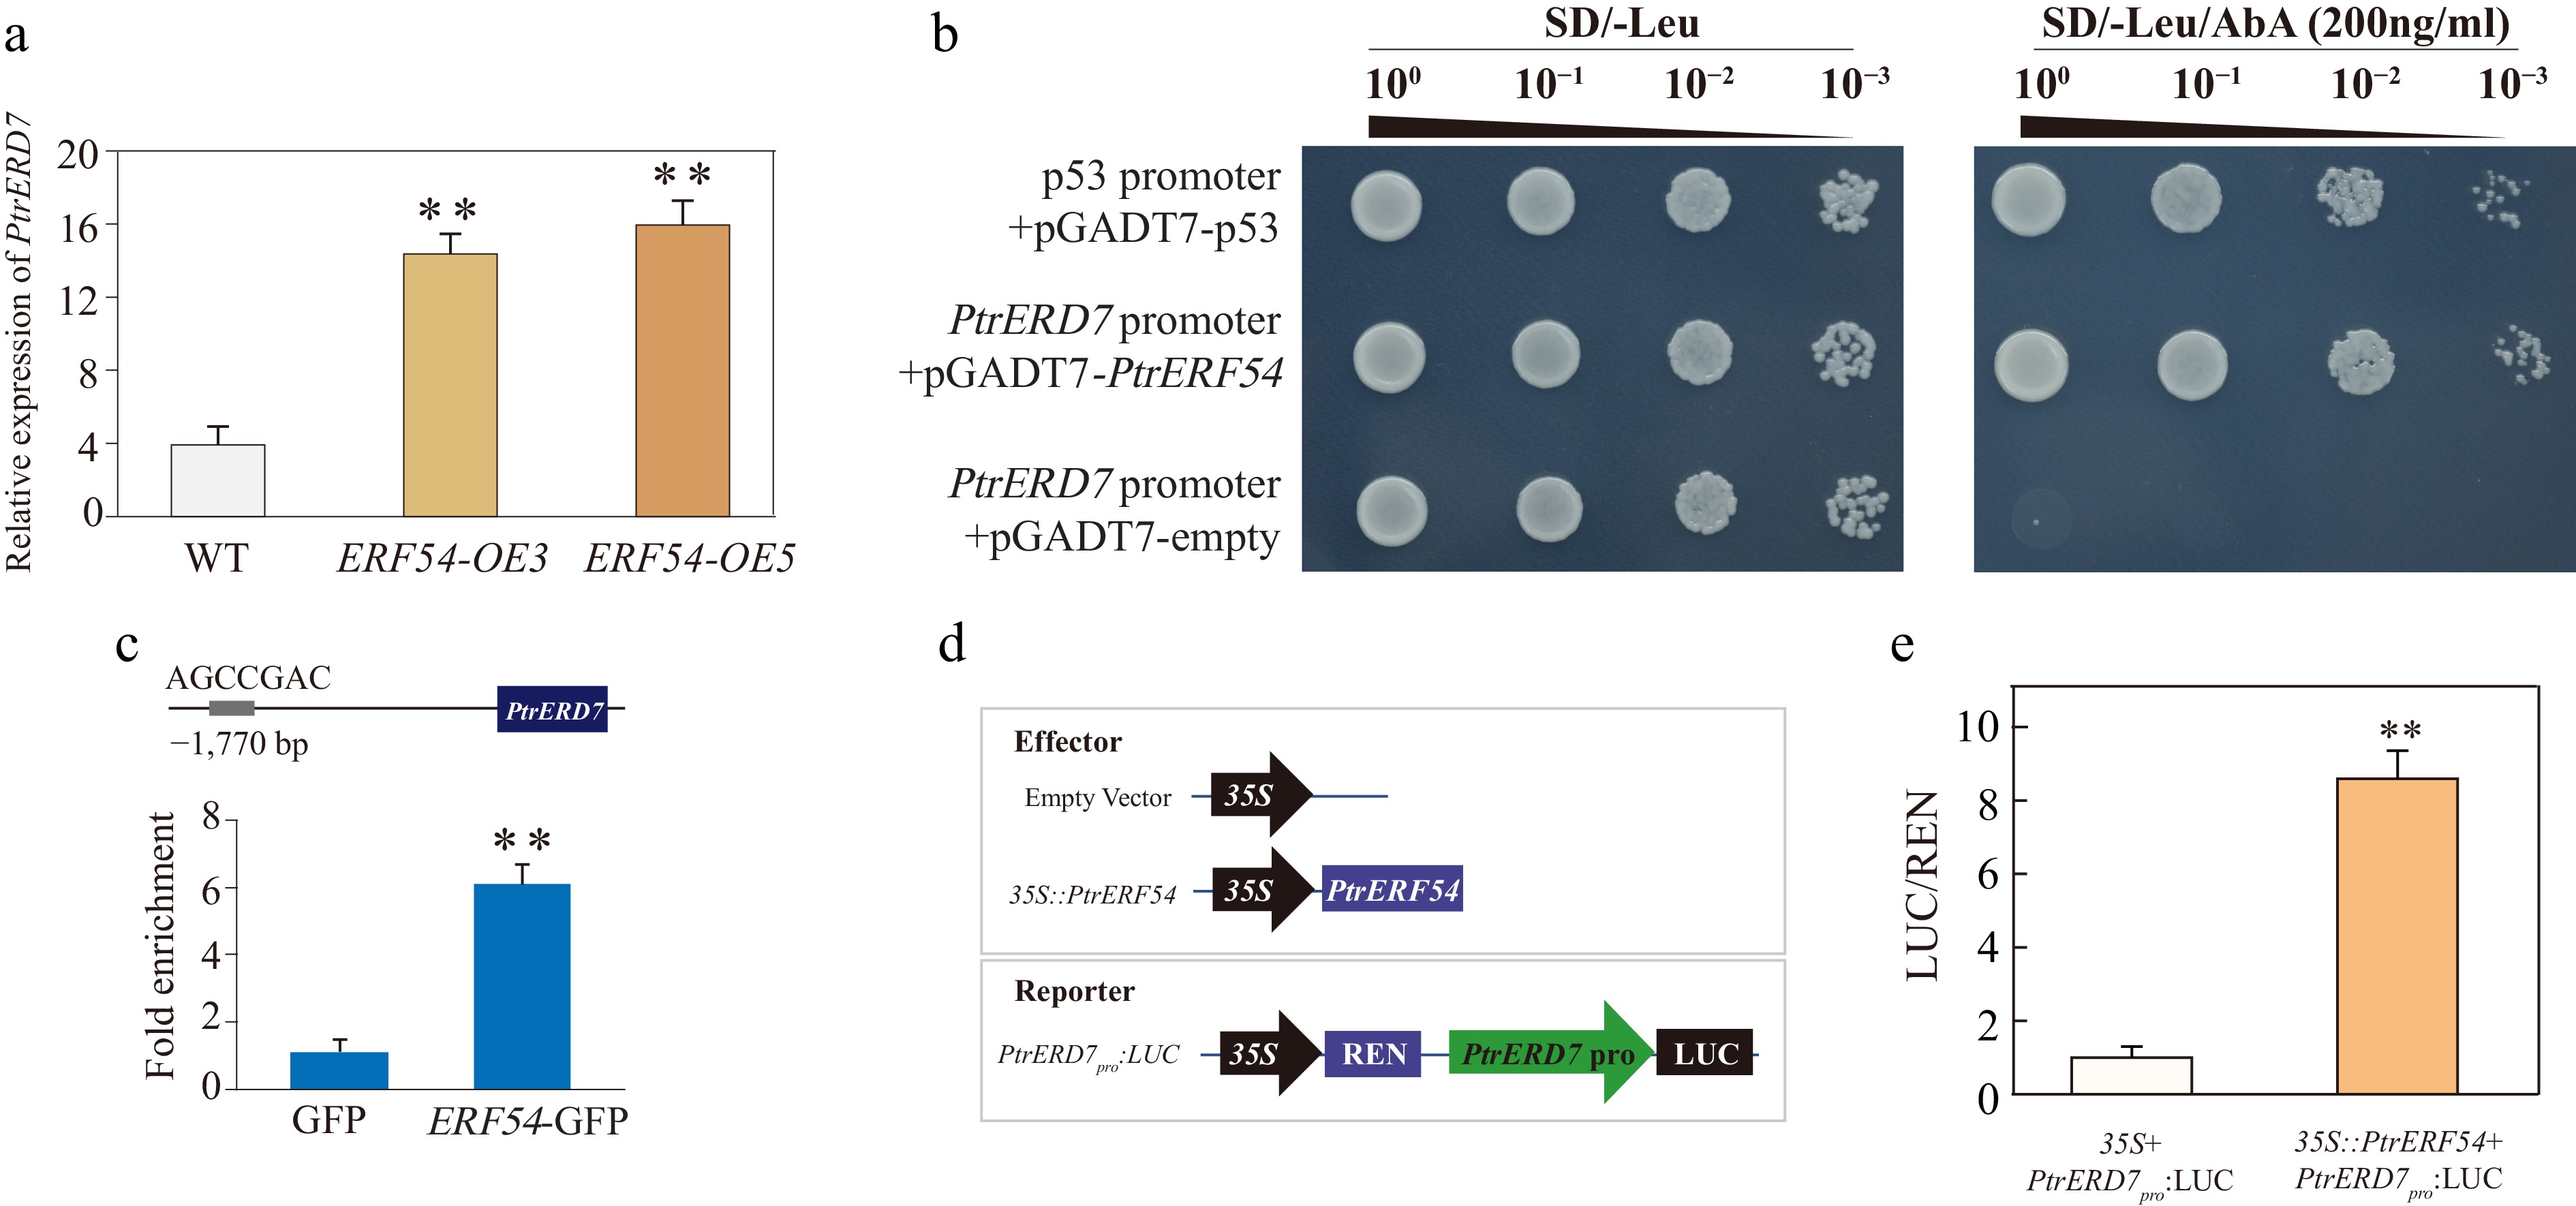
Figure 5.
PtrERF54 binds to the PtrERD7 promoter and regulates its expression. (a) Relative expression level of PtrERD7 in wild-type (WT) and PtrERF54-overexpressing (PtrERF54-OE) poplar lines as determined by RT-qPCR. (b) Yeast one-hybrid assay showing that PtrERF54 binds to the PtrERD7 promoter. Yeast strains co-transformed with pGADT7-PtrERF54 and pAbAi-PtrERD7 pro grew on selective medium (SD/-Leu) supplemented with 200 ng mL−1 aureobasidin A (AbA). (c) ChIP-qPCR analysis showing the enrichment of the PtrERD7 promoter fragment containing the predicted AP2/ERF-binding motif by PtrERF54-GFP. GFP-only transgenic plants served as the negative control. (d) Schematic representation of the constructs used in the dual-luciferase reporter assay, including the effector and reporter constructs. (e) A dual-luciferase reporter assay was used to assess transactivation of the PtrERD7 promoter by PtrERF54 in N. benthamiana leaves. Effector and reporter constructs were co-infiltrated, and luciferase (LUC) activity was measured 72 h later. Values were normalized to REN (Renilla luciferase) activity, with the empty effector vector serving as the control. Data represent means ± SE (n = 3 biological replicates, each with four technical replicates). Asterisks denote significant differences compared with the control: ** p < 0.01.
-
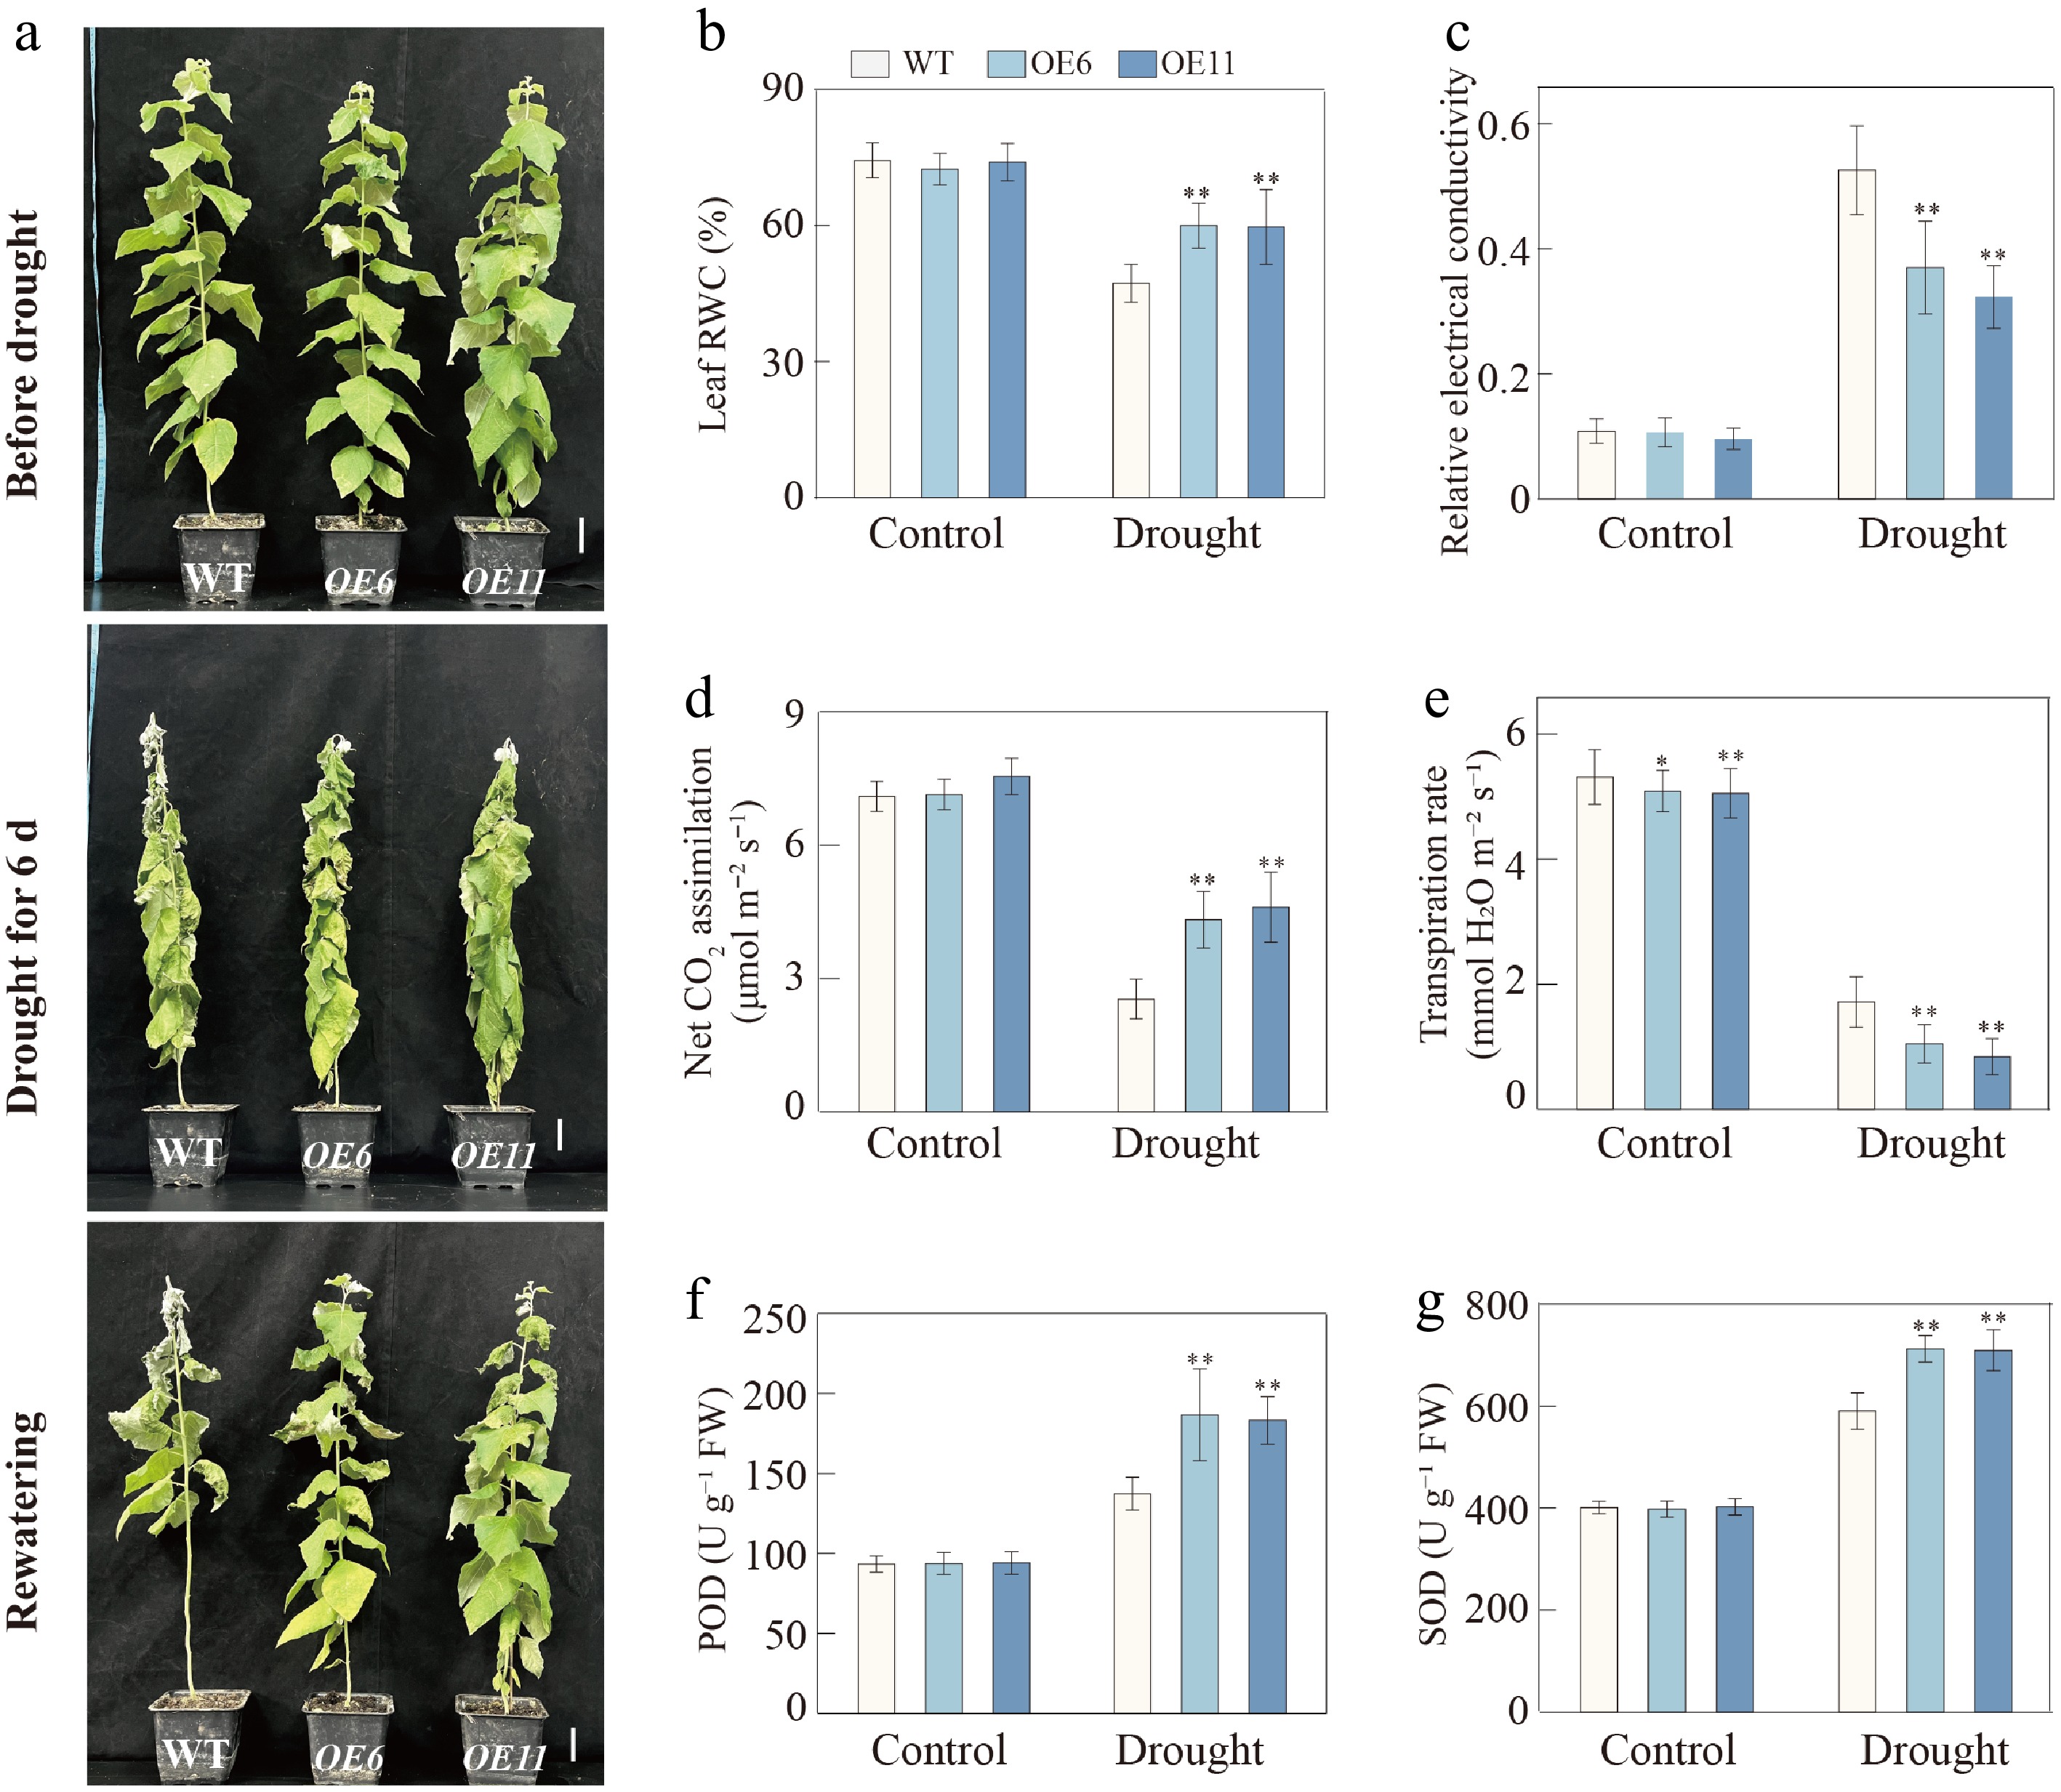
Figure 6.
Overexpression of PtrERD7 enhances drought tolerance in poplar. (a) Morphological comparison between wild-type (WT) and PtrERD7-overexpressing (PtrERD7-OE) poplar lines after drought treatment. Scale bar = 5 cm. (b) Leaf relative water content (RWC) and (c) relative electrical conductivity, indicating water retention capacity and membrane integrity, respectively. (d) Net photosynthetic rate and (e) transpiration rate under drought conditions. Activities of the antioxidant enzymes (f) peroxidase (POD) and (g) superoxide dismutase (SOD) in response to drought stress. Data represent means ± SE (n = 3 biological replicates, each with four technical replicates). Asterisks denote significant differences: * p < 0.05; ** p < 0.01.
Figures
(6)
Tables
(0)