-
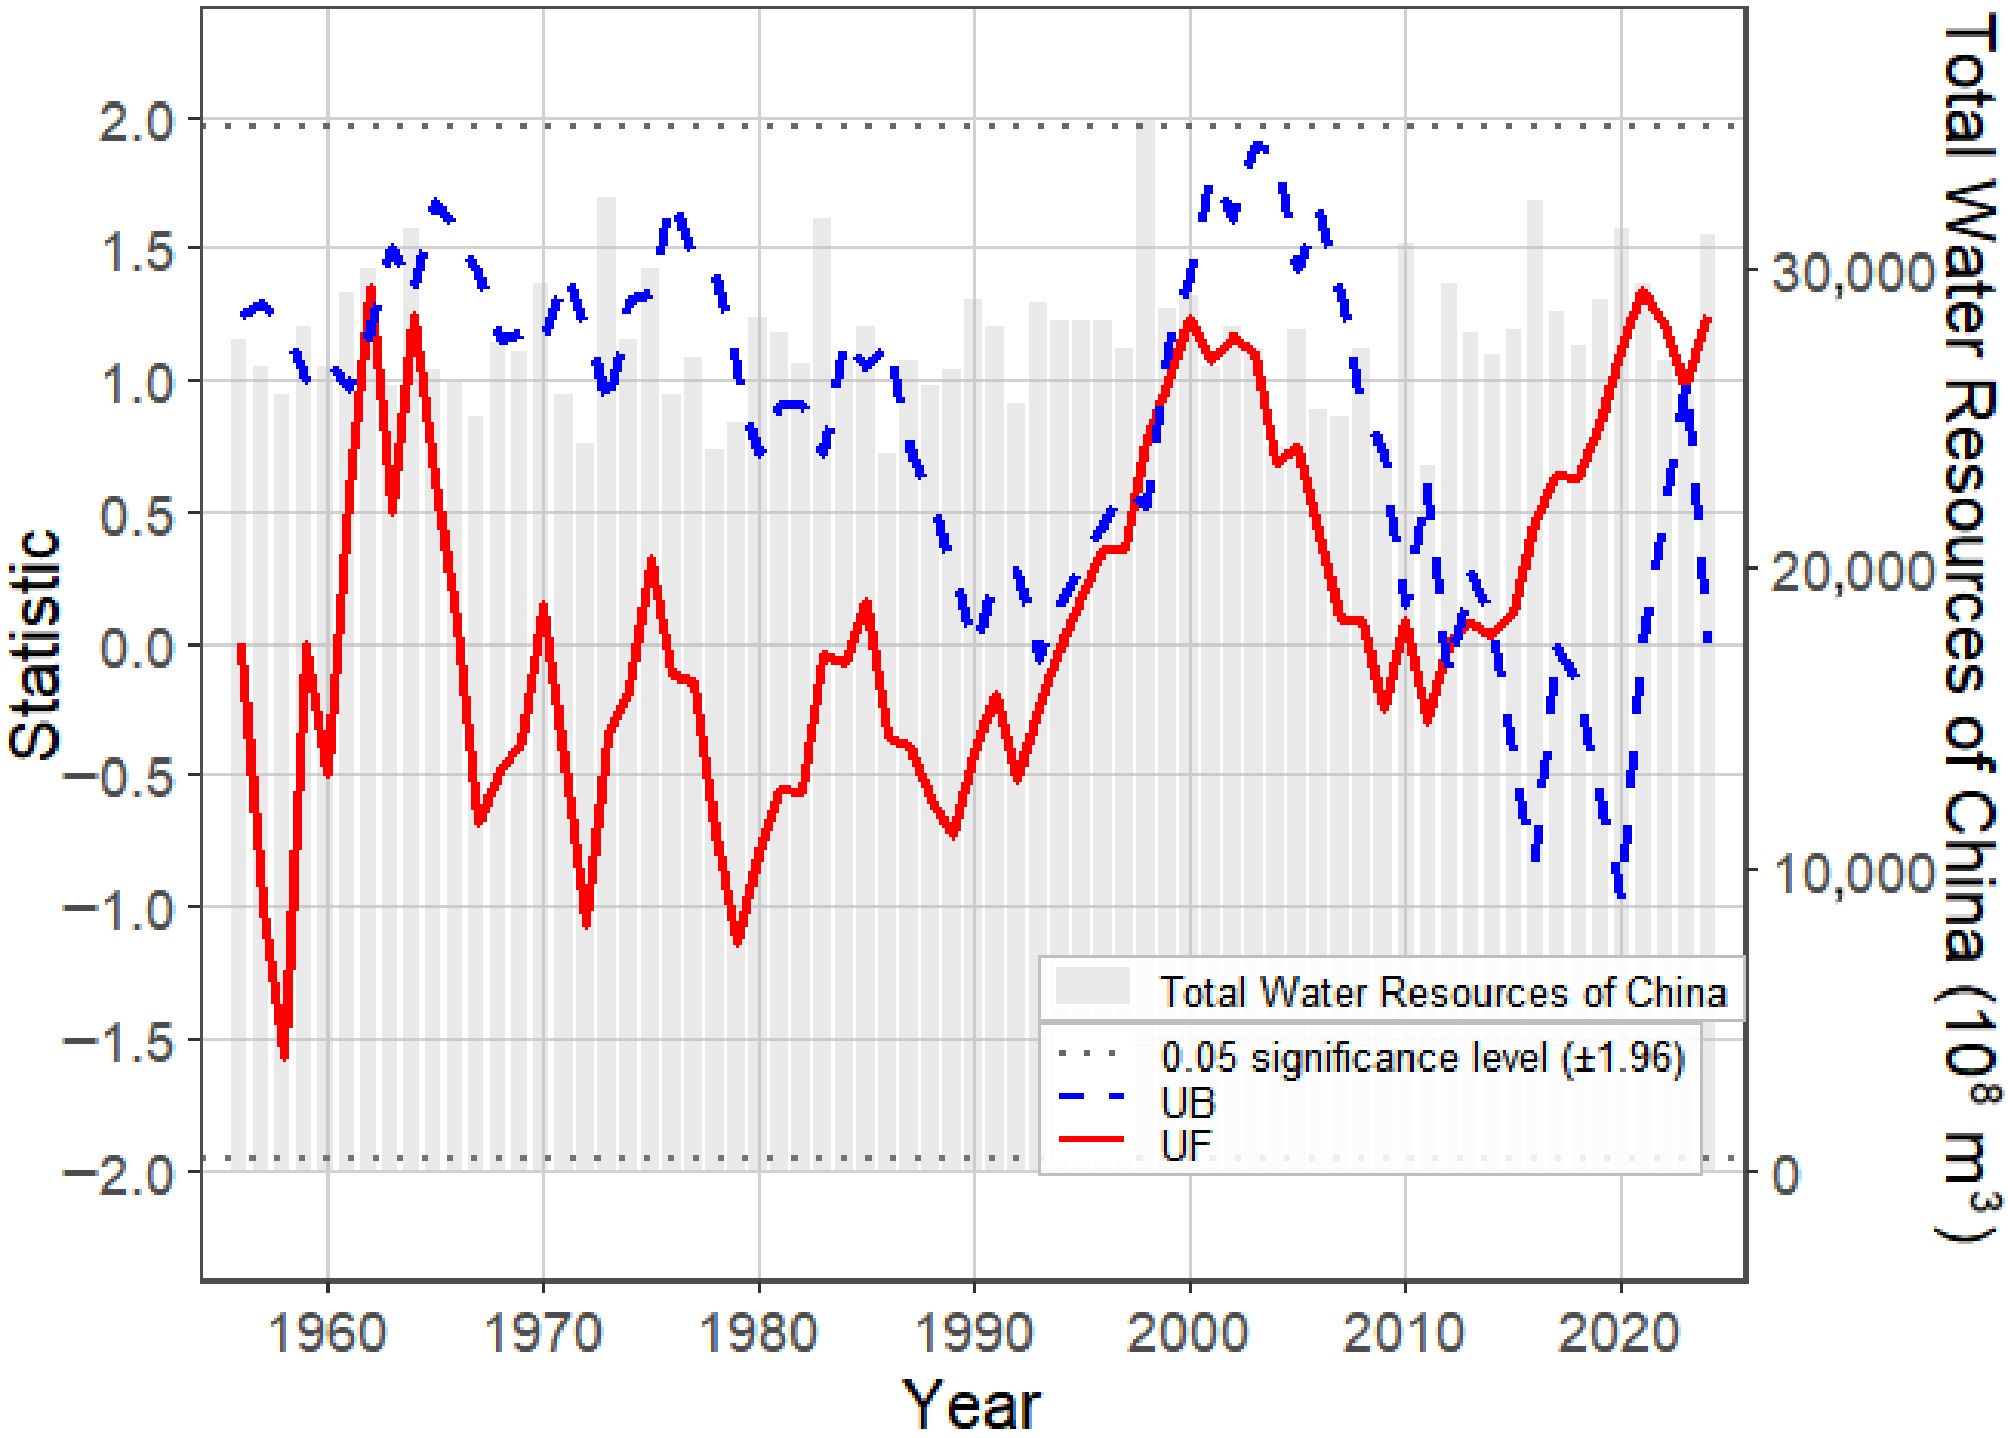
Figure 1.
Mann–Kendall mutation test of China's total water resources (1956–2024). Annual total water resources were compiled from the China Water Resources Bulletin and National water-resource statistics. No statistically significant abrupt change points (p > 0.05) were detected after 1978 or the implementation of the Grain-for-Green Program. This figure provides descriptive background on long-term national water-resource variability and should not be interpreted as direct evidence of causal effects of afforestation.
-
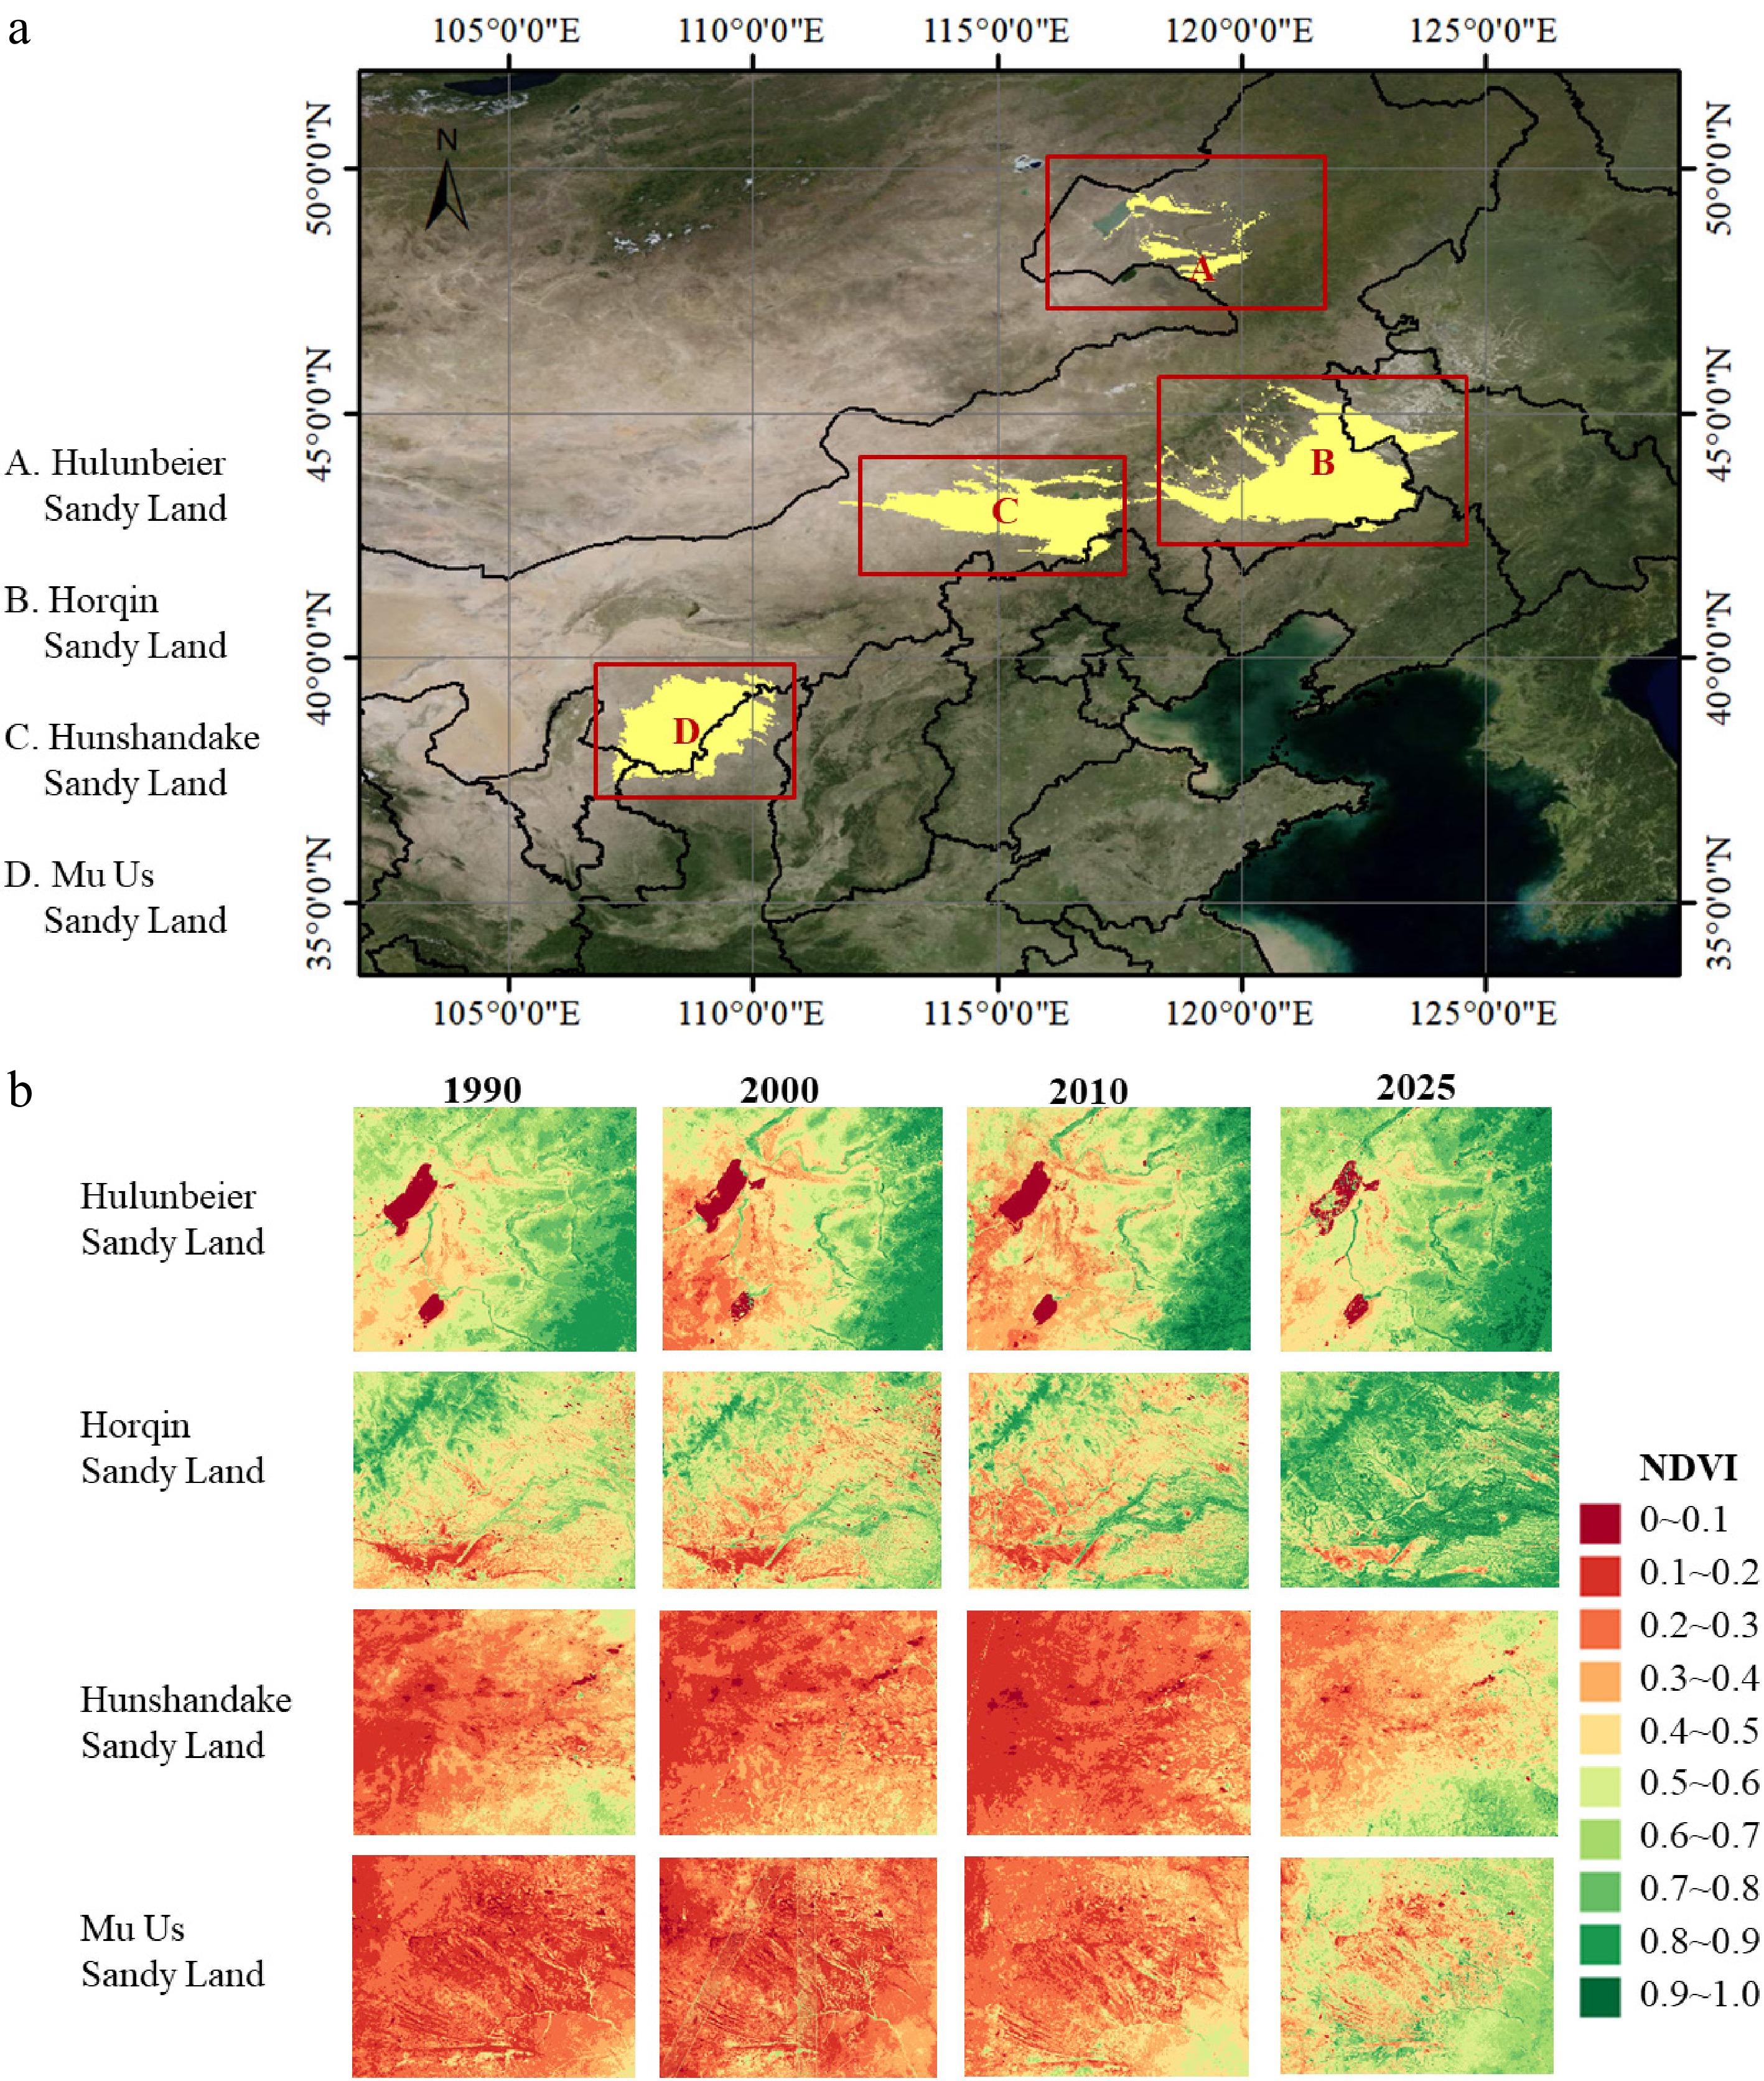
Figure 2.
(a) Locations of China's four major sandy lands and (b) NDVI values for the four sandy lands in 1990, 2000, 2010, and 2025. NDVI was calculated from Landsat surface reflectance products (USGS Collection 2 Tier 1 Level 2, 30 m resolution) using the standard (NIR − Red)/(NIR + Red) formula. For each target year, we used images from May to August and applied the maximum-value composite (MVC) to represent the peak vegetation condition.
-
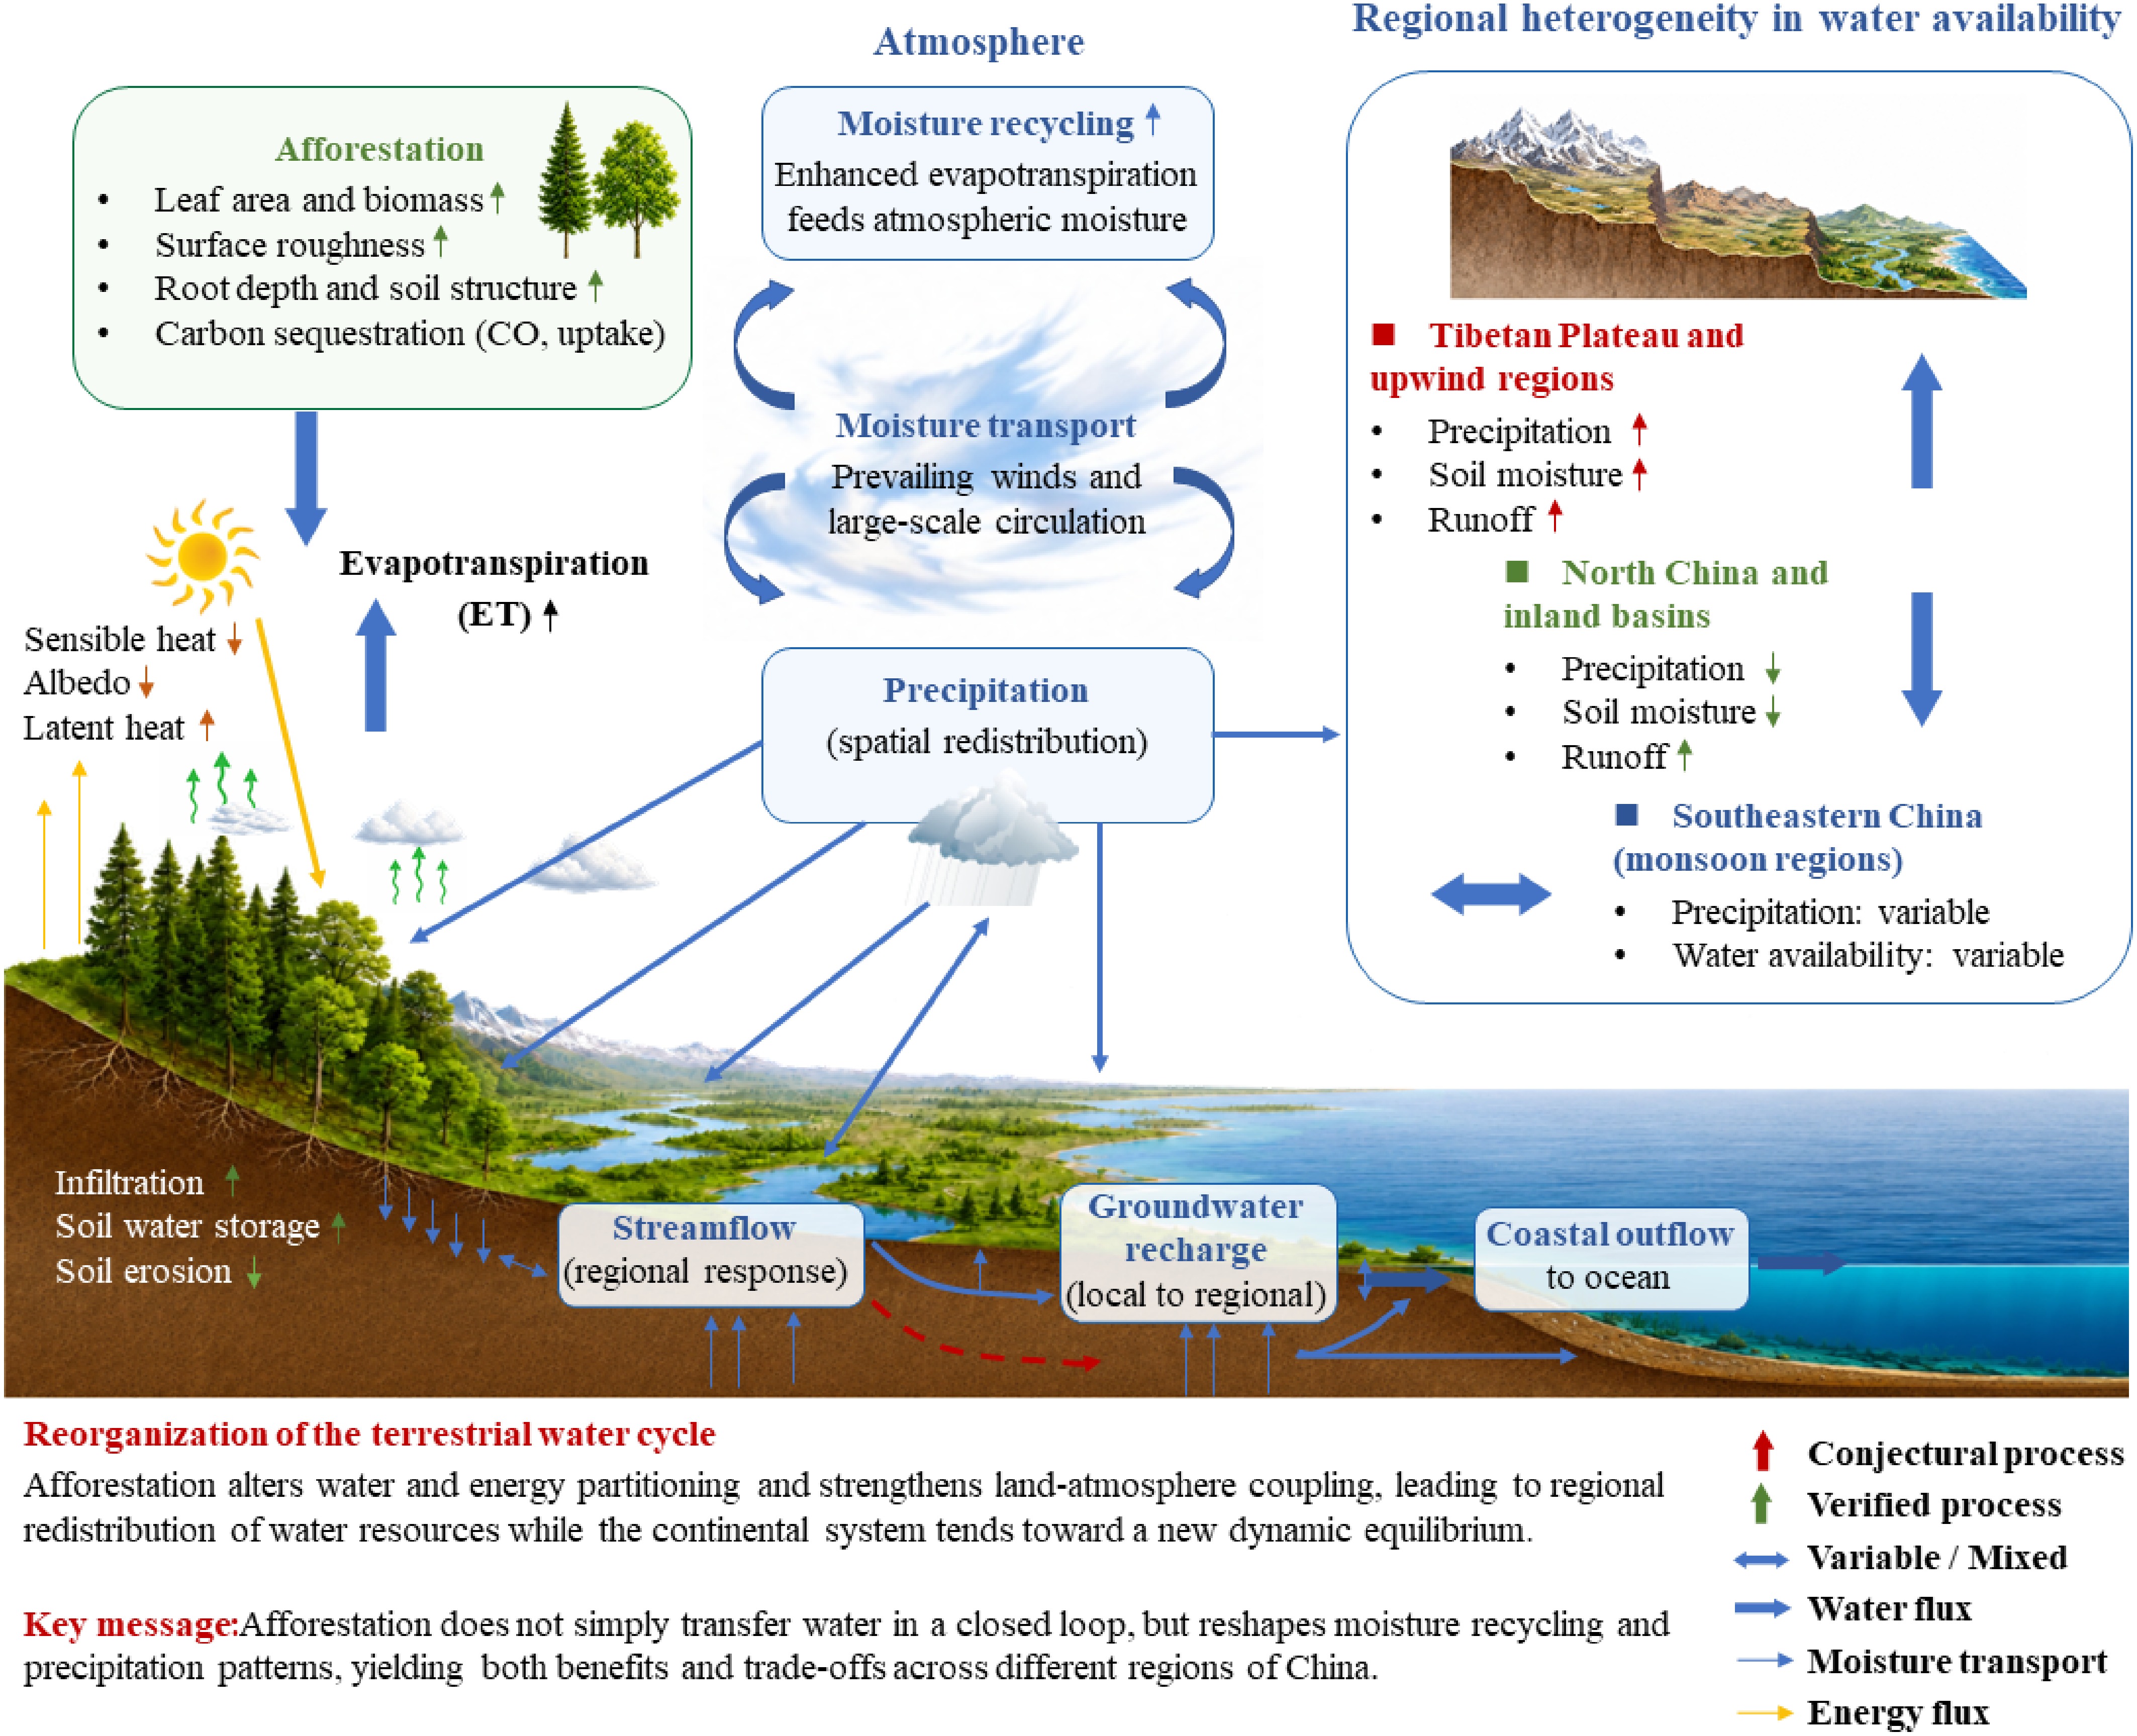
Figure 3.
Conceptual synthesis illustrating hypothesized pathways through which afforestation may influence terrestrial water cycling across China, via changes in moisture recycling, evapotranspiration, and hydrological redistribution. At local scales, there is evidence that afforestation can increase evapotranspiration, enhance land-atmosphere coupling, and promote infiltration and groundwater recharge. However, the broader regional-scale linkages, including changes in the spatial redistribution of precipitation and runoff and a potential shift toward a new dynamic equilibrium, remain hypothetical and require further quantitative attribution. These processes may contribute to regional heterogeneity in water availability, while a shift toward a new dynamic equilibrium remains hypothetical. Abbreviations: ET, evapotranspiration. Symbols: solid arrows indicate evidence-supported pathways; dashed arrows indicate hypothesized pathways that require quantitative attribution.
Figures
(3)
Tables
(0)