-
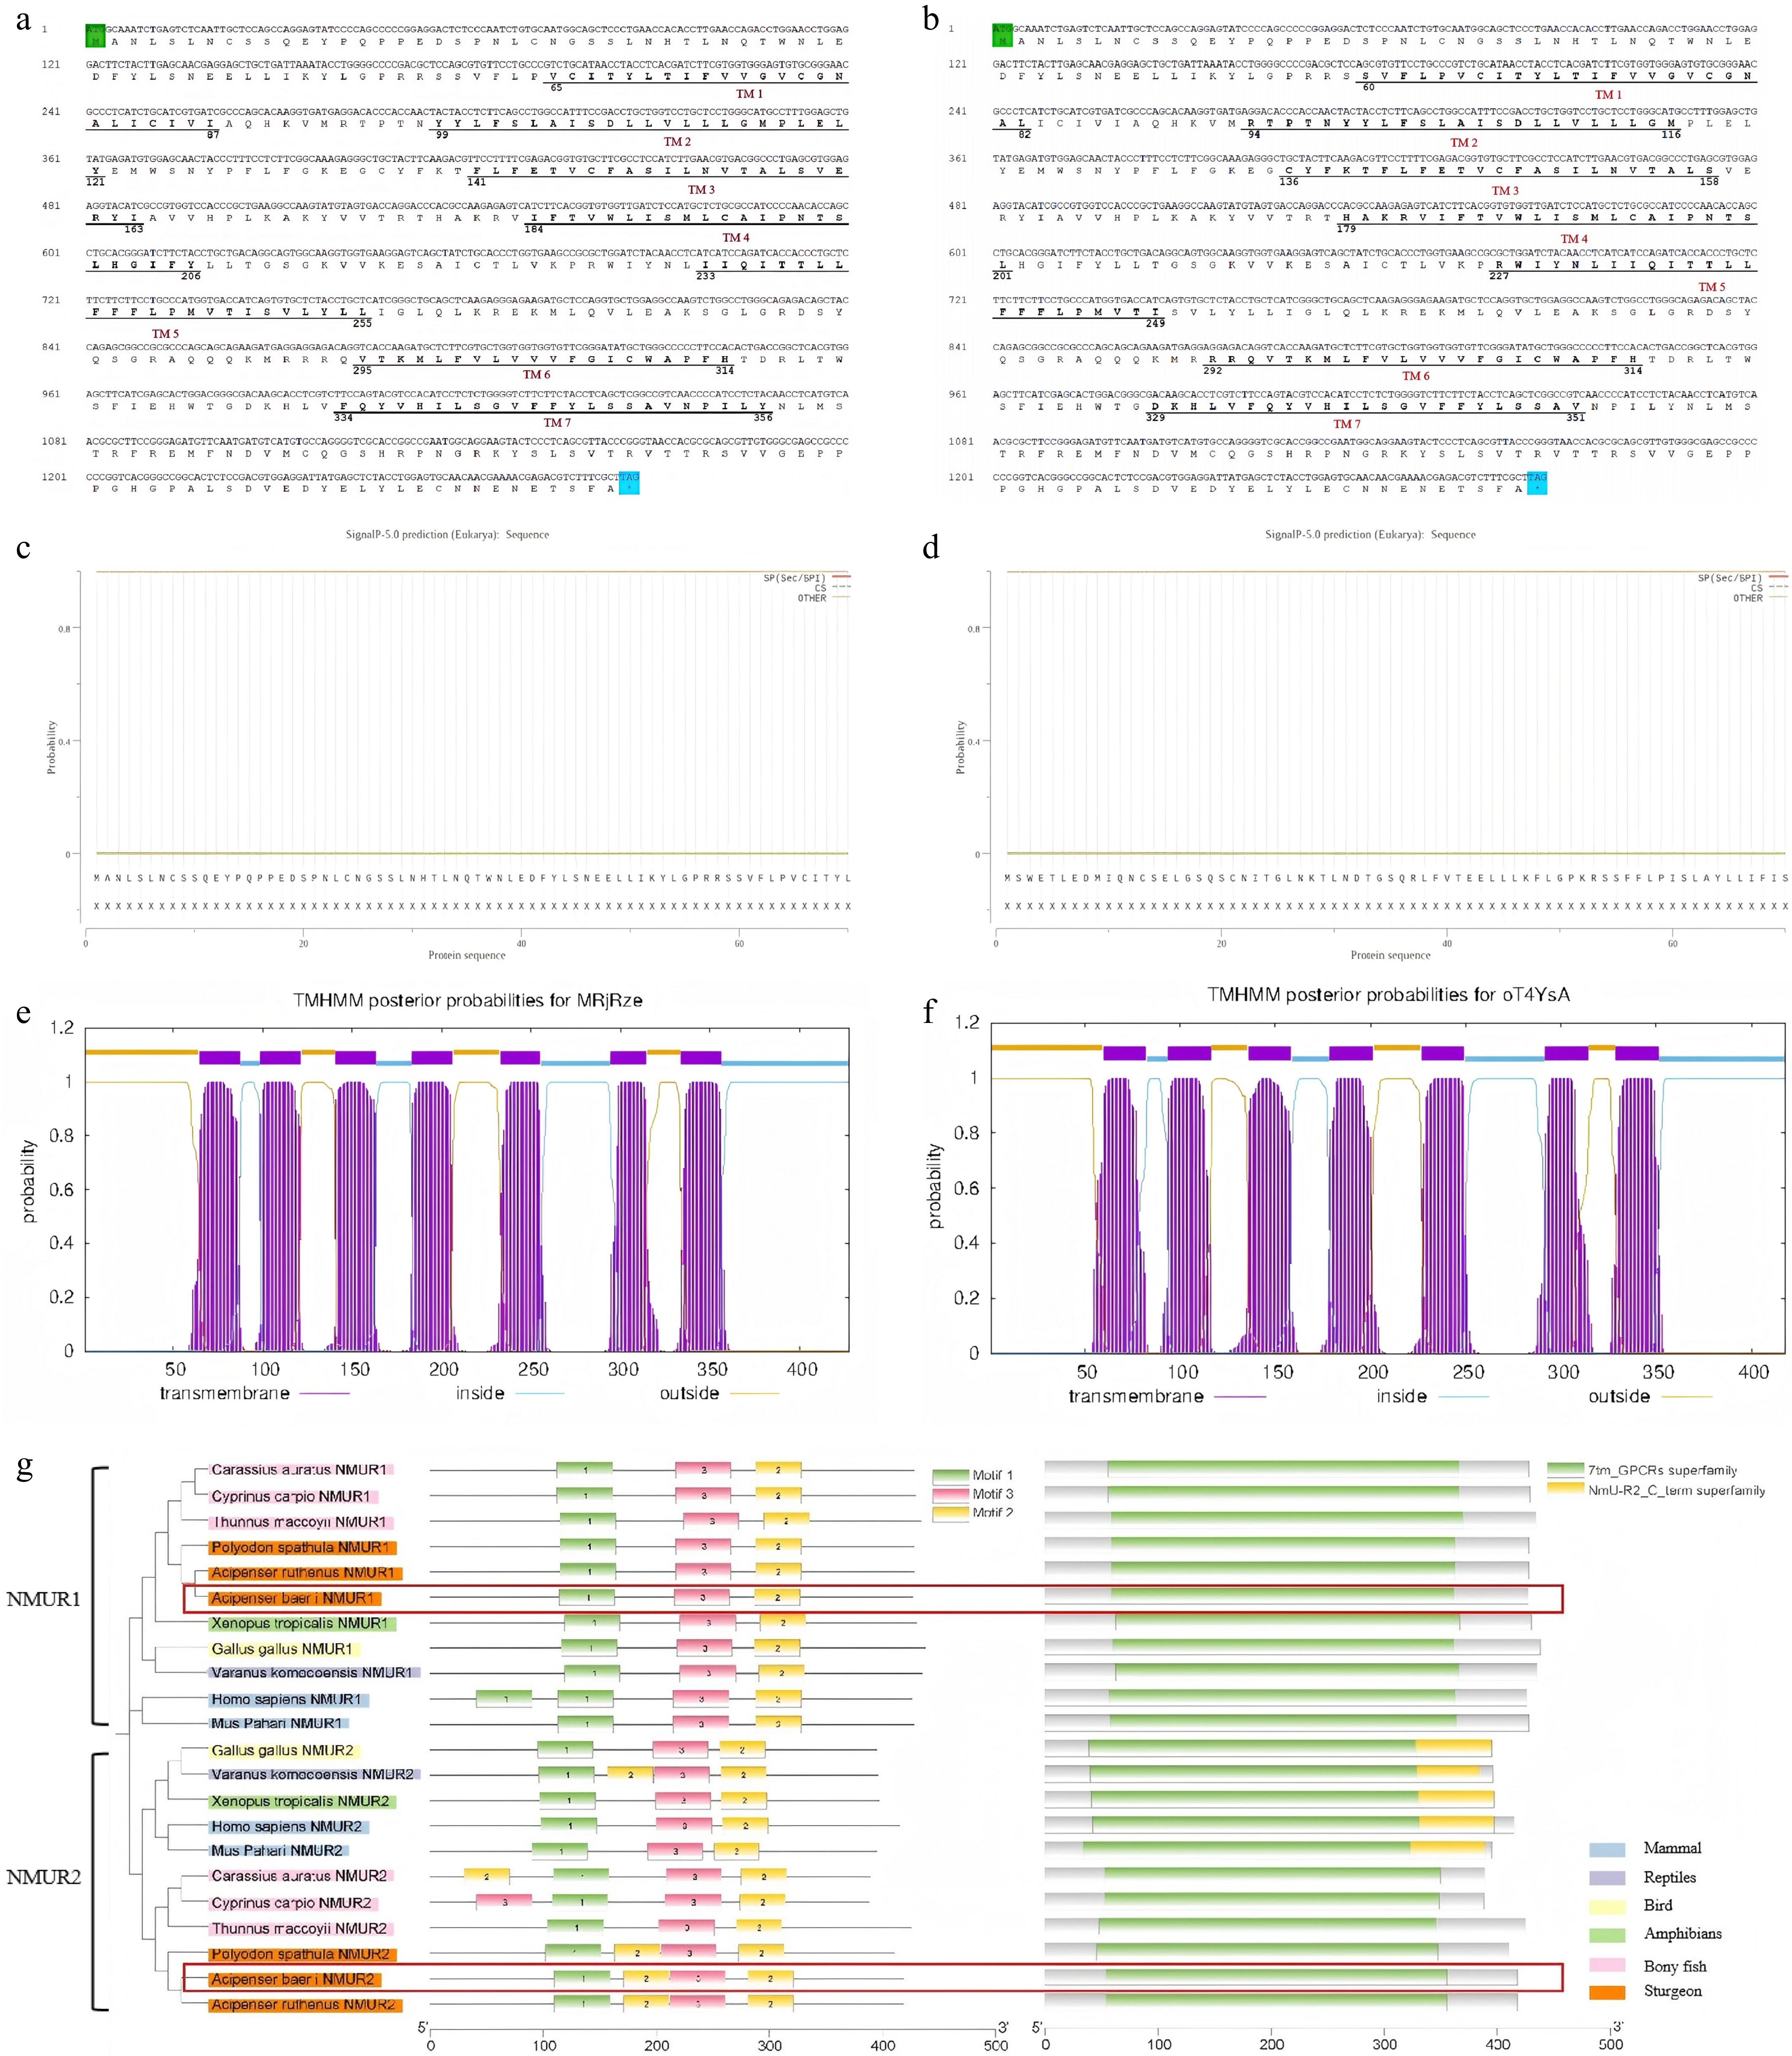
Figure 1.
Sequence analysis of nmr1 and nmur2 nucleotide sequences of Siberian sturgeon. Comparative nucleotide-amino acid map of (a) nmur1 and (b) nmur2. Signal peptide prediction of (c) NMUR1 and (d) NMUR2. Transmembrane domain (TMD) prediction of (e) NMUR1 and (f) NMUR2. (g) TMD analysis of NMUR1 and NMUR2 in Siberian sturgeon. The green shaded region and the blue shaded region indicate the initiator codon and the termination codon, respectively, while the putative seven transmembrane domains (TM1–TM7) are indicated by horizontal bars. Figures represent the start and end sites of the TMDs.
-
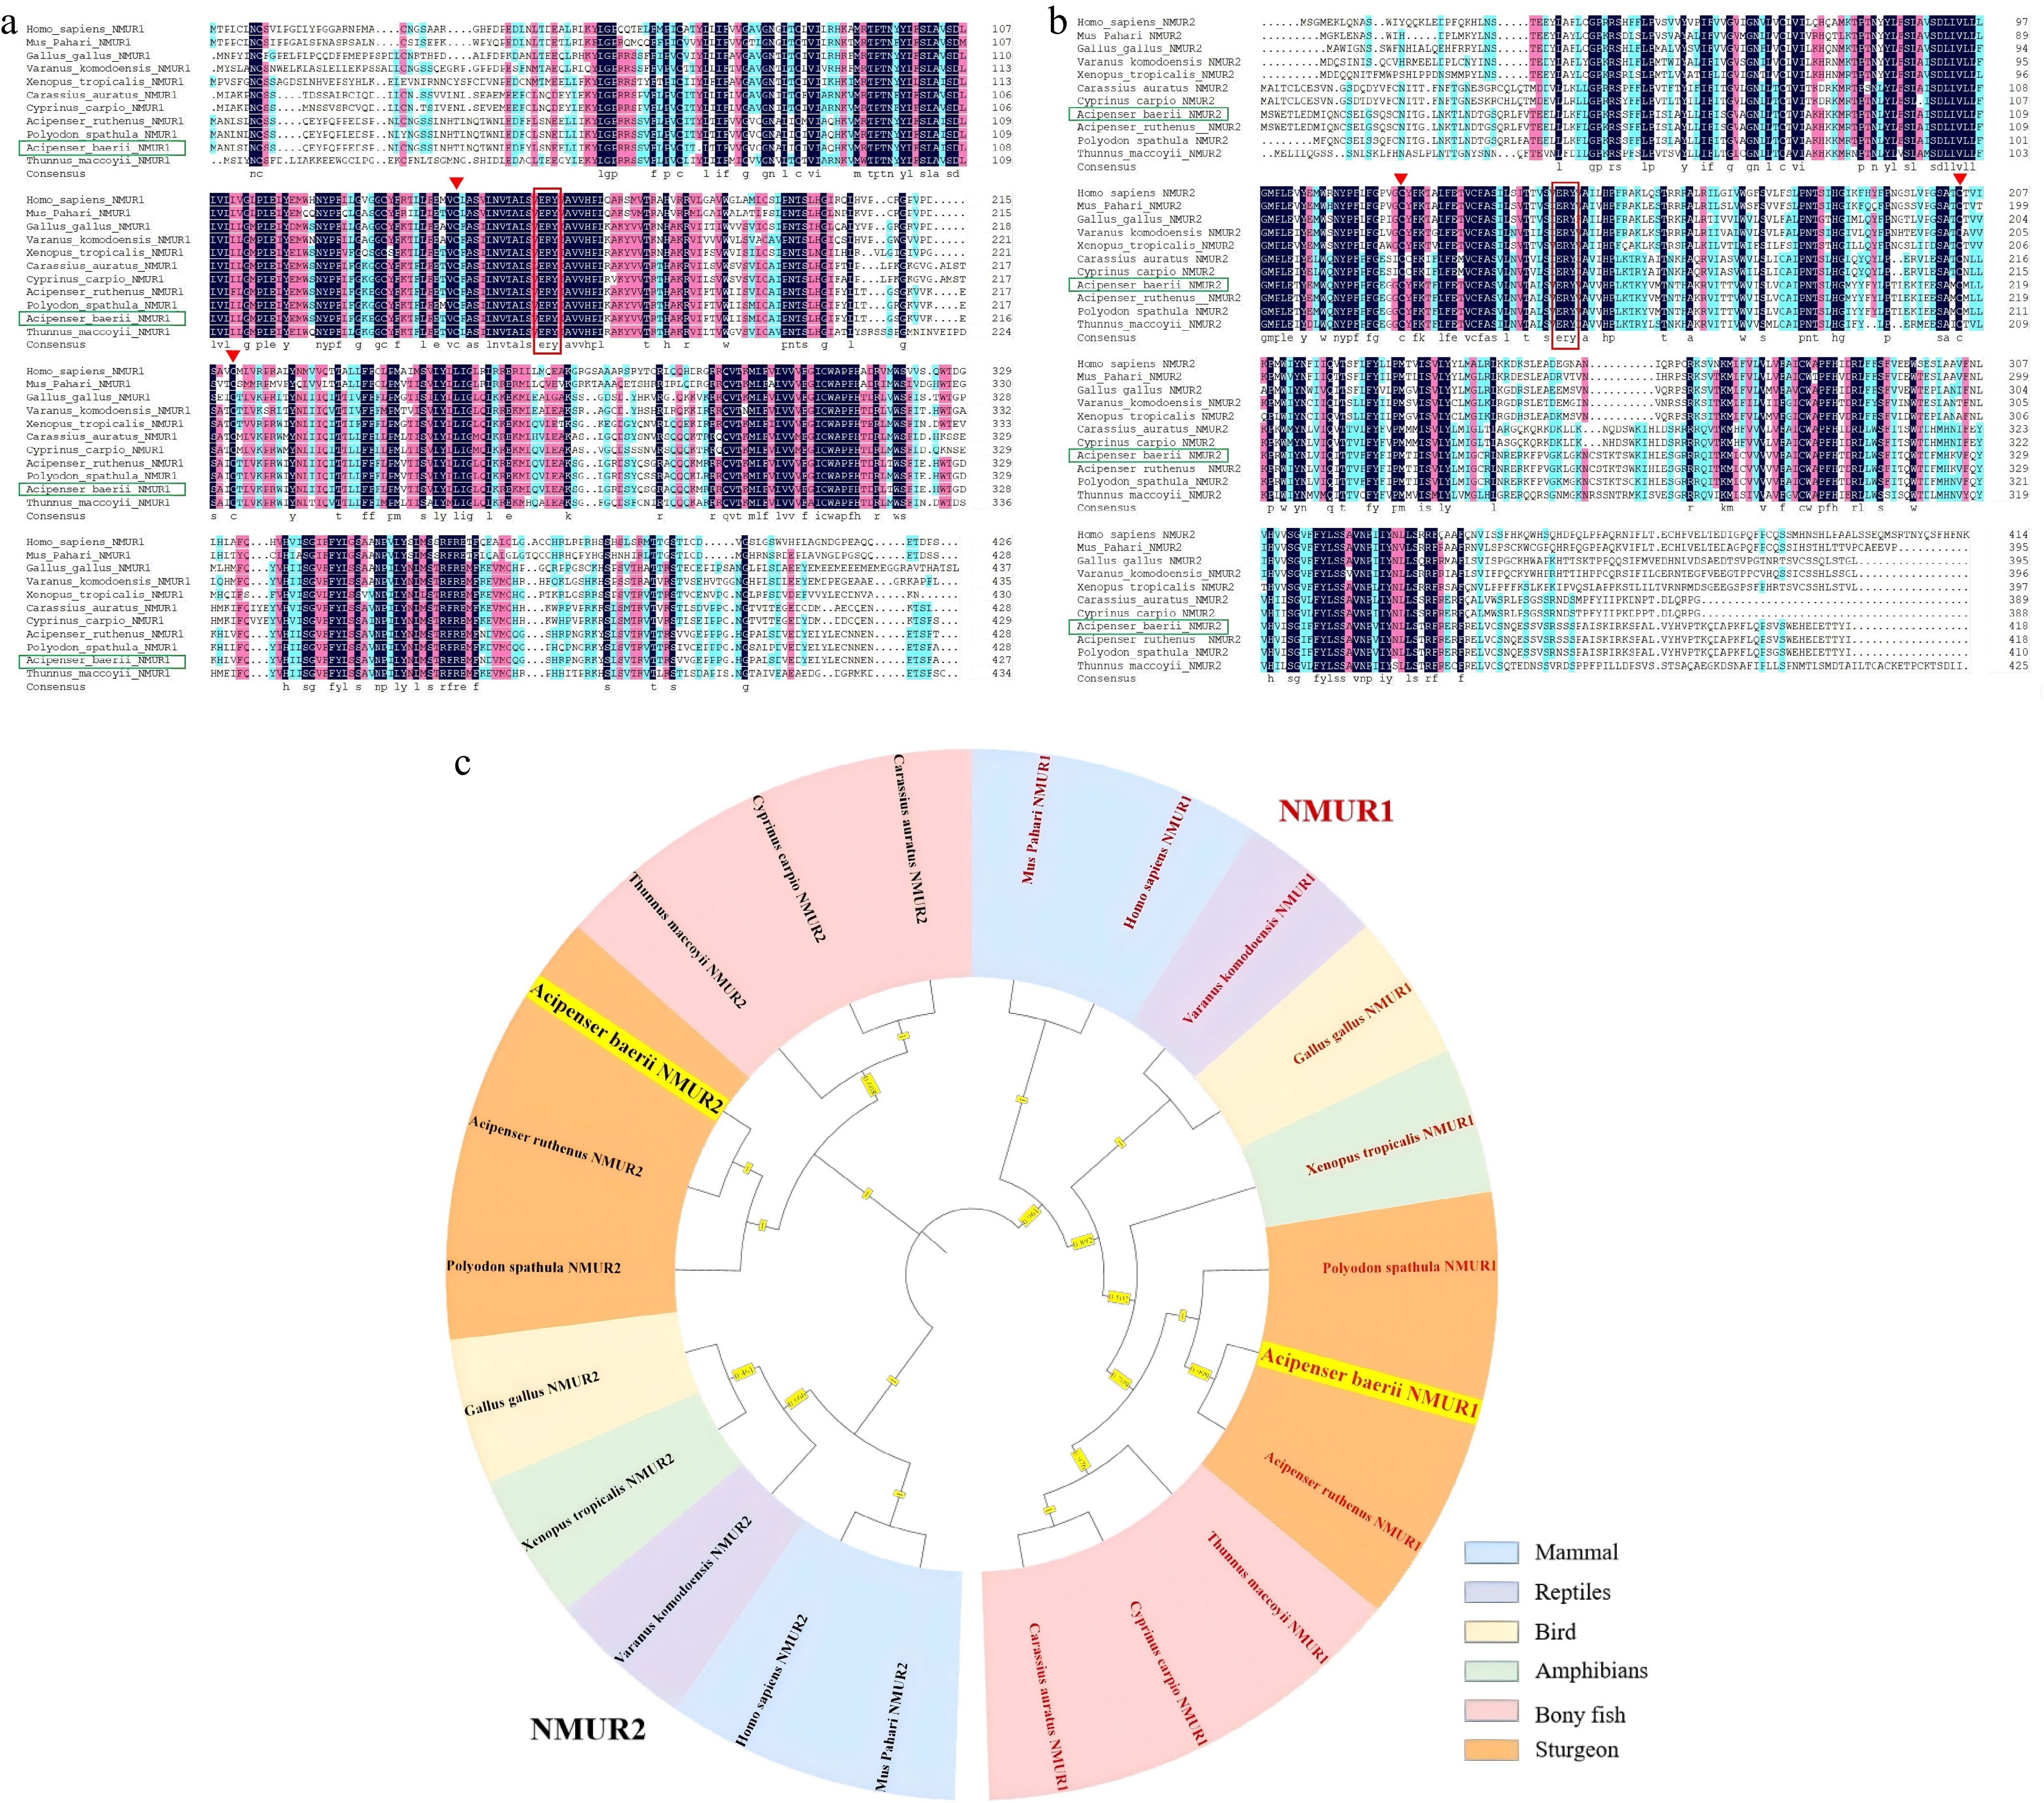
Figure 2.
Differences of NMUR1 and NMUR2 among different species. Amino acid sequence alignment of Siberian sturgeon (a) NMUR1 and (b) NMUR2 with other vertebrates. The ERY motifs are indicated in red boxes. Conserved cysteine residues are indicated by triangles. Identity: black (100%), red (75%), blue (50%). (c) Phylogenetic analysis of NMUR1 and NMUR2 in vertebrates. The phylogenetic tree was constructed using MEGA 5 and the maximum likelihood method. Data were resampled by 1,000 bootstrap replicates. Human (Homo sapiens NMUR1: NP_006047.3, NMUR2: NP_064552.3), Mouse (Mus Pahari NMUR1: XP_021054936.1, NMUR2: XP_021069648.1), Chicken (Gallus gallus NMUR1: NP_001305365.1, NMUR2: NP_001305366.1), Komodo dragon (Varanus komodoensis NMUR1: XP_044312154.1, NMUR2: XP_044306959.1), Bufonid (Xenopus tropicalis NMUR1: XP_002937396.1, NMUR2: XP_002940961.1), Goldfish (Carassius auratus NMUR1: XP_026054730.1, NMUR2: XP_026117111.1), Sterlet (Acipenser ruthenus NMUR1: XP_033893944.2, NMUR2: XP_058849317.1), Mississippi paddlefish (Polyodon spathula NMUR1: XP_041120650.1, NMUR2: XP_041130621.1), Southern Bluefin Tuna (Thunnus maccoyii NMUR1: NMUR2: XP_042258388.1).
-
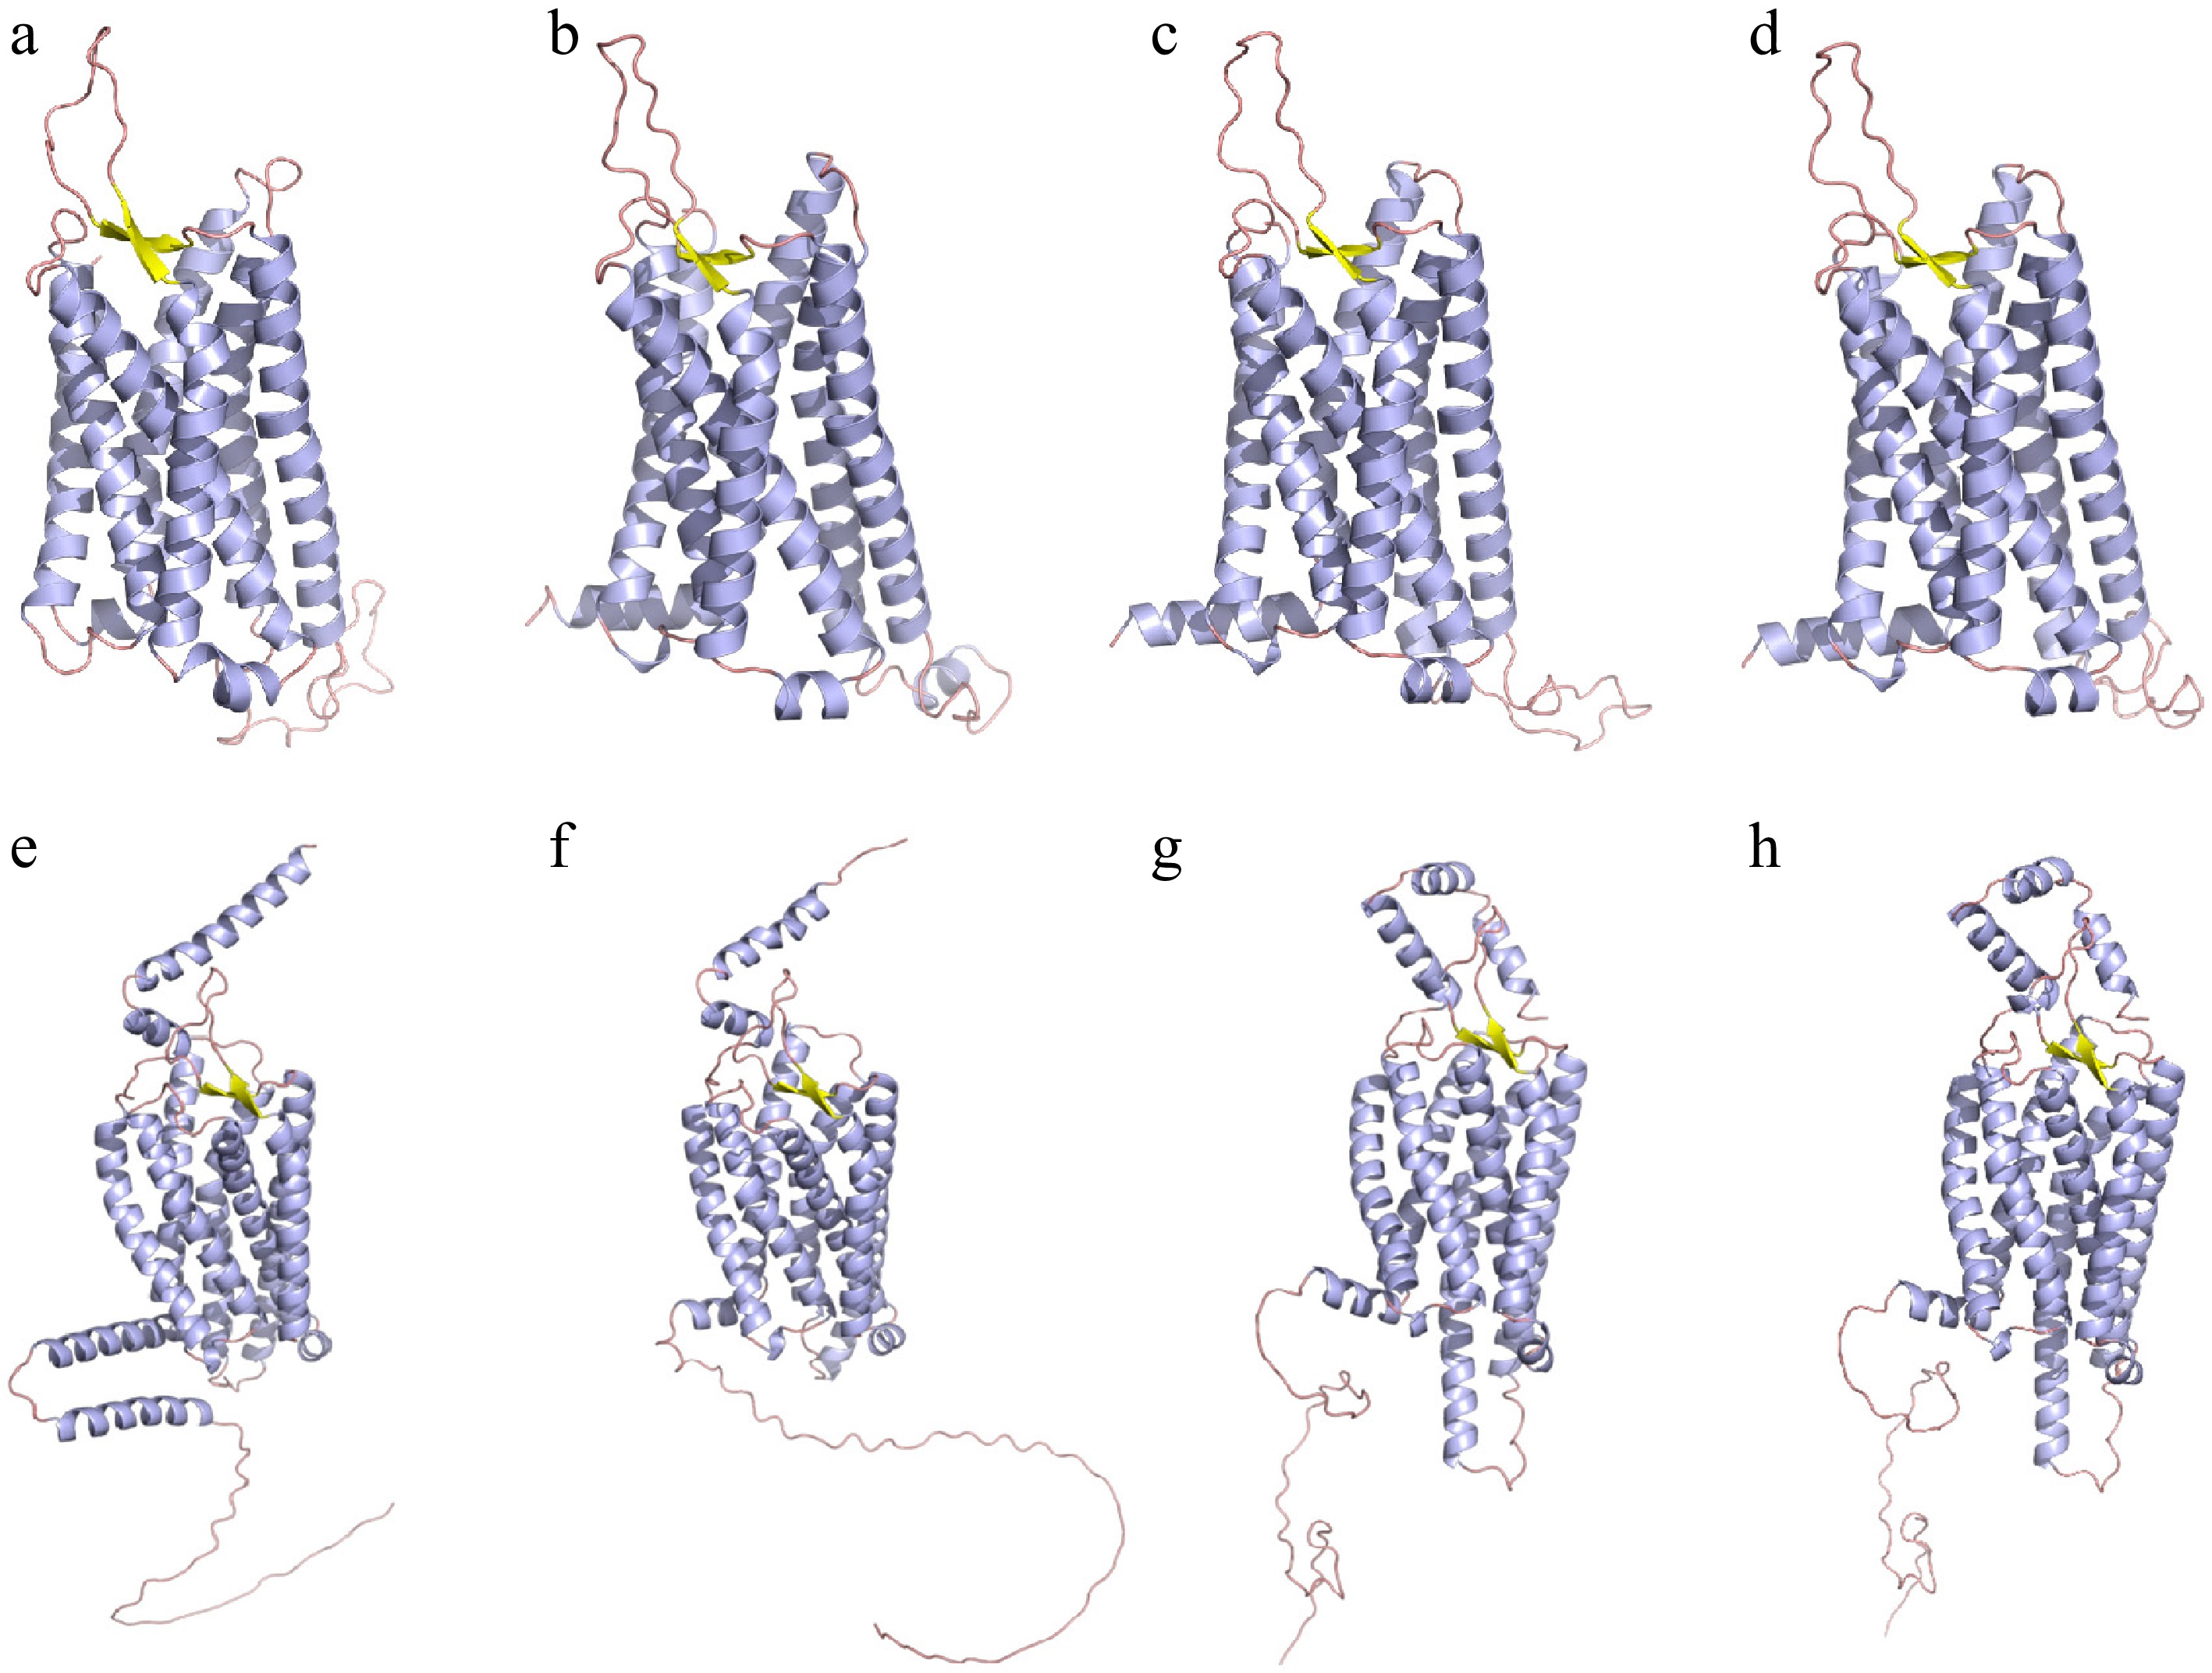
Figure 3.
The prediction of protein tertiary structure of (a)–(d) NMUR1 and (e), (f) NMUR2. (a) Homo sapiens - NMUR1, (b) Gallus gallus - NMUR1, (c) Acipenser baerii - NMUR1, (d) Acipenser ruthenus - NMUR1. (e) Homo sapiens - NMUR2, (f) Gallus gallus - NMUR2, (g) Acipenser baerii - NMUR2, (h) Acipenser ruthenus - NMUR2. The α-helices, β-Sheet and loop are depicted by purple, yellow and orange ribbons, respectively.
-
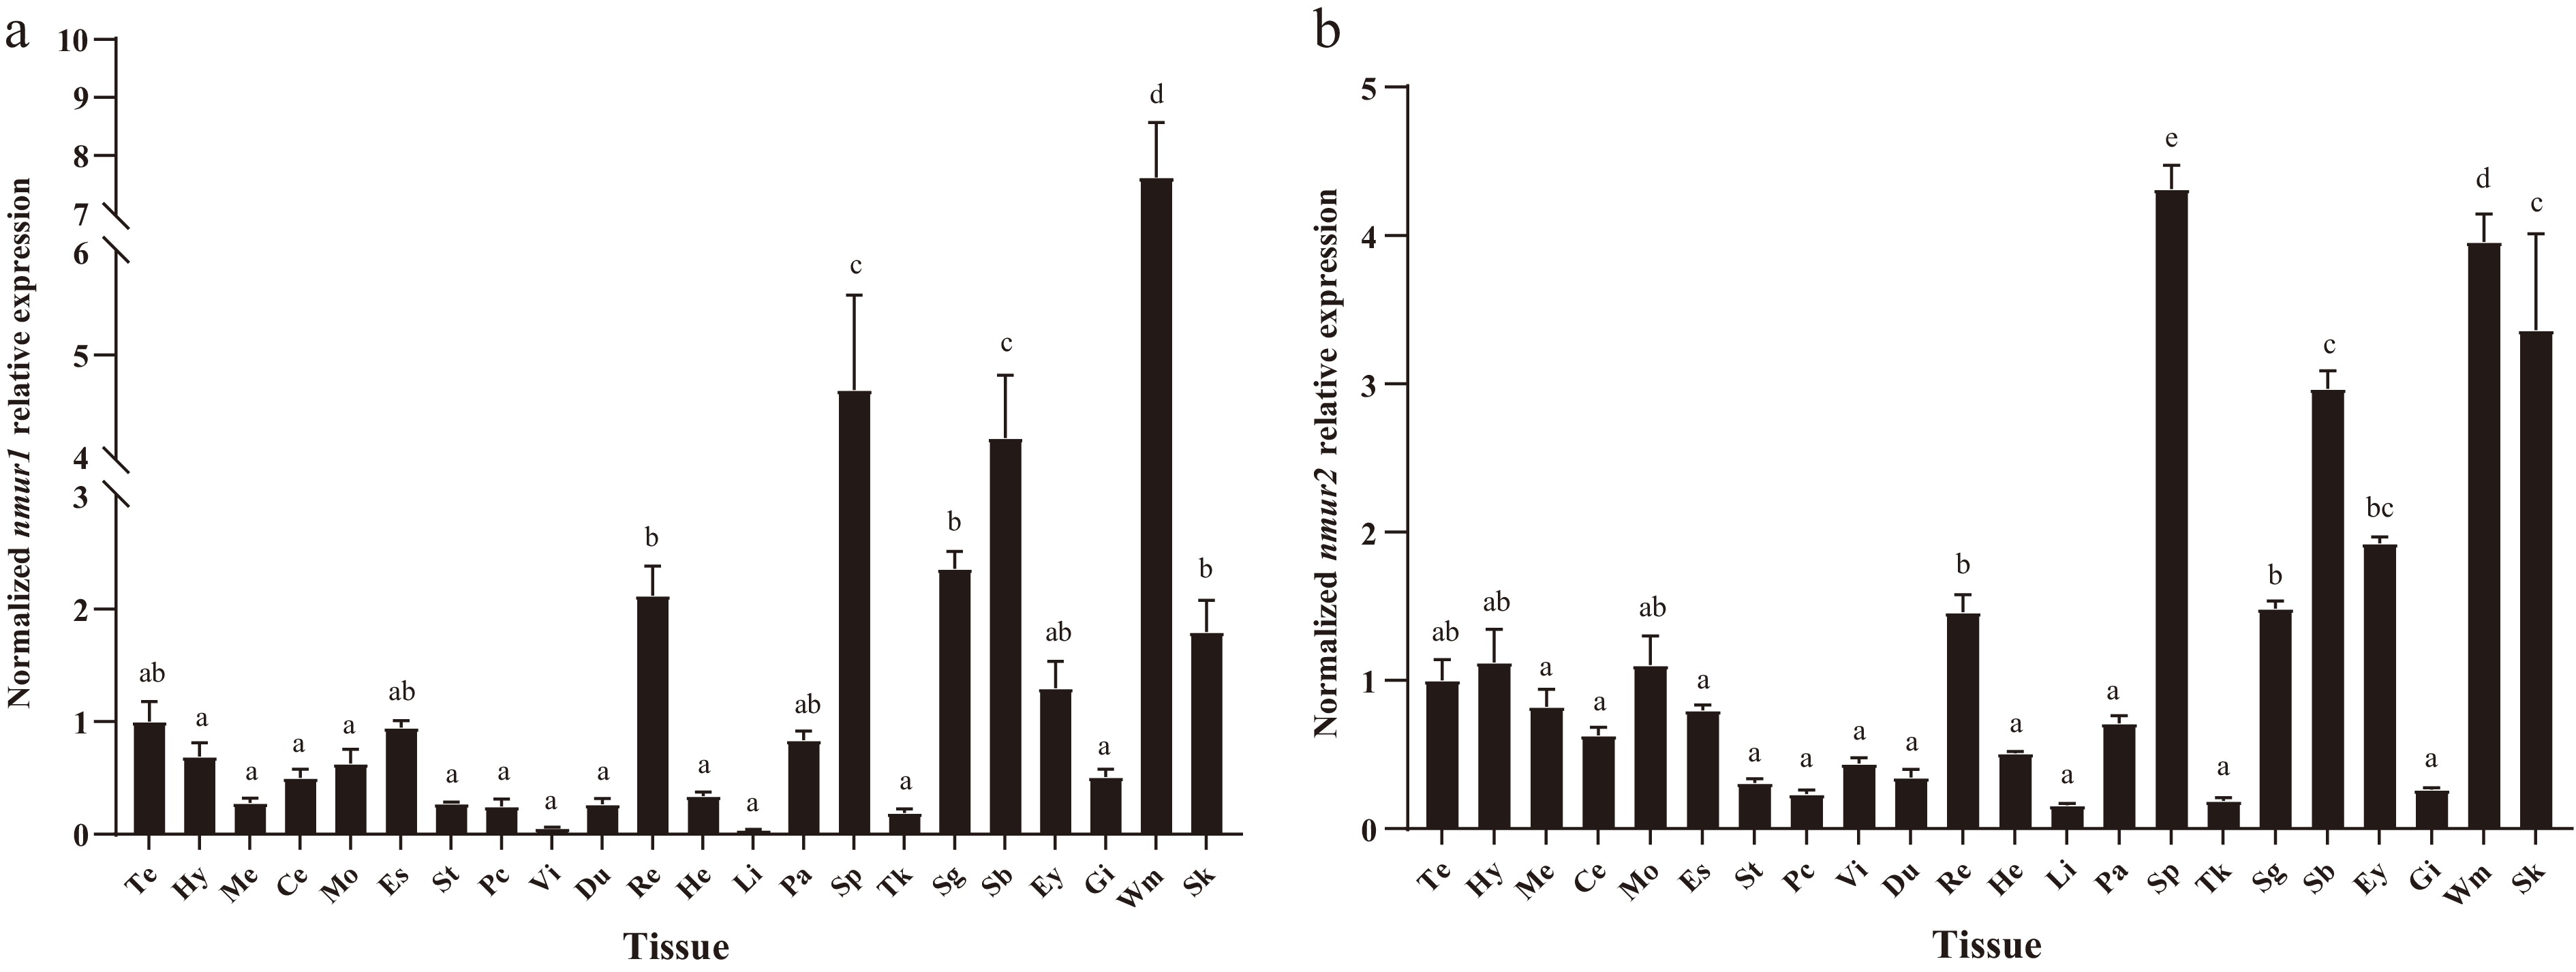
Figure 4.
Tissue distribution of (a) nmur1 and (b) nmur2 mRNA in Siberian sturgeon. The results were expressed as relative expression levels normalised to β-actin and GAPDH levels. Te: Telencephalon, Hy: Hypothalamus, Me: Mesencephalon, Ce: Cerebellum, Mo: Medulla oblongata, Es: Esophagus, St: Stomach, Pc: Pyloric caeca, Vi: Spiral valve intestine, Du: Duodenum, Re: Rectum, He: Heart, Li: Liver, Pa: Pancreas, Sp: Spleen, Tk: Trunk kidney, Sg: Sexual gland, Sb: Swim bladder, Ey: Eye, Gi: Gill, Wm: Muscle, Sk: Skin. Data are presented as mean ± SEM, n = 6 per tissue. Different letter above the bars indicates statistically significant differences ( p < 0.05, One-way ANOVA).
-
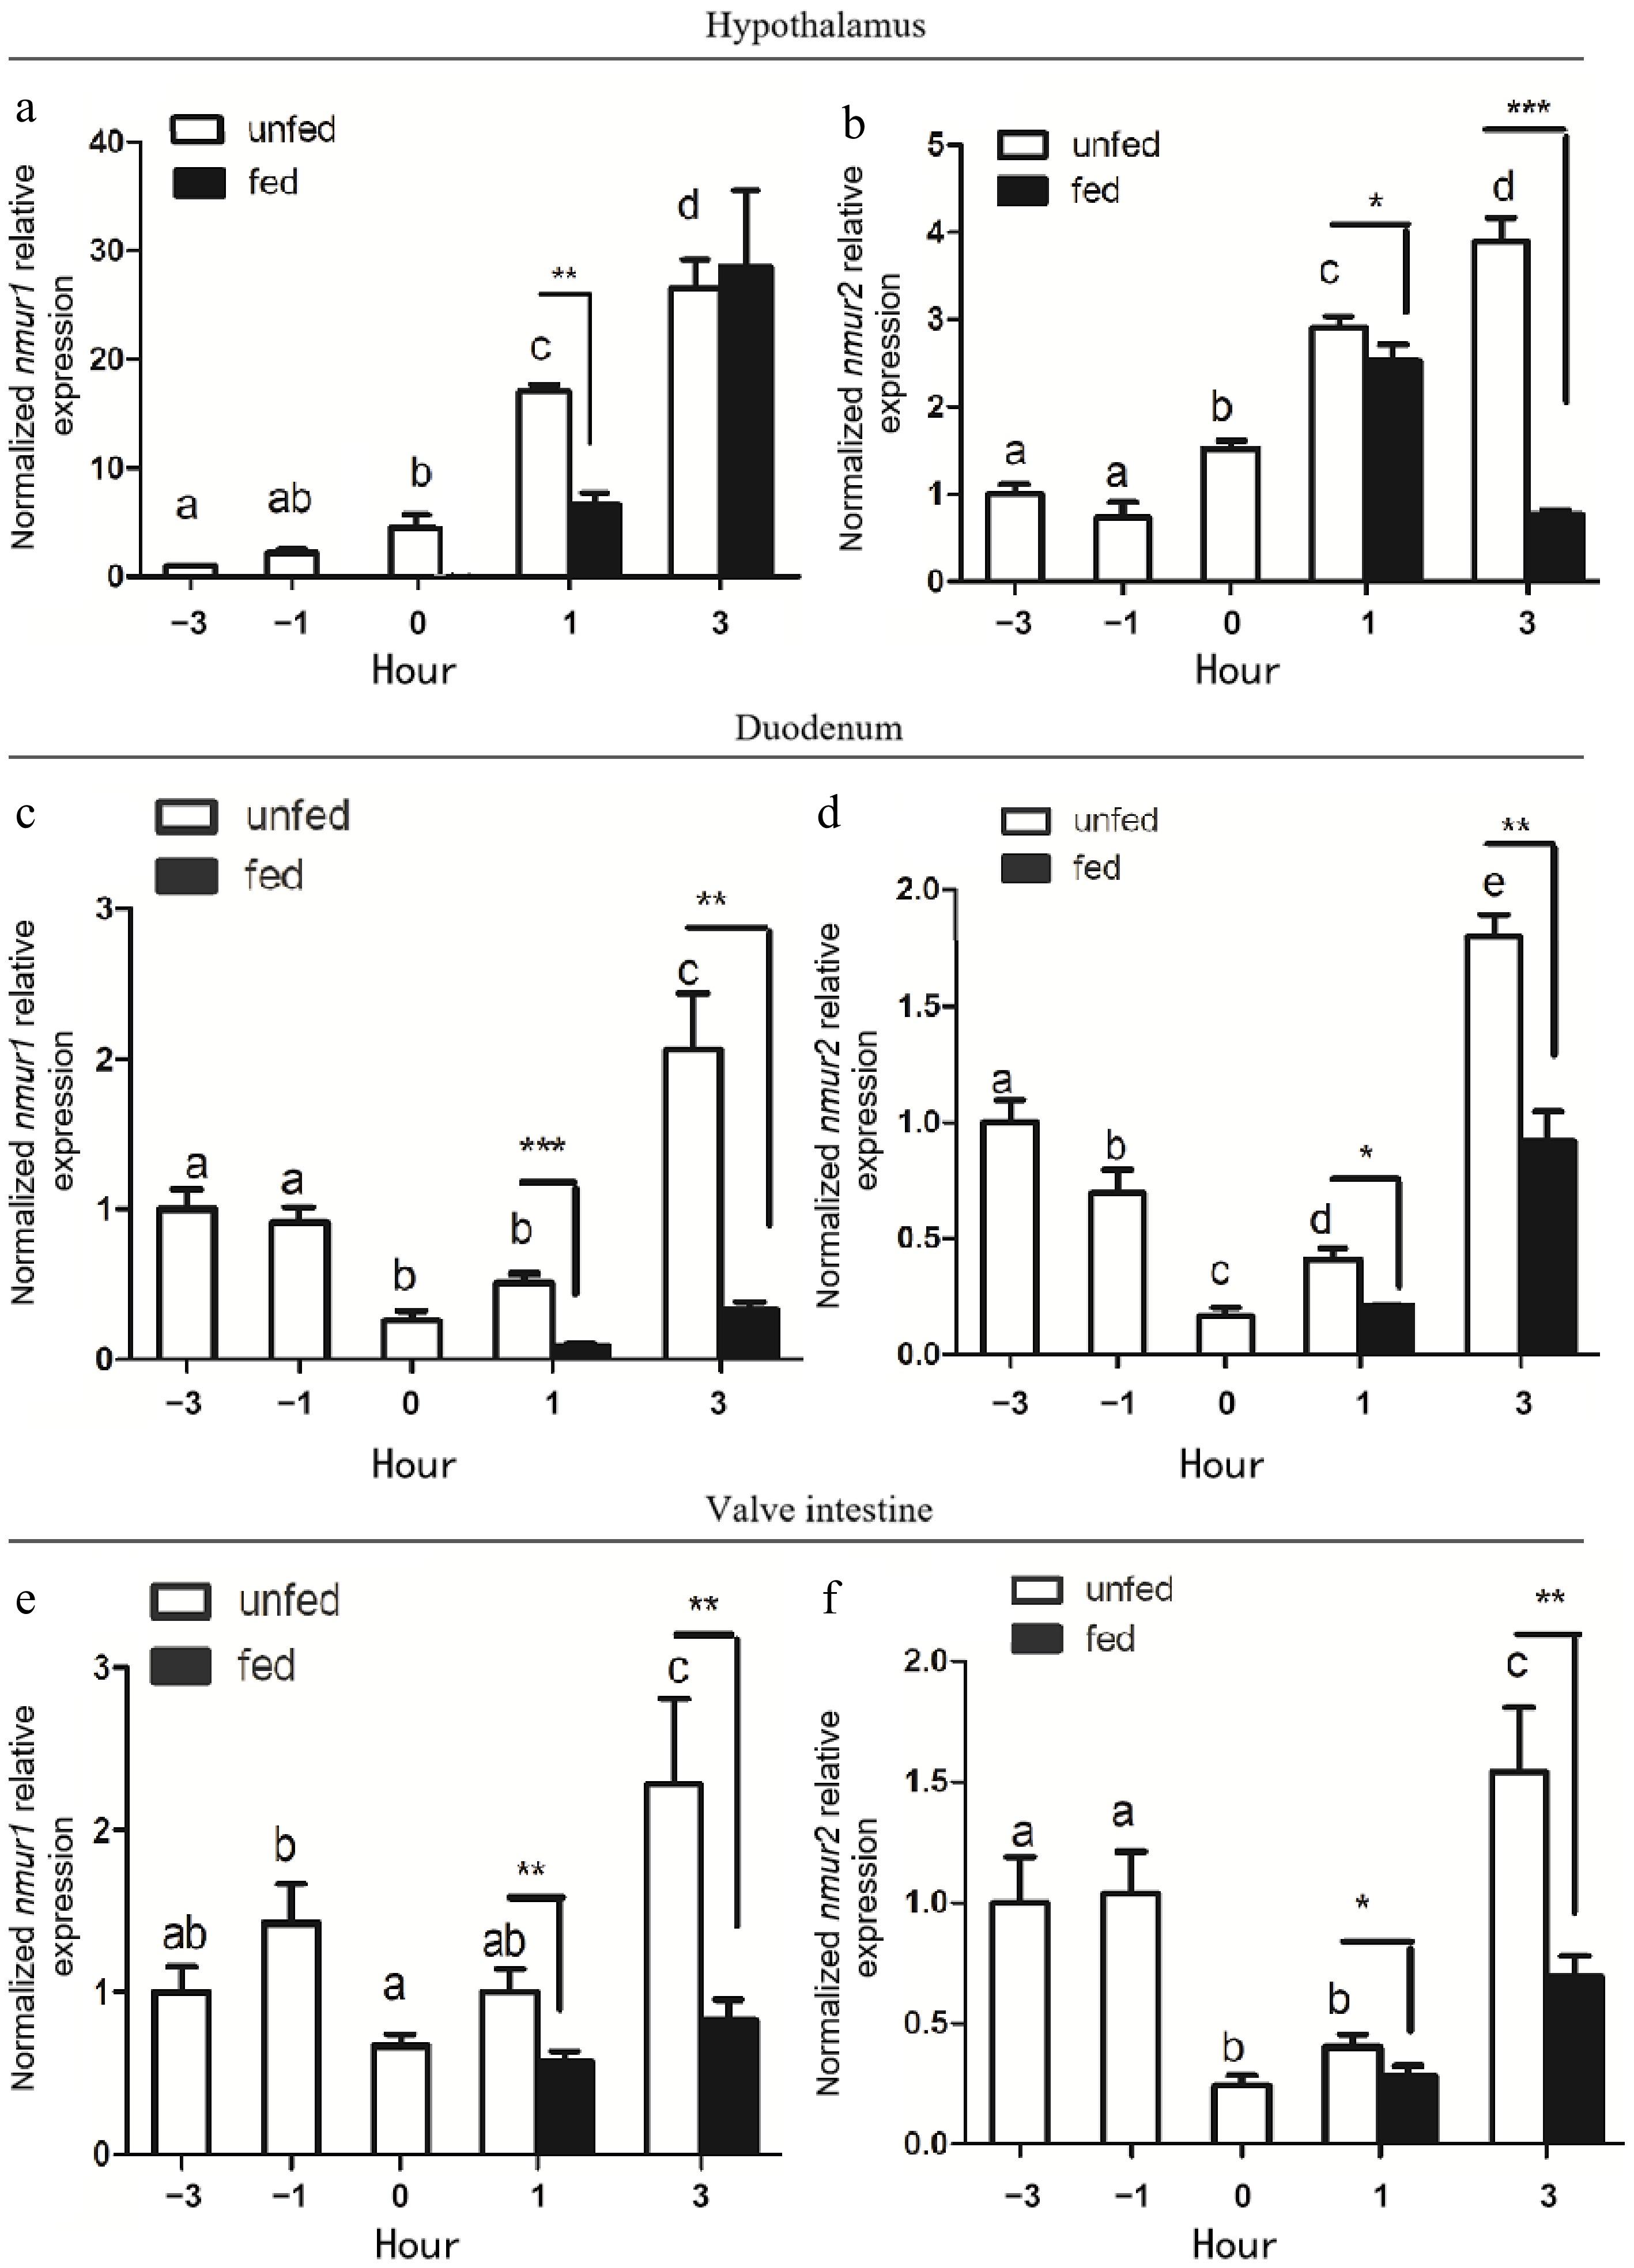
Figure 5.
Pre-prandial changes in the expression of (a), (c), (e) nmur1 and (b), (d), (f) nmur2 mRNA in (a), (b) the hypothalamus, (c), (d) duodenum, and (e), (f) valve intestine of Siberian Sturgeon. Data are presented as mean + SEM, n = 9. The results were expressed as relative expression levels normalized to β-actin and GAPDH levels. Bars with different letters represent significant differences between unfed groups (p < 0.05, One-way ANOVA). Asterisks represent significant differences between fed and unfed groups at a set time (* p < 0.05, ** p < 0.01, *** p < 0.001; Student's t-test).
-
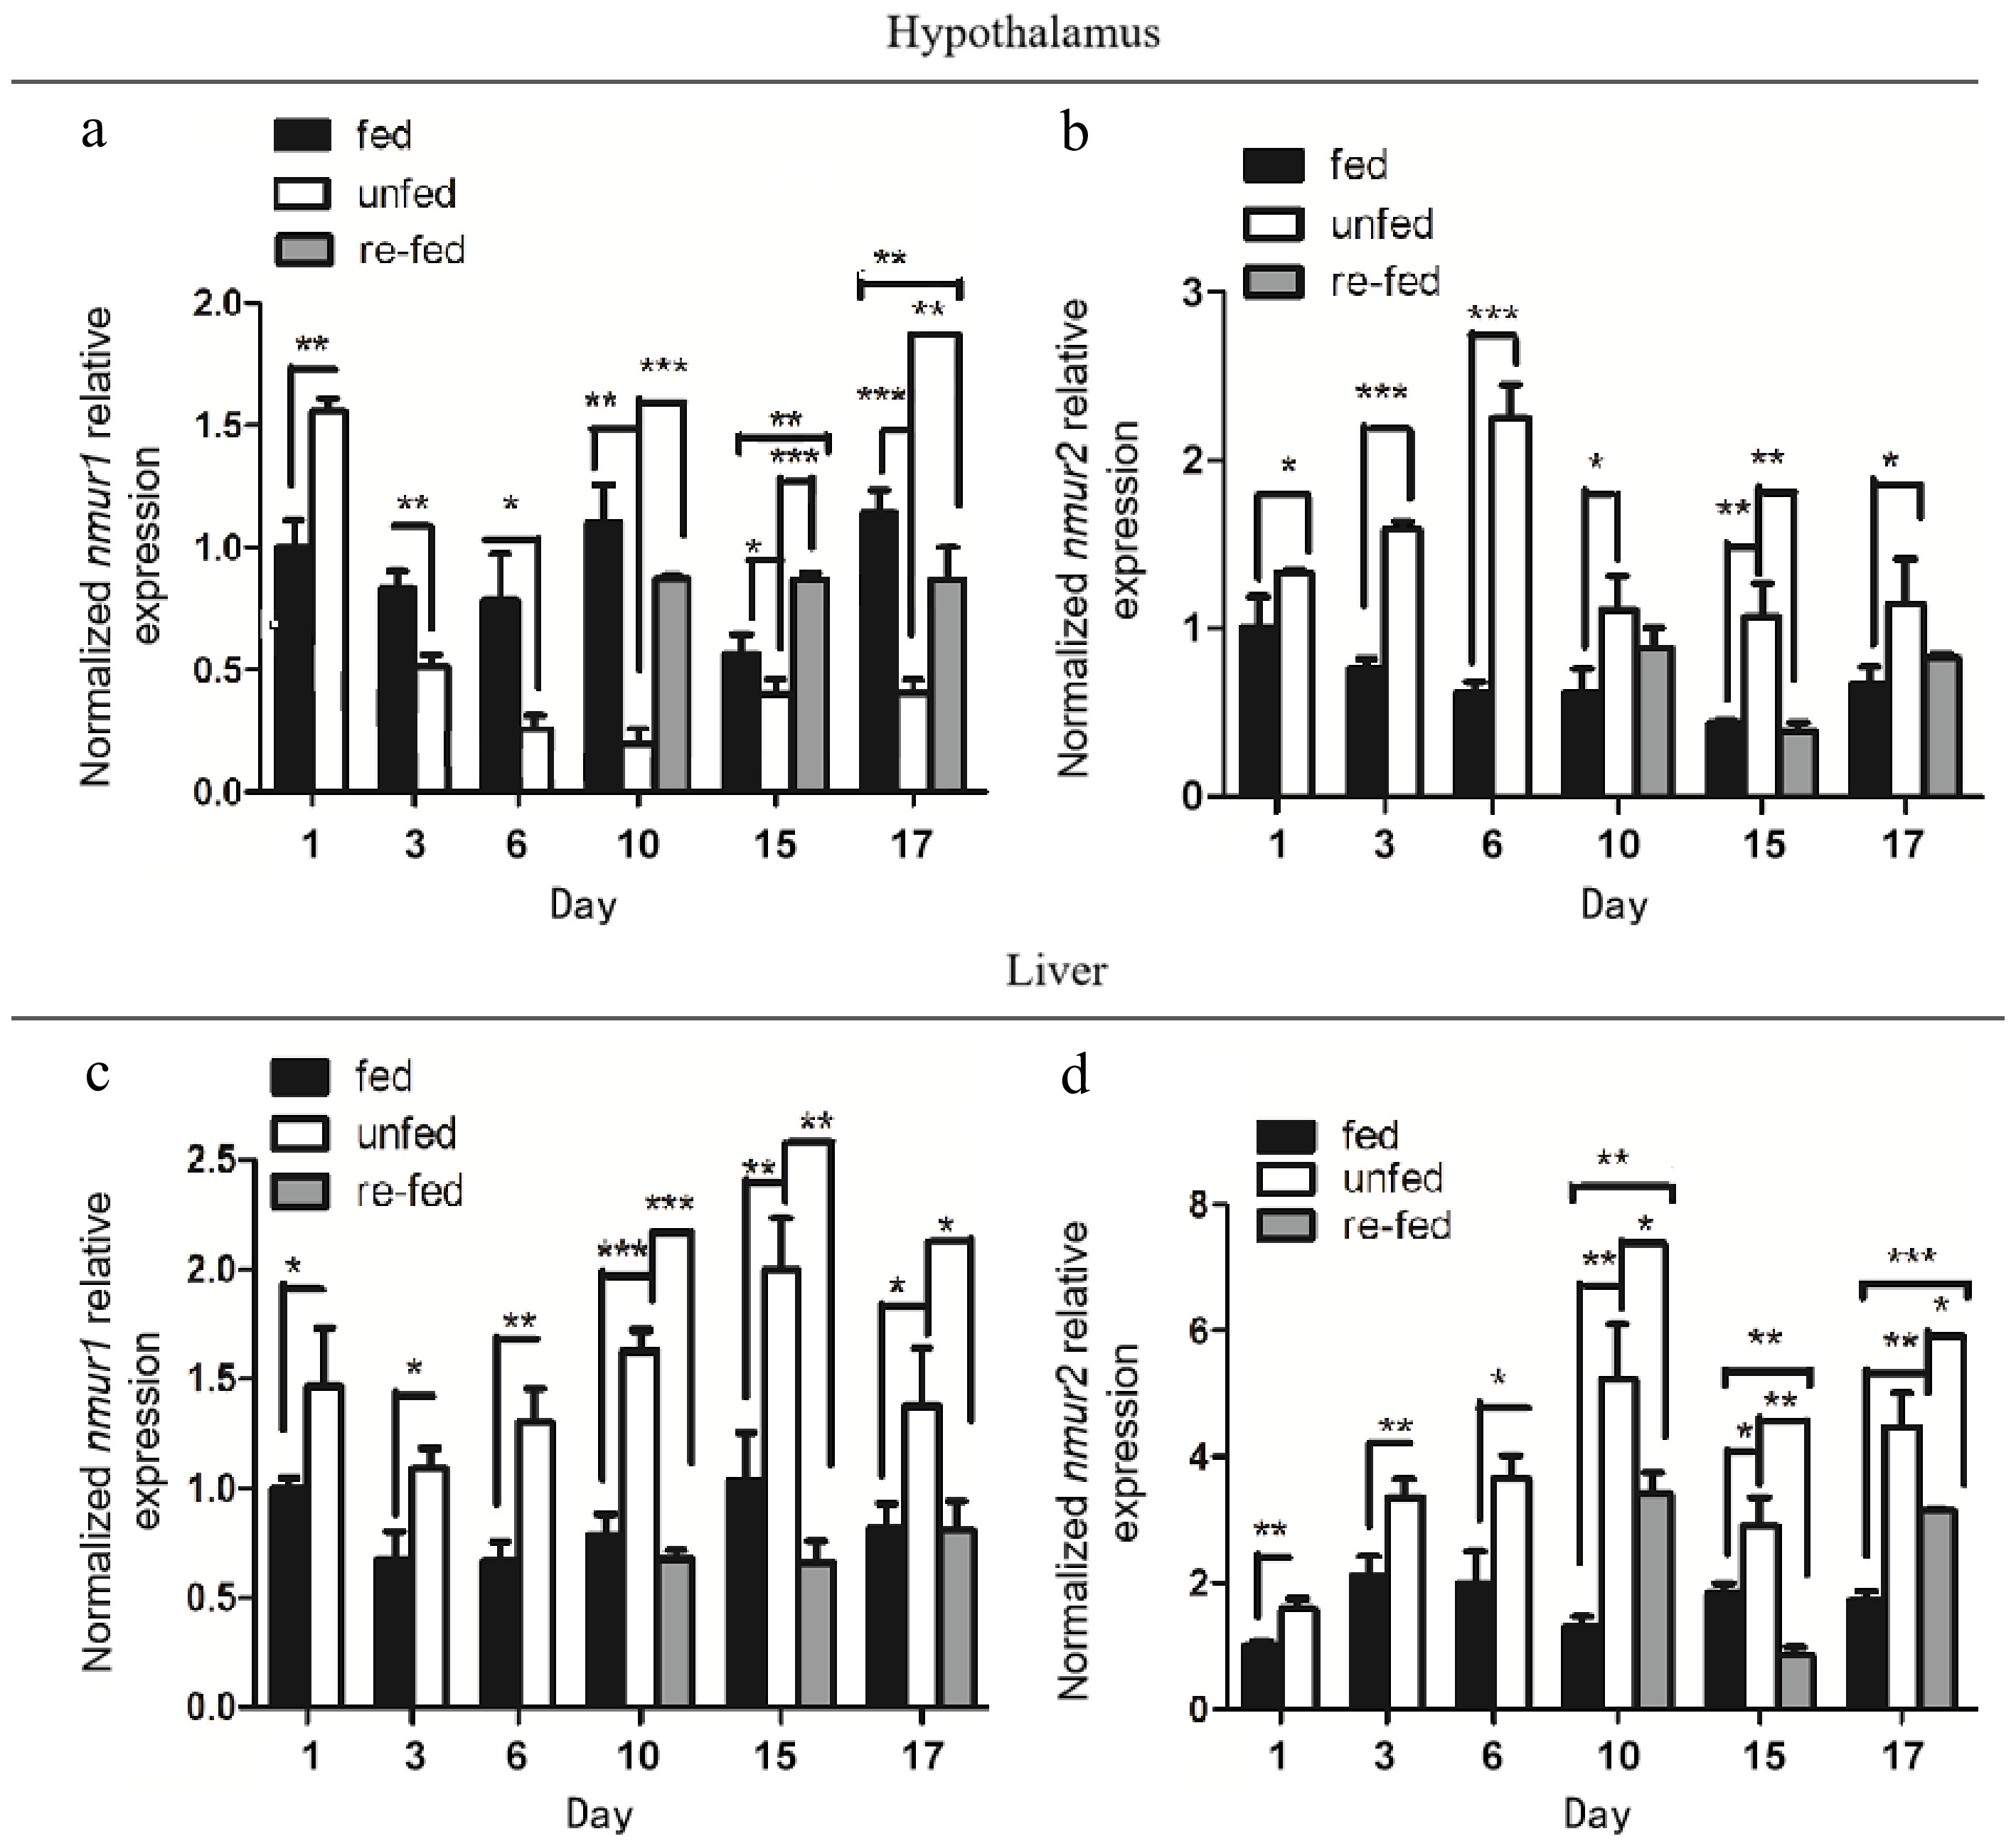
Figure 6.
Relative changes in (a), (c) nmur1 and (b), (d) nmur2 mRNA expression in (a), (b) hypothalamus, and (c), (d) liver of Siberian sturgeon during long-term fasting and re-feeding. Data are presented as mean ± SEM, n = 9 per treatment. The mRNA expression levels were normalized to β-actin and GAPDH expression levels. Asterisks represent significant differences between the fed and unfed groups (* p < 0.05, ** p < 0.01, *** p < 0.001; One-way ANOVA).
-
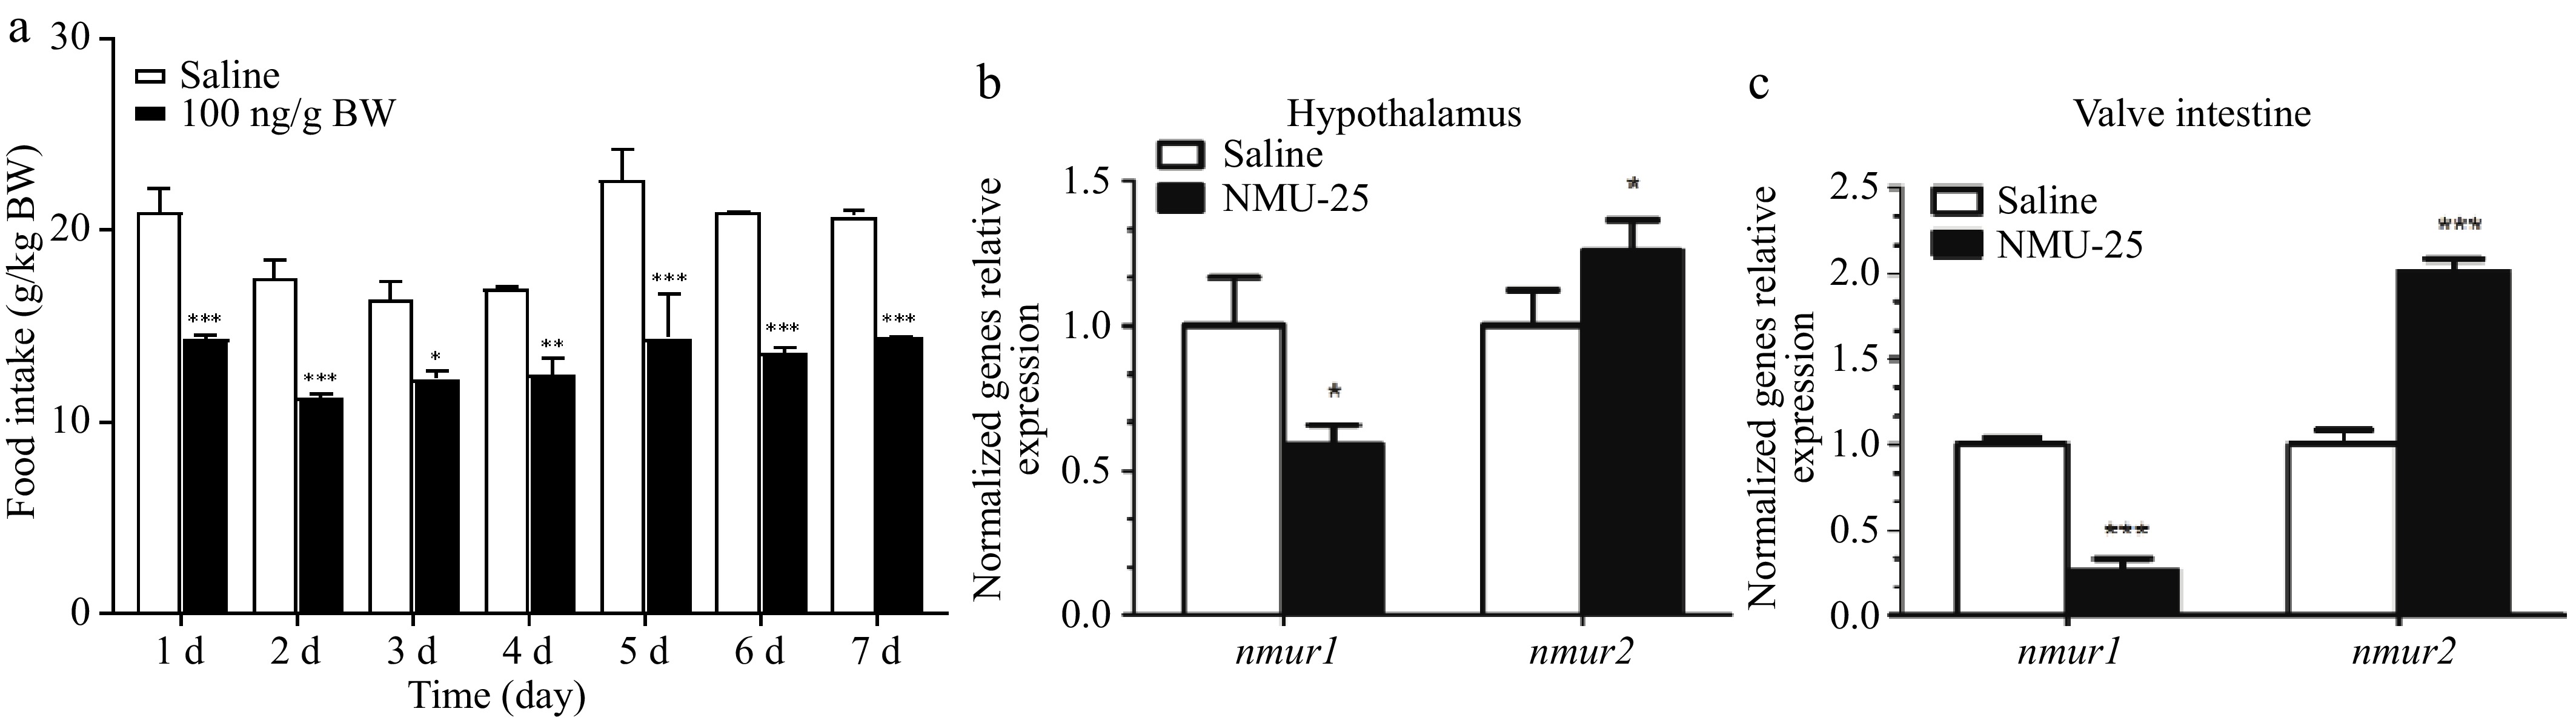
Figure 7.
Effects of long-term i.p. injection of NMU-25 (100ng/g BW) on (a) the food intake, (b) the expression of nmur1 and nmur2 mRNA in the hypothalamus, and (c) the valve intestine of Siberian sturgeon. Data are means ± SEM, n = 12 per treatment. The mRNA expression levels are normalized to β-actin and GAPDH expression levels. Asterisks represent significant differences between the two groups (* p < 0.05, ** p < 0.01, *** p < 0.001; Student's t-test).
-
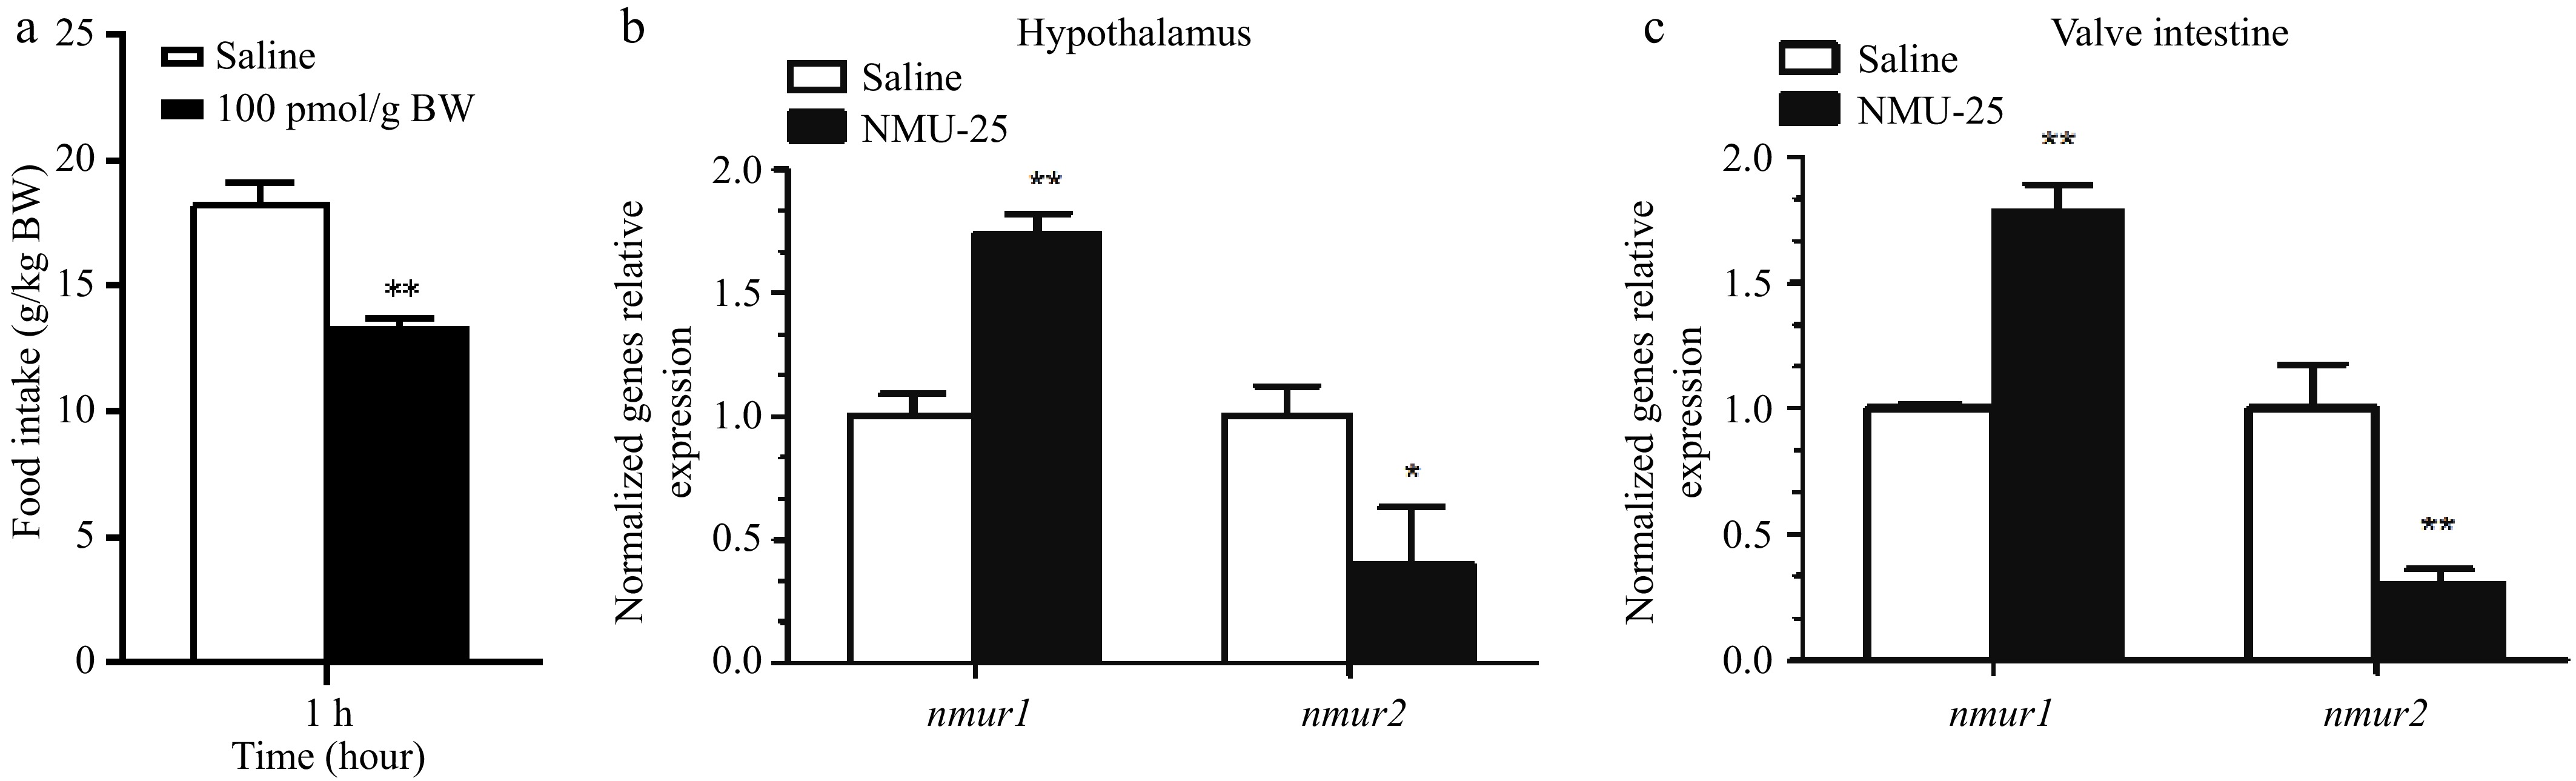
Figure 8.
Effects of i.c.v. injection of NMU-25 (10 pmol/g BW) on the expression of nmur1 and nmur2 mRNA in (a) hypothalamus and (b) valve intestine of Siberian sturgeon. Data are means ± SEM, n = 12 per treatment. The mRNA expression levels are normalized to β-actin and GAPDH expression levels. Asterisks represent significant differences between the two groups (* p < 0.05, ** p < 0.01, *** p < 0.001; Student's t-test).
Figures
(8)
Tables
(0)