-
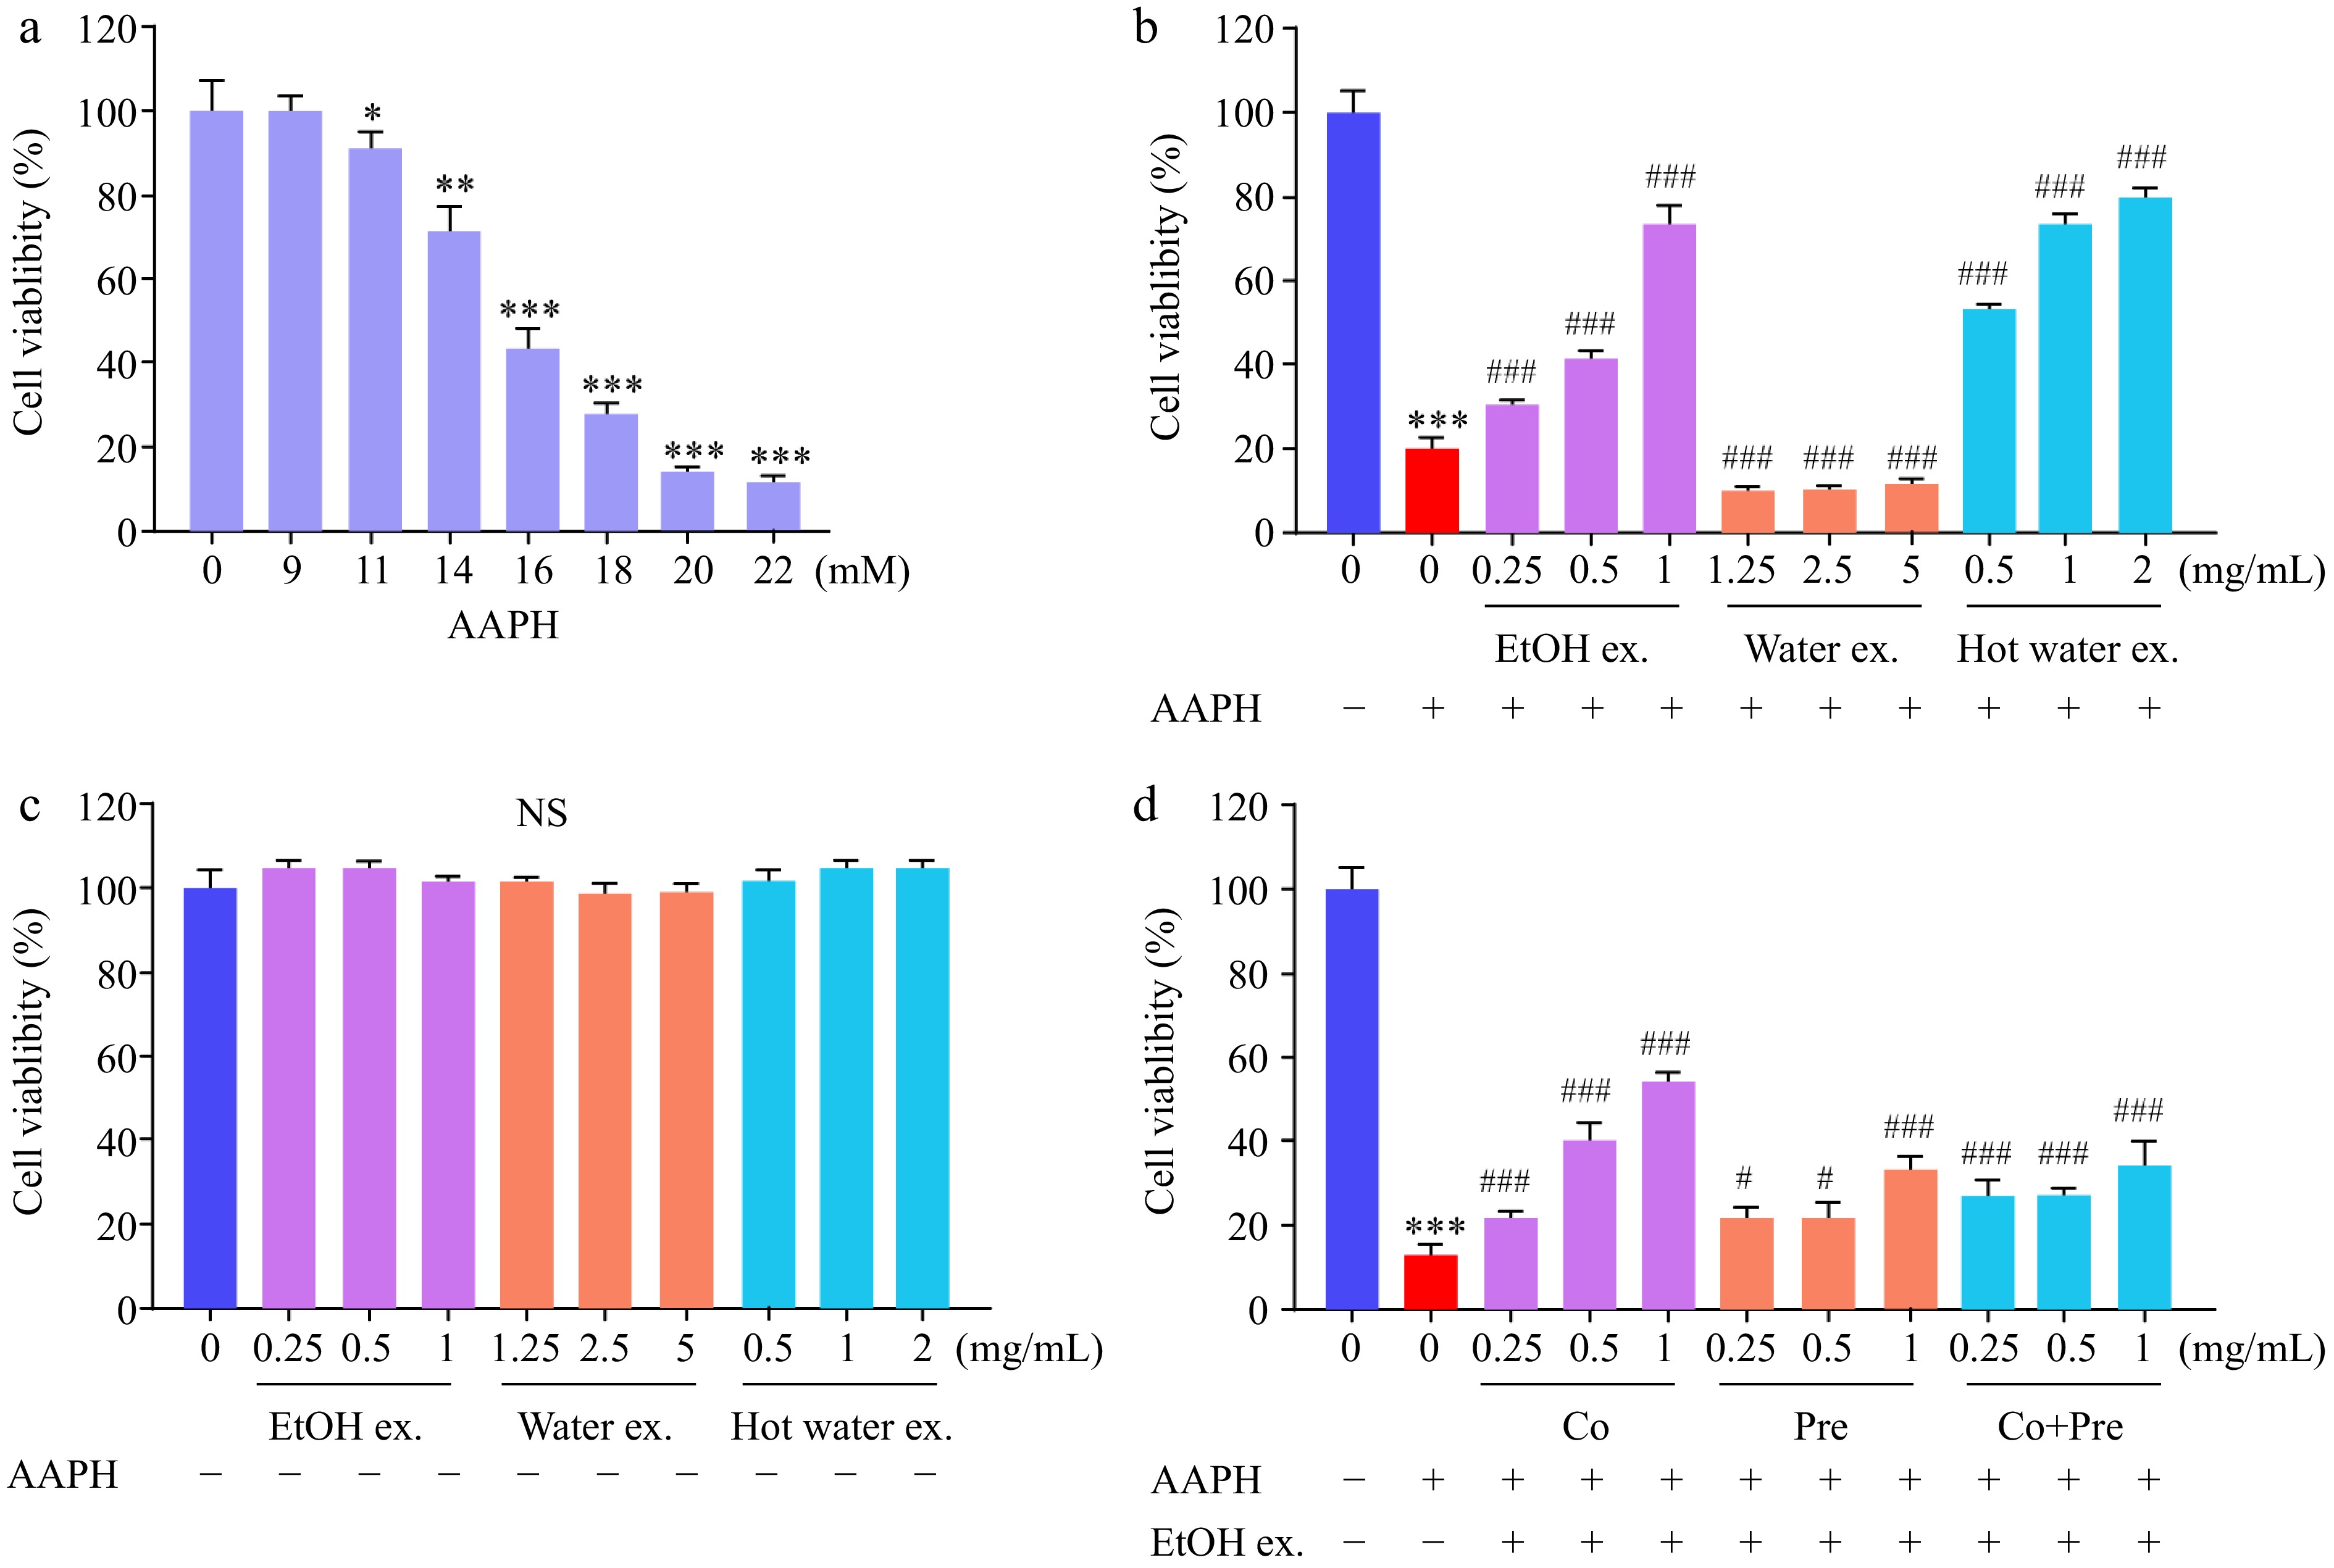
Figure 1.
Sea mussel extracts protected against AAPH-induced cytotoxicity. (a) AAPH exhibited dose-dependent cytotoxic effects on HepG2 cell viability. (b) Protective effects of EtOH, water, and hot water sea mussel extracts at various concentrations against AAPH-induced cytotoxicity. (c) EtOH, water, and hot water sea mussel extracts showed no cytotoxic effect on HepG2 cells. (d) Effects of EtOH extract at various concentrations on AAPH-induced cytotoxicity. Cells were treated with AAPH (16 mM) together with different concentrations of EtOH extract for 24 h.
-
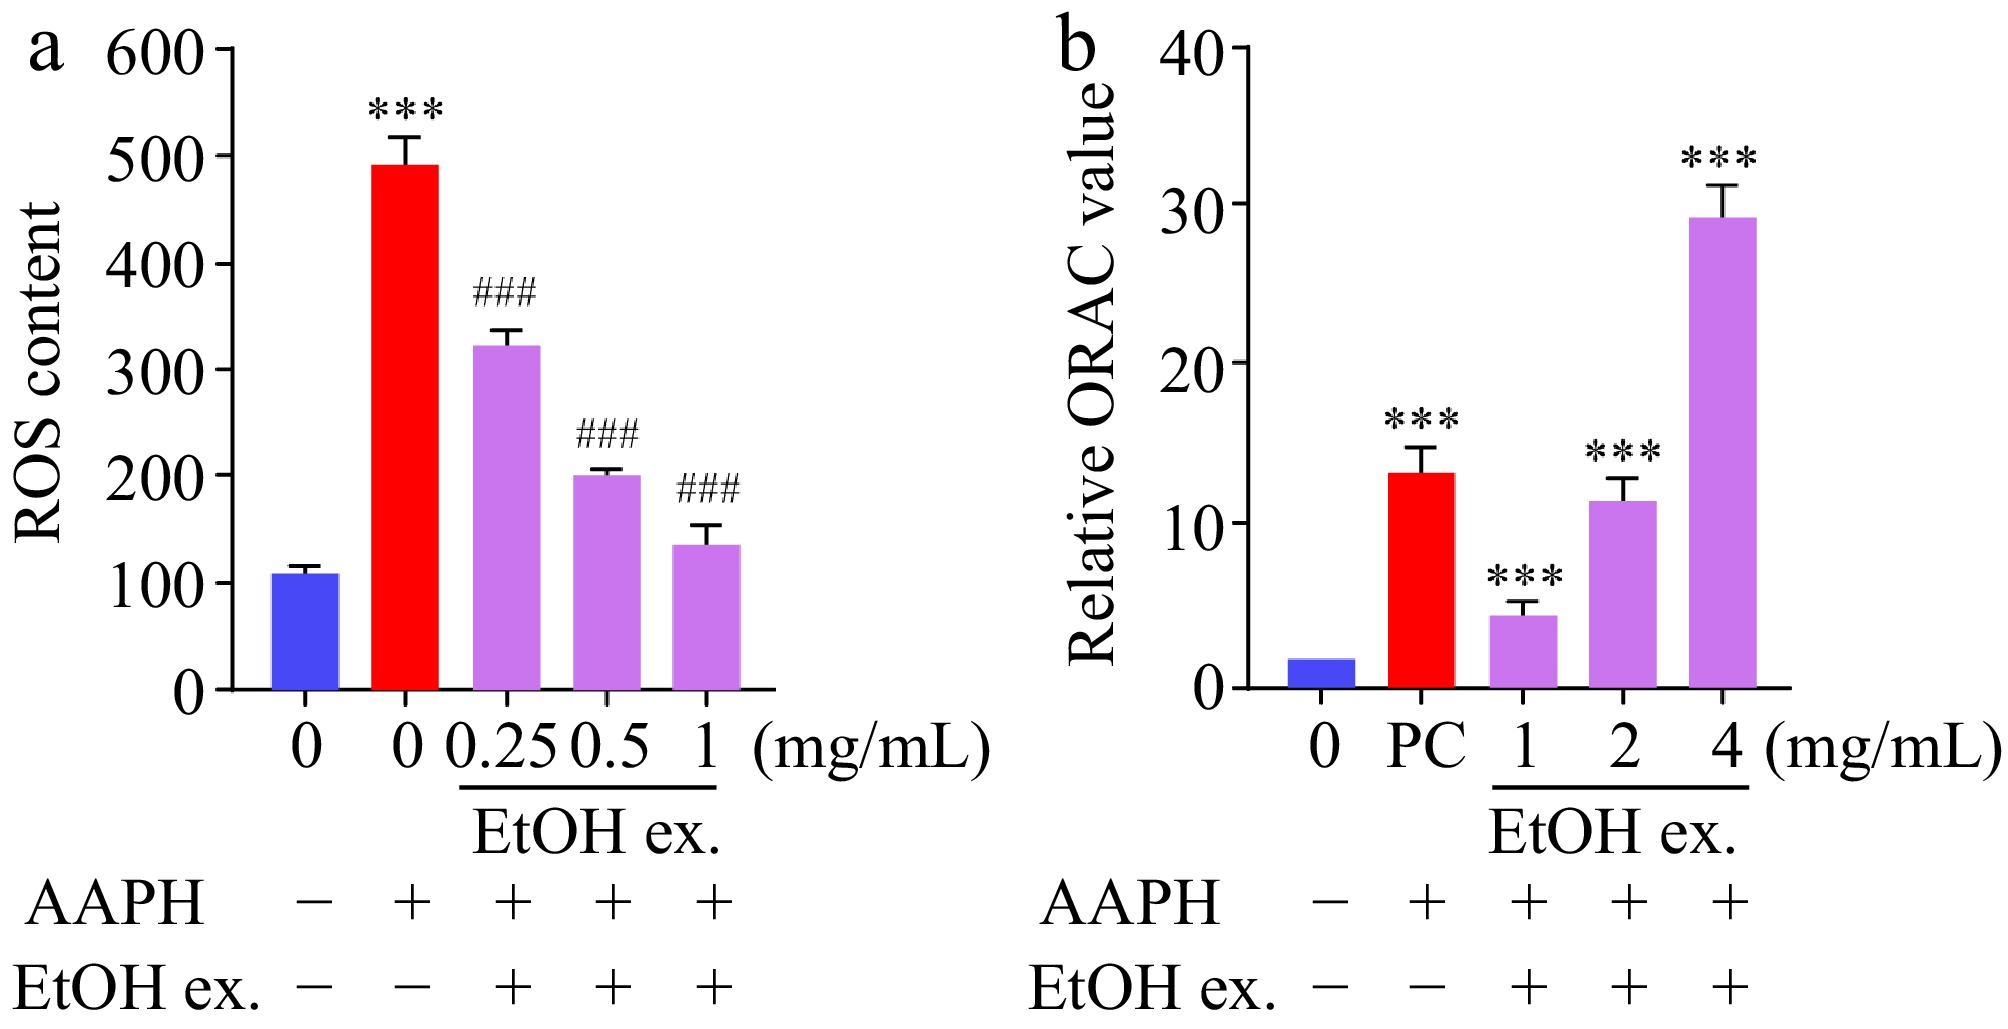
Figure 2.
Sea mussel EtOH extract reduced AAPH-induced ROS formation and exhibited ORAC activity. (a) Sea mussel EtOH extract reduced ROS formation induced by AAPH (16 mM). (b) Relative ORAC values of sea mussel EtOH extract at various concentrations: 1, 2, and 4 mg/mL. Data are expressed as fold change relative to the control (mean ± SD, n = 3). The absolute ORAC value at 1.0 mg/mL was 634.66 ± 39.51 μmol TE/g extract (dry weight). PC, DHMBA (500 μM).
-
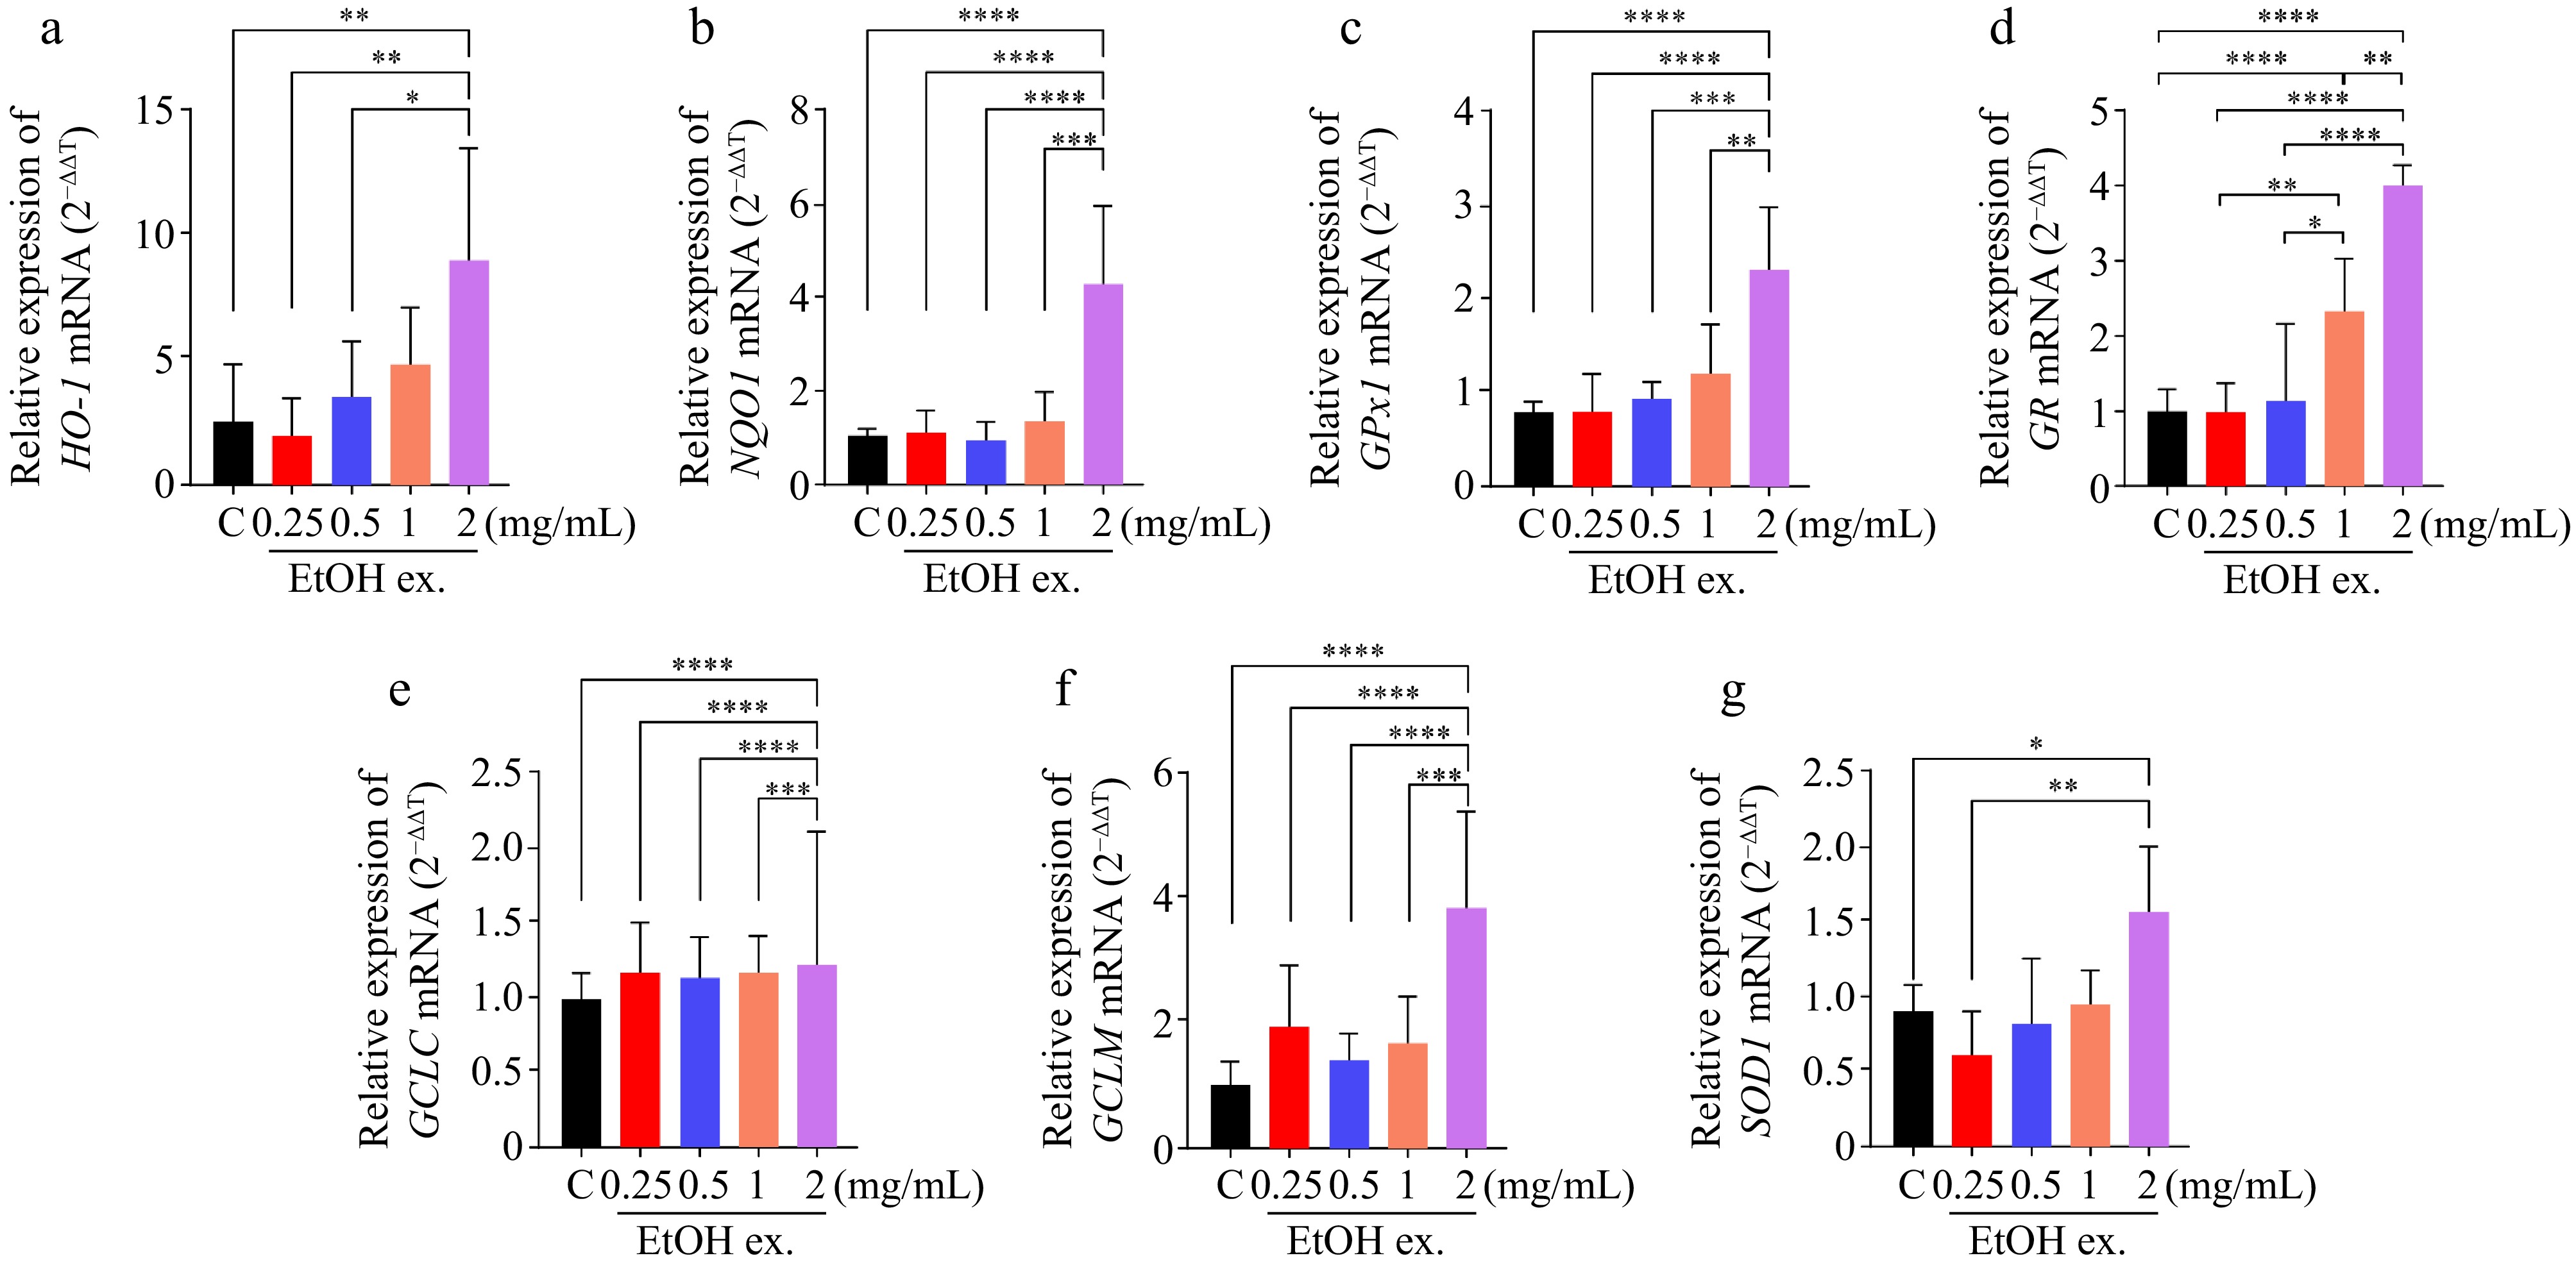
Figure 3.
Sea mussel EtOH extract induced expression of Nrf2 target genes in HepG2 cells. Cells were treated with the EtOH extract at 0.25, 0.5, 1.0, or 2.0 mg/mL for 24 h, and mRNA levels were measured by qRT-PCR. (a) HO-1 mRNA relative levels. (b) NQO1 mRNA relative levels. (c) GPx1 mRNA relative levels. (d) GR mRNA relative levels. (e) GCLC mRNA relative levels. (f) GCLM mRNA relative levels. (g) SOD1 mRNA relative levels. C, control, and untreated HepG2 cells.
-
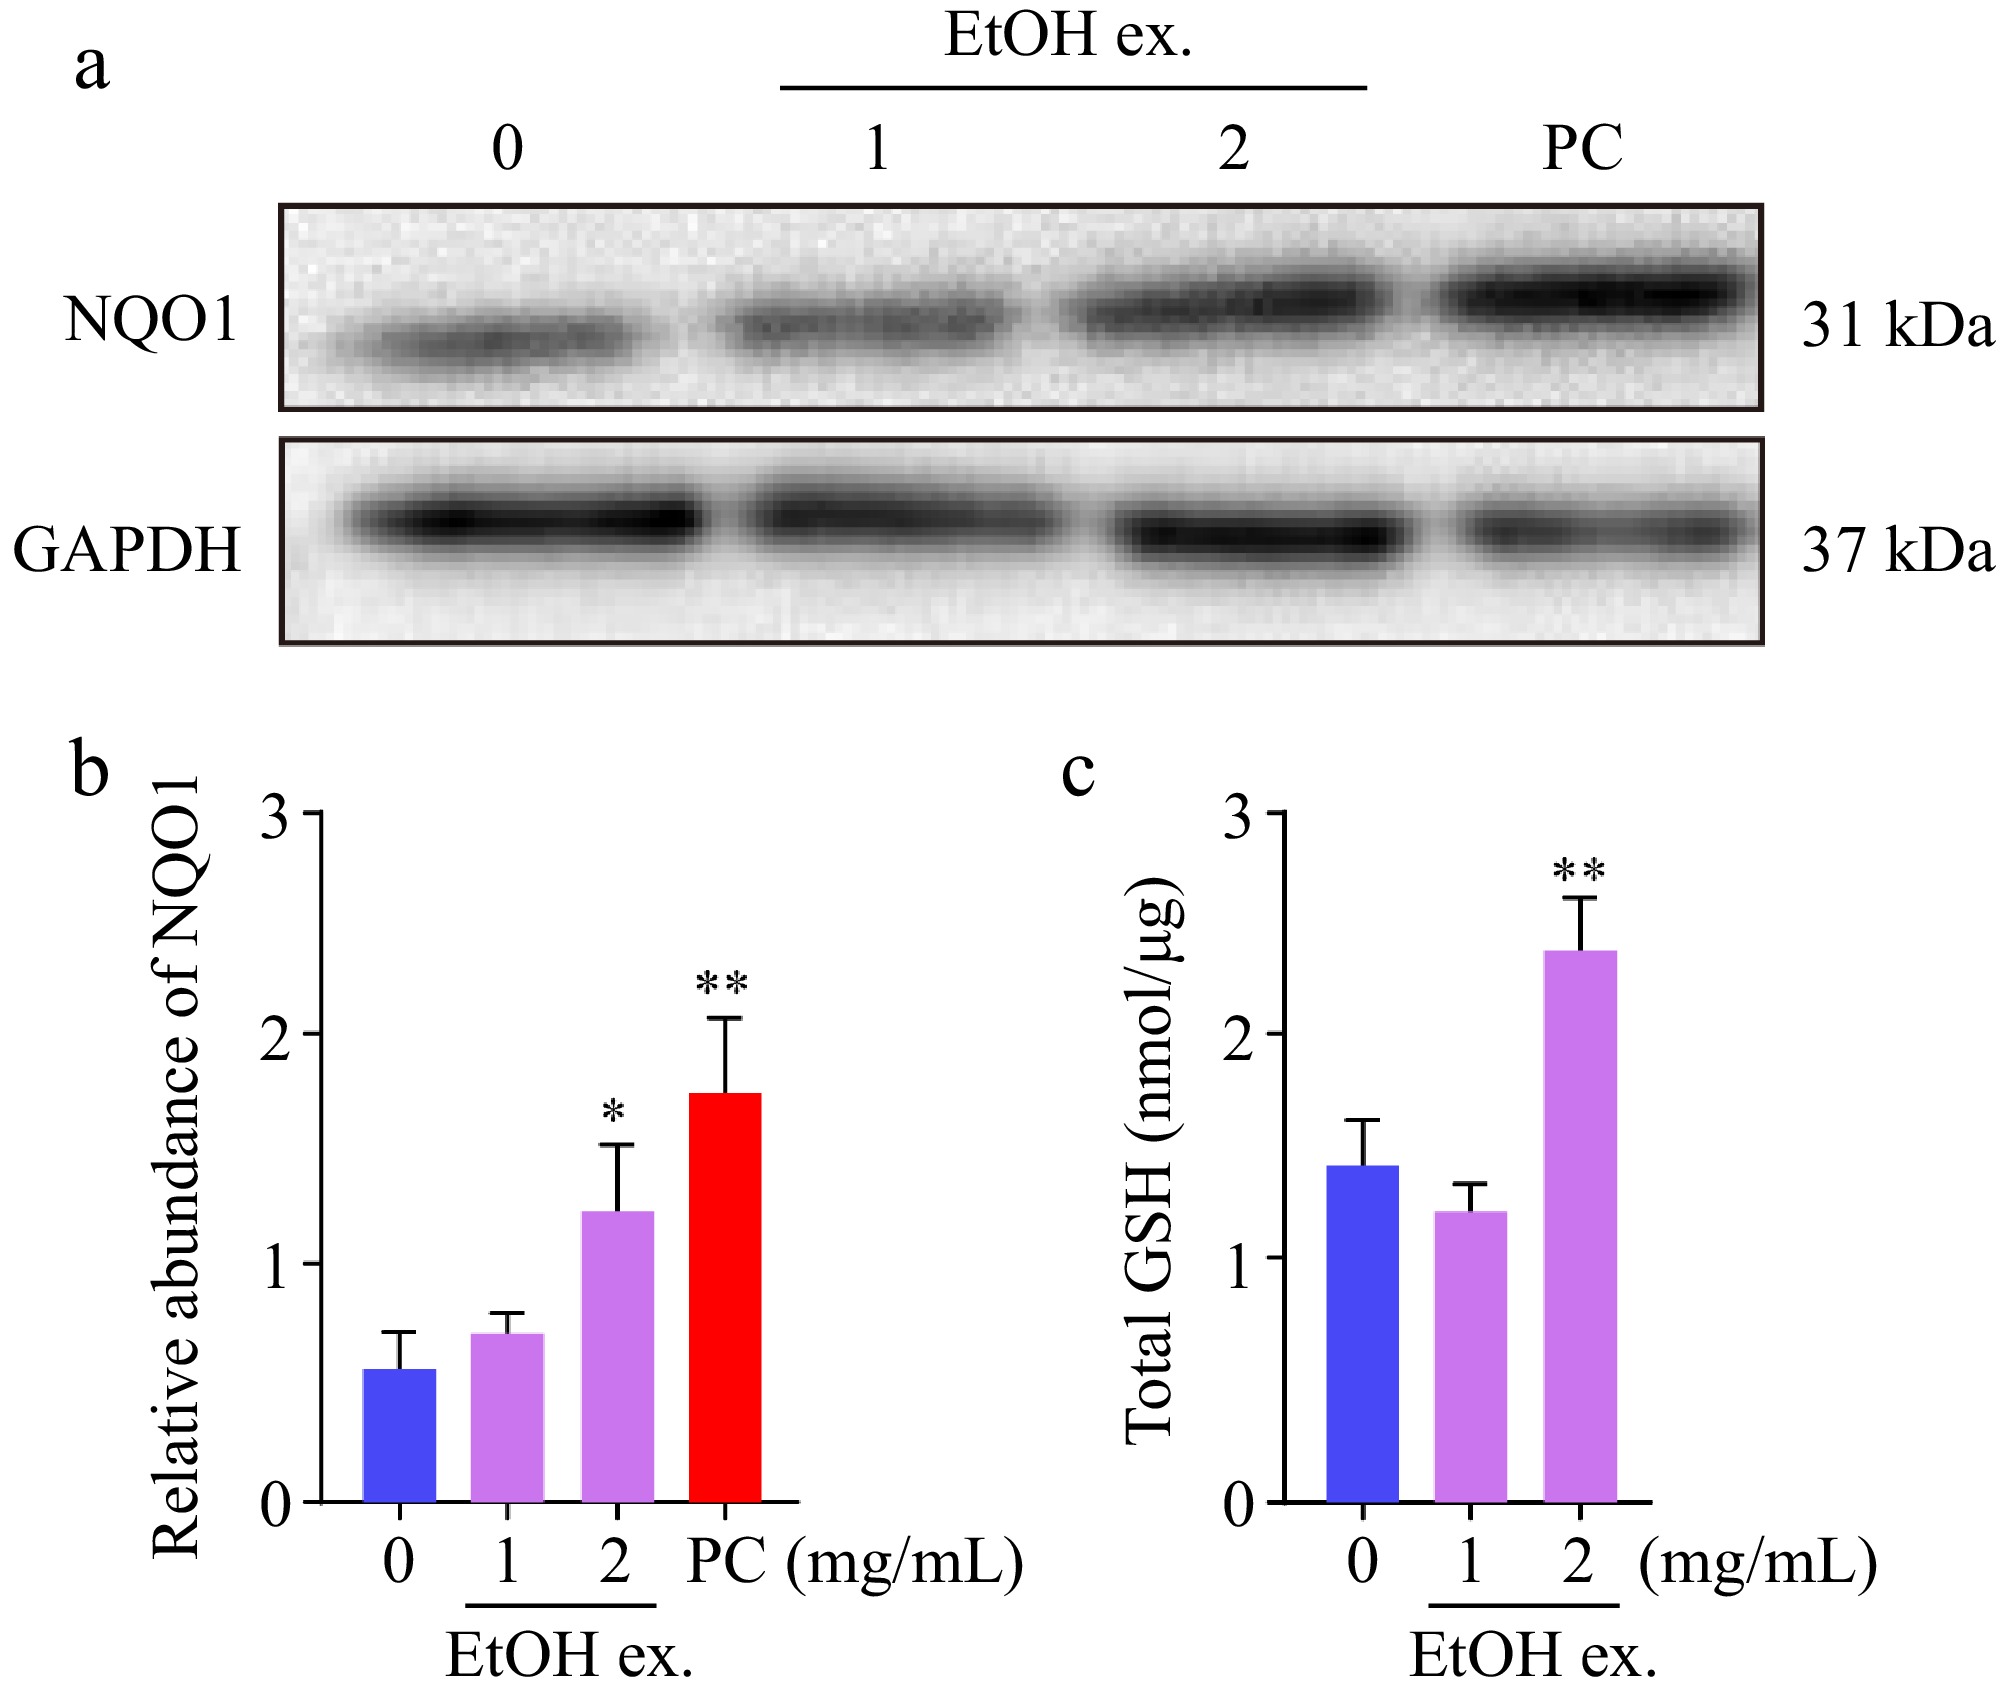
Figure 4.
Sea mussel EtOH extract upregulated the expression of the ARE-regulated antioxidant protein NQO1 and enhanced intracellular GSH levels in HepG2 cells. (a) Western blot analysis of NQO1 protein levels in HepG2 cells treated with or without sea mussel EtOH extract. (b) Relative quantification of NQO1 protein levels from panel (a). (c) Effect of sea mussel EtOH extract on intracellular GSH levels in HepG2 cells. PC, DHMBA, (500 μM).
-
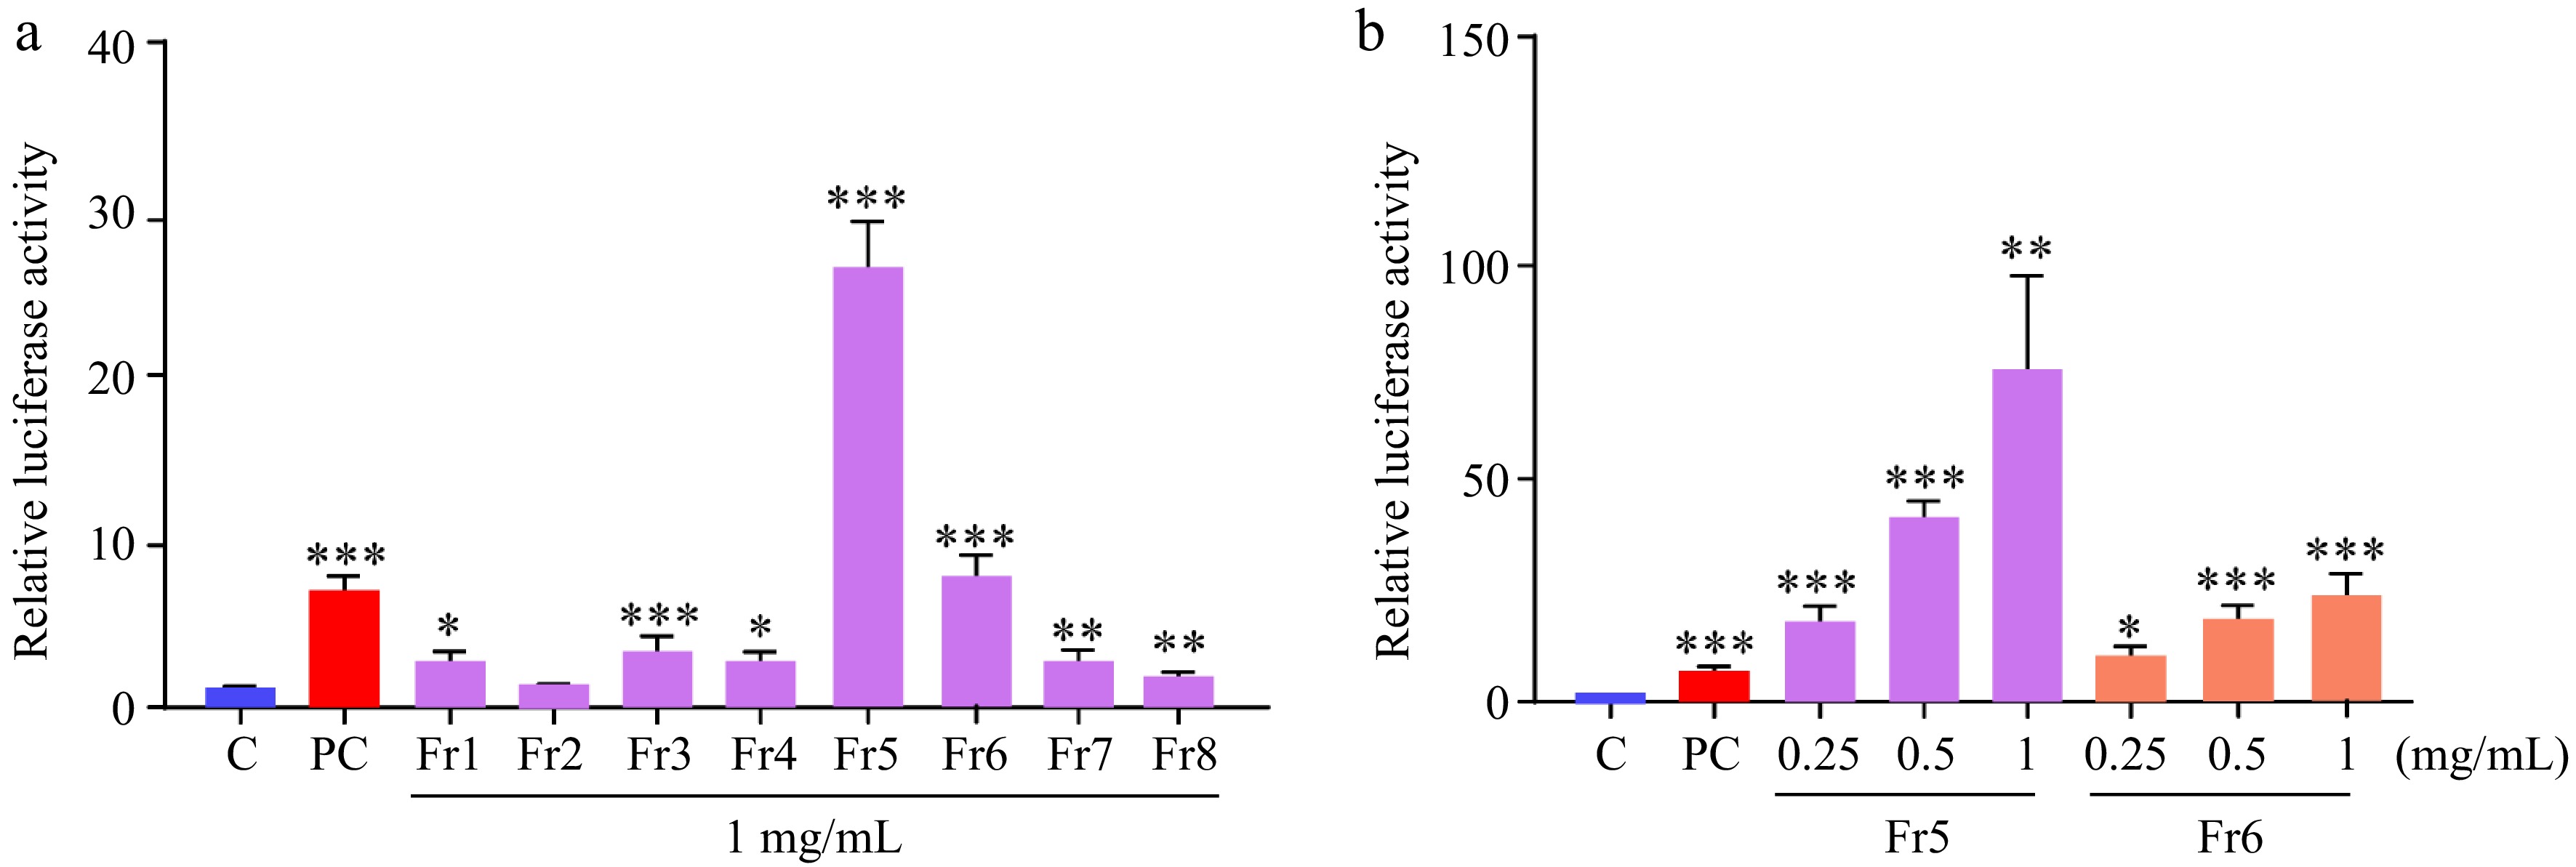
Figure 5.
Effect of sea mussel EtOH extract subfractions on ARE-driven reporter activity. (a) ARE-luciferase activity in HepG2 cells treated with different subfractions of the EtOH extract. (b) ARE-luciferase activity in response to Fr. 5 and Fr. 6 subfractions. C: control and untreated HepG2 cells. PC, DHMBA, (500 μM).
-
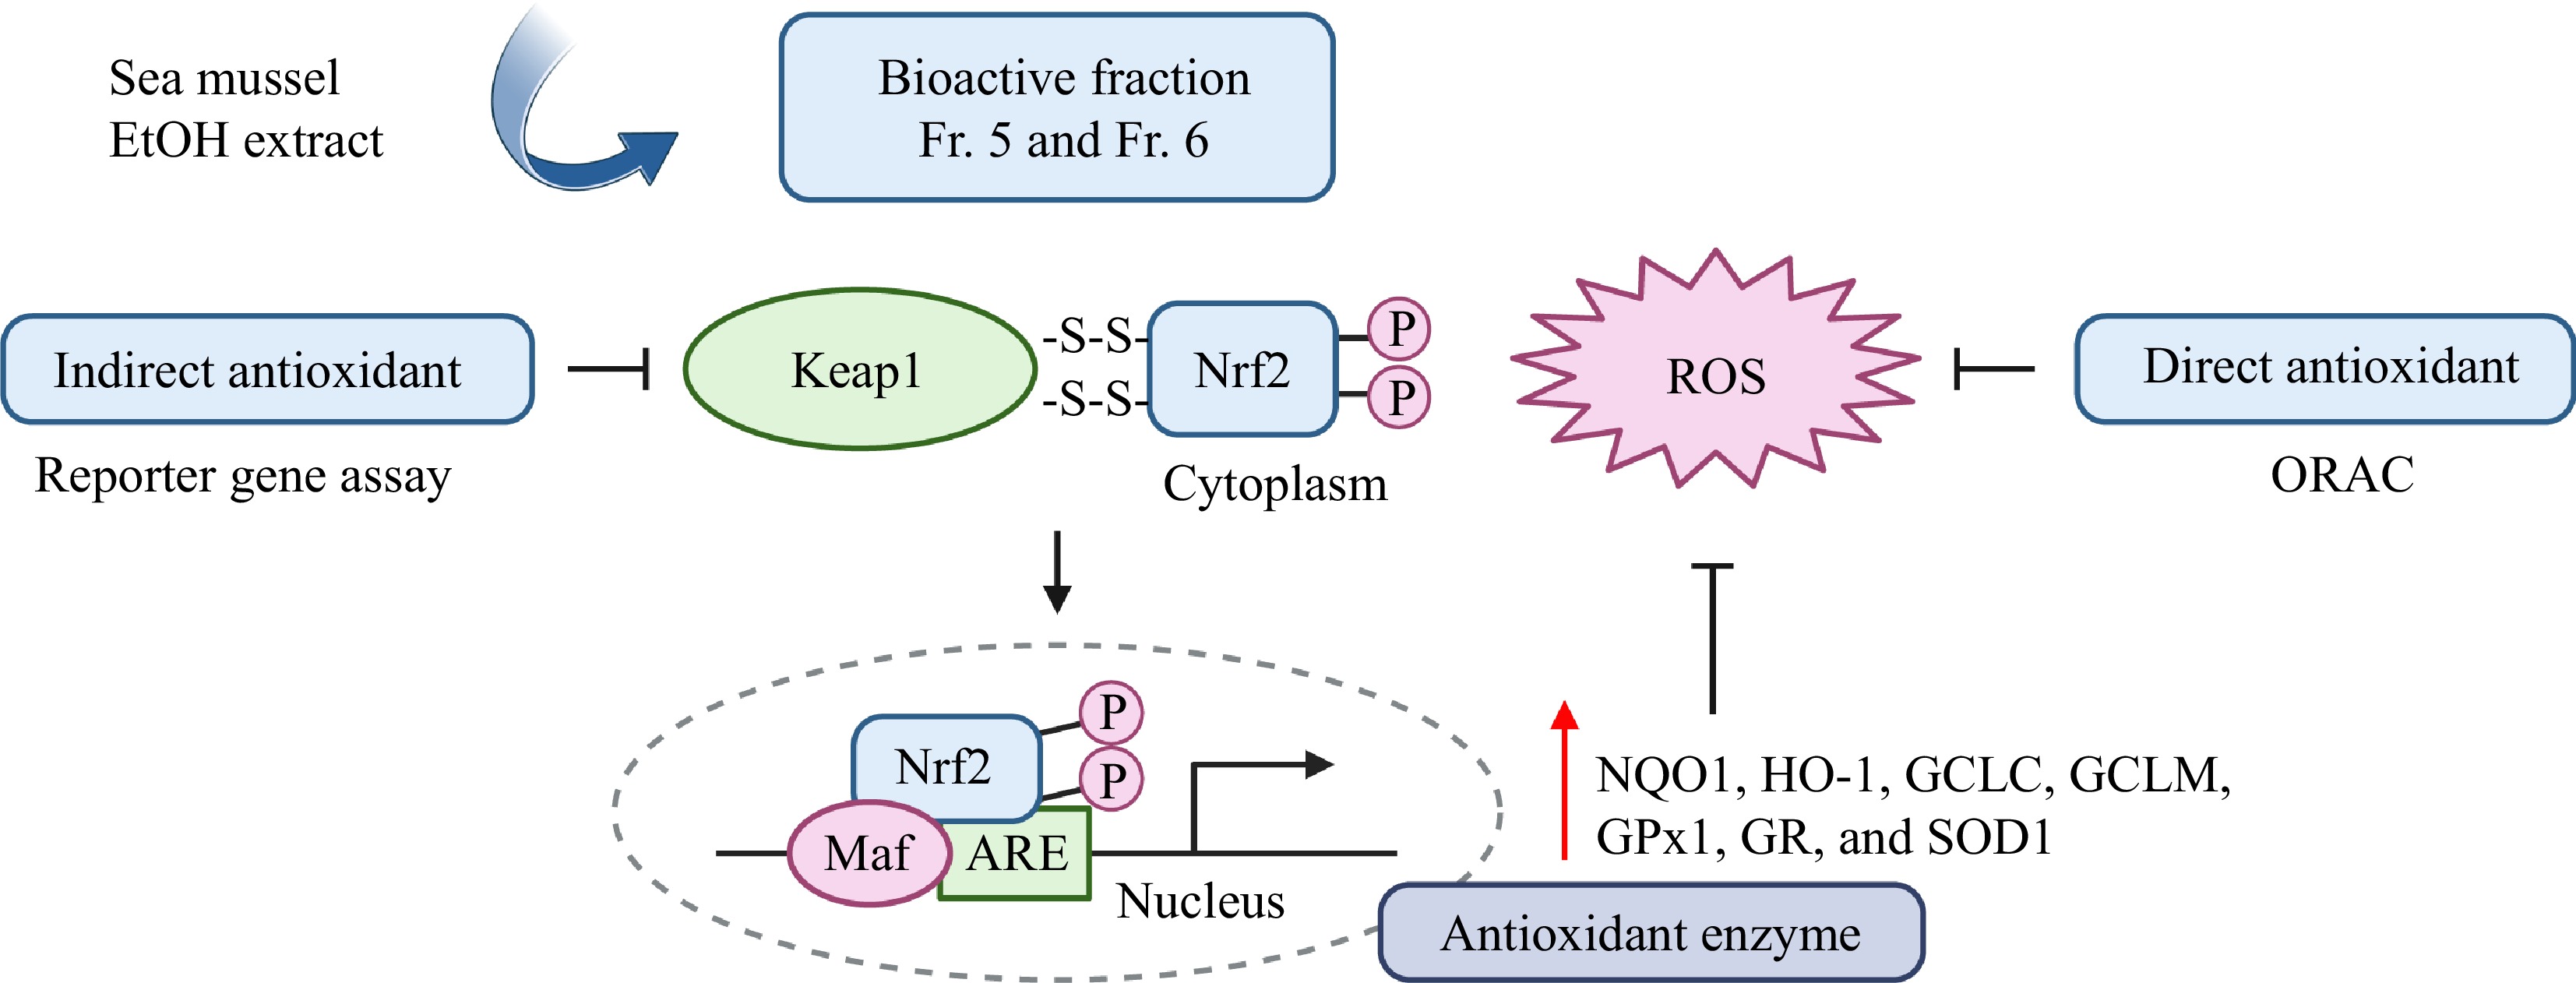
Figure 6.
Schematic illustration of the proposed mechanism by which sea mussel extract alleviates AAPH-induced oxidative stress through the Keap1-Nrf2-ARE pathway.
Figures
(6)
Tables
(0)