-
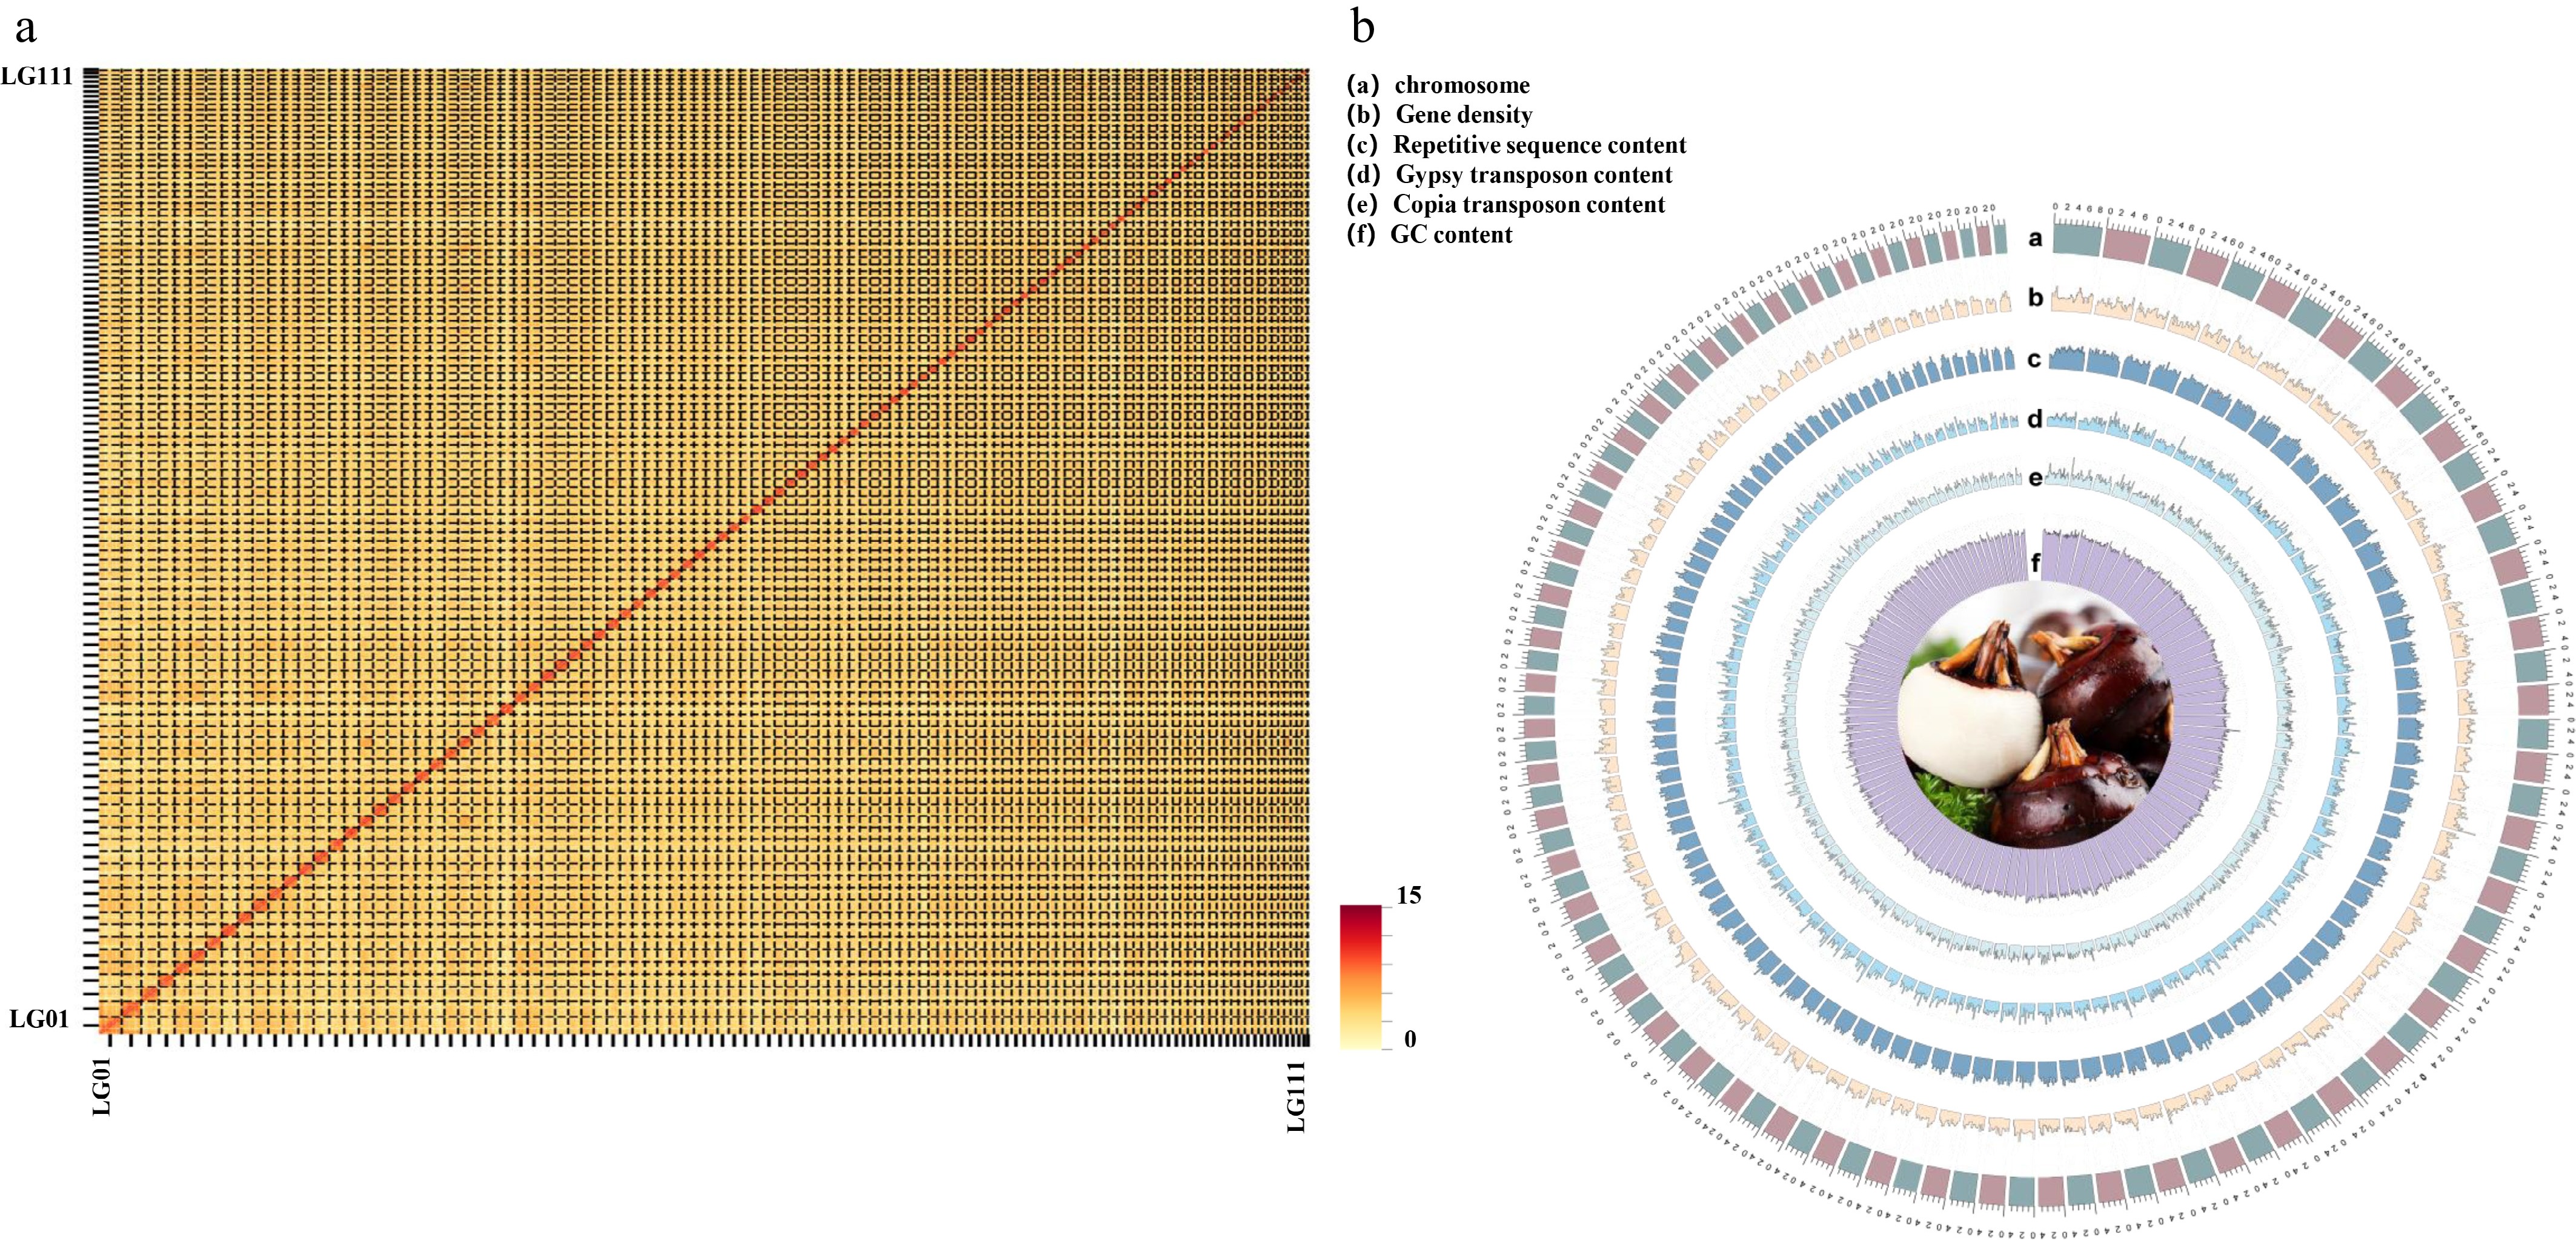
Figure 1.
E. dulcis genome assembly features. (a) Heatmap of Hi-C data for 111 pseudochromosomes of the E. dulcis genome. According to the Hi-C-based final assembly of the chromosome-level genome, the number of Hi-C read pairs between any two bins was used as the intensity signal of the interaction between two bins. Heatmap coordinates represent the pseudochromosomes, with the color of each dot representing the log value of the interaction intensity of the corresponding genomic bin pair (yellow to deep red). (b) Genome-scale features of E. dulcis pseudochromosomes. The letters (a–f) represent the chromosome, gene density, repeat sequence content, Gypsy transposon content, Copia transposon content, and GC content, respectively.
-
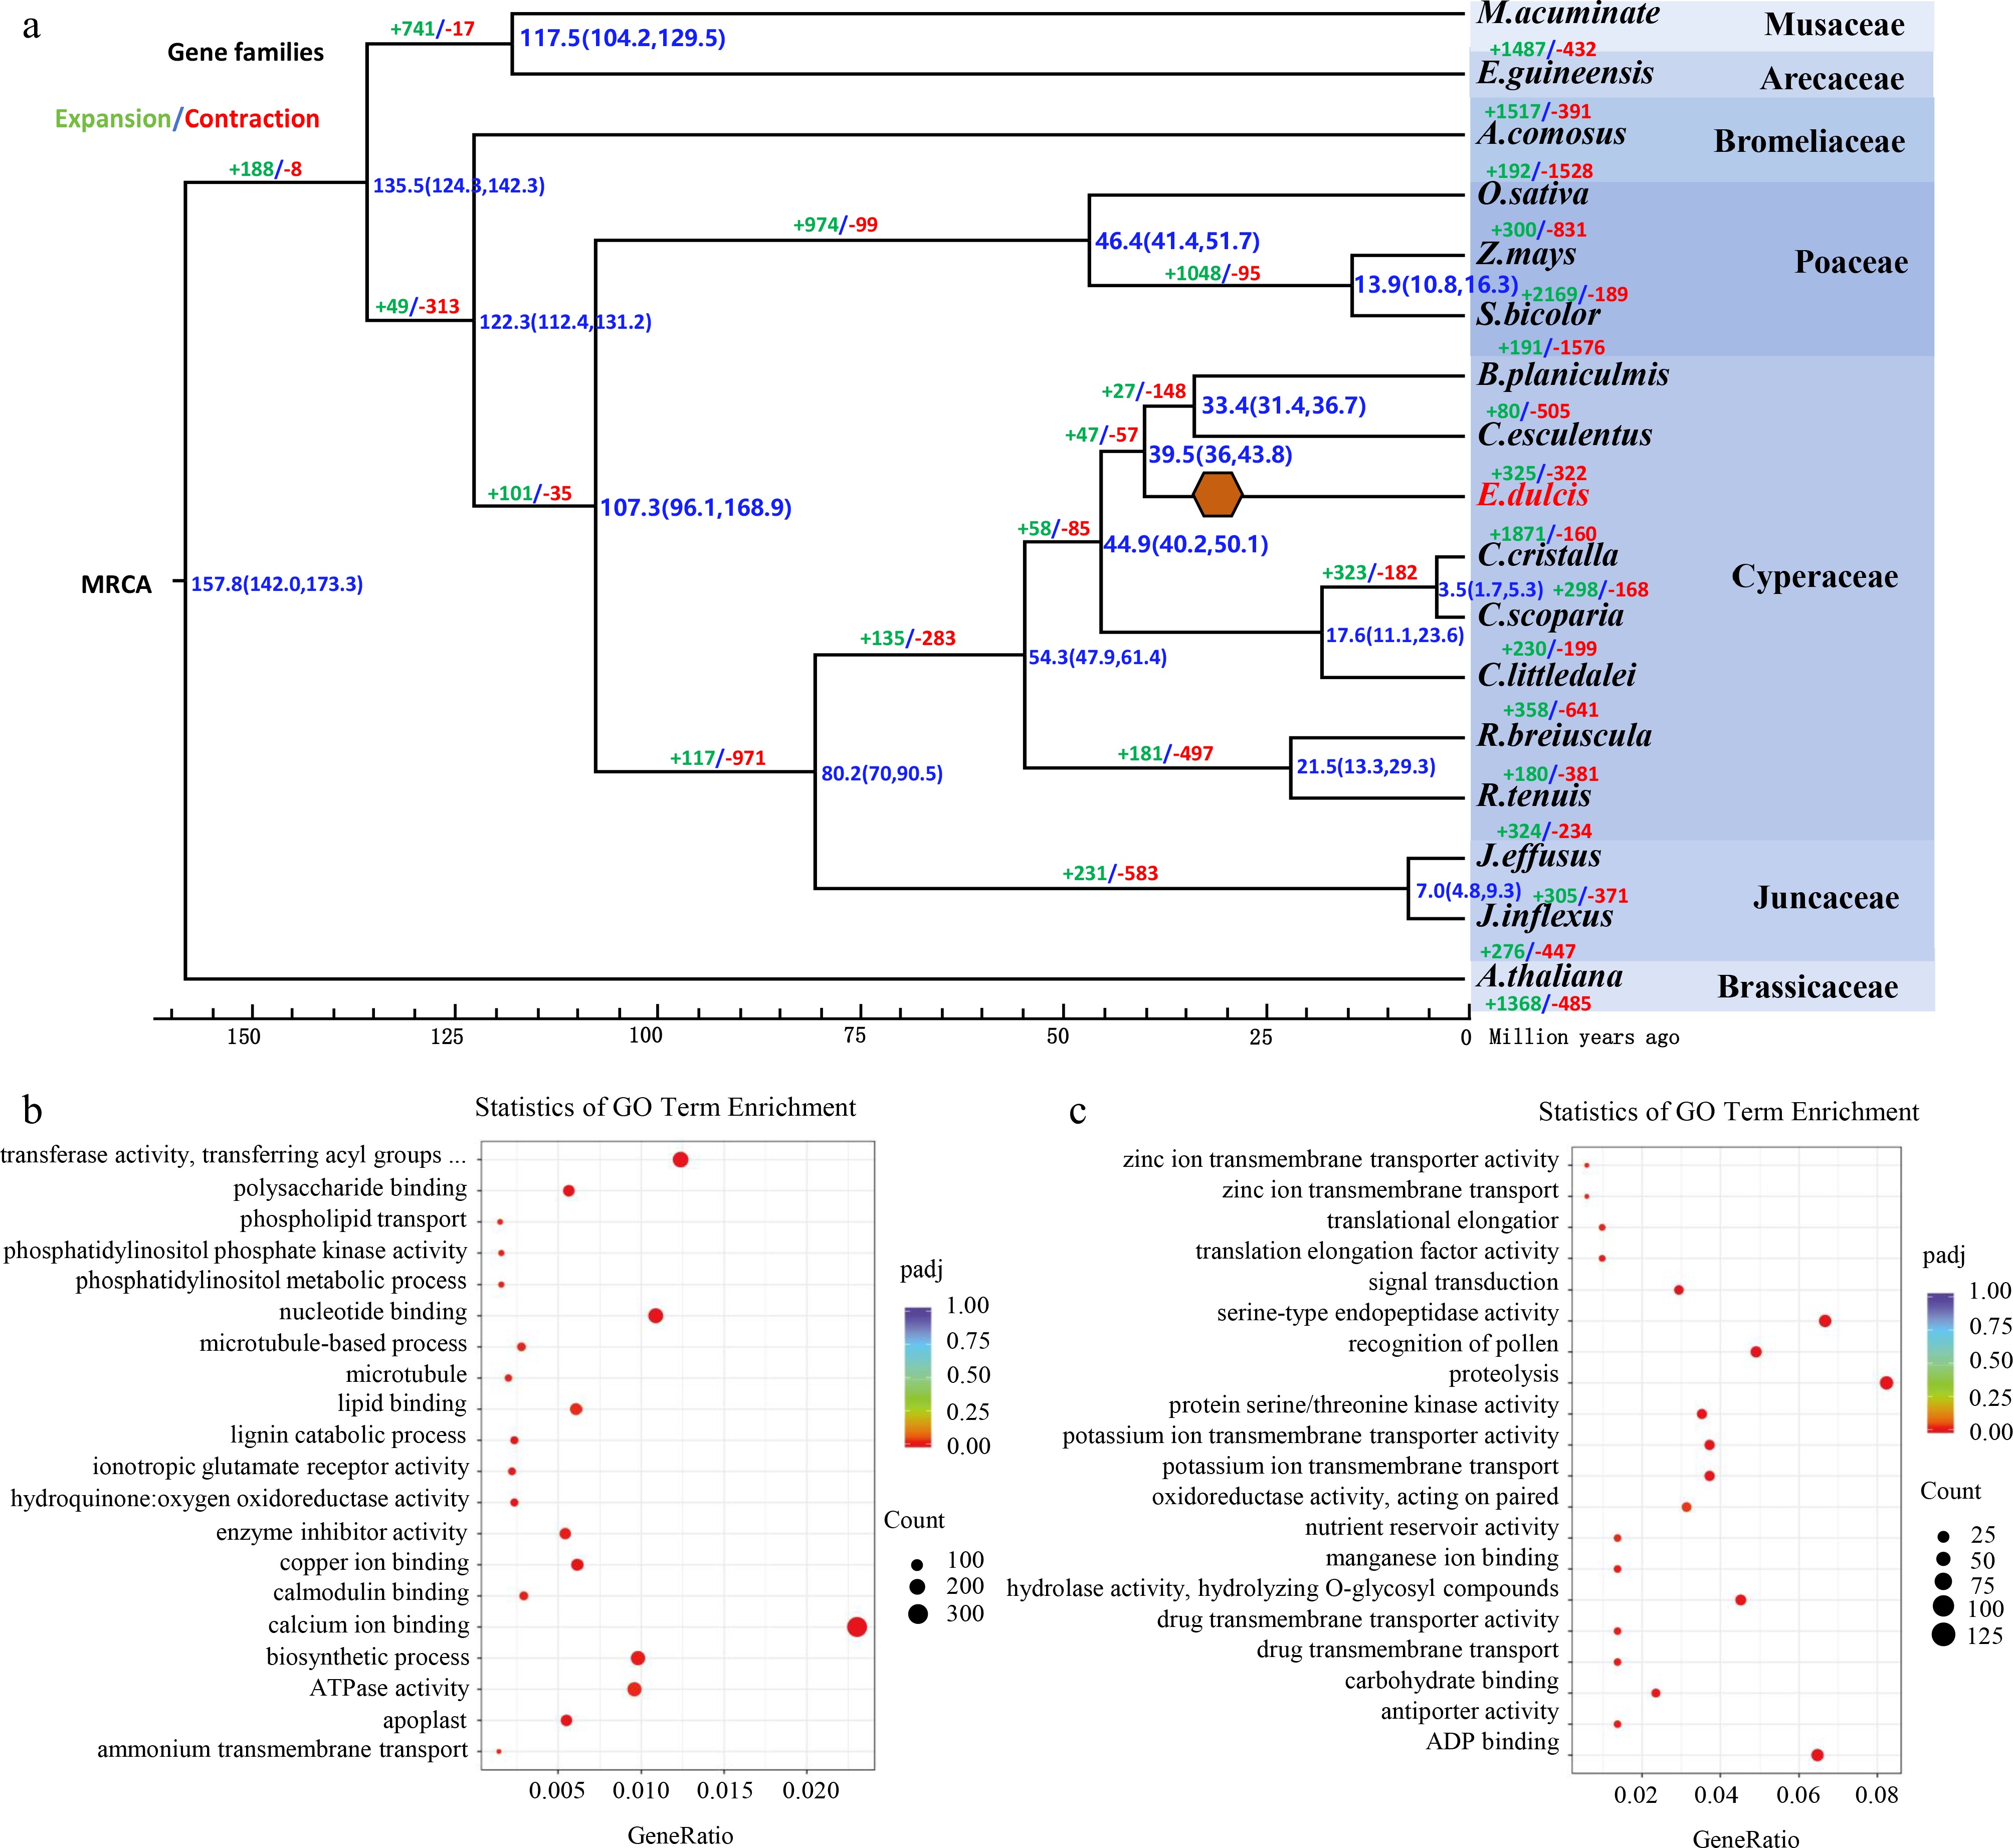
Figure 2.
Gene family expansion and contraction in E. dulcis. (a) Phylogenetic relationships and divergence times of E. dulcis and 16 other plant species, as well as contracted and expanded gene families. Blue numbers at each node represent the divergence time (million years ago; Mya), whereas the numbers in parentheses represent the 95% confidence intervals of the divergence times. Green and red numbers indicate expanded and contracted gene families, respectively. MCRA, most recent common ancestor. The 17 species are divided into the following seven families: Musaceae, Arecaceae, Bromeliaceae, Poaceae, Cyperaceae, Juncaceae, and Brassicaceae. (b) Enriched GO functional terms assigned to expanded E. dulcis gene family members. (c) Enriched GO functional terms assigned to contracted E. dulcis gene family members. The abscissa presents the rich factor (percentage of annotated genes), whereas the ordinate presents the enrichment. The size of each point represents the number of genes annotated with the enriched GO term, whereas the color represents the q-value (low values indicate significance). Whole-genome duplications are marked by orange hexagons.
-
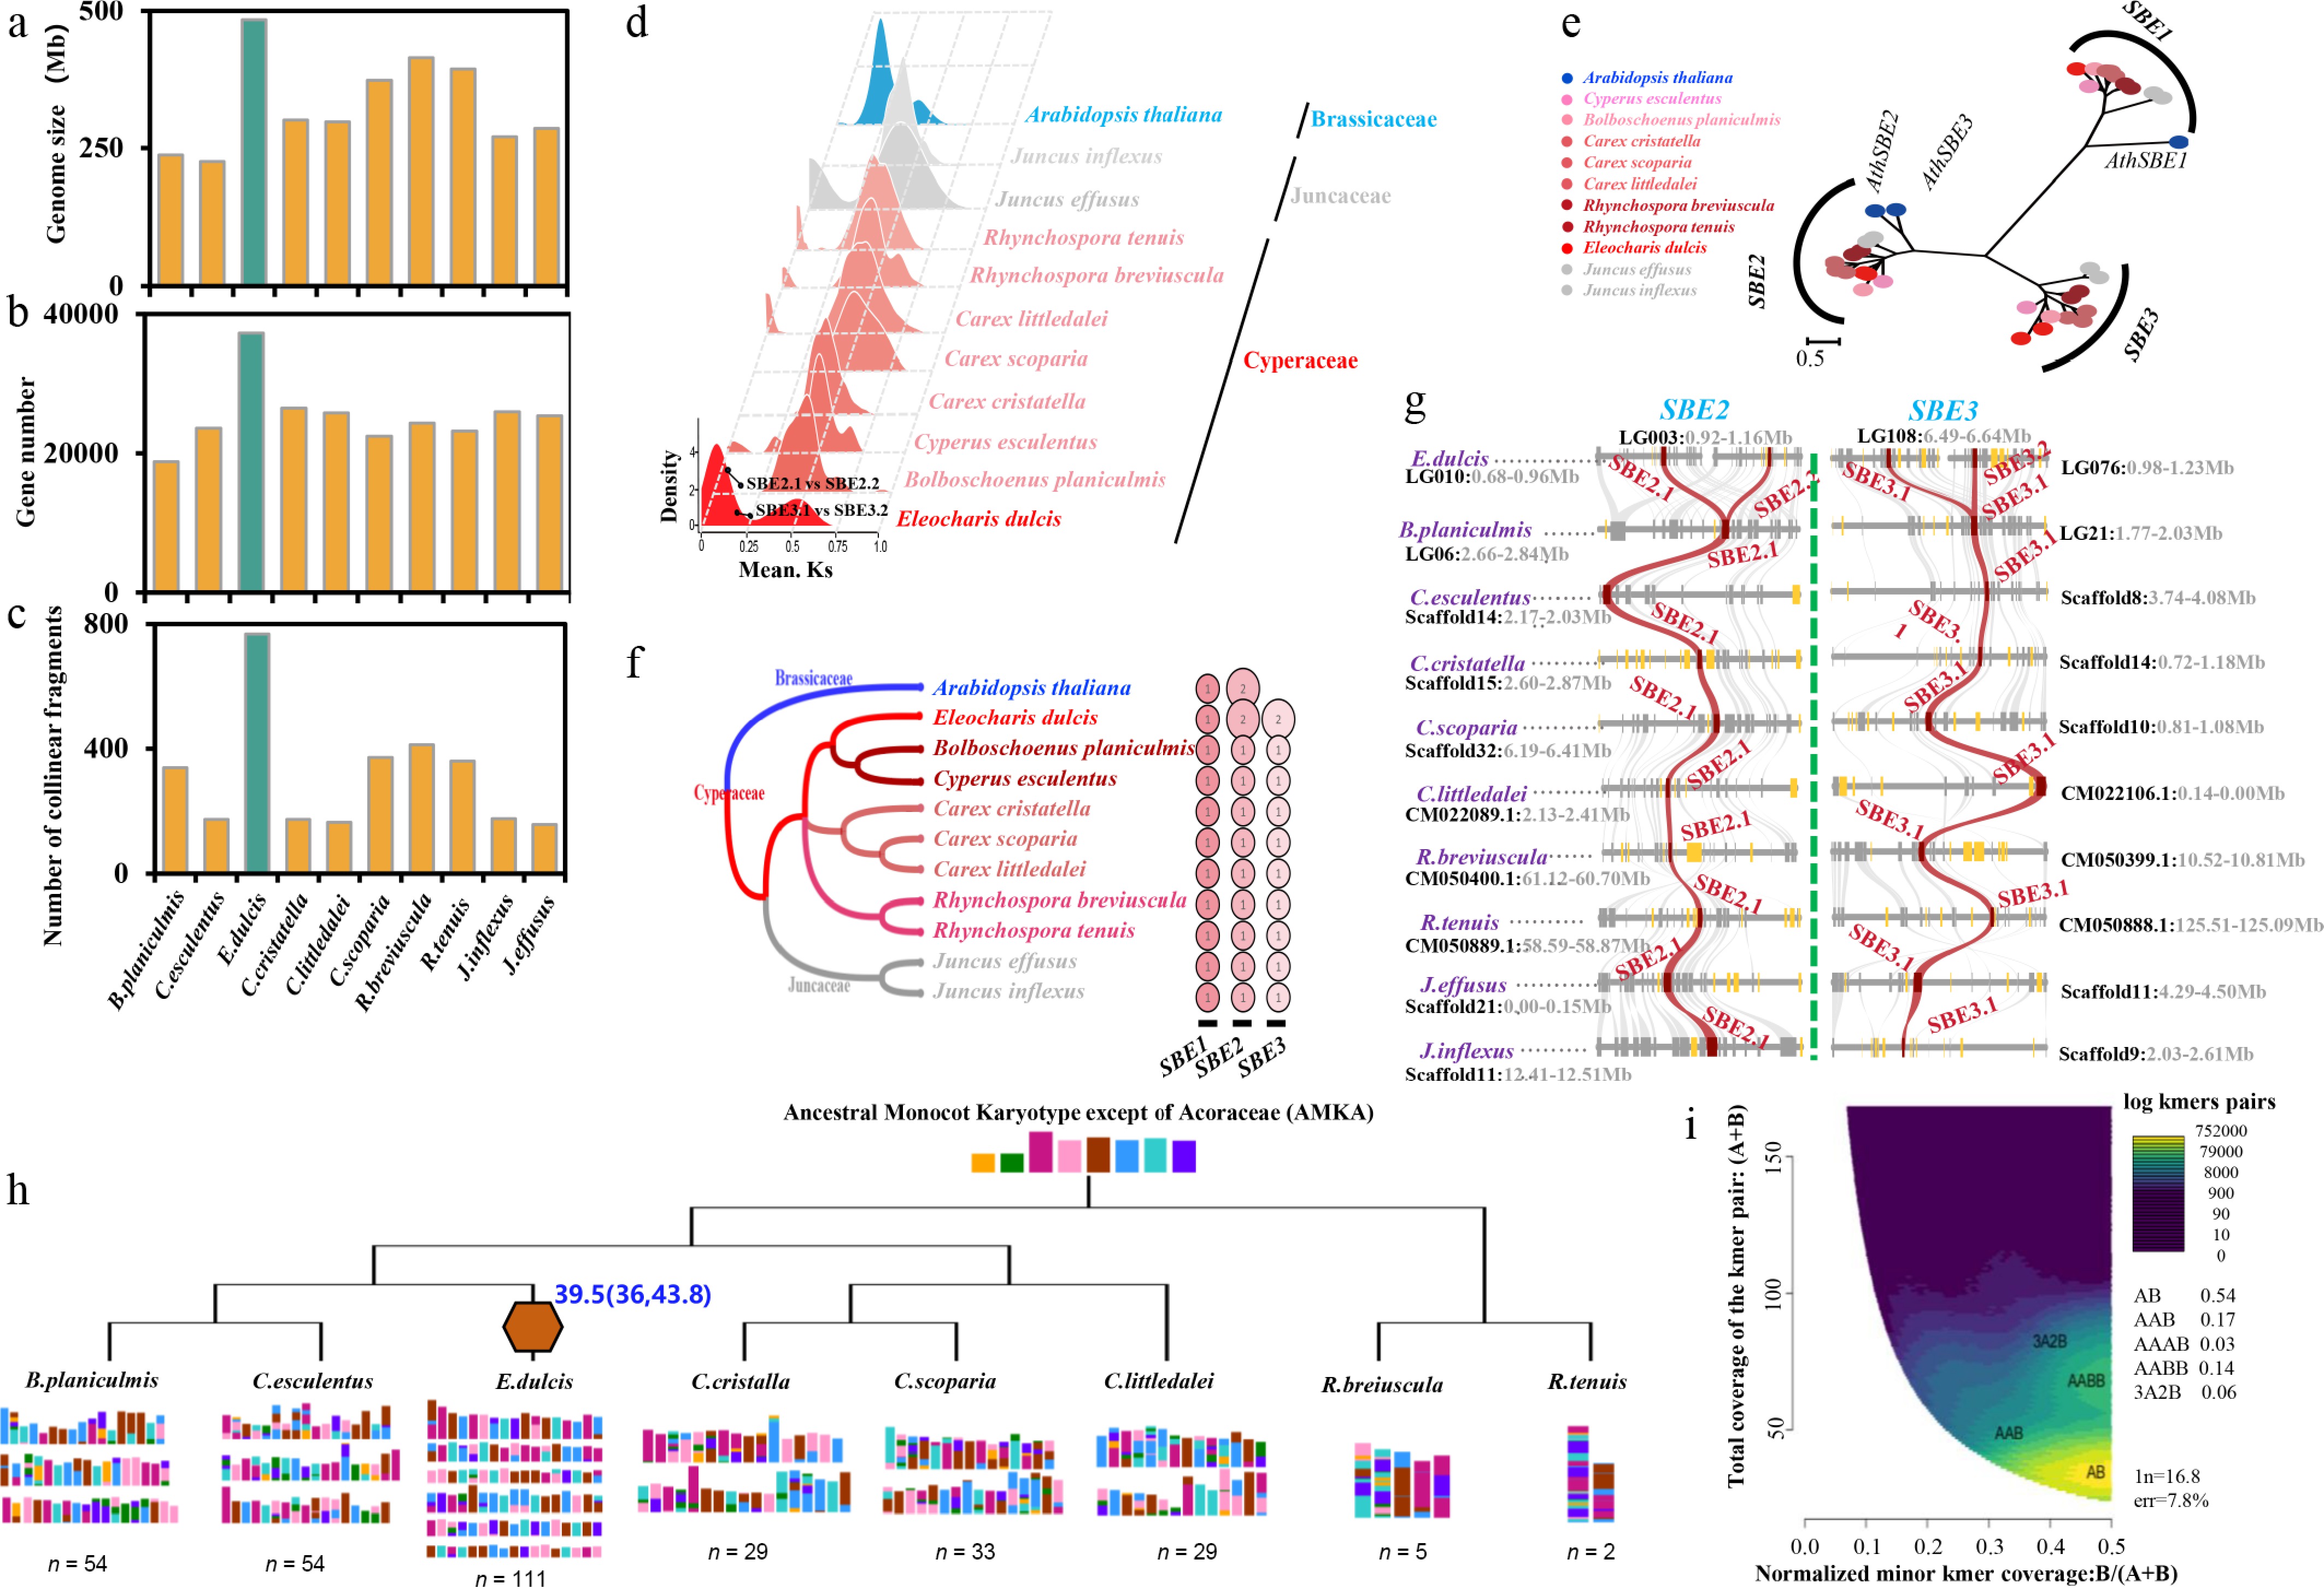
Figure 3.
Evidence for whole-genome duplication (WGD) in the E. dulcis genome. Comparison between E. dulcis and 10 closely related species in terms of (a) genome size, (b) gene number, (c) number of collinear fragments, and (d) whole-genome Ks values. Peaks represent potential whole-genome duplication events. (e) Phylogenetic analysis of the SBE gene family. Alignment of the amino acid sequences encoded by 34 SBE genes from Arabidopsis, nine Cyperaceae species, and two Juncaceae species using MAFFT. A phylogenetic tree was constructed using IQ-TREE 2 (1,000 bootstrap replicates). The analyzed SBE genes were regrouped into three subfamilies. (f) Number of members in SBE gene subfamilies. (g) Collinearity analysis of SBE2 and SBE3 in the E. dulcis genome and the genomes of 10 closely related species. The collinearity analysis was performed, and the generated data were visualized using MCScanX and JCVI (MCScanX Python version). Red lines indicate collinear relationships between SBE2 and SBE3 small cluster genes across genomes, whereas gray lines indicate collinear relationships of non-SBE genes. Genes in gold represent non-collinear genes. (h) Ideograms are based on the published chromosome-level genome assemblies and their origins reconstructed using the WGDI. Schematic phylogenetic relationships follow the phylogenetic analyses. Whole-genome duplications are marked by orange hexagons. (i) Smudgeplot-predicted genome group ploidy on the basis of 21-mers.
-
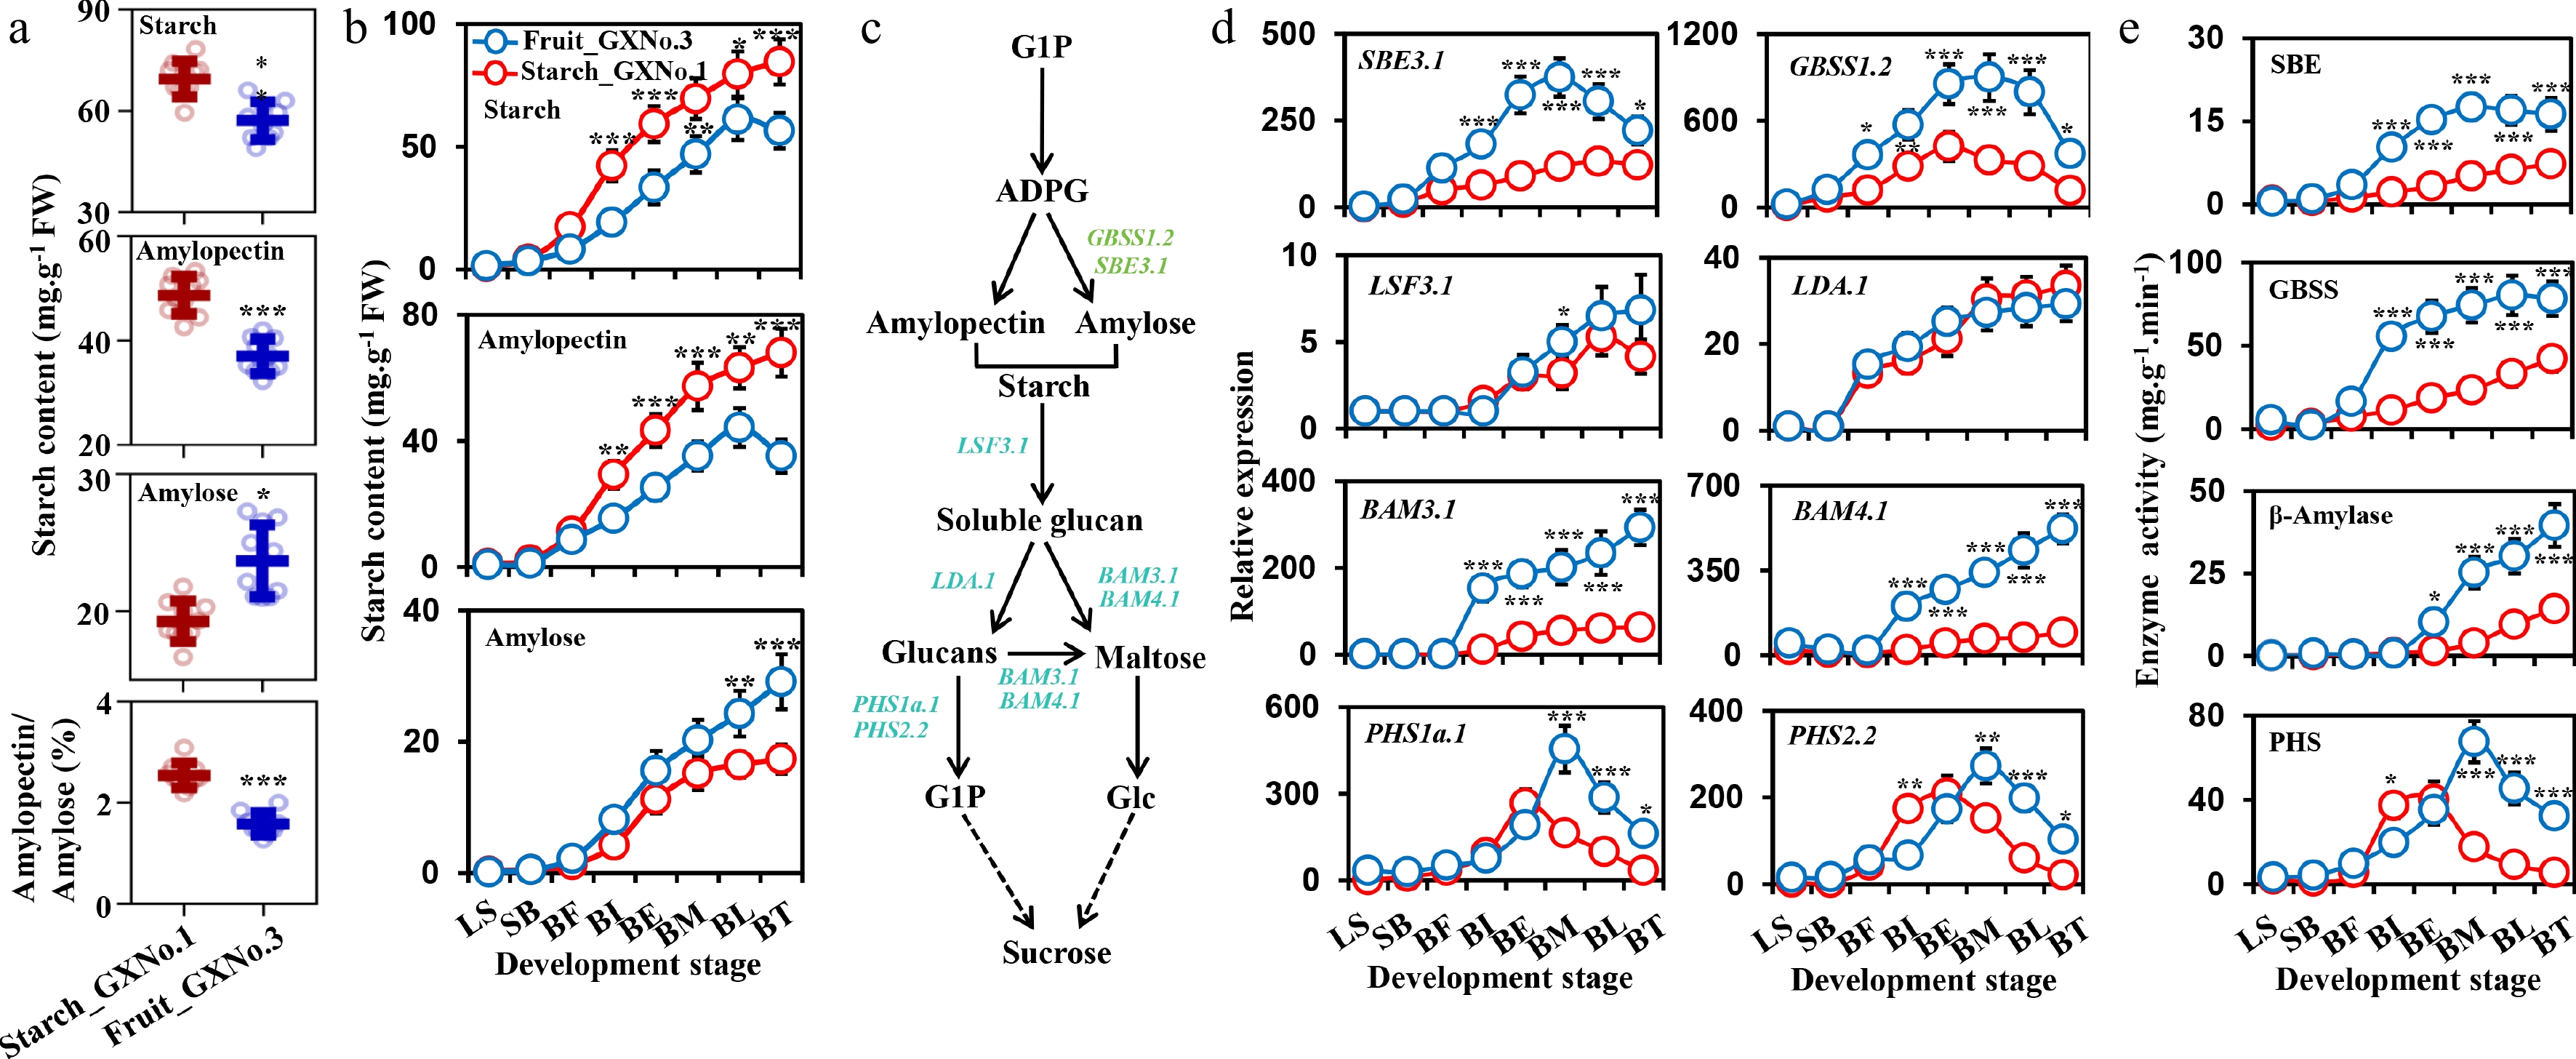
Figure 4.
Identification of starch composition and related metabolic genes in 'Starch_Gxno.1' and 'Fruit_Gxno.3' E. dulcis corms. (a) Comparison of total starch, amylopectin, and amylose contents and the amylopectin:amylose ratio between 'Starch_GXNo.1' and 'Fruit_GXNo.3' mature corms. Ten biological replicates were analyzed for each comparison. (b) Model of the accumulation of total starch, amylopectin, and amylose during 'Starch_GXNo.1' and 'Fruit_GXNo.3' corm growth and development. Ten biological replicates were analyzed for each developmental stage. (c) Diagram of starch metabolism pathways. Green and cyan genes are starch synthesis and starch degradation genes that were differentially expressed according to transcriptome data. (d) qRT-PCR analysis of differentially expressed candidate starch metabolism-related genes in the developing corms of two varieties. (e) Analysis of the activities of the enzymes encoded by the differentially expressed candidate starch metabolism-related genes in the developing corms of two varieties. Five biological replicates were analyzed for each developmental stage in panels (d) and (e). Data are presented as the mean ± SD for the biological replicates. *, **, and *** represent significant differences at p < 0.05, p < 0.01, and p < 0.001, respectively, according to Tukey's multiple comparisons test after ANOVA.
-
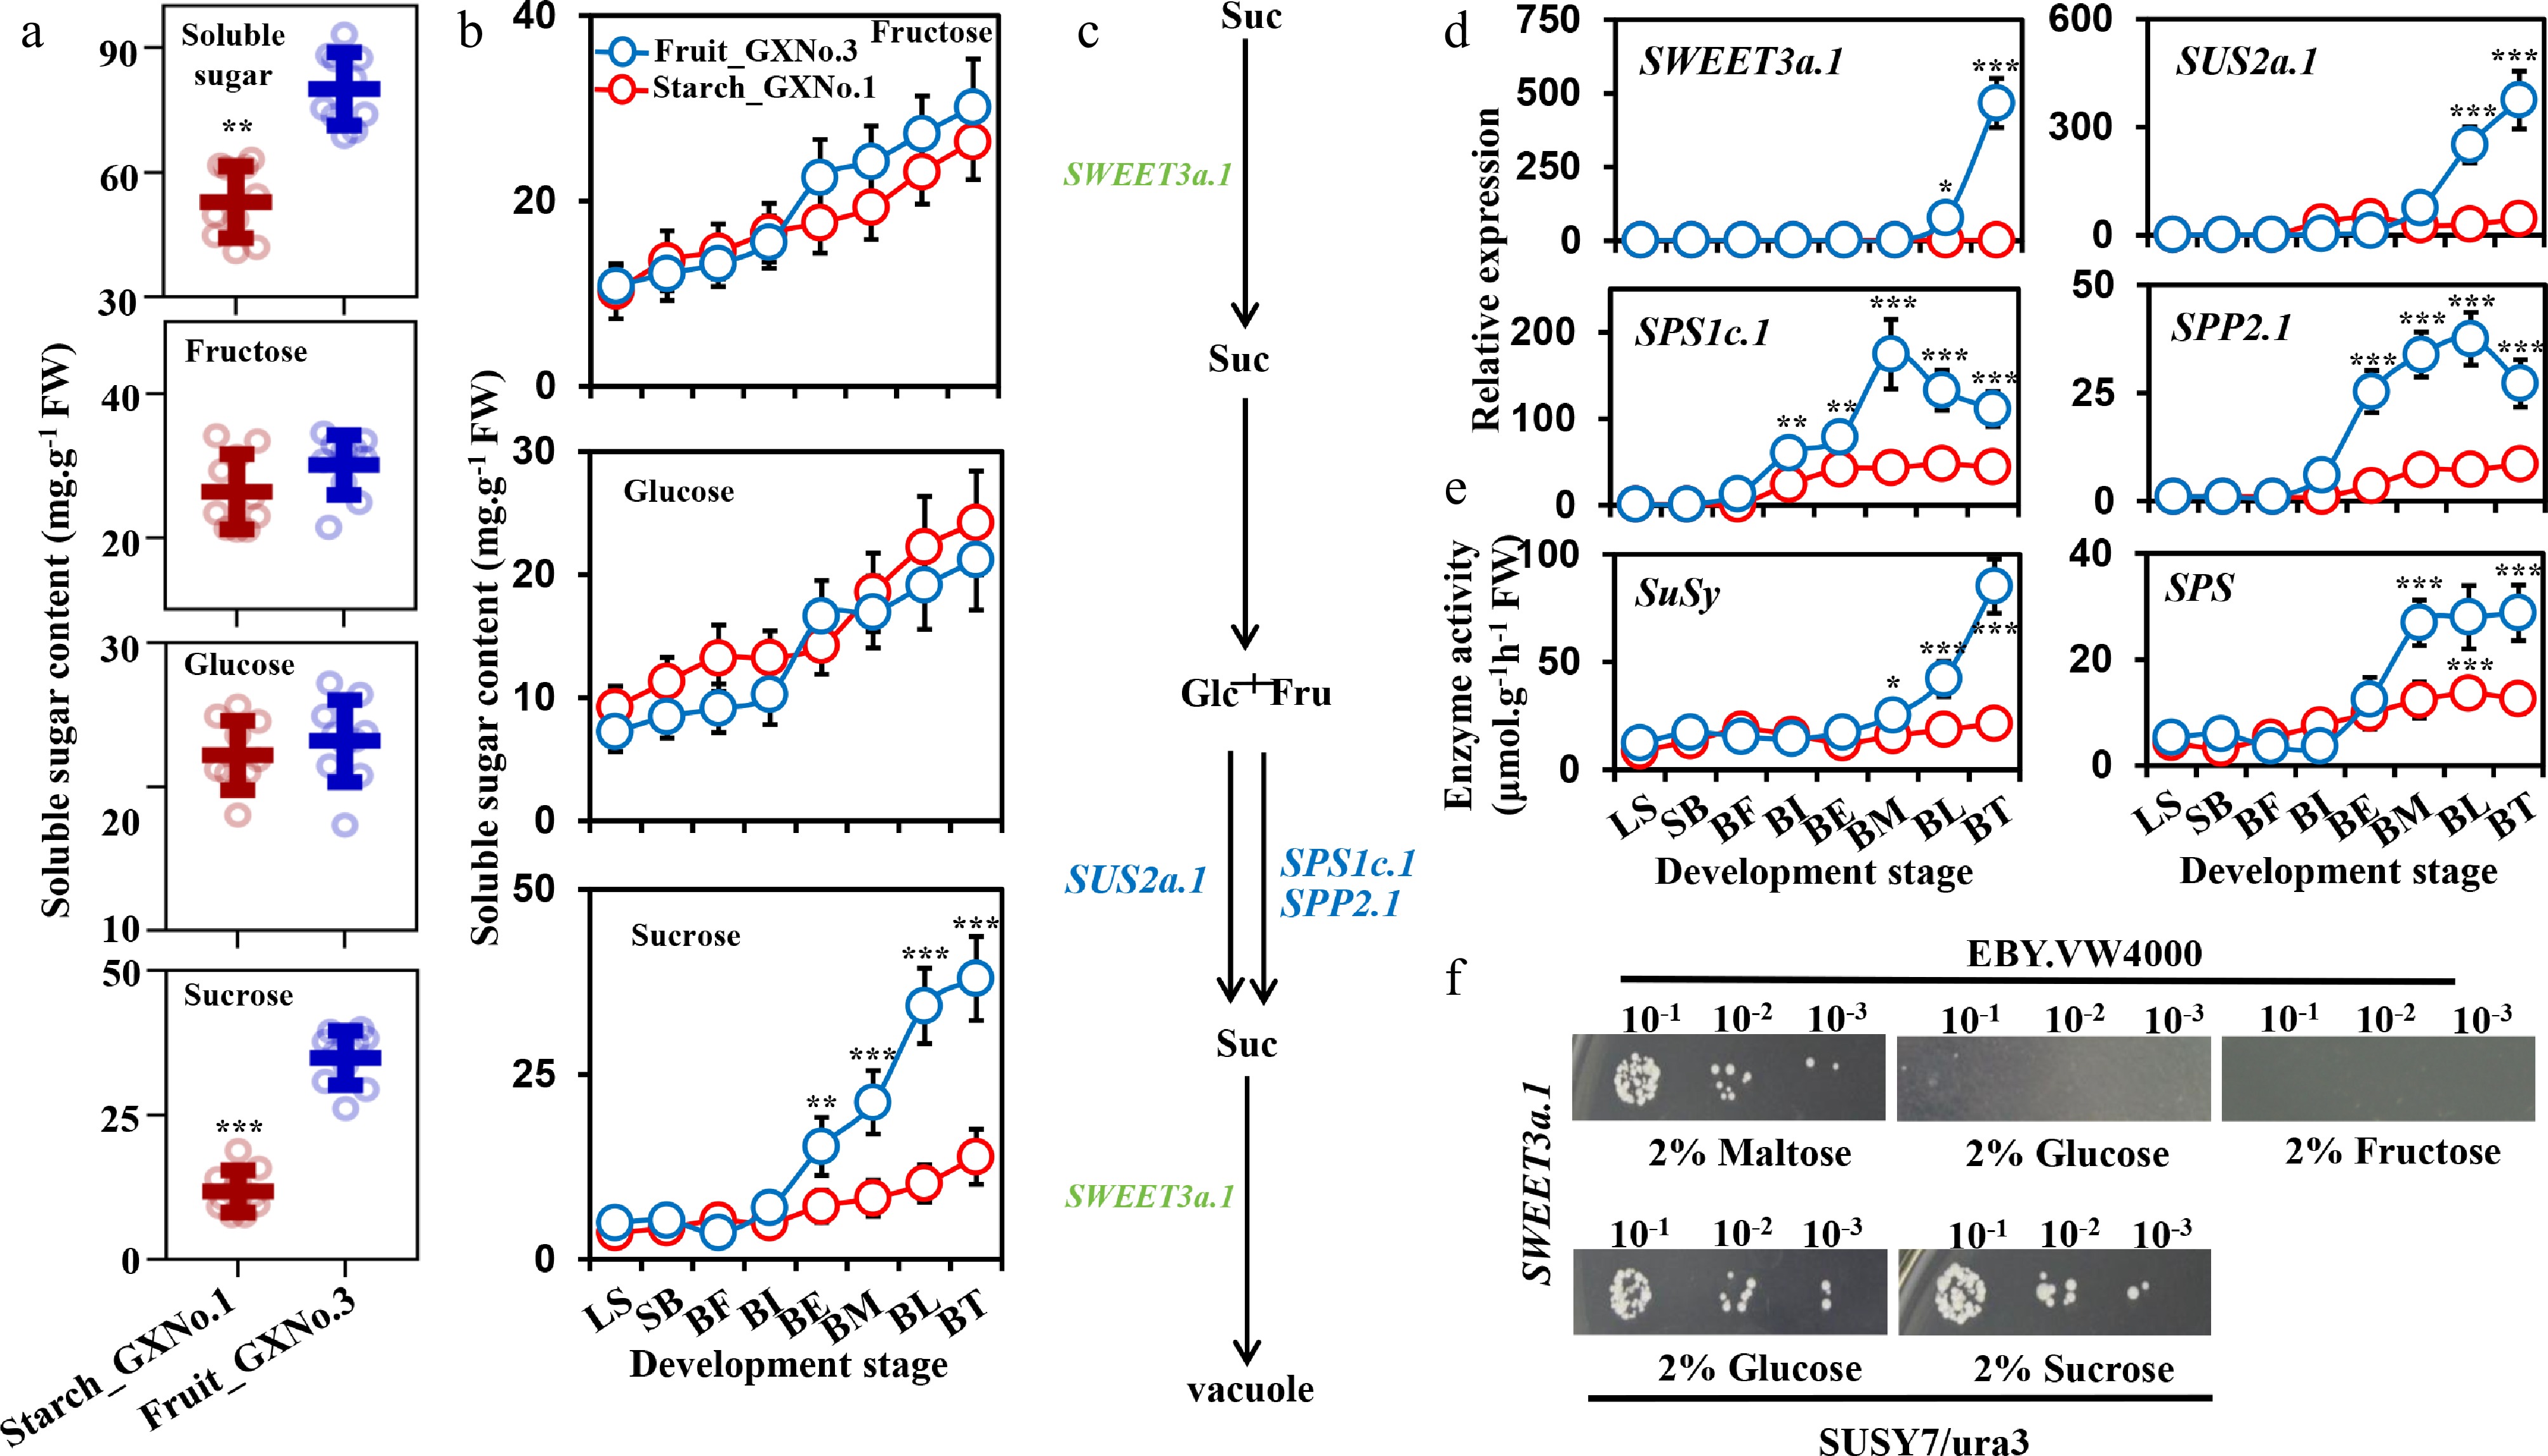
Figure 5.
Identification of sugar composition and related metabolic genes in 'Starch_Gxno.1' and 'Fruit_Gxno.3' E. dulcis corms. (a) Quantification of soluble sugars, including fructose, glucose, and sucrose, in mature corms of 'Starch_GXNo.1' and 'Fruit_GXNo.3'. Ten biological replicates were analyzed for each comparison. (b) Model depicting the accumulation patterns of fructose, glucose, and sucrose during the growth and development of corms in the two varieties. Ten biological replicates were analyzed at each developmental stage. (c) Diagram of the sucrose metabolism pathway. Genes highlighted in green and blue represent differentially expressed genes involved in sucrose transport and synthesis, respectively, as revealed by transcriptomic analysis. (d) qRT-PCR analysis of selected differentially expressed sucrose metabolism-related genes in developing corms of the two varieties. (e) Enzyme activity assays of the proteins encoded by the differentially expressed sucrose metabolism-related genes in developing corms of the two varieties. Five biological replicates were analyzed at each developmental stage in panels (d) and (e). Data are presented as mean ± SD of biological replicates. Asterisks (*, **, ***) denote statistically significant differences at p < 0.05, p < 0.01, and p < 0.001, respectively, based on Tukey's multiple comparisons test following ANOVA. (f) Functional analysis of SWEET3a.1 in yeast. Complementation of the hexose transporter-deficient yeast mutant strain EBY.VW4000 on SD/−Ura medium supplemented with 2% maltose, 2% glucose, or 2% fructose. Complementation of the sucrose transporter-deficient yeast mutant SUSY7/ura3 on SD/−Ura medium supplemented with 2% glucose or 2% sucrose. Numbers indicate serial dilutions (10-, 100-, and 1,000-fold) of the yeast suspension.
-
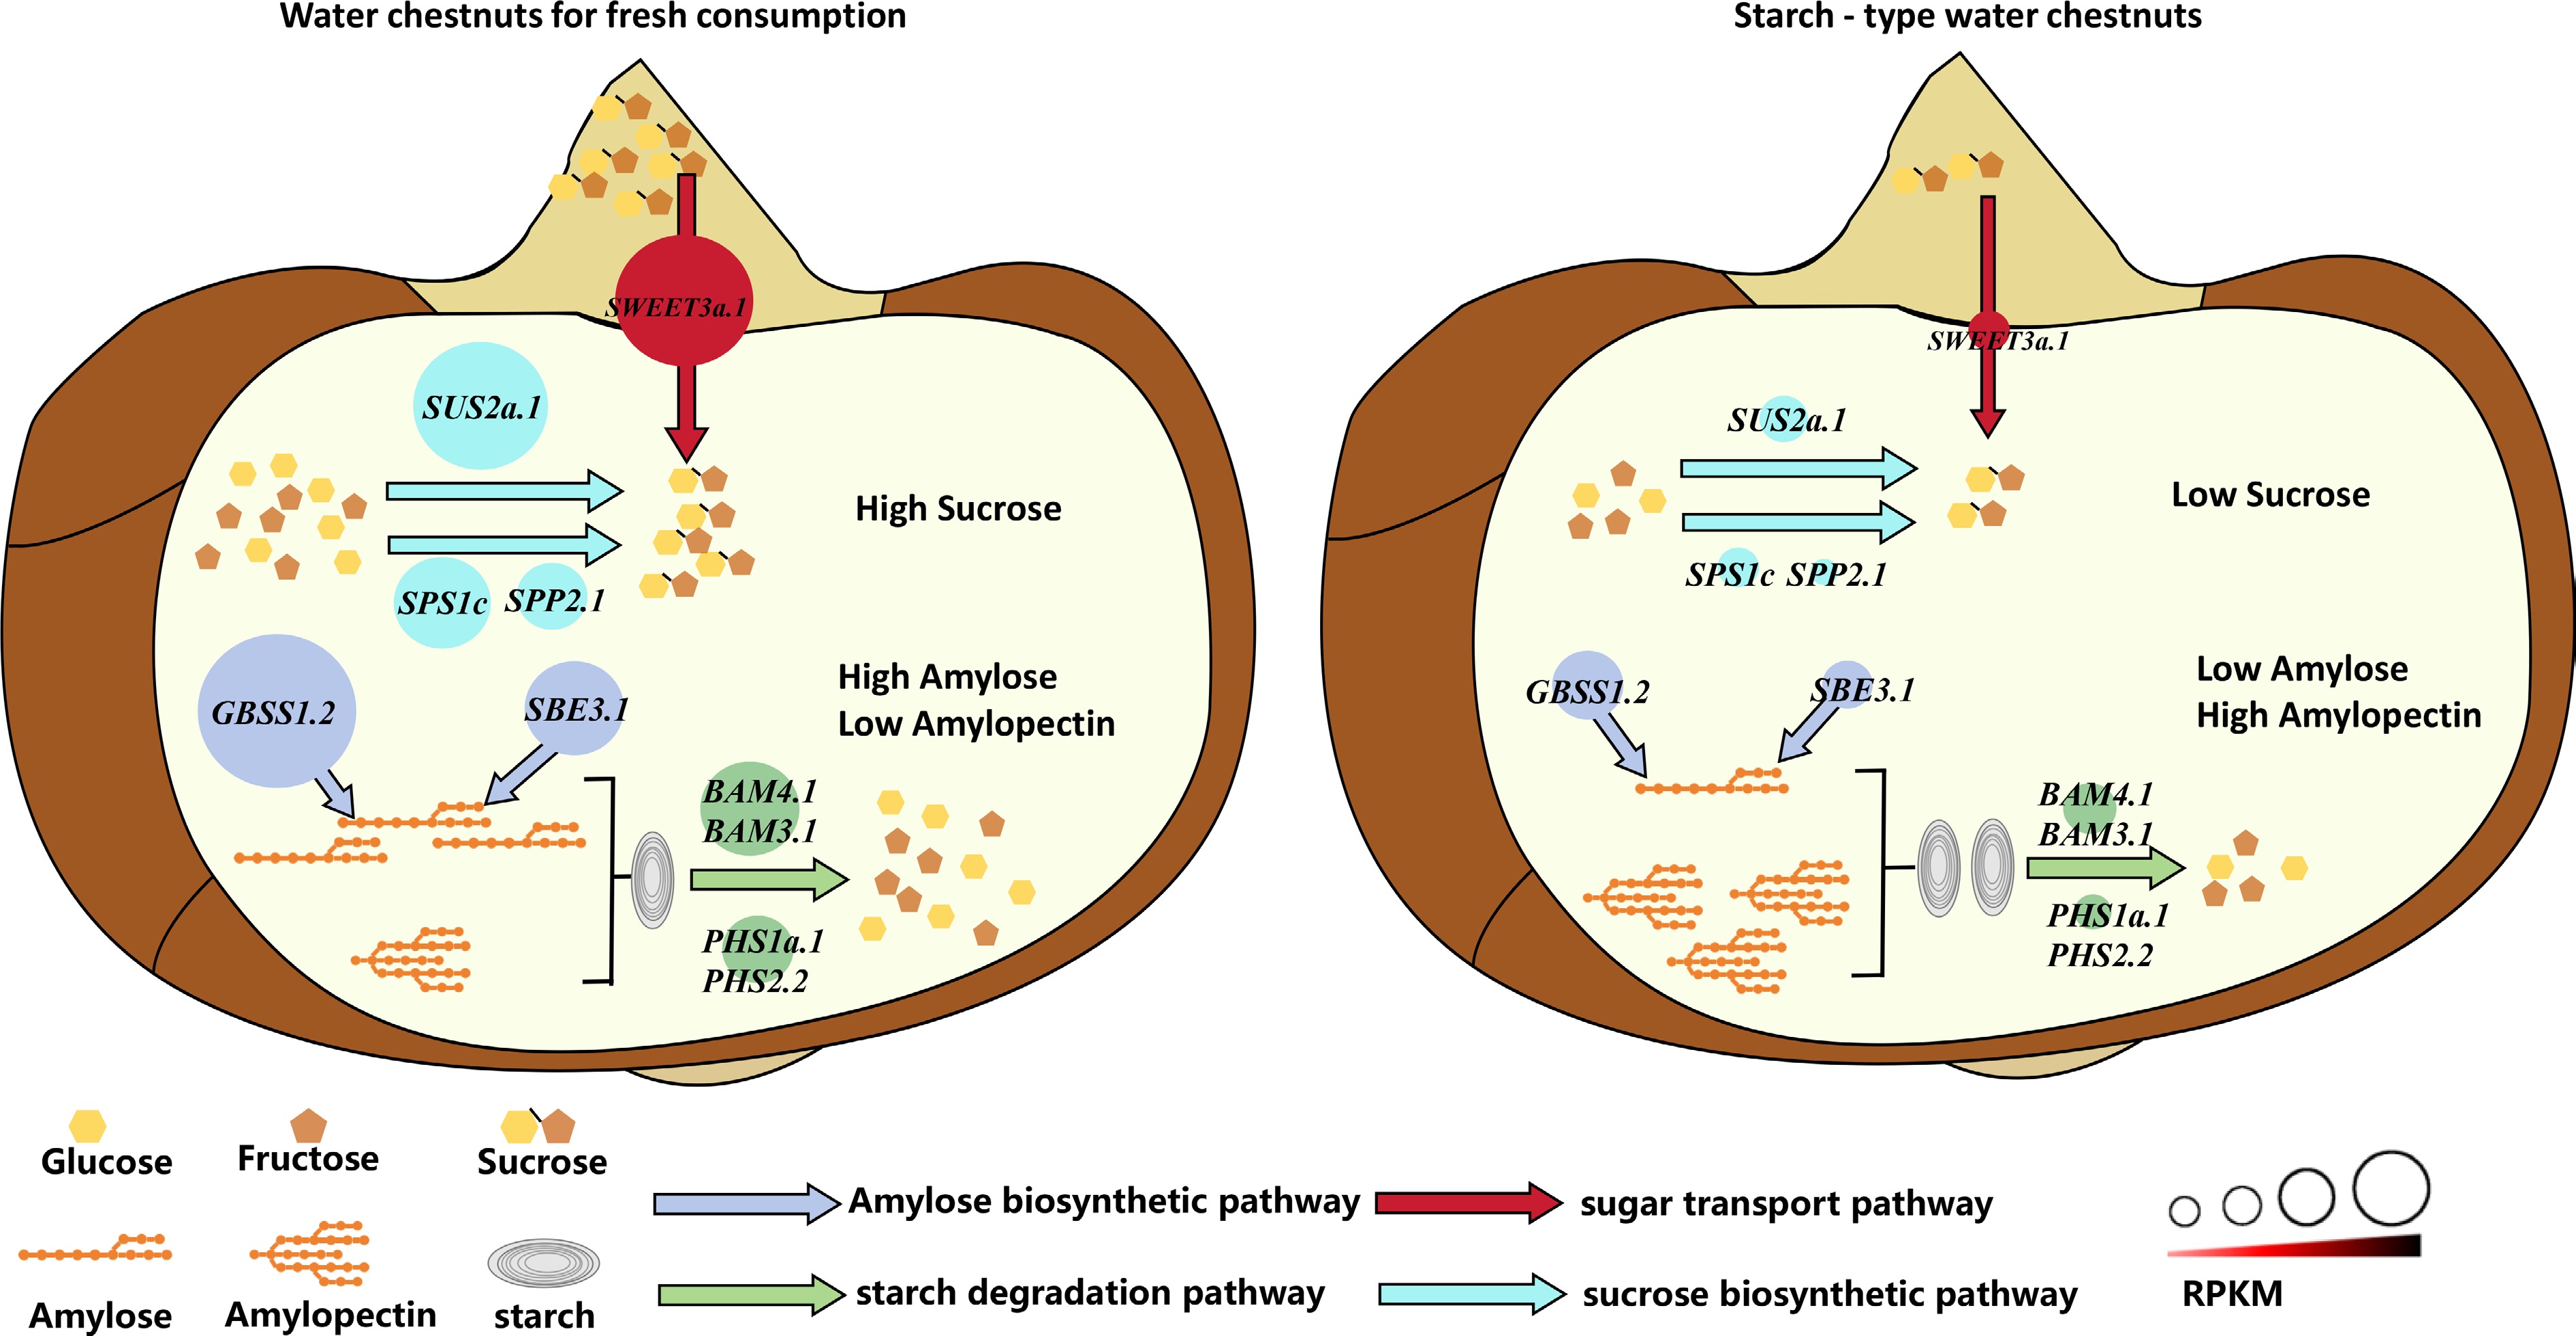
Figure 6.
Proposed model for quality formation in fresh fruit-type and starch-type E. dulcis corms. The high expression of amylose synthesis-related genes (GBSS1.2 and SBE3.1), starch degradation-related genes (BAM3.1, BAM4.1, PHS1a.1, and PHS2.2), the sucrose transporter gene (SWEET3a.1), and sucrose synthesis-related genes (SUS2a.1, SPS1c, and SPP2.1) plays a crucial role in the development of crisp and sweet fresh E. dulcis corms.
-
Species Eleocharis dulcis Sequence Numble of contig 212 Maximum contig (bp) 6,537,962 Minimum contig (bp) 12,550 Contig N50 size (bp) 3,736,102 Contig N90 size (bp) 1,569,949 Contig total length (bp) 483,951,997 GC content (%) 33.42 Pseudochromosome Number 111 Anchored rate (%) 99.18 Size range (bp) 728,420–8,635,493 Assembly size (bp) 479,996,839 Table 1.
Statistics of the genome assembly for Eleocharis dulcis.
Figures
(6)
Tables
(1)