-
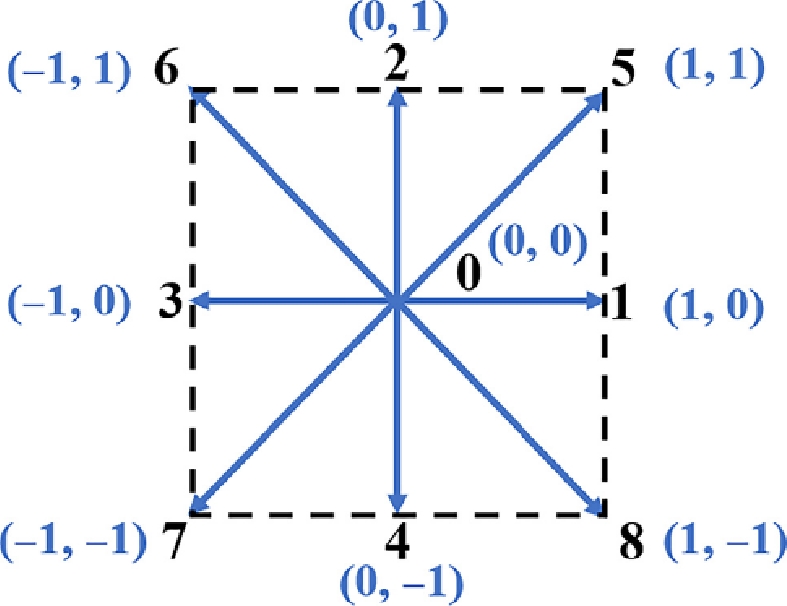
Figure 1.
Discrete velocity vectors of the D2Q9 model.
-
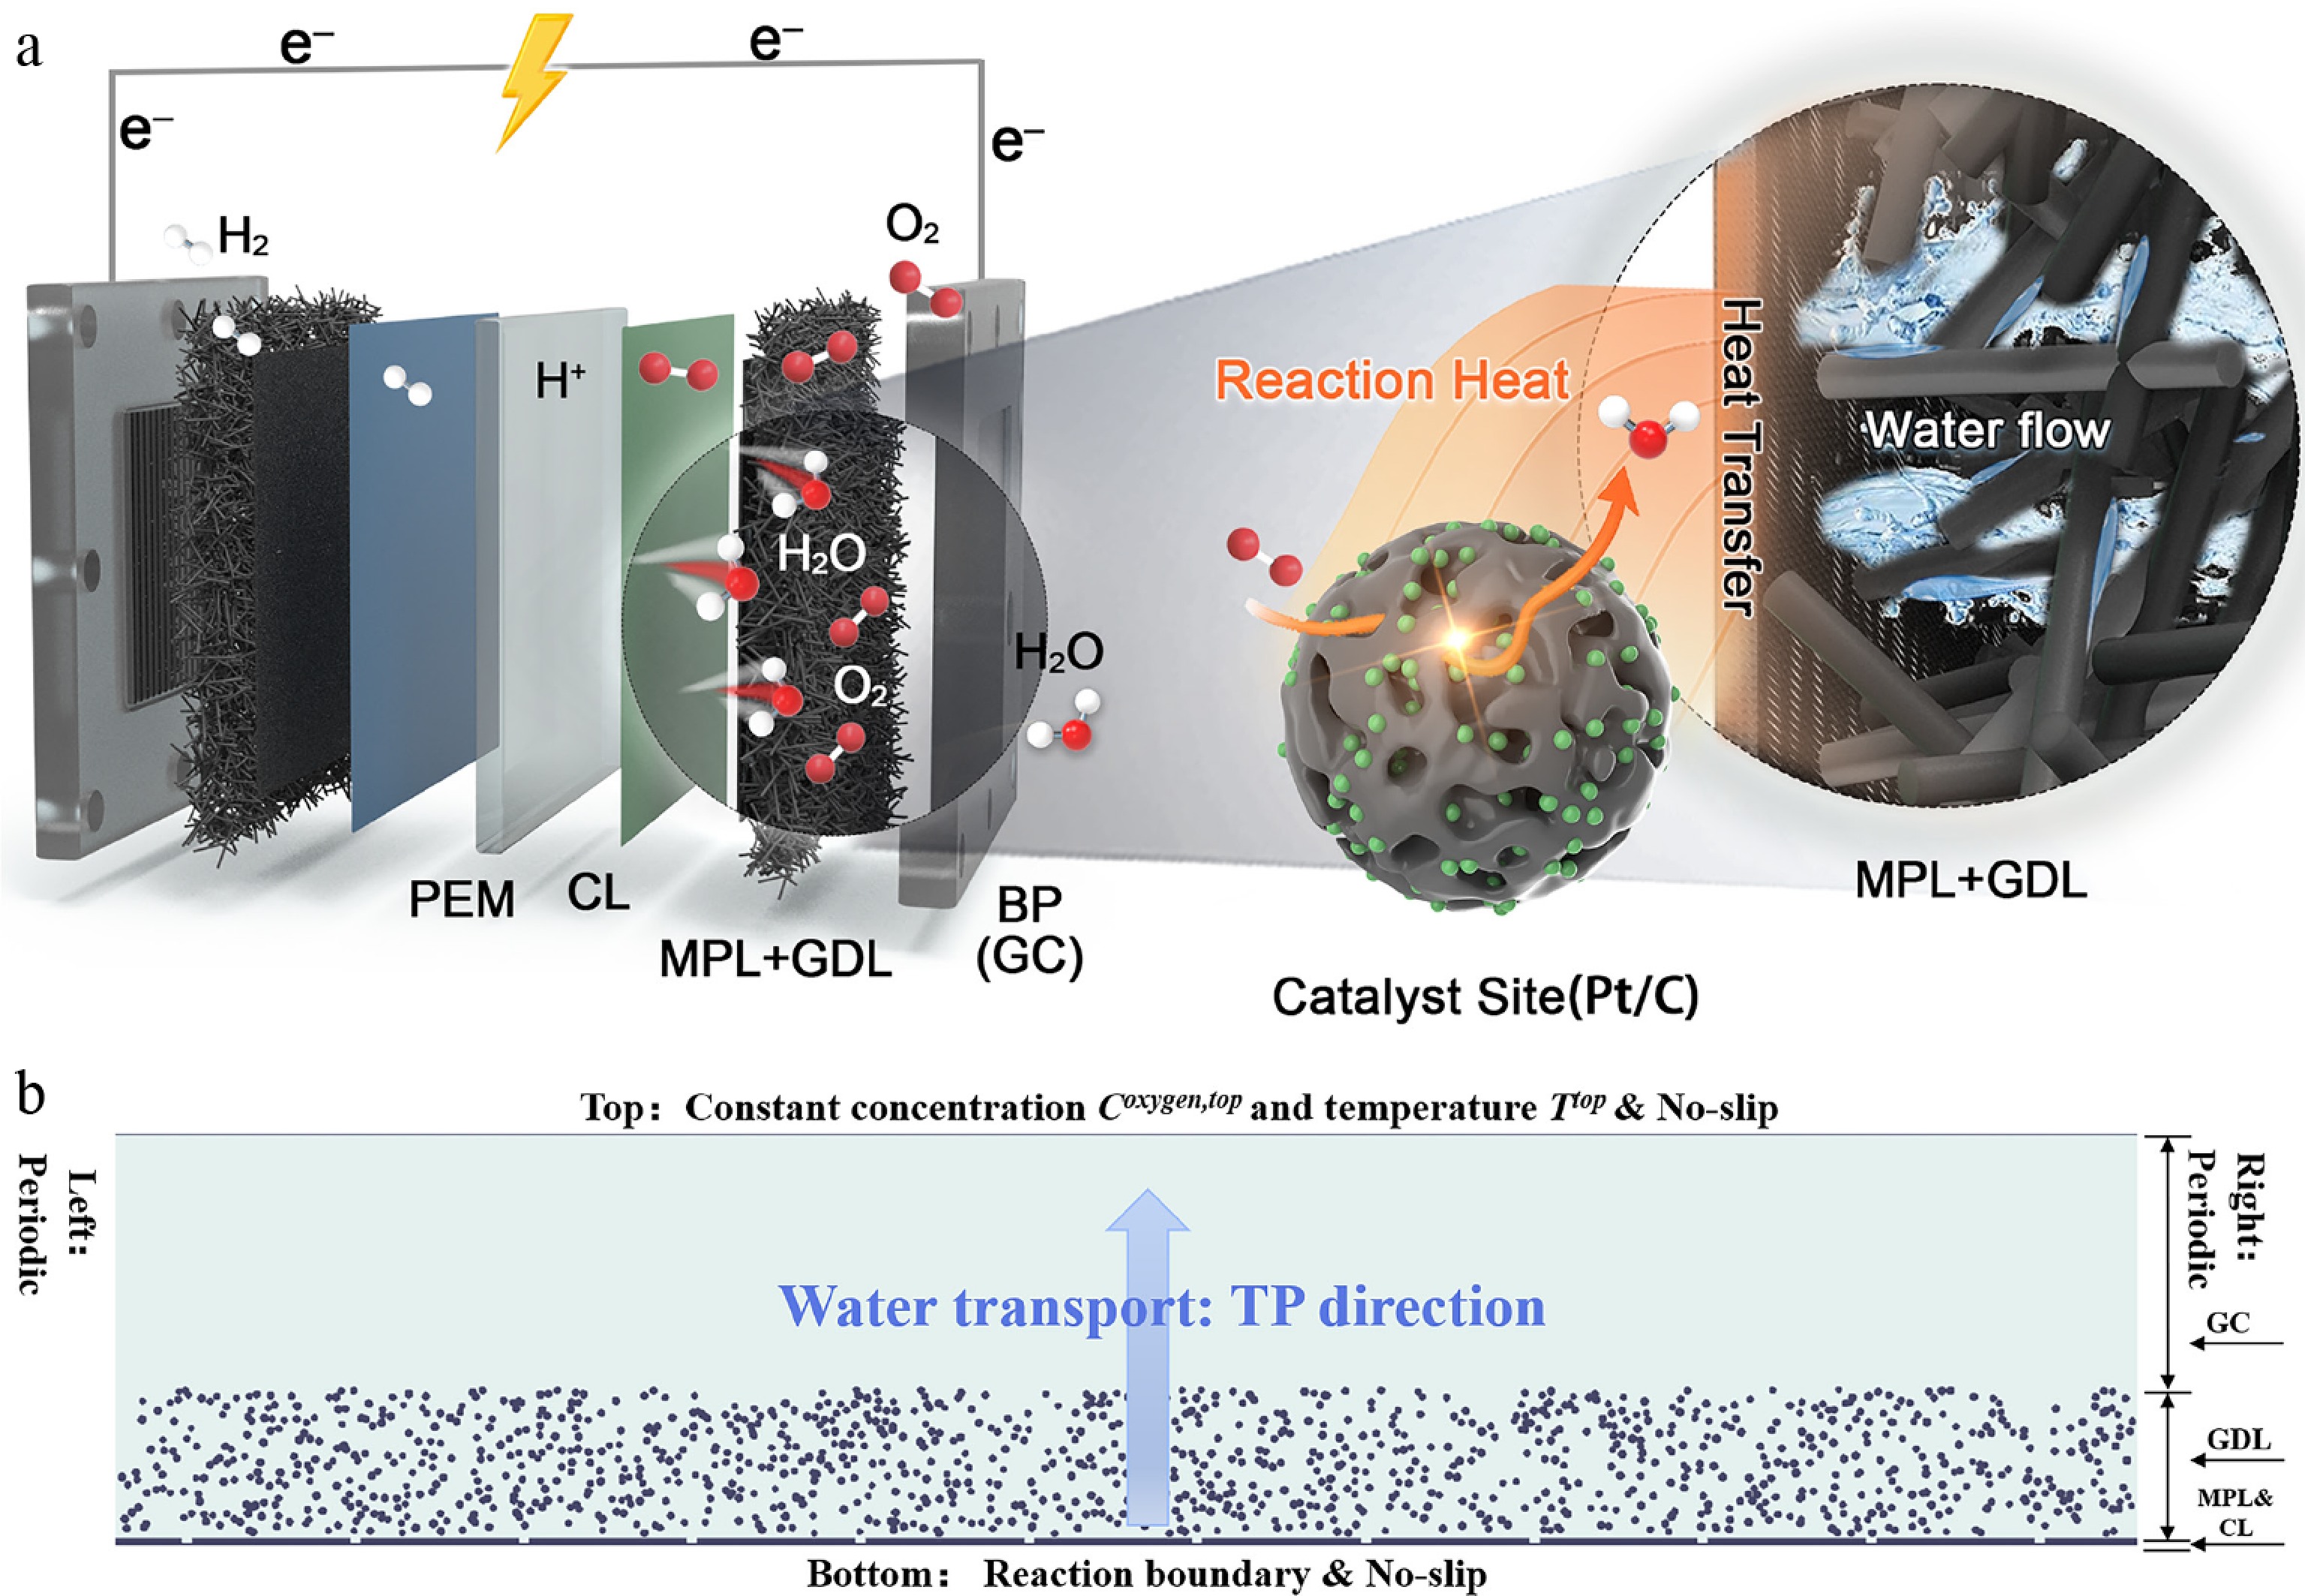
Figure 2.
(a) Schematic of PEMFC operation; (b) structure of the computational domain.
-
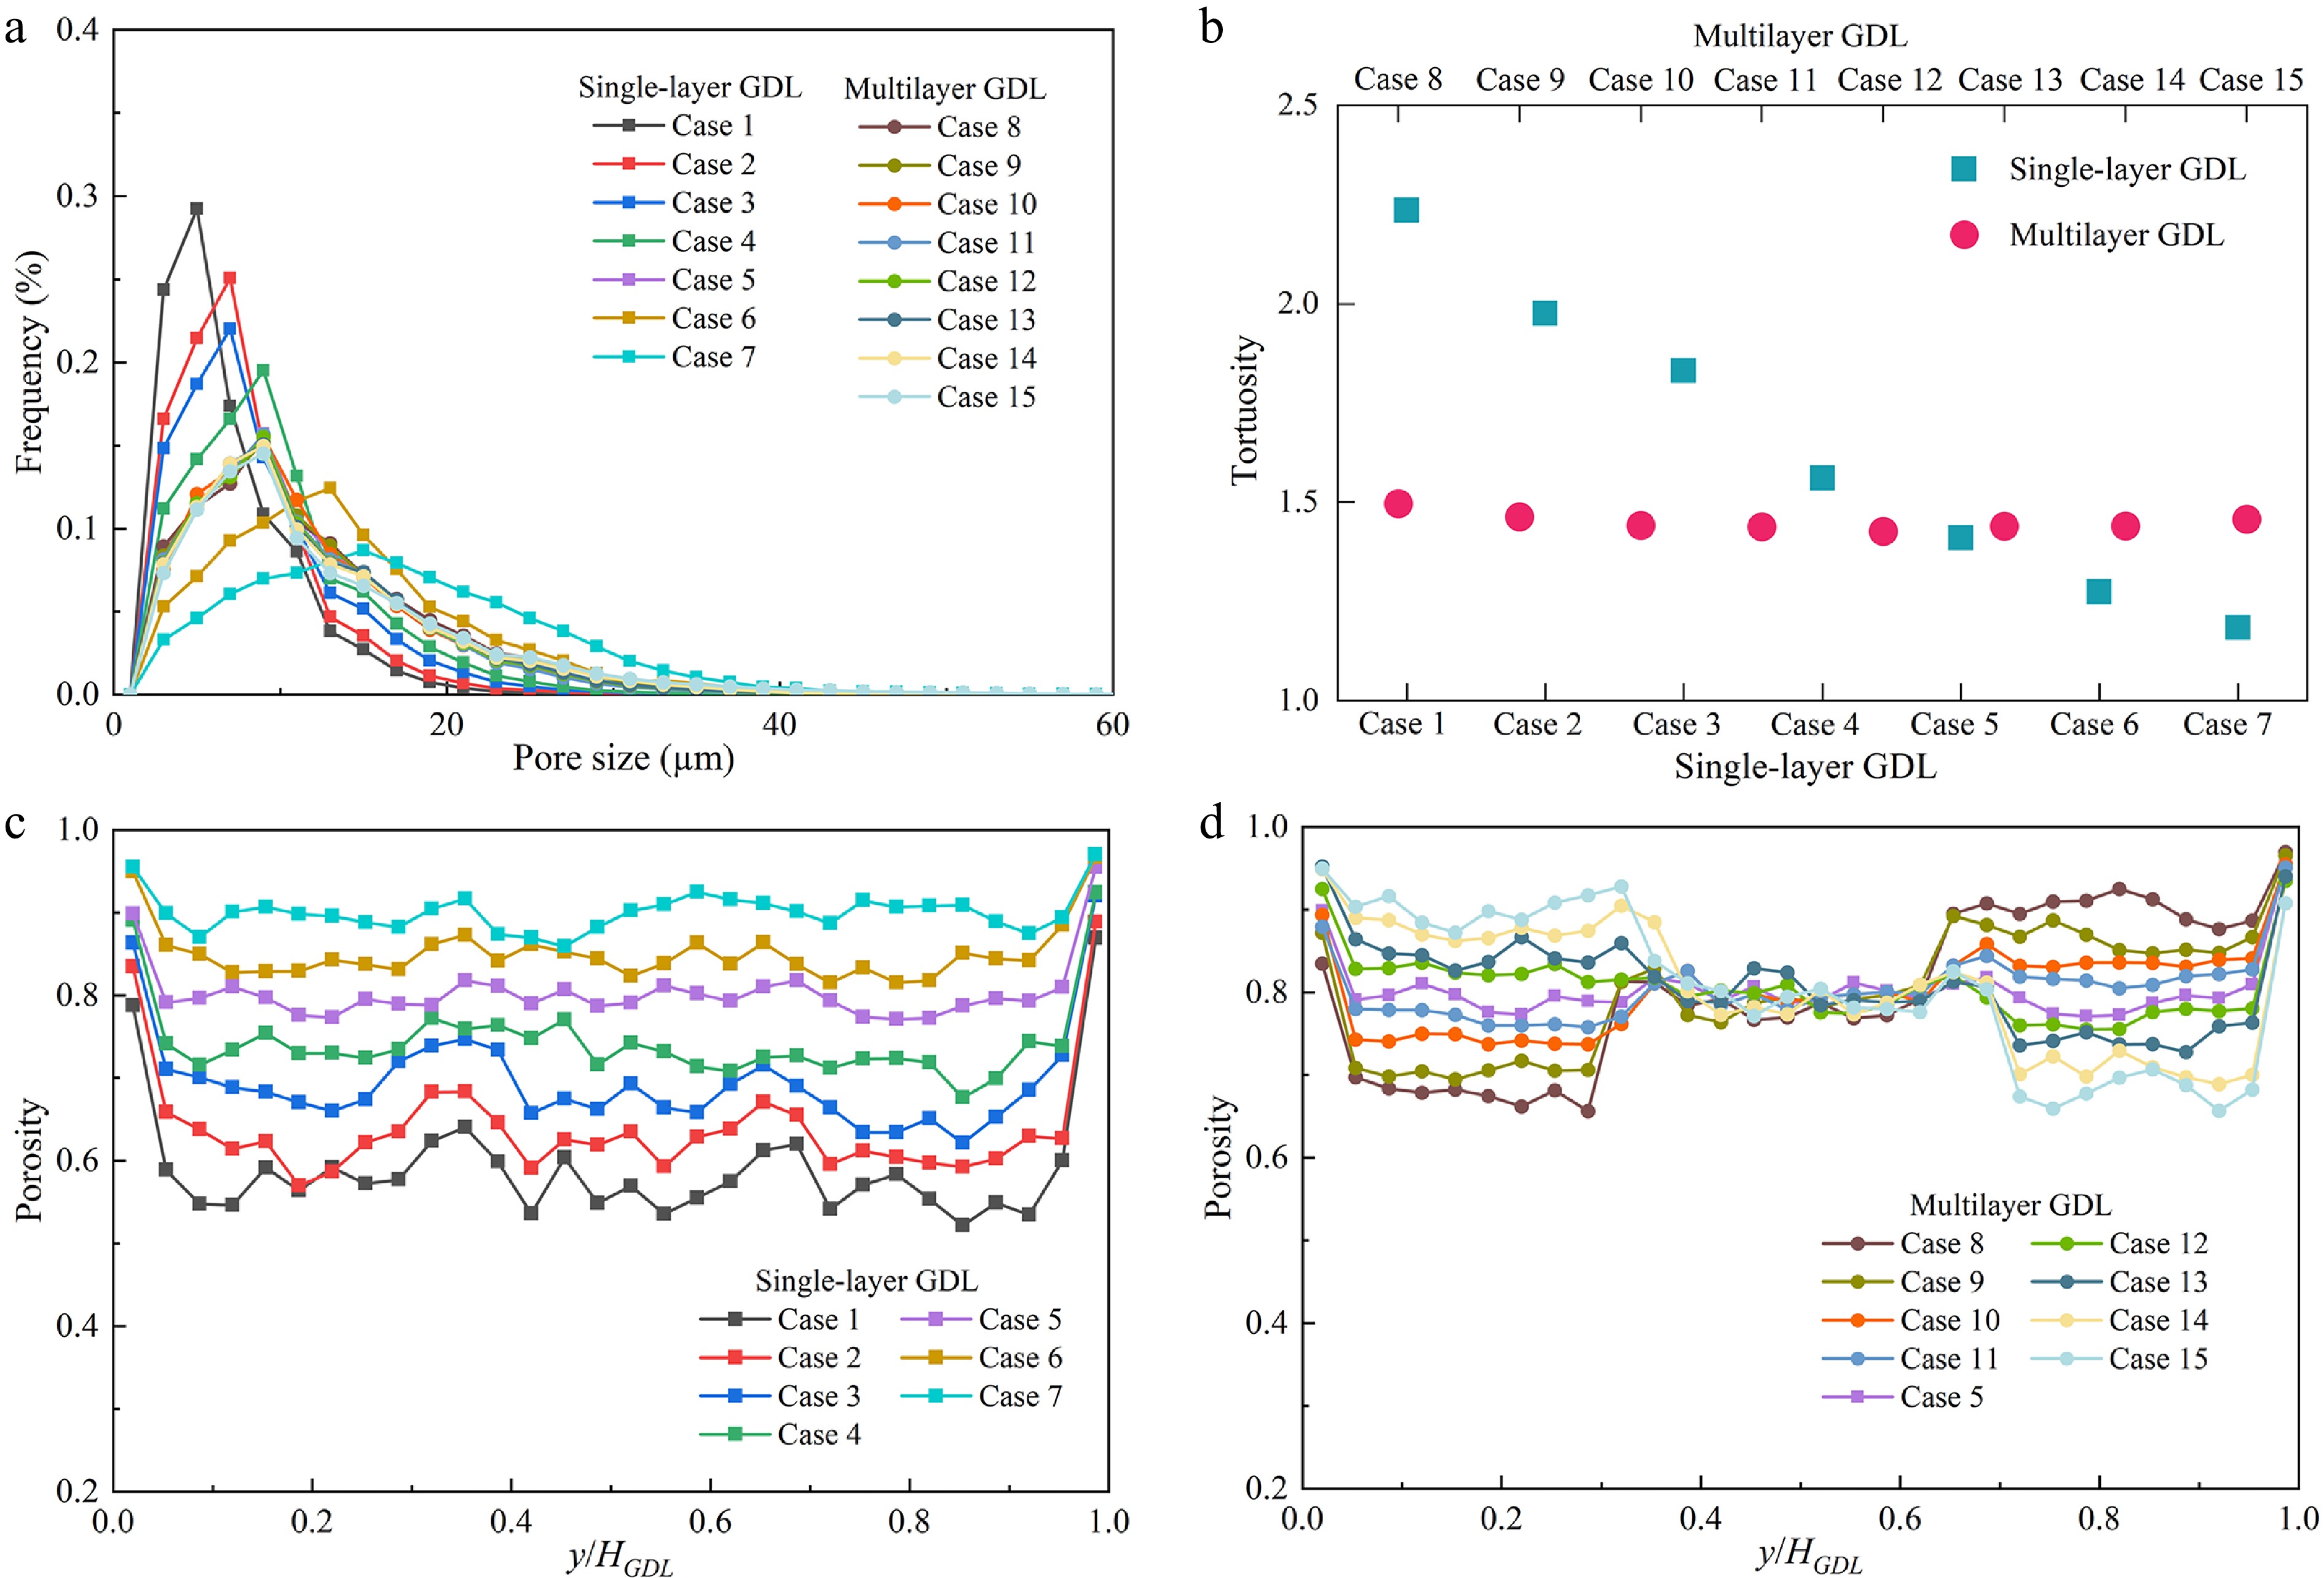
Figure 3.
(a) Pore size distribution, and (b) tortuosity for different cases; TP porosity distributions for (c) single-layer GDLs, and (d) multilayer GDLs with varying porosities.
-
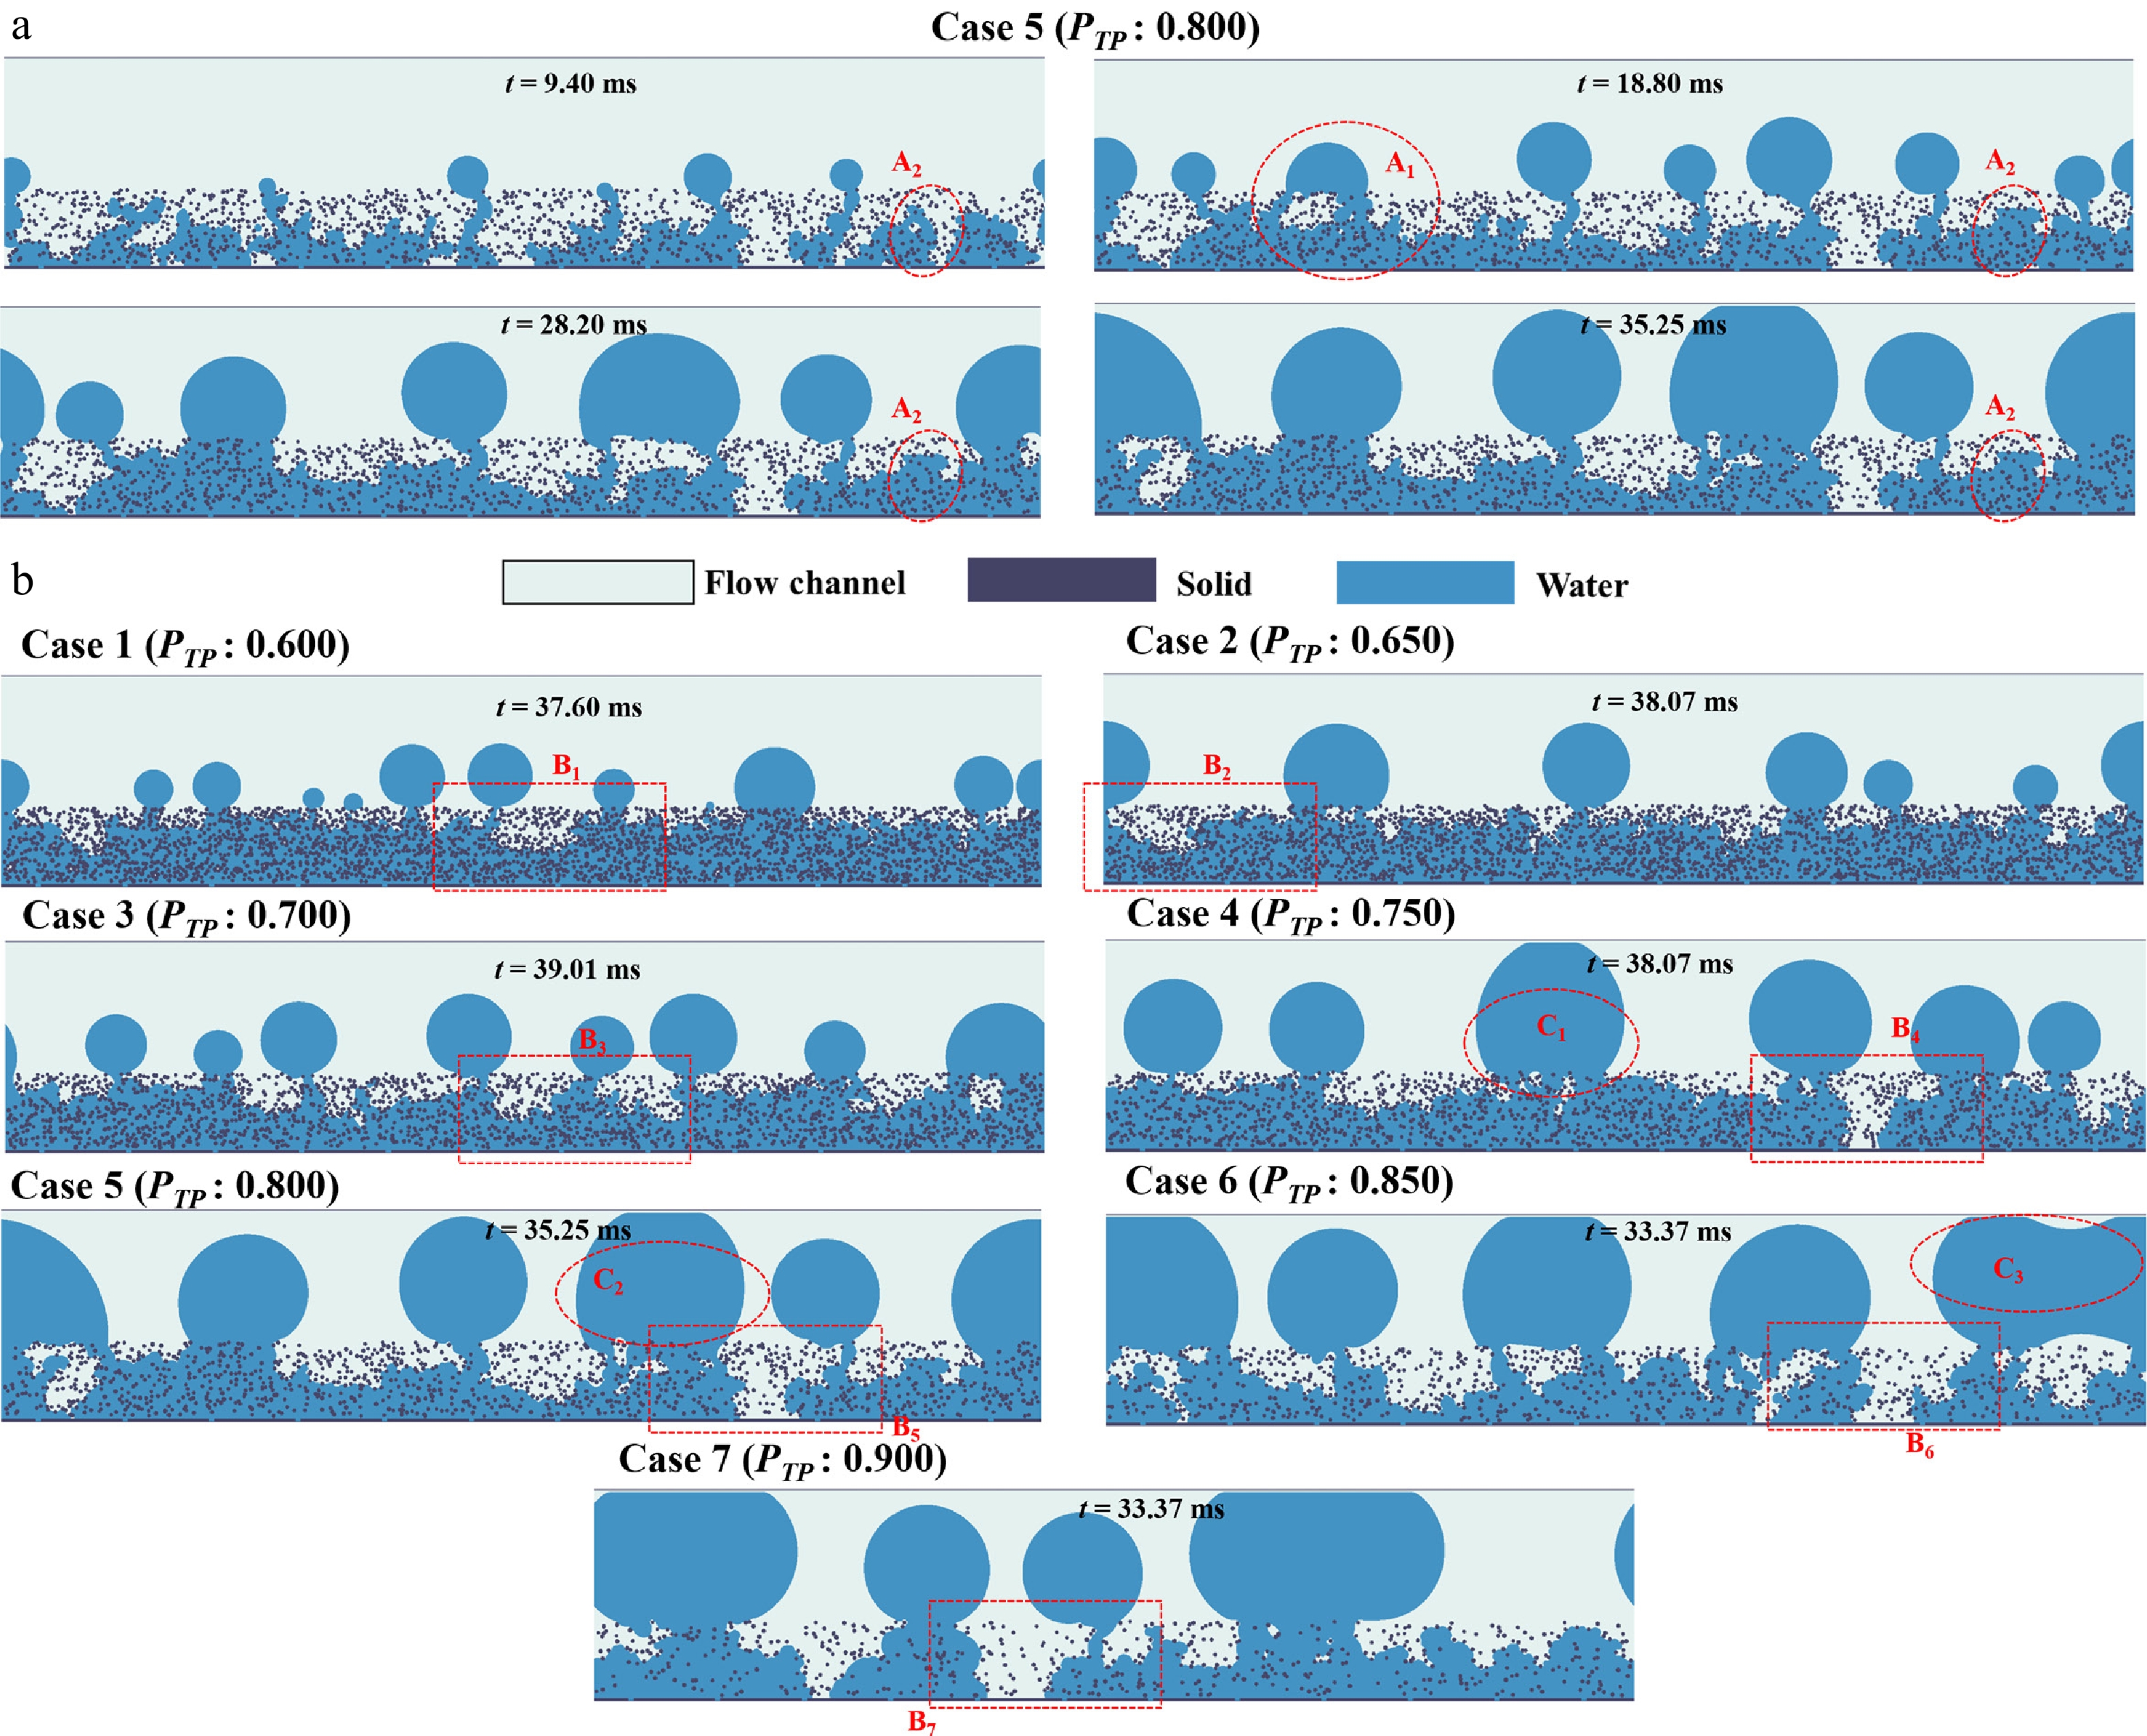
Figure 4.
Evolution of water flow characteristics in (a) a single-layer GDL with porosity 0.800 and (b) Cases 1–7 with varying single-layer GDL porosities.
-
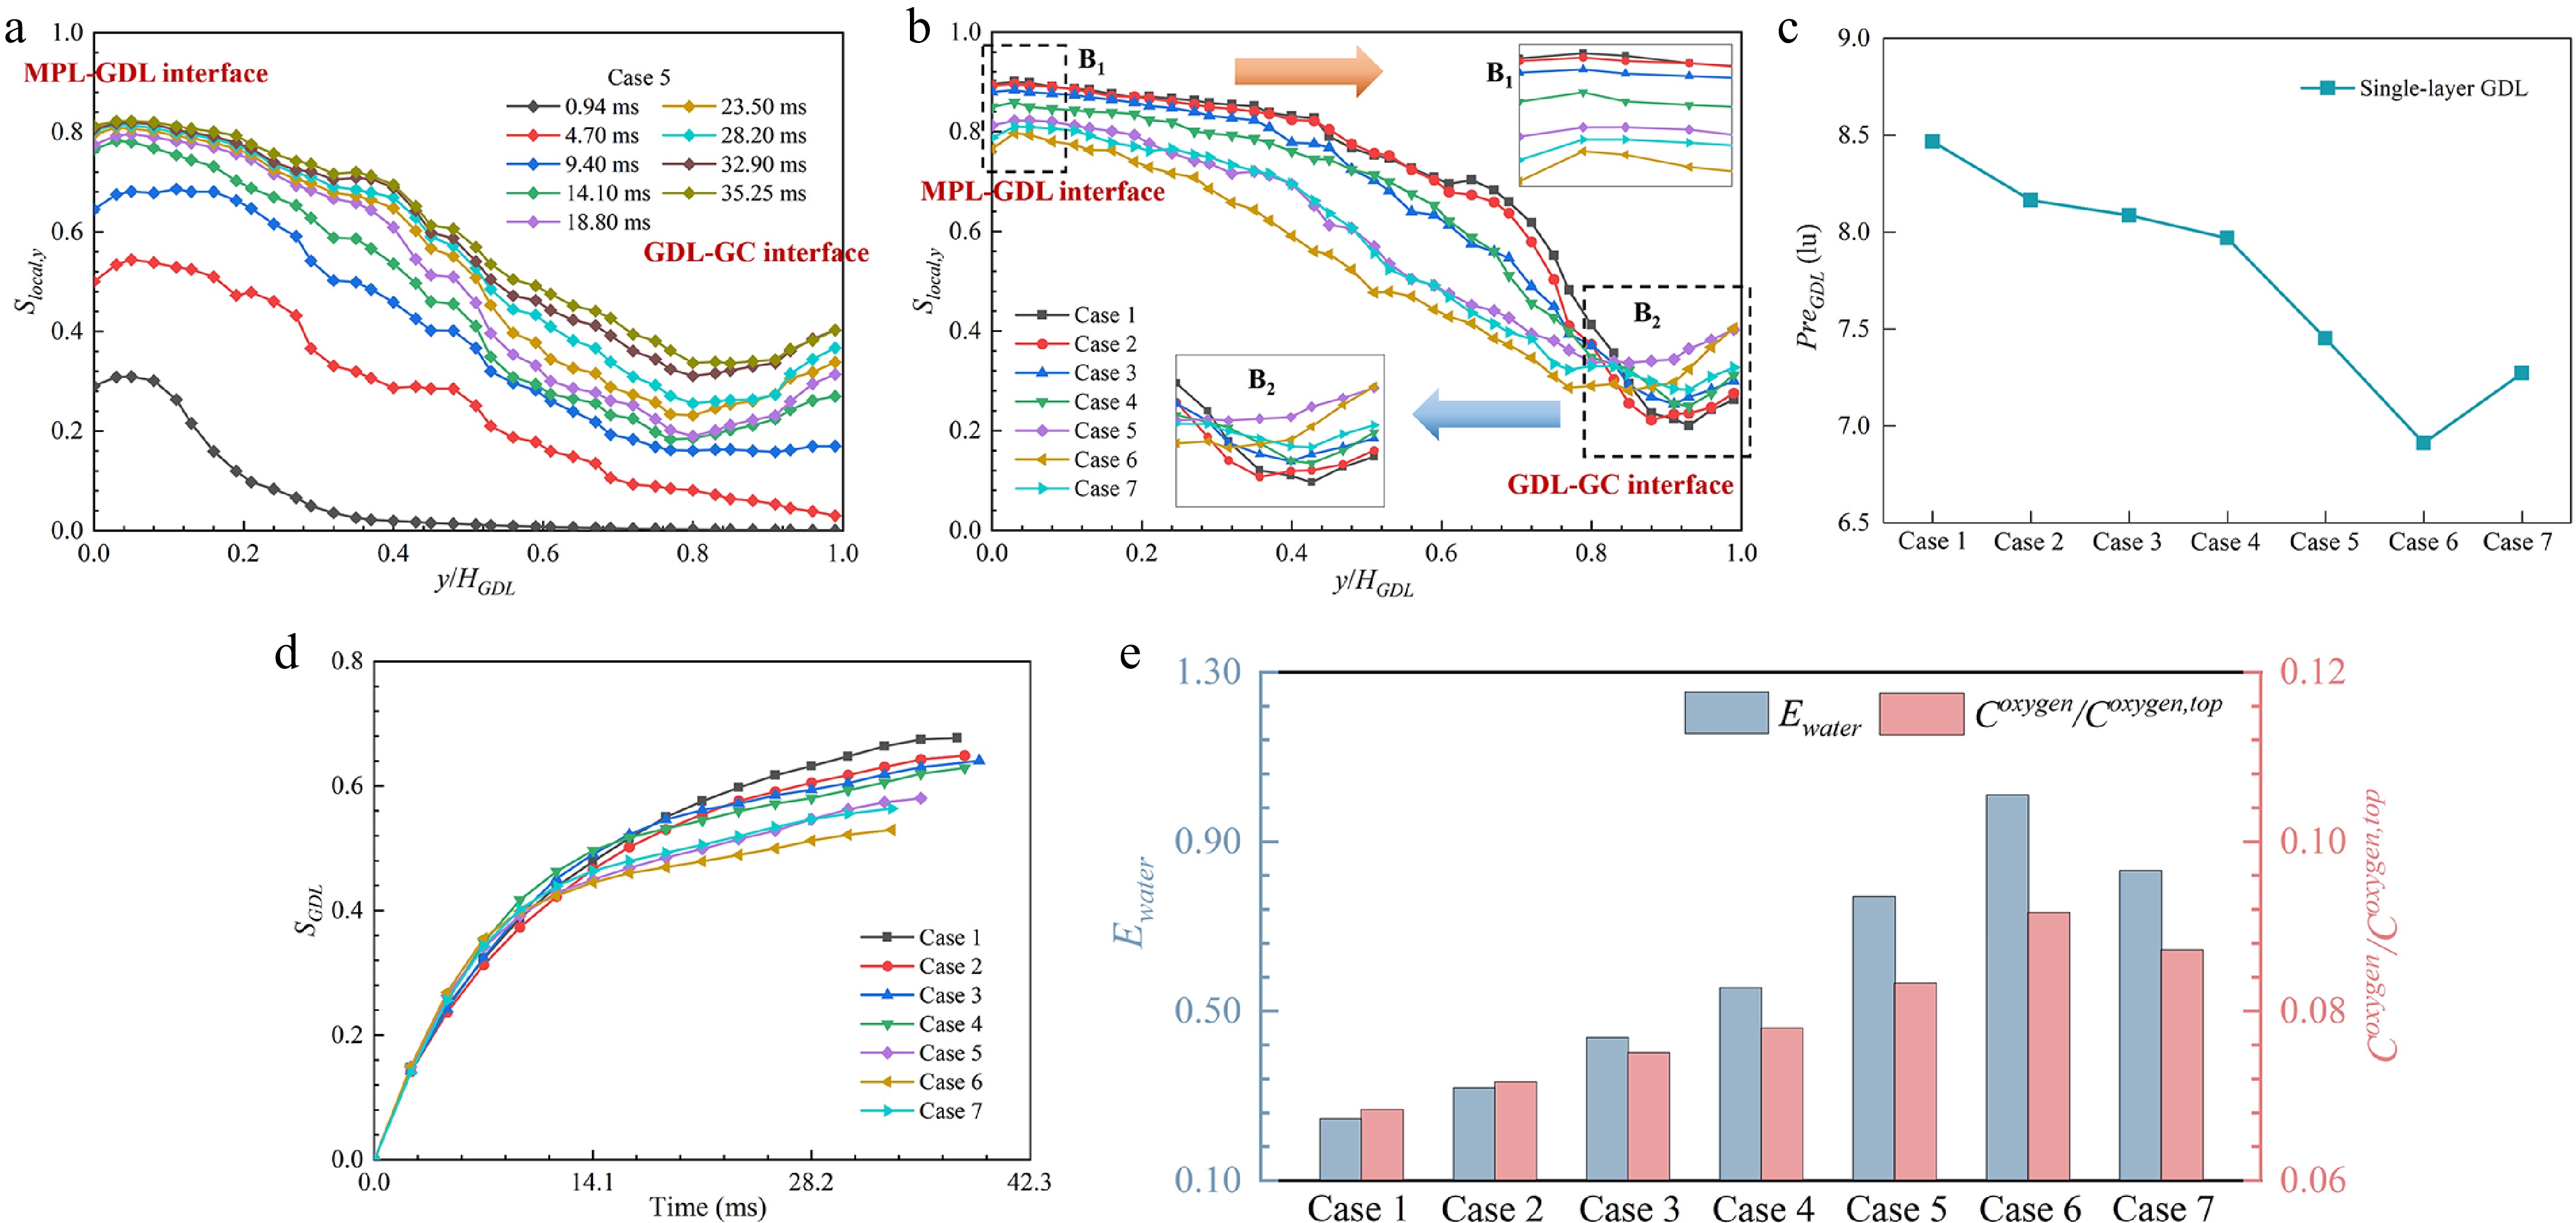
Figure 5.
(a) Temporal evolution of Slocal,y along the TP direction for a GDL porosity of 0.800 (Case 5); (b) steady-state Slocal,y distributions; (c) PreGDL, (d) SGDL; and (e) Ewater and normalized Coxygen for single-layer GDLs with varying porosities.
-
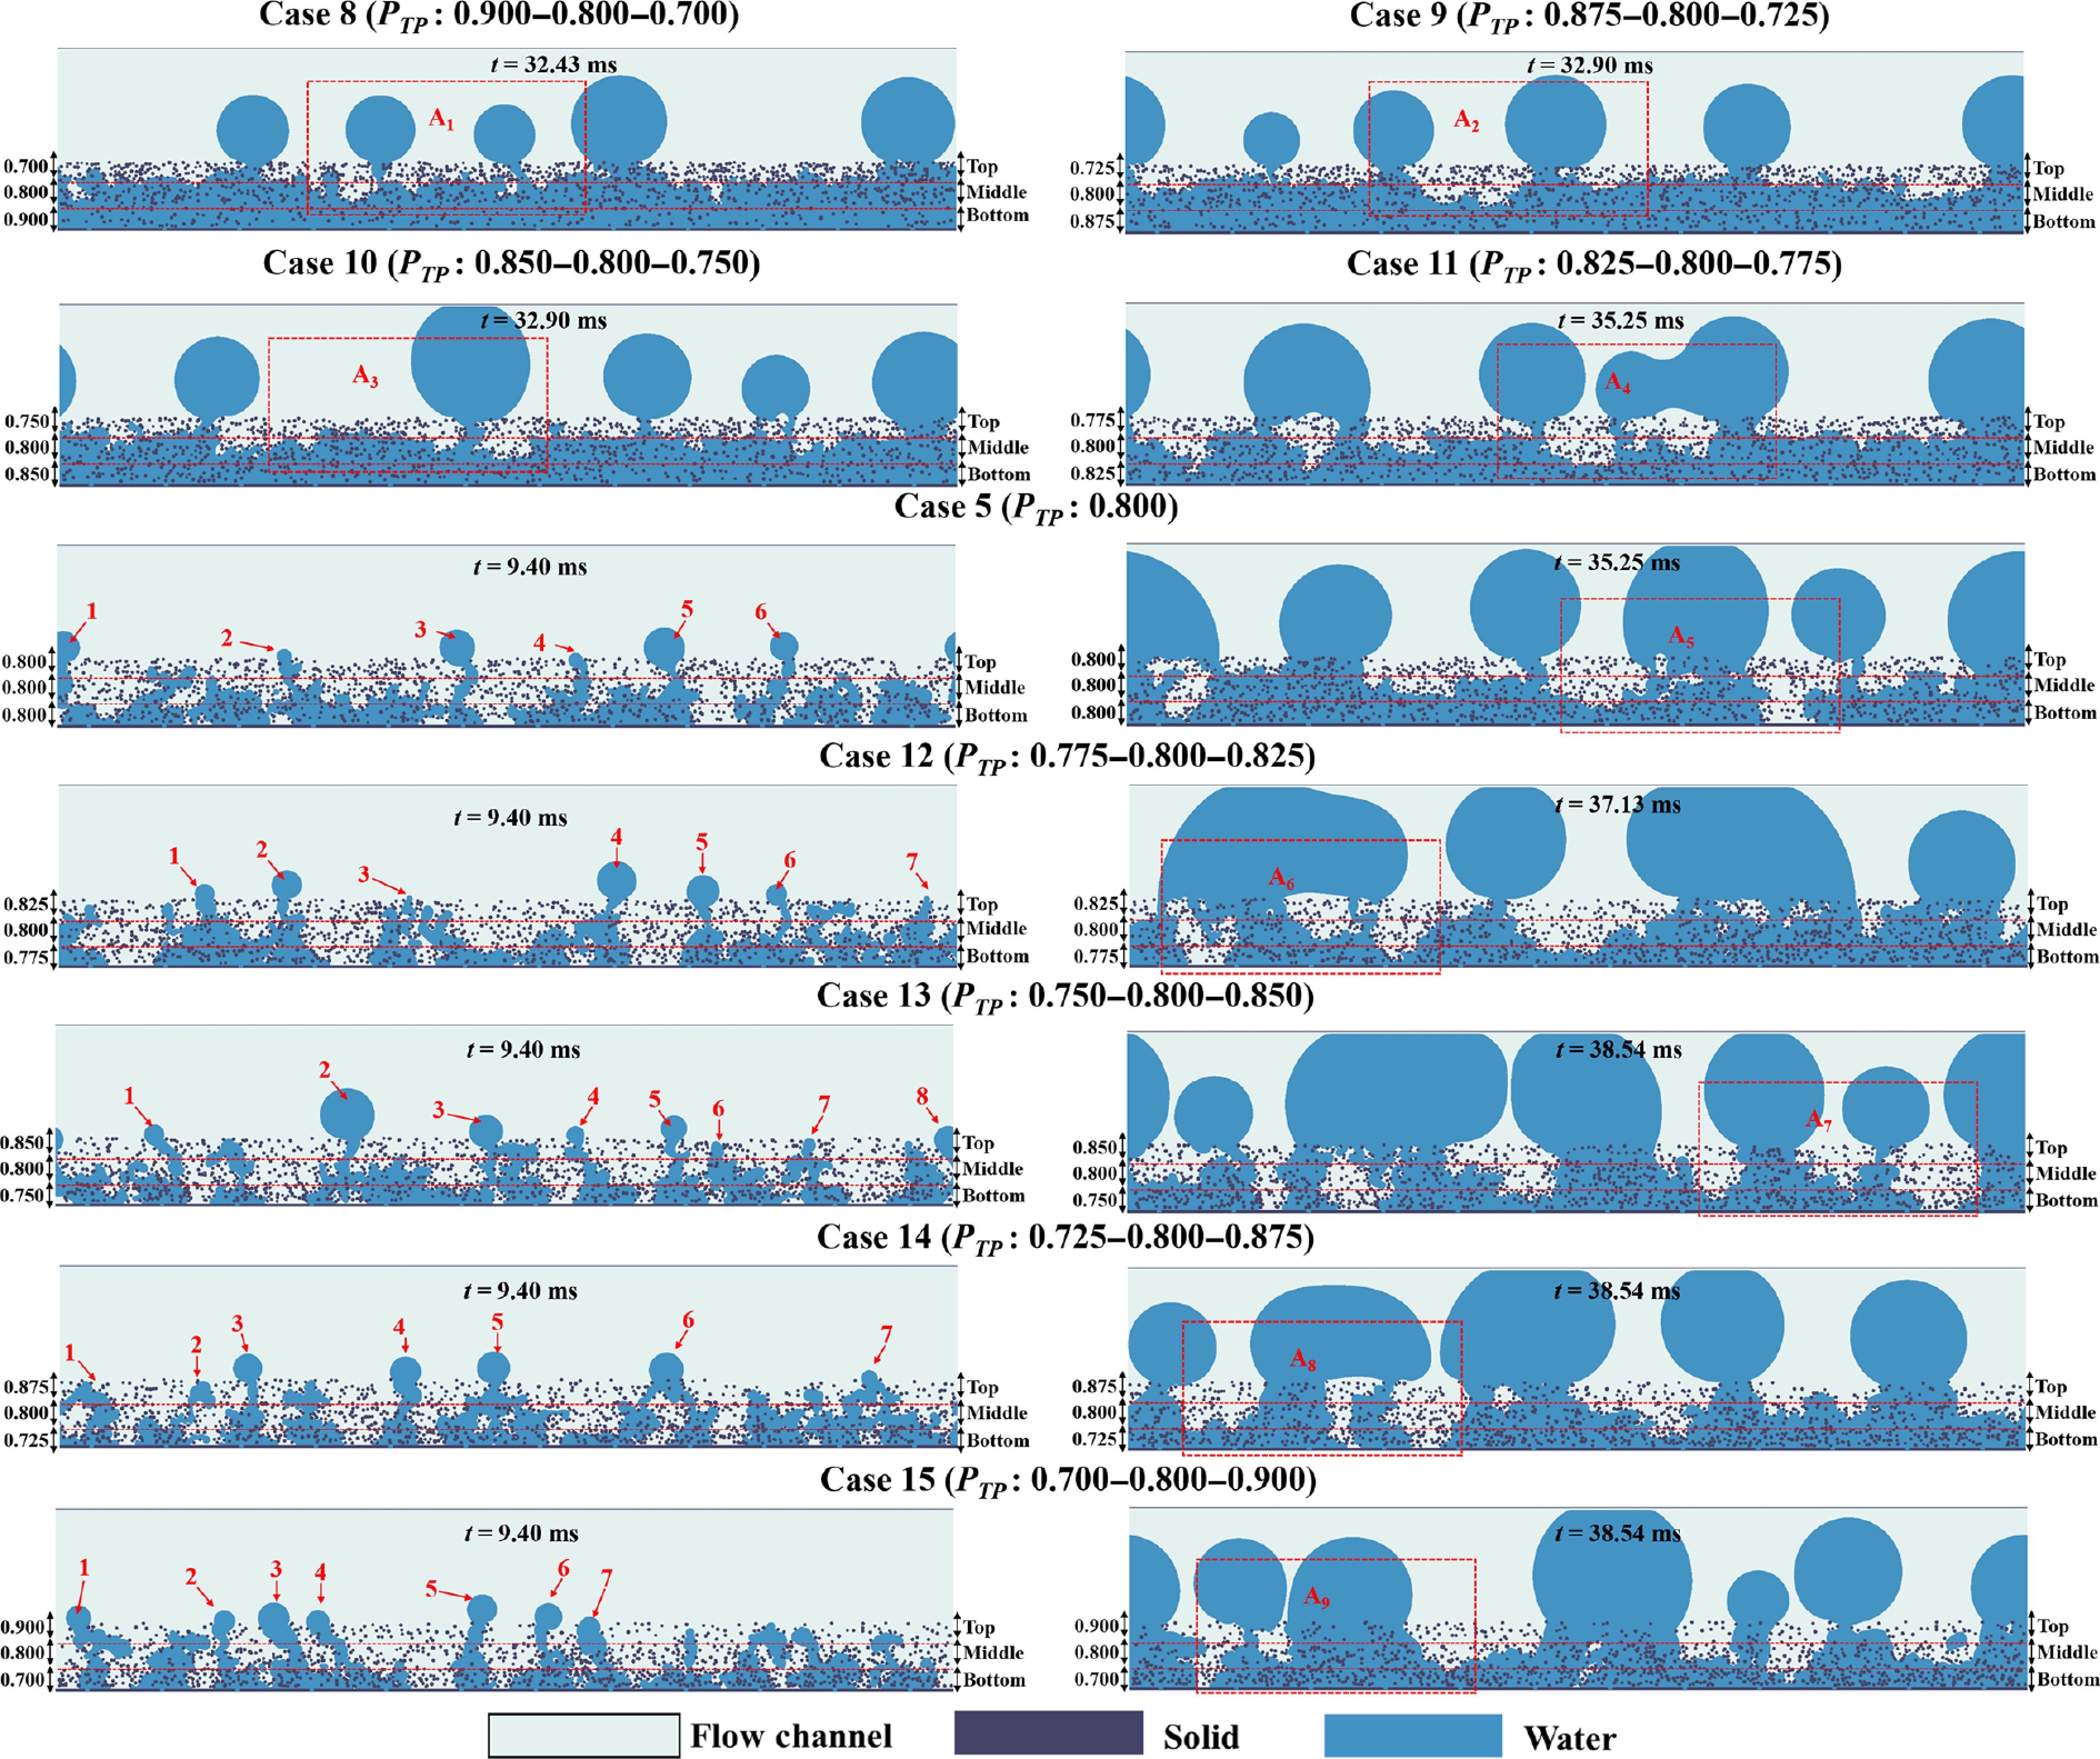
Figure 6.
Illustration of water flow evolution under different multilayer GDL porosities.
-
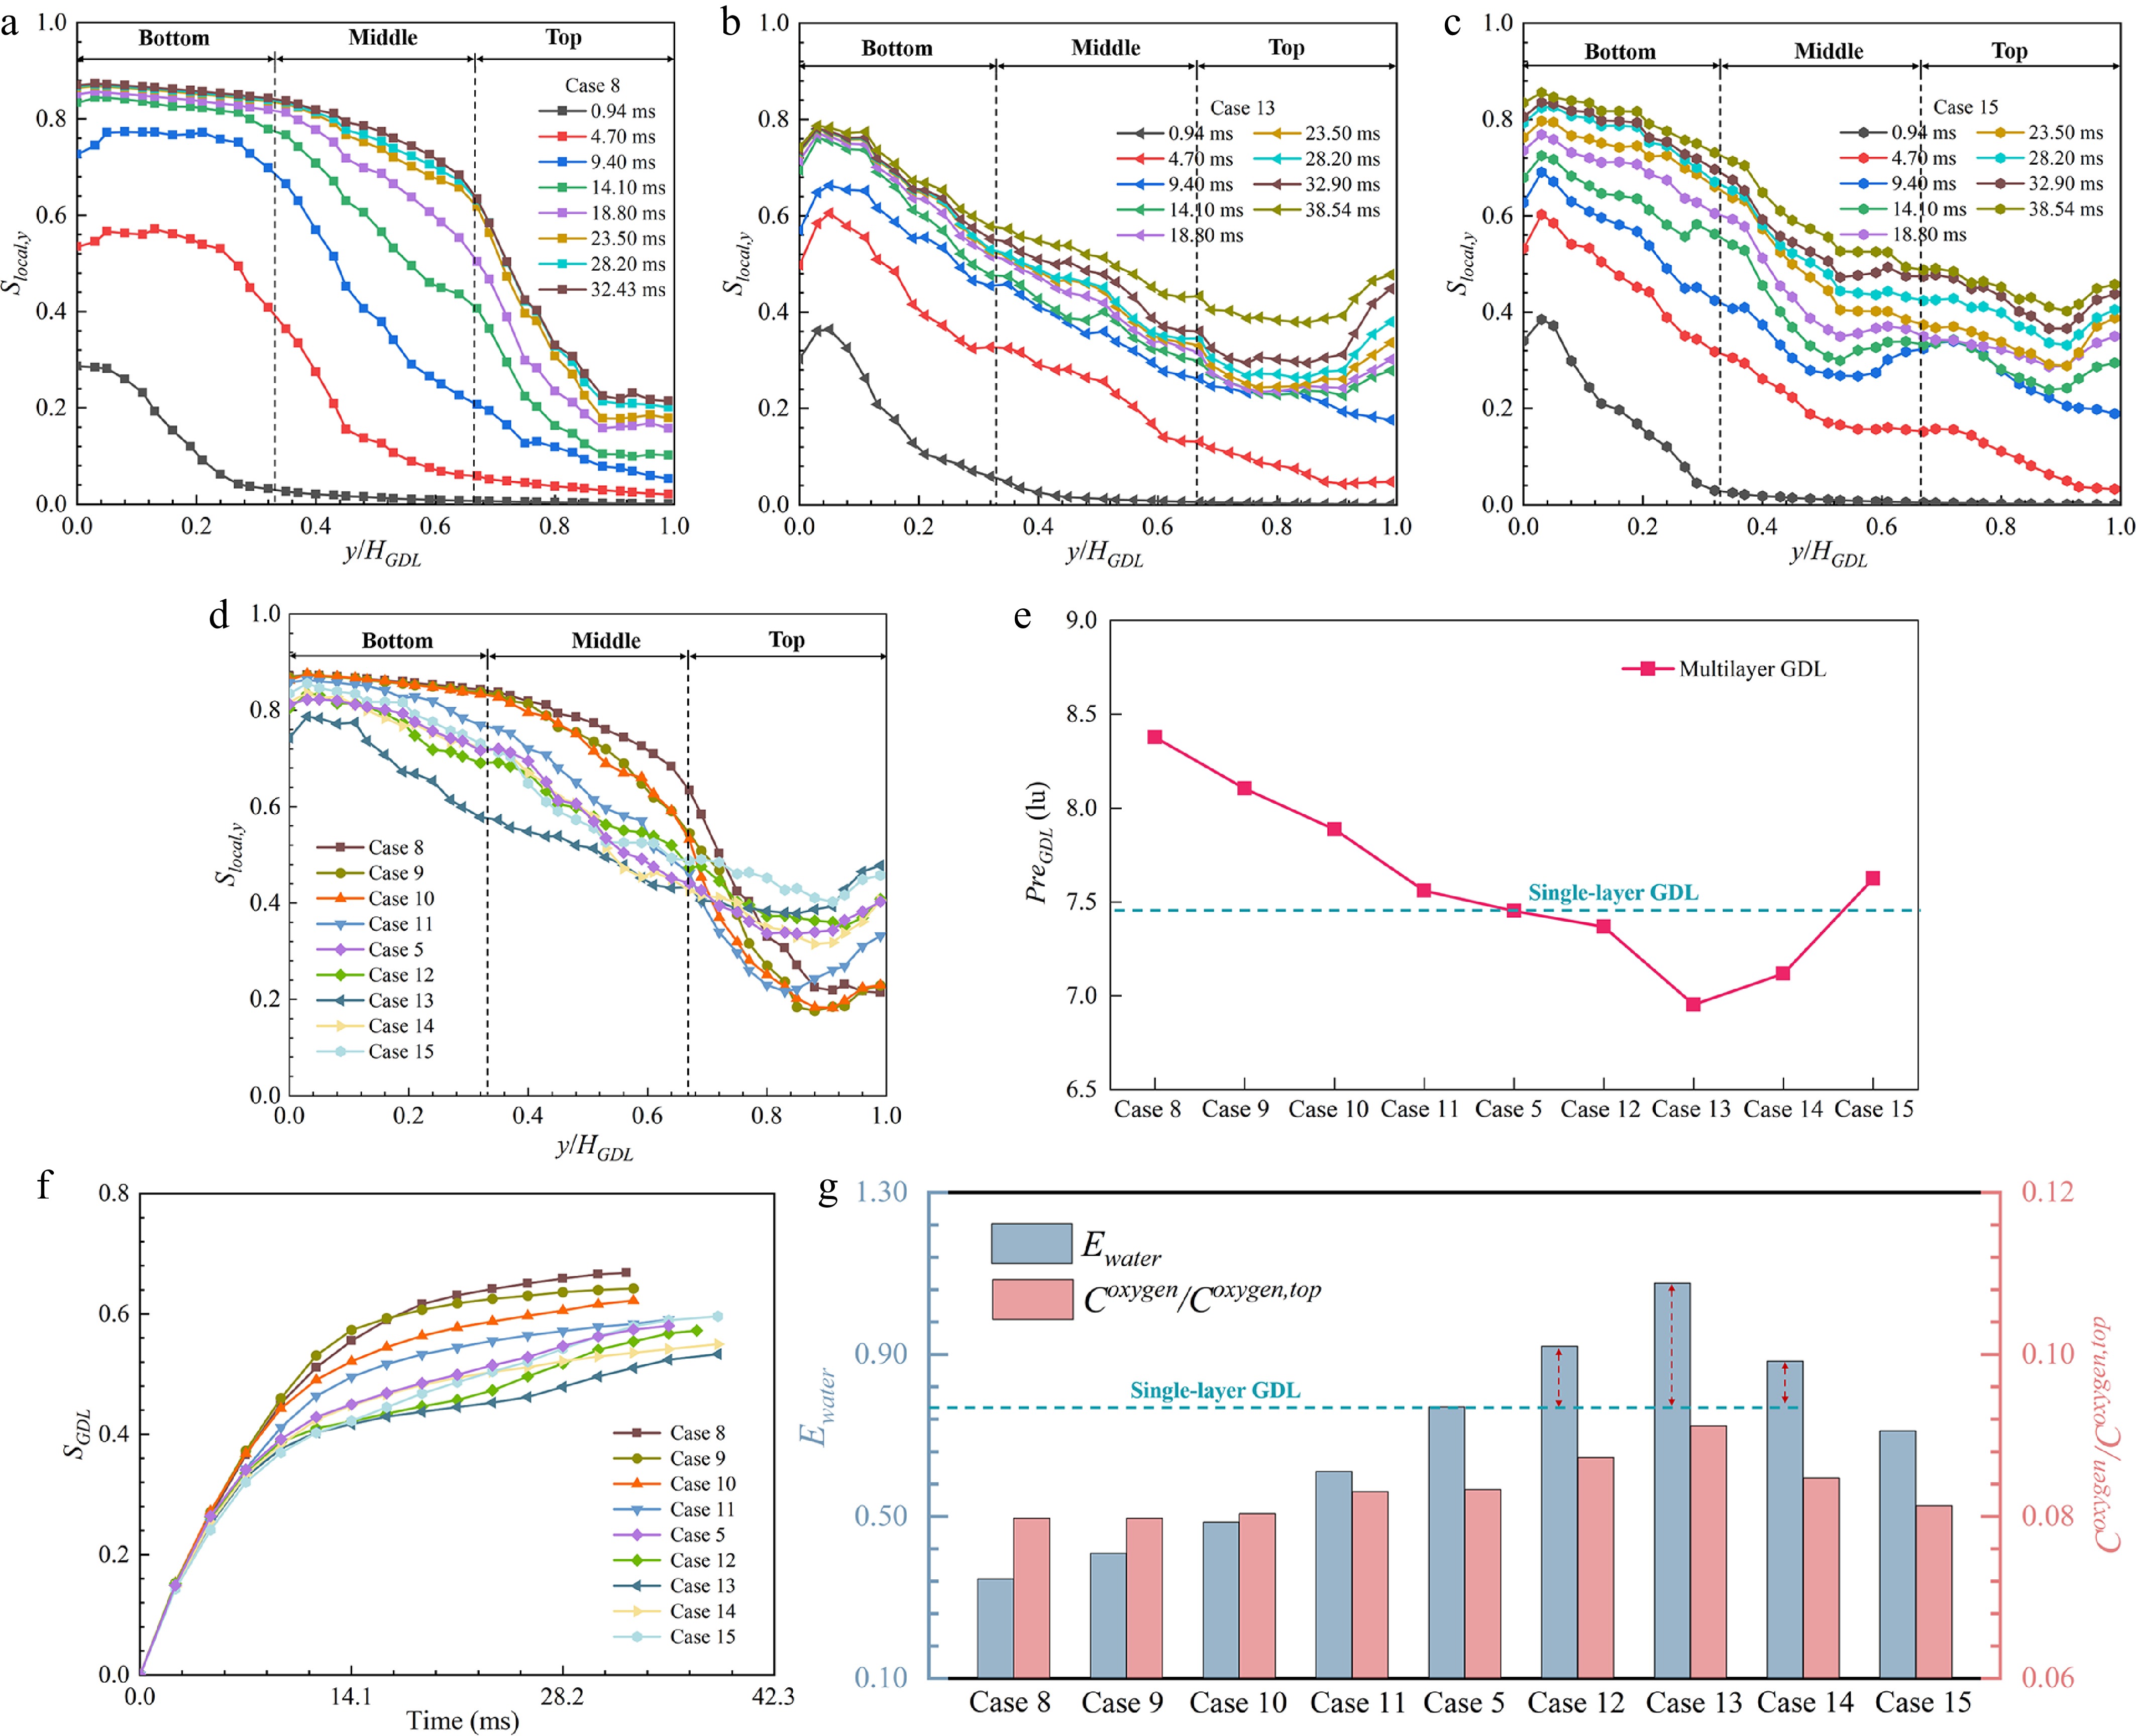
Figure 7.
Temporal evolution of Slocal,y along the TP direction for multilayer GDLs in (a) Case 8, (b) Case 13, and (c) Case 15; (d) steady-state Slocal,y, (e) SGDL, (f) PreGDL, and (g) Ewater and normalized Coxygen for multilayer GDLs with varying porosities.
-
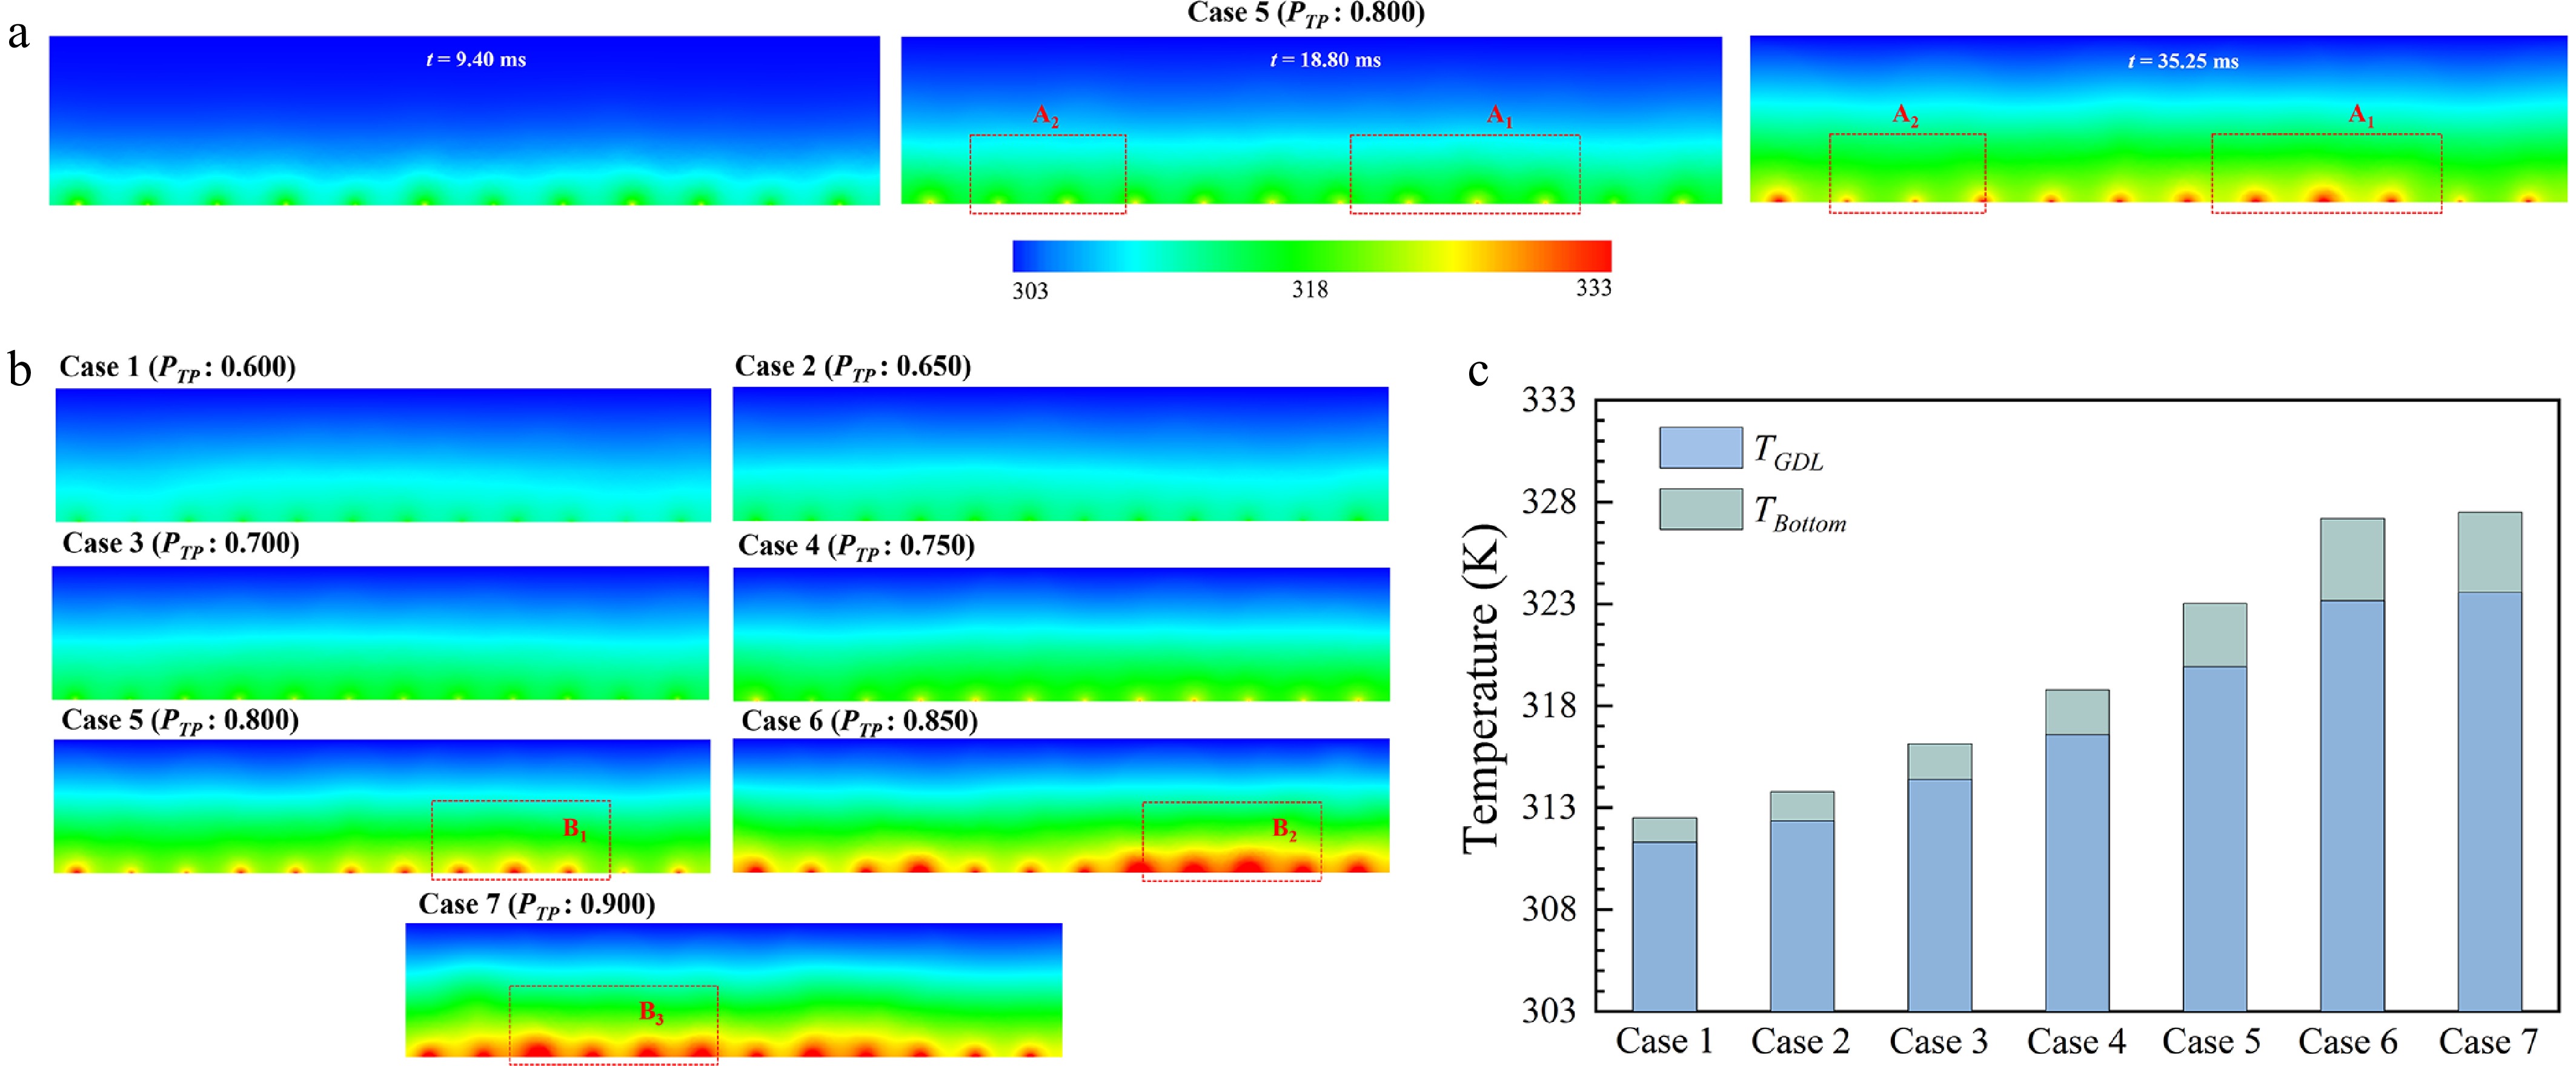
Figure 8.
(a) Evolution of temperature distributions in Case 5 with porosity 0.800; steady-state (b) temperature distributions, and (c) TBottom and TGDL for single-layer GDLs with varying porosities.
-
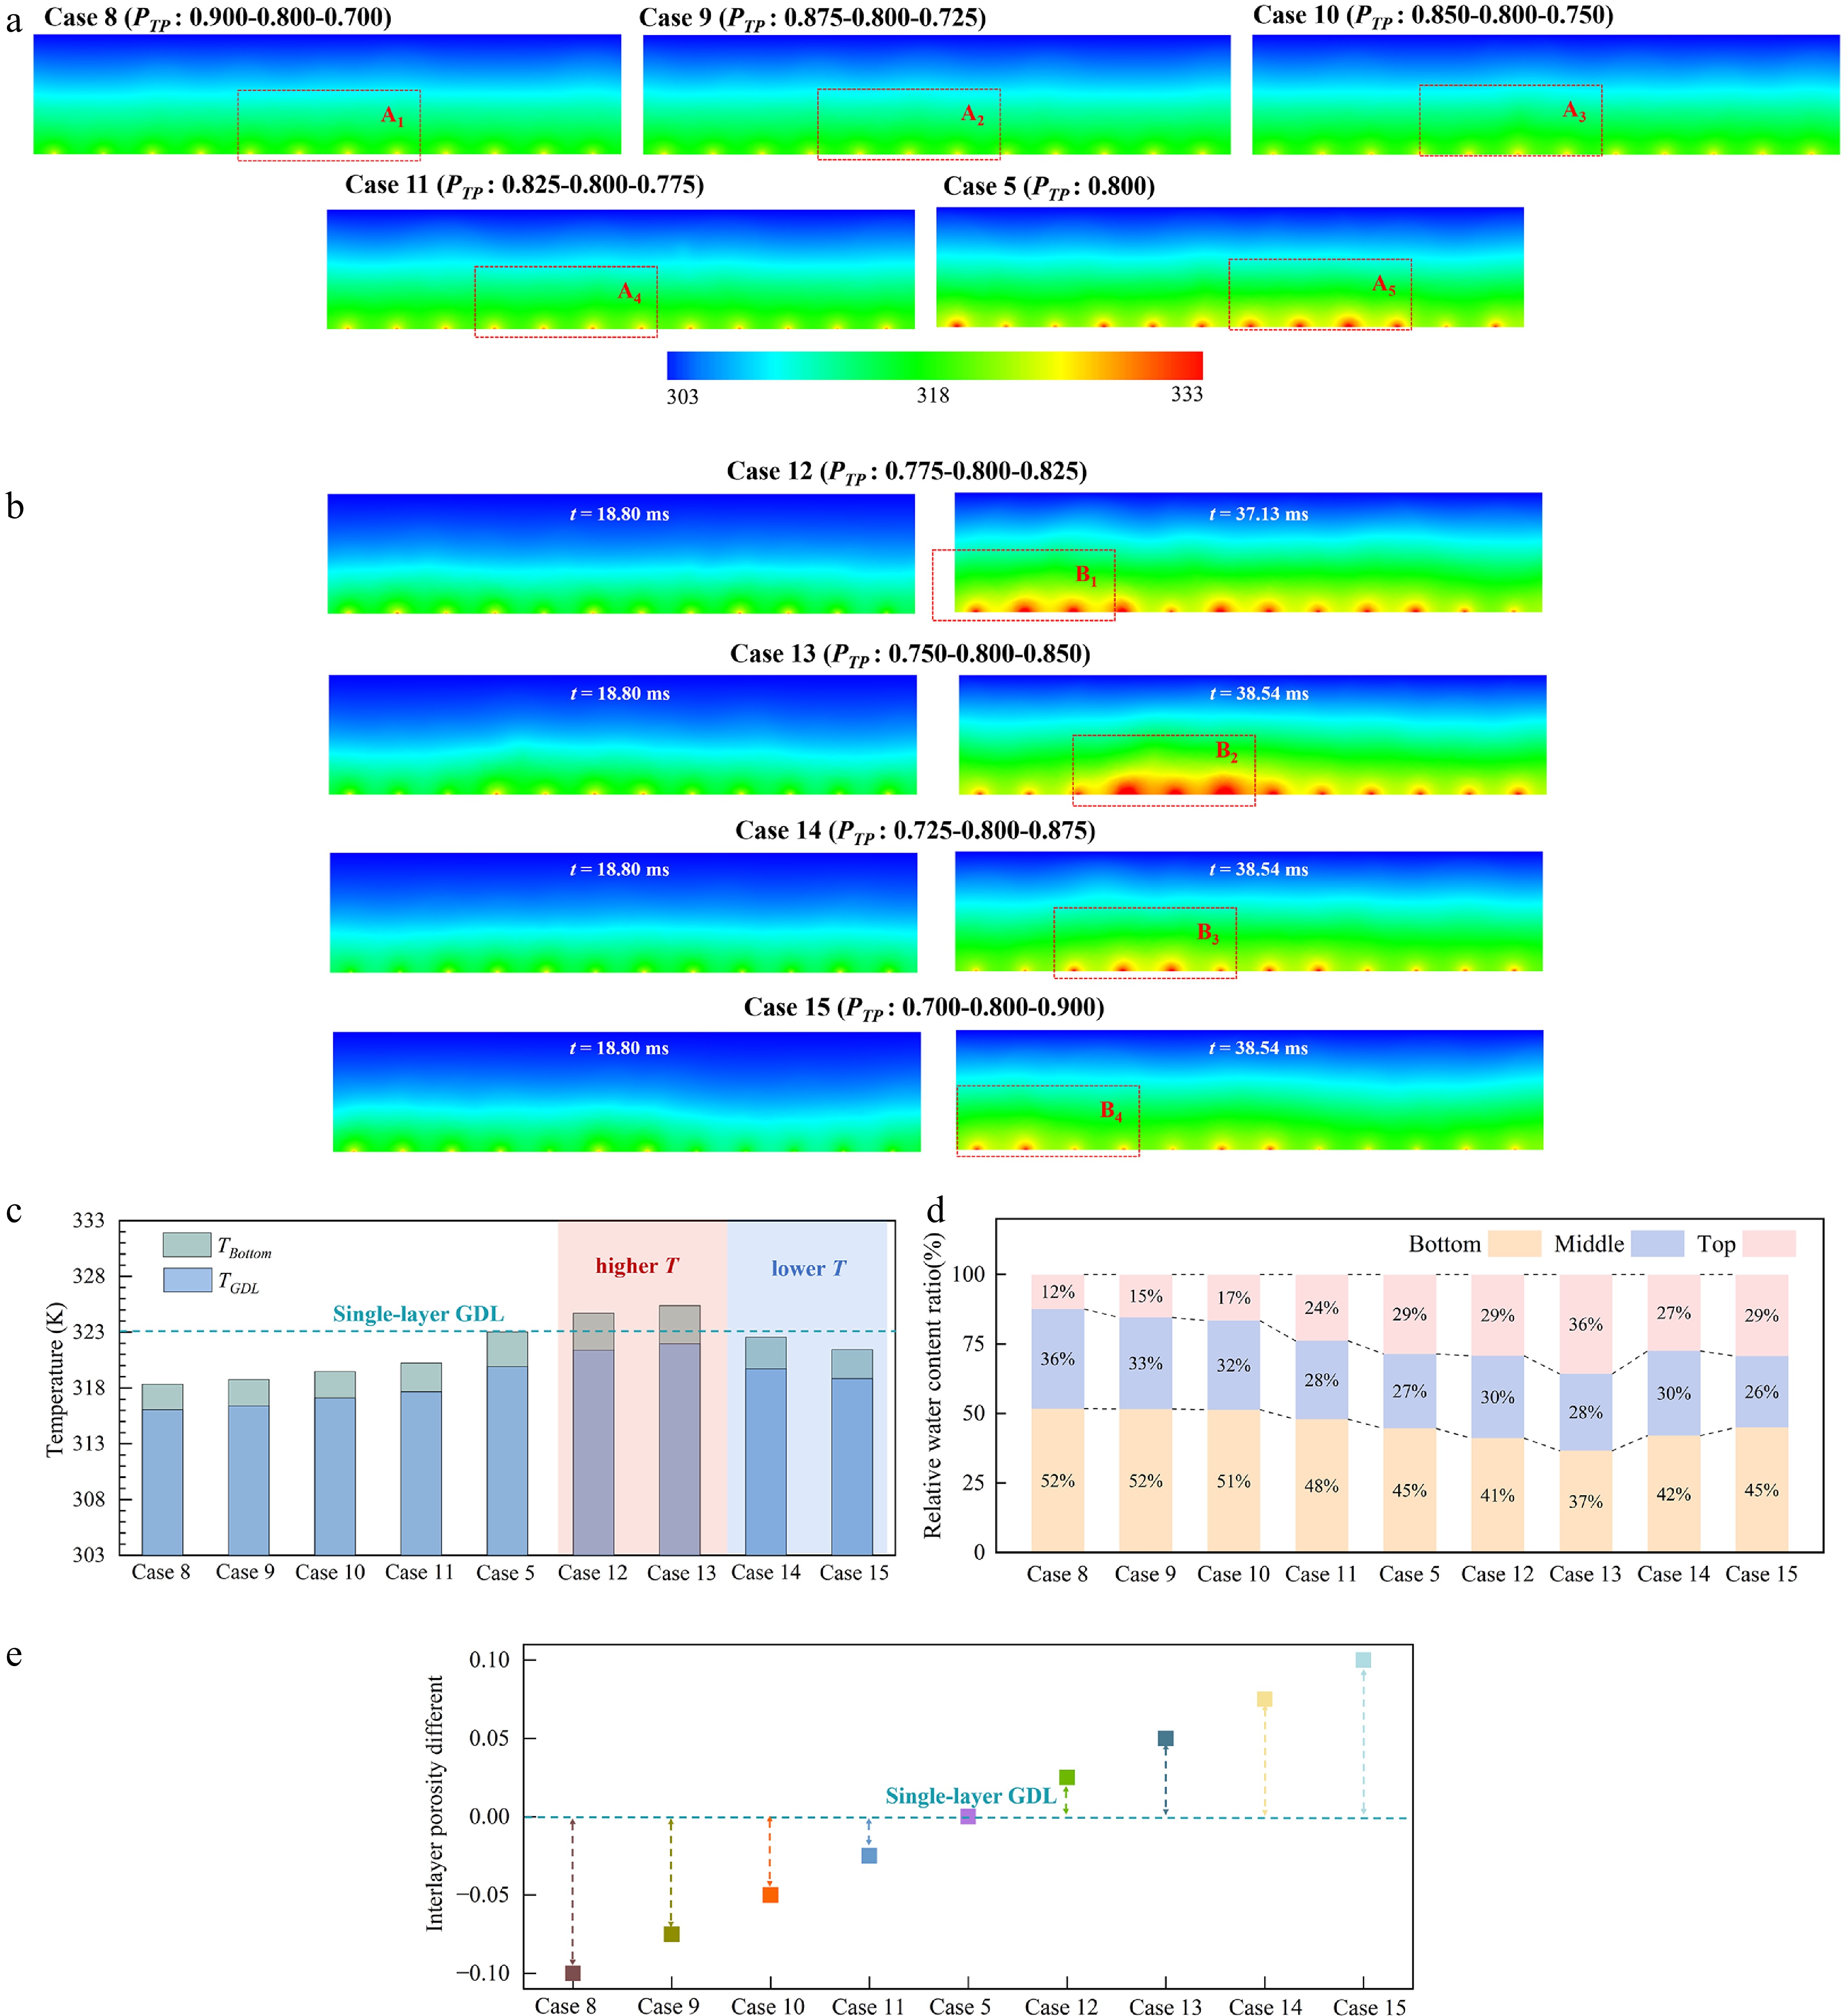
Figure 9.
Temperature distributions for multilayer GDLs with (a) porosity gradients decreasing and (b) increasing along the TP direction. (c) Steady-state values of TBottom and TGDL, (d) relative water content ratios in the bottom, middle, and top layers and (e) interlayer porosity different among multilayer GDLs with varying porosities.
-
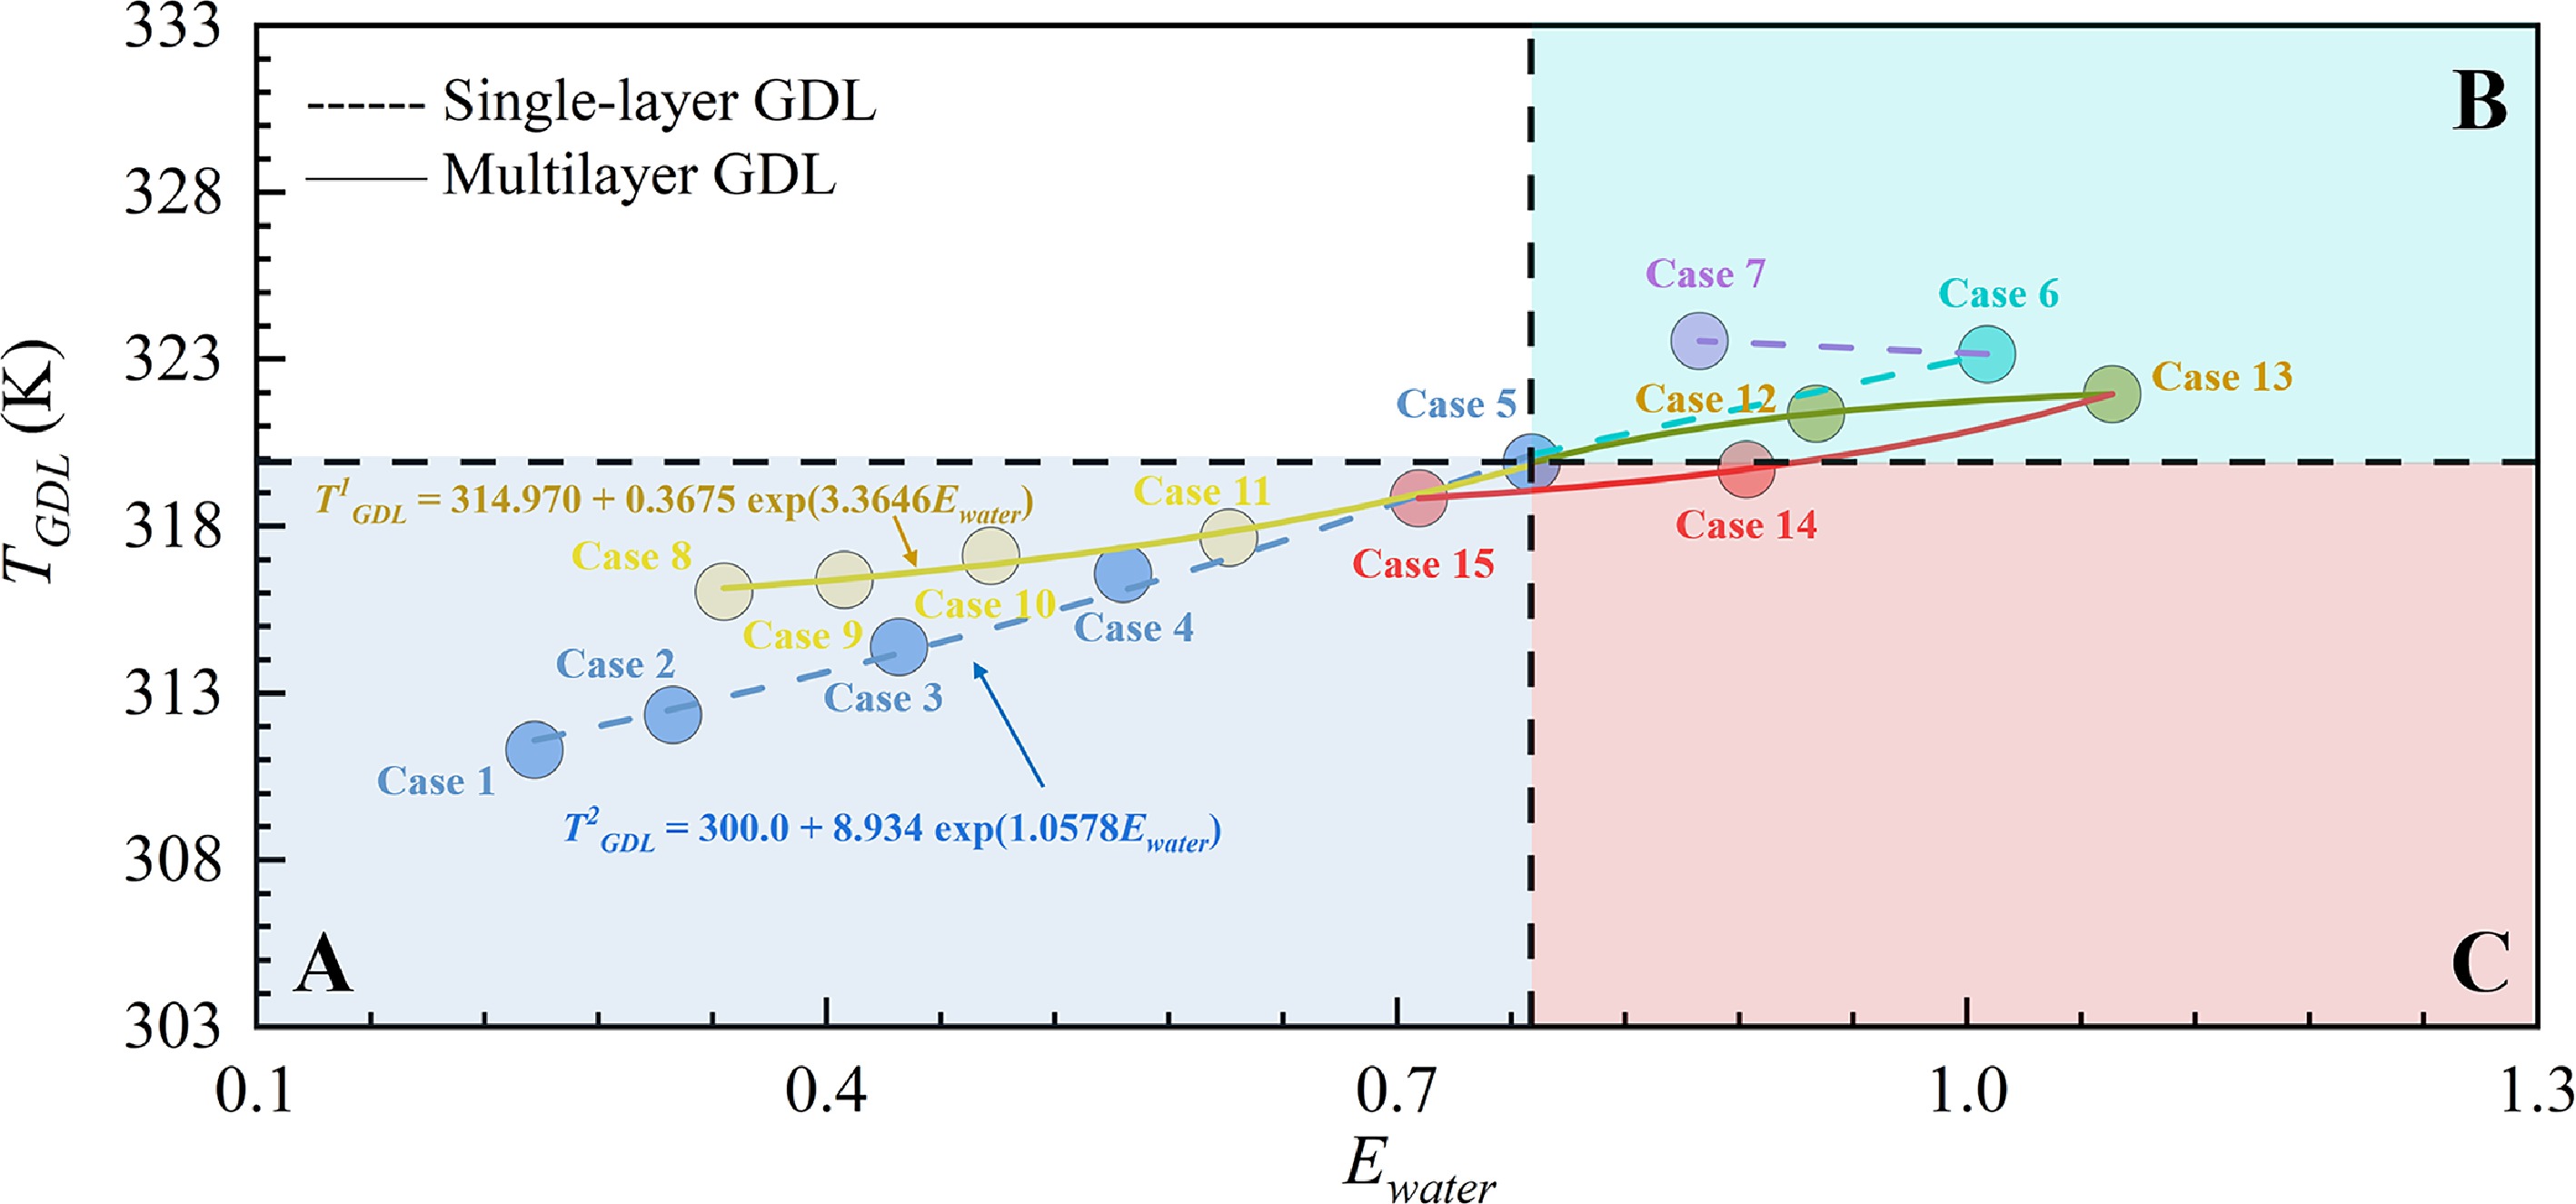
Figure 10.
Correlation between Ewater and TGDL in the single-layer and multilayer GDLs.
-
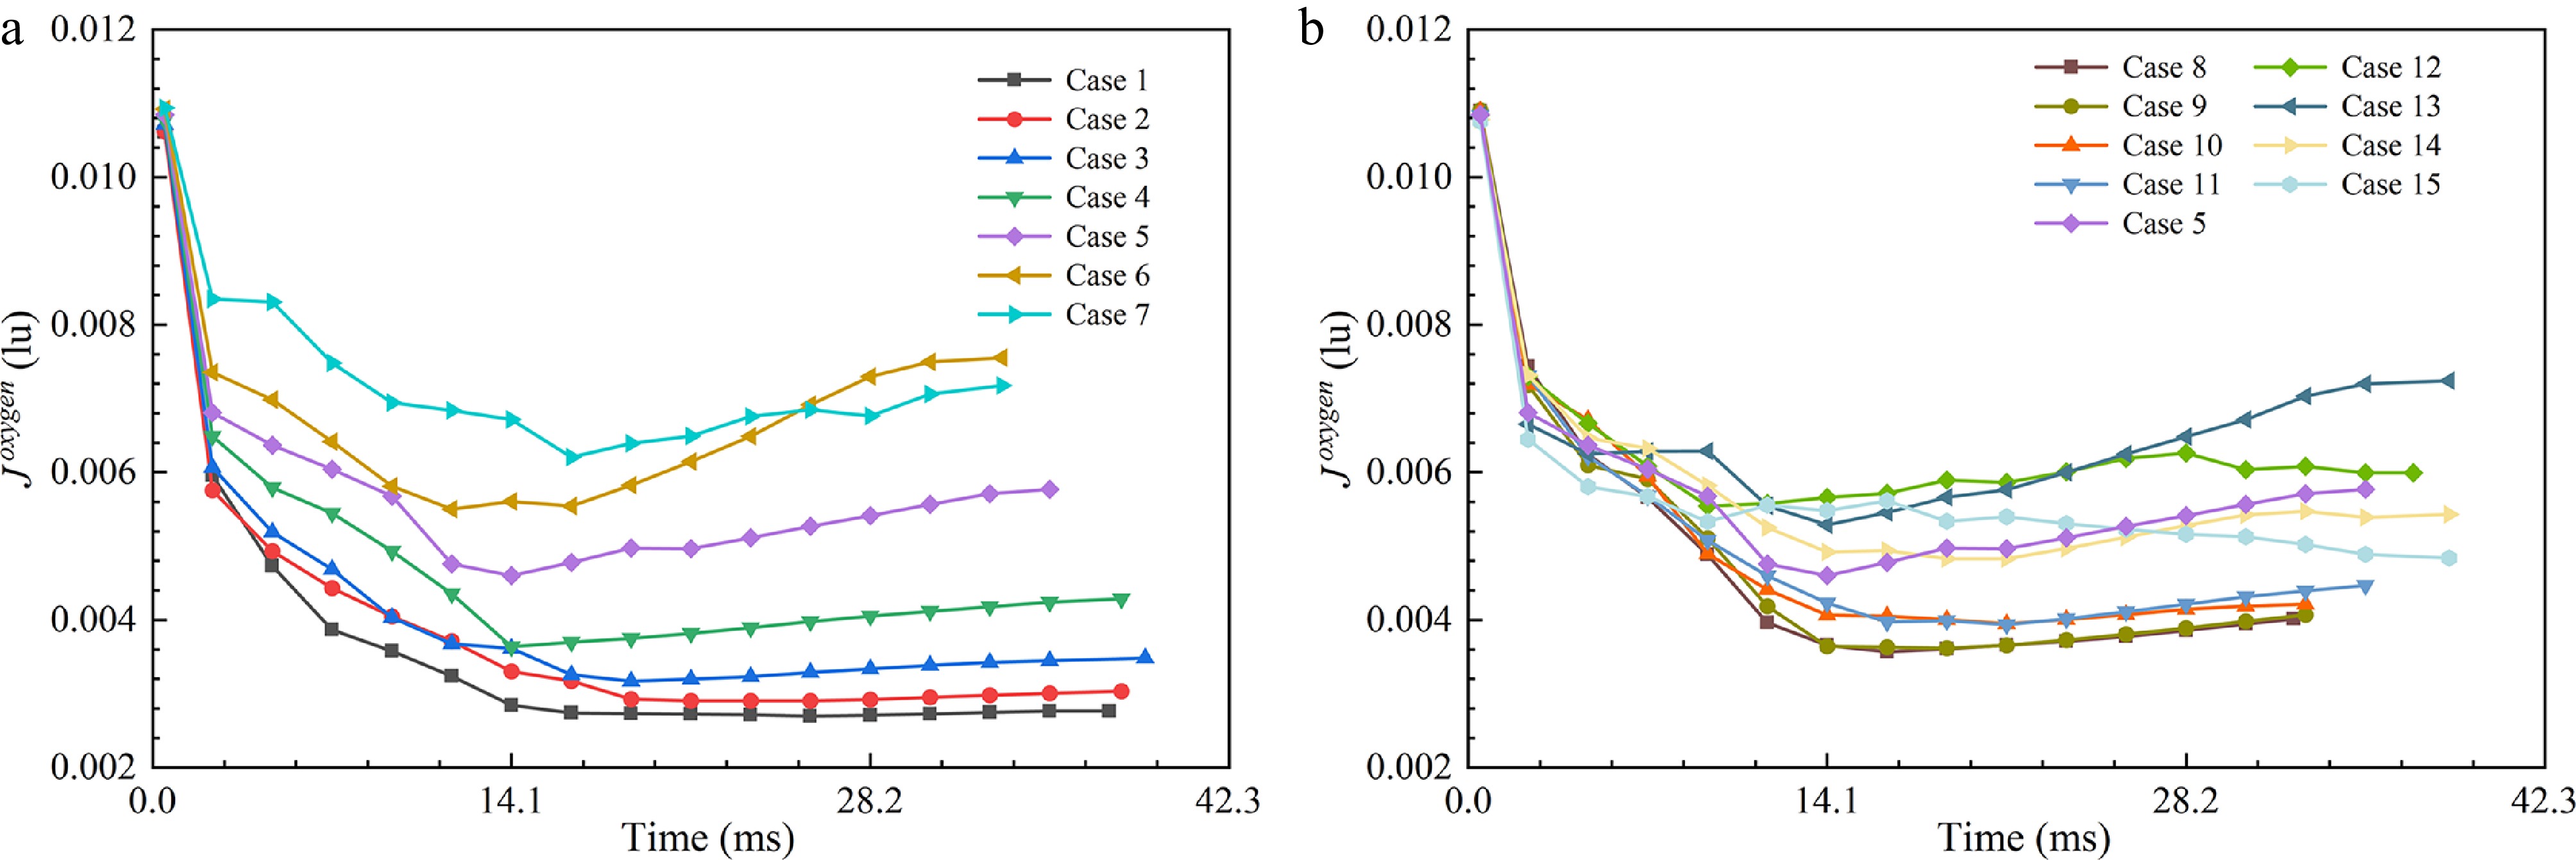
Figure 11.
Variation of
$ {J}^{oxygen} $ -
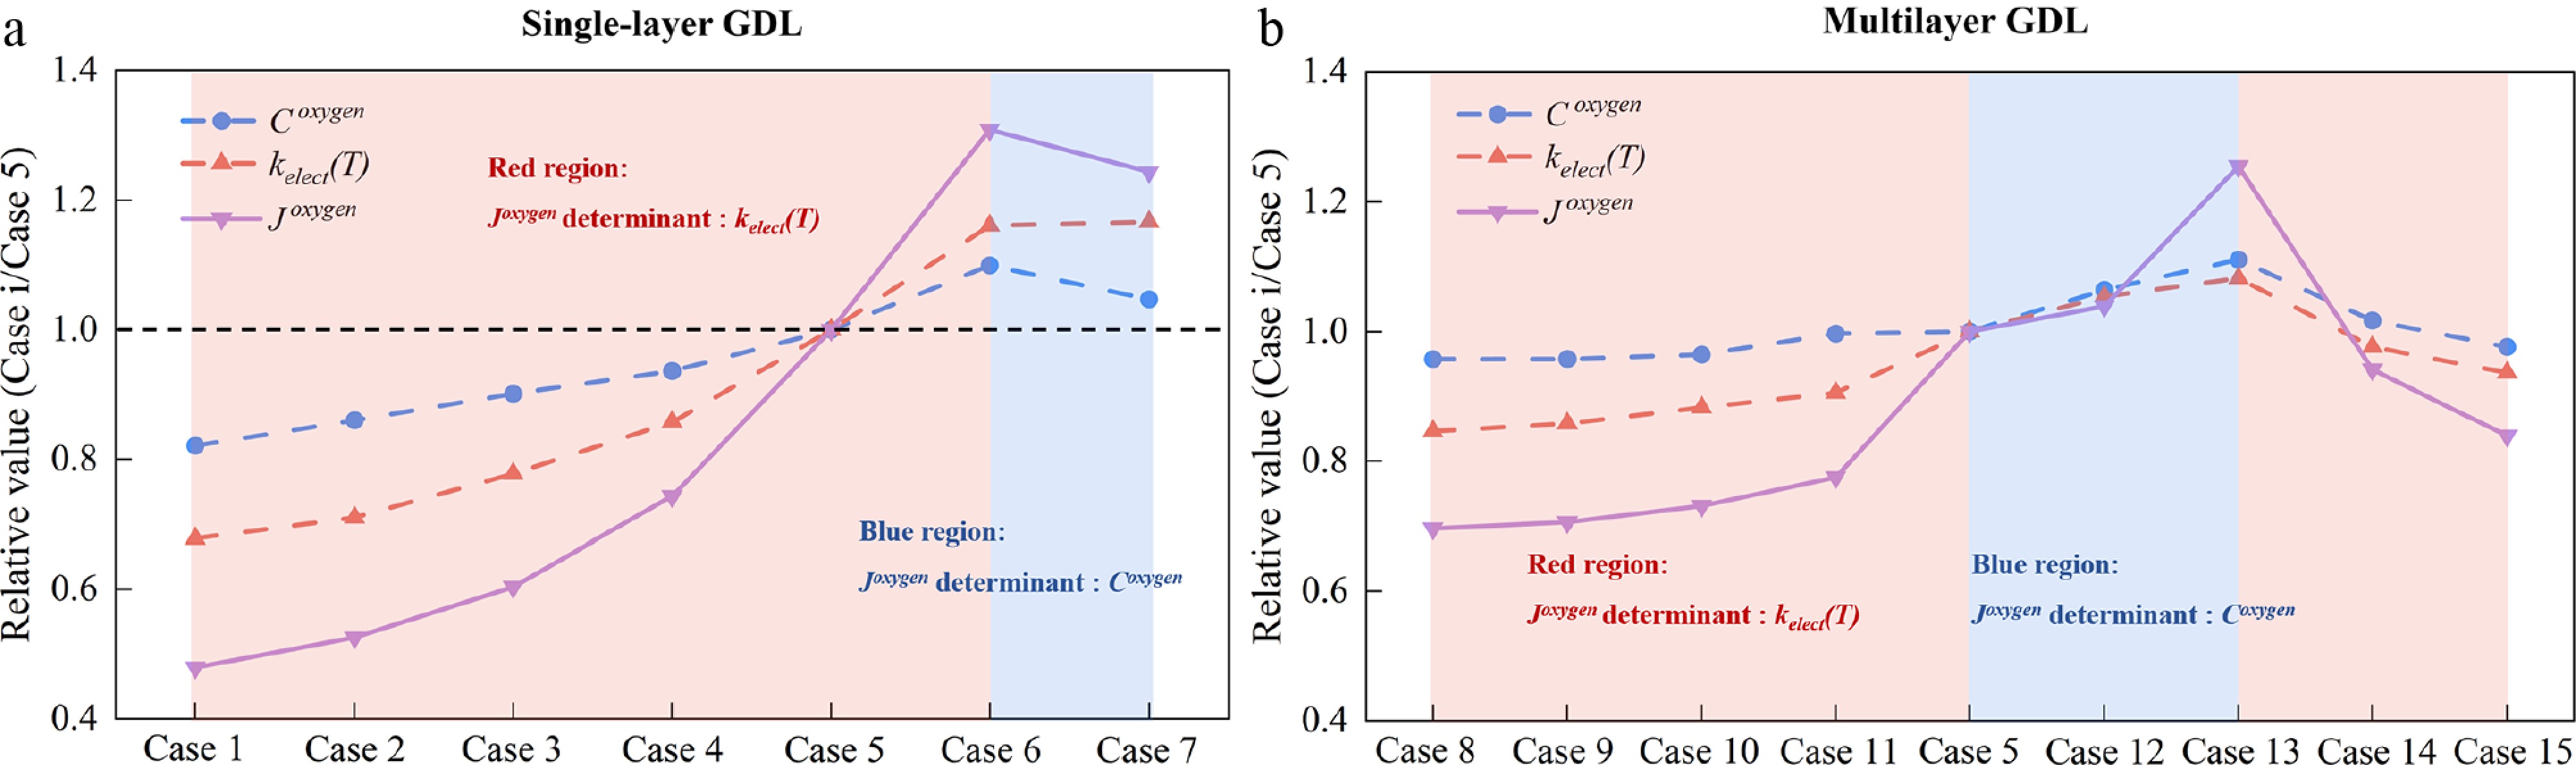
Figure 12.
Effects of
$ {C}^{oxygen} $ $ {k}_{elec}\left(T\right) $ $ {J}^{oxygen} $ $ {k}_{elec}\left(T\right) $ $ {J}^{oxygen} $ $ {C}^{oxygen} $ $ {J}^{oxygen} $ -
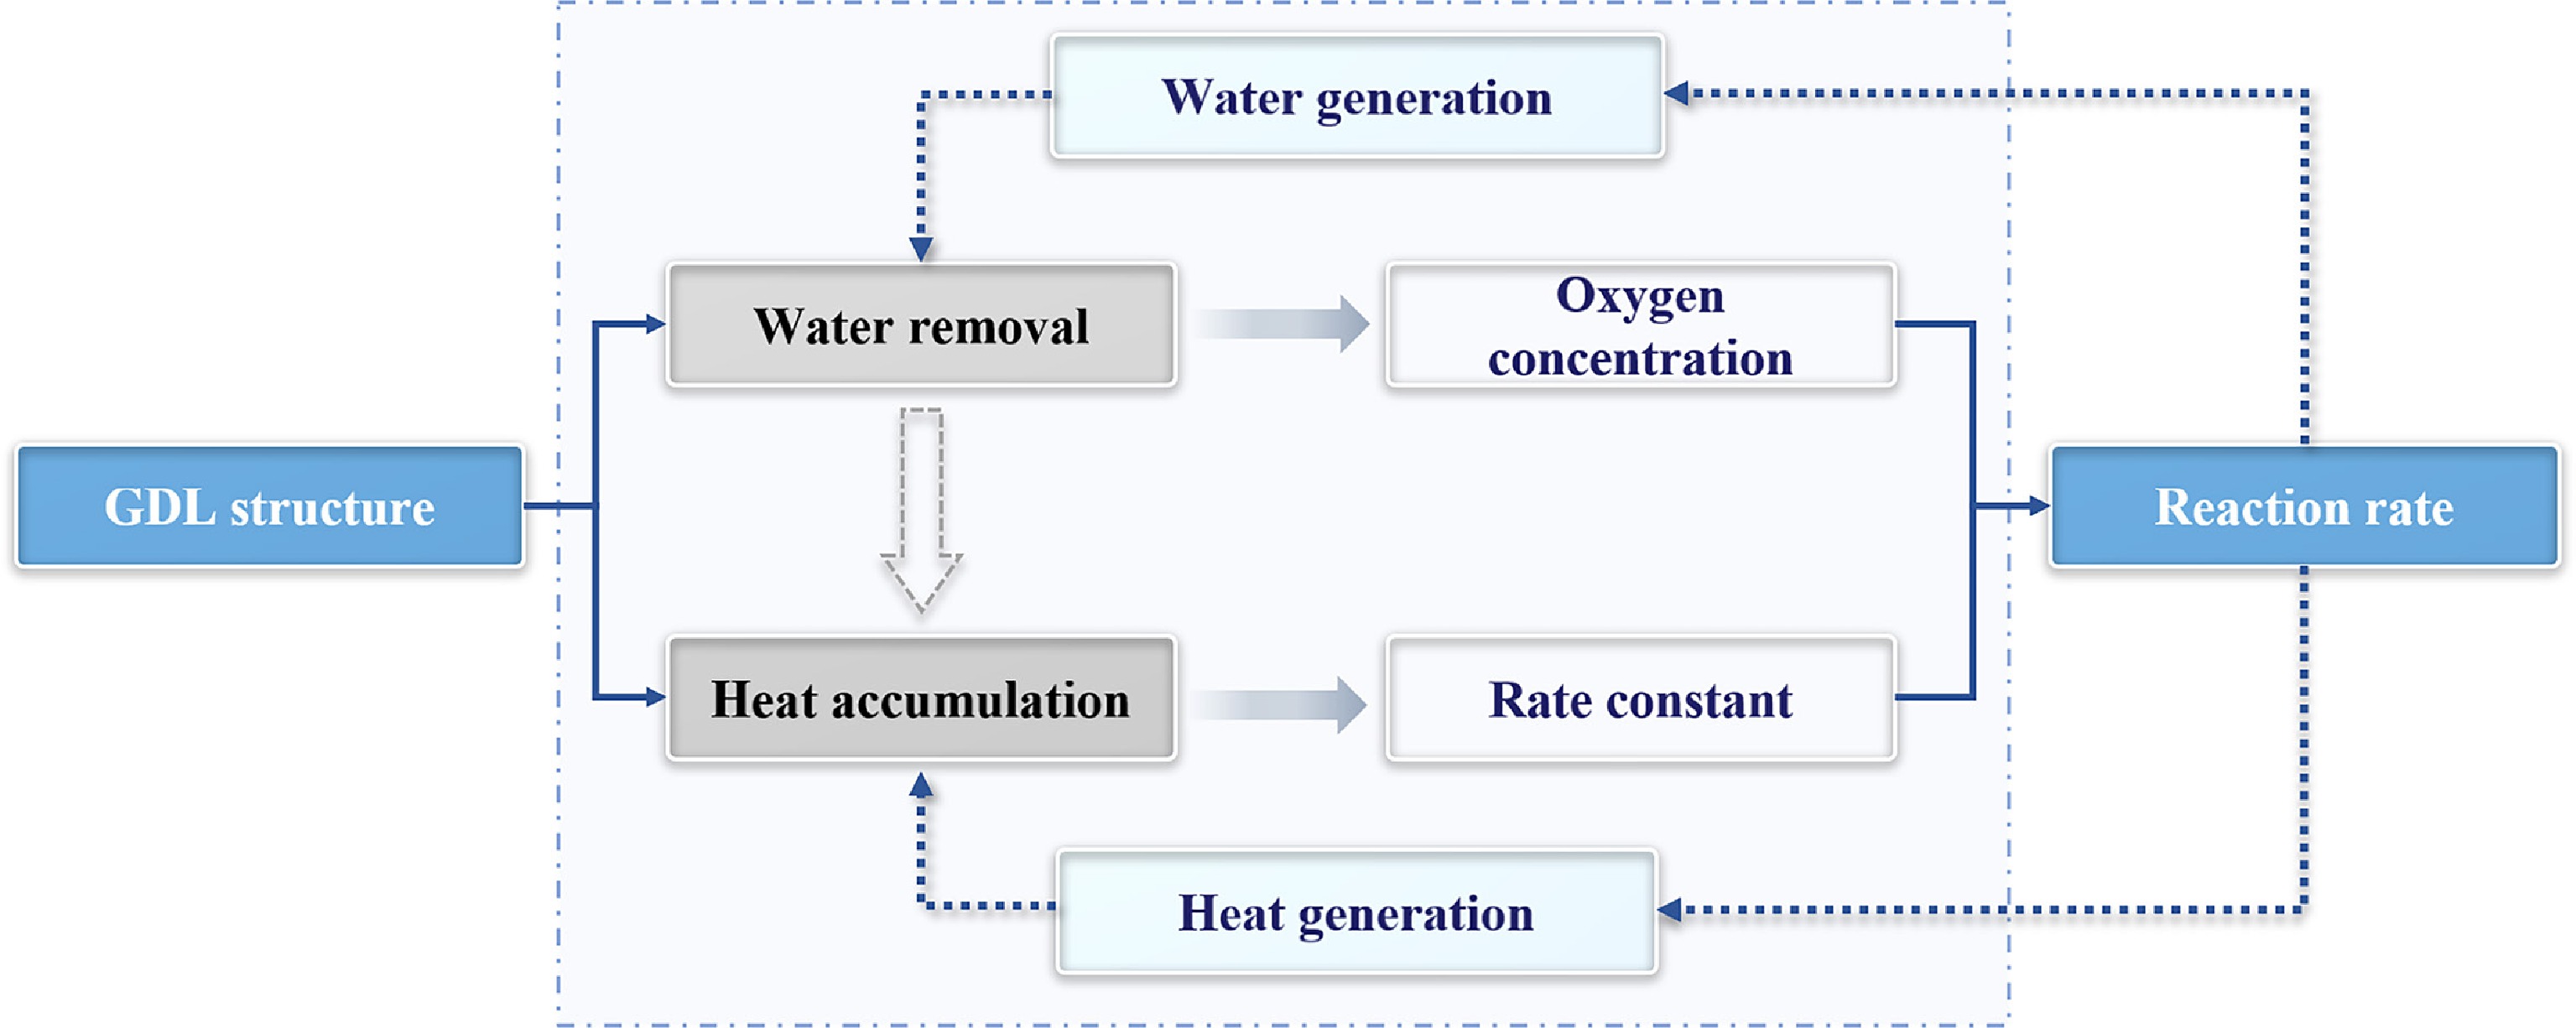
Figure 13.
Schematic of the decoupled analysis linking the GDL structure to the dynamic reaction rate in PEMFCs.
-
Parameter Symbol Value and unit Oxygen concentration at GC top $ {C}^{oxygen,top} $ 7.25 mol m−3 Temperature at GC top $ {T}^{top} $ 303 K Atmospheric pressure $ {p}_{0} $ 101,325.0 Pa Faraday constant $ F $ 96,487.0 C mol−1 Universal gas constant $ R $ 8.314 J mol−1 K−1 Transfer coefficient $ {a}_{e} $ 0.61 Reference oxygen concentration $ {C}^{ref} $ 40.96 mol m−3 Thermal diffusivity of water $ {\alpha }^{water} $ 1.65 × 10⁻⁷ m2 s−1 Thermal diffusivity of air $ {\alpha }^{air} $ 3.03 × 10⁻⁵ m2 s−1 Thermal diffusivity of solid $ {\alpha }^{solid} $ 1.56 × 10⁻⁵ m2 s−1 Enthalpy of reaction $ \Delta H $ −1.78 × 10⁷ J kg−1 Density of water $ {\rho }^{water} $ 995.65 kg m−3 Density of air $ {\rho }^{air} $ 1.15 kg m−3 Viscosity of water $ {\mu }^{water} $ 7.98 × 10⁻⁴ Pa s Viscosity of air $ {\mu }^{air} $ 1.86 × 10⁻⁵ Pa s Overpotential $ \eta $ −1.0 V Reference current density $ i_{0}^{ref} $ 0.01 A m−2 Oxygen diffusion coefficient in GDL pore $ {D}_{GDL} $ 3.0 × 10⁻⁵ m2 s−1 Oxygen diffusion coefficient in water $ {D}_{W} $ 6.7 × 10⁻⁹ m2 s−1 Oxygen diffusion coefficient in MPL $ {D}_{MPL} $ 1.5 × 10⁻⁶ m2 s−1 Oxygen diffusion coefficient in CL $ {D}_{CL} $ 6.0 × 10⁻⁷ m2 s−1 Physical length of one lattice $ {\Delta }{x}_{phys} $ 1.0 × 10⁻⁶ m Physical time of one LBM time step $ {\Delta }{t}_{phys} $ 4.7 × 10⁻⁸ s The values of some basic parameters come from http://webbook.nist.gov/chemistry/fluid and several works[19,20,40,41].Table 1.
The values of some basic parameters for LBM simulations.
-
Single-layer GDL Multilayer GDL Case PTP DP (µm) Case PTP (bottom-middle-top) DP (µm) Case 1 0.600 7−10 Case 8 0.900−0.800−0.700 7−10 Case 2 0.650 7−10 Case 9 0.875−0.800−0.725 7−10 Case 3 0.700 7−10 Case 10 0.850−0.800−0.750 7−10 Case 4 0.750 7−10 Case 11 0.825−0.800−0.775 7−10 Case 5 0.800 7−10 Case 12 0.775−0.800−0.825 7−10 Case 6 0.850 7−10 Case 13 0.750−0.800−0.850 7−10 Case 7 0.900 7−10 Case 14 0.725−0.800−0.875 7−10 Case 15 0.700−0.800−0.900 7−10 PTP represents the GDL porosity along the TP direction; DP refers to the GDL fiber diameter. Table 2.
Structural parameters of the single-layer and the multilayer GDL.
Figures
(13)
Tables
(2)