-
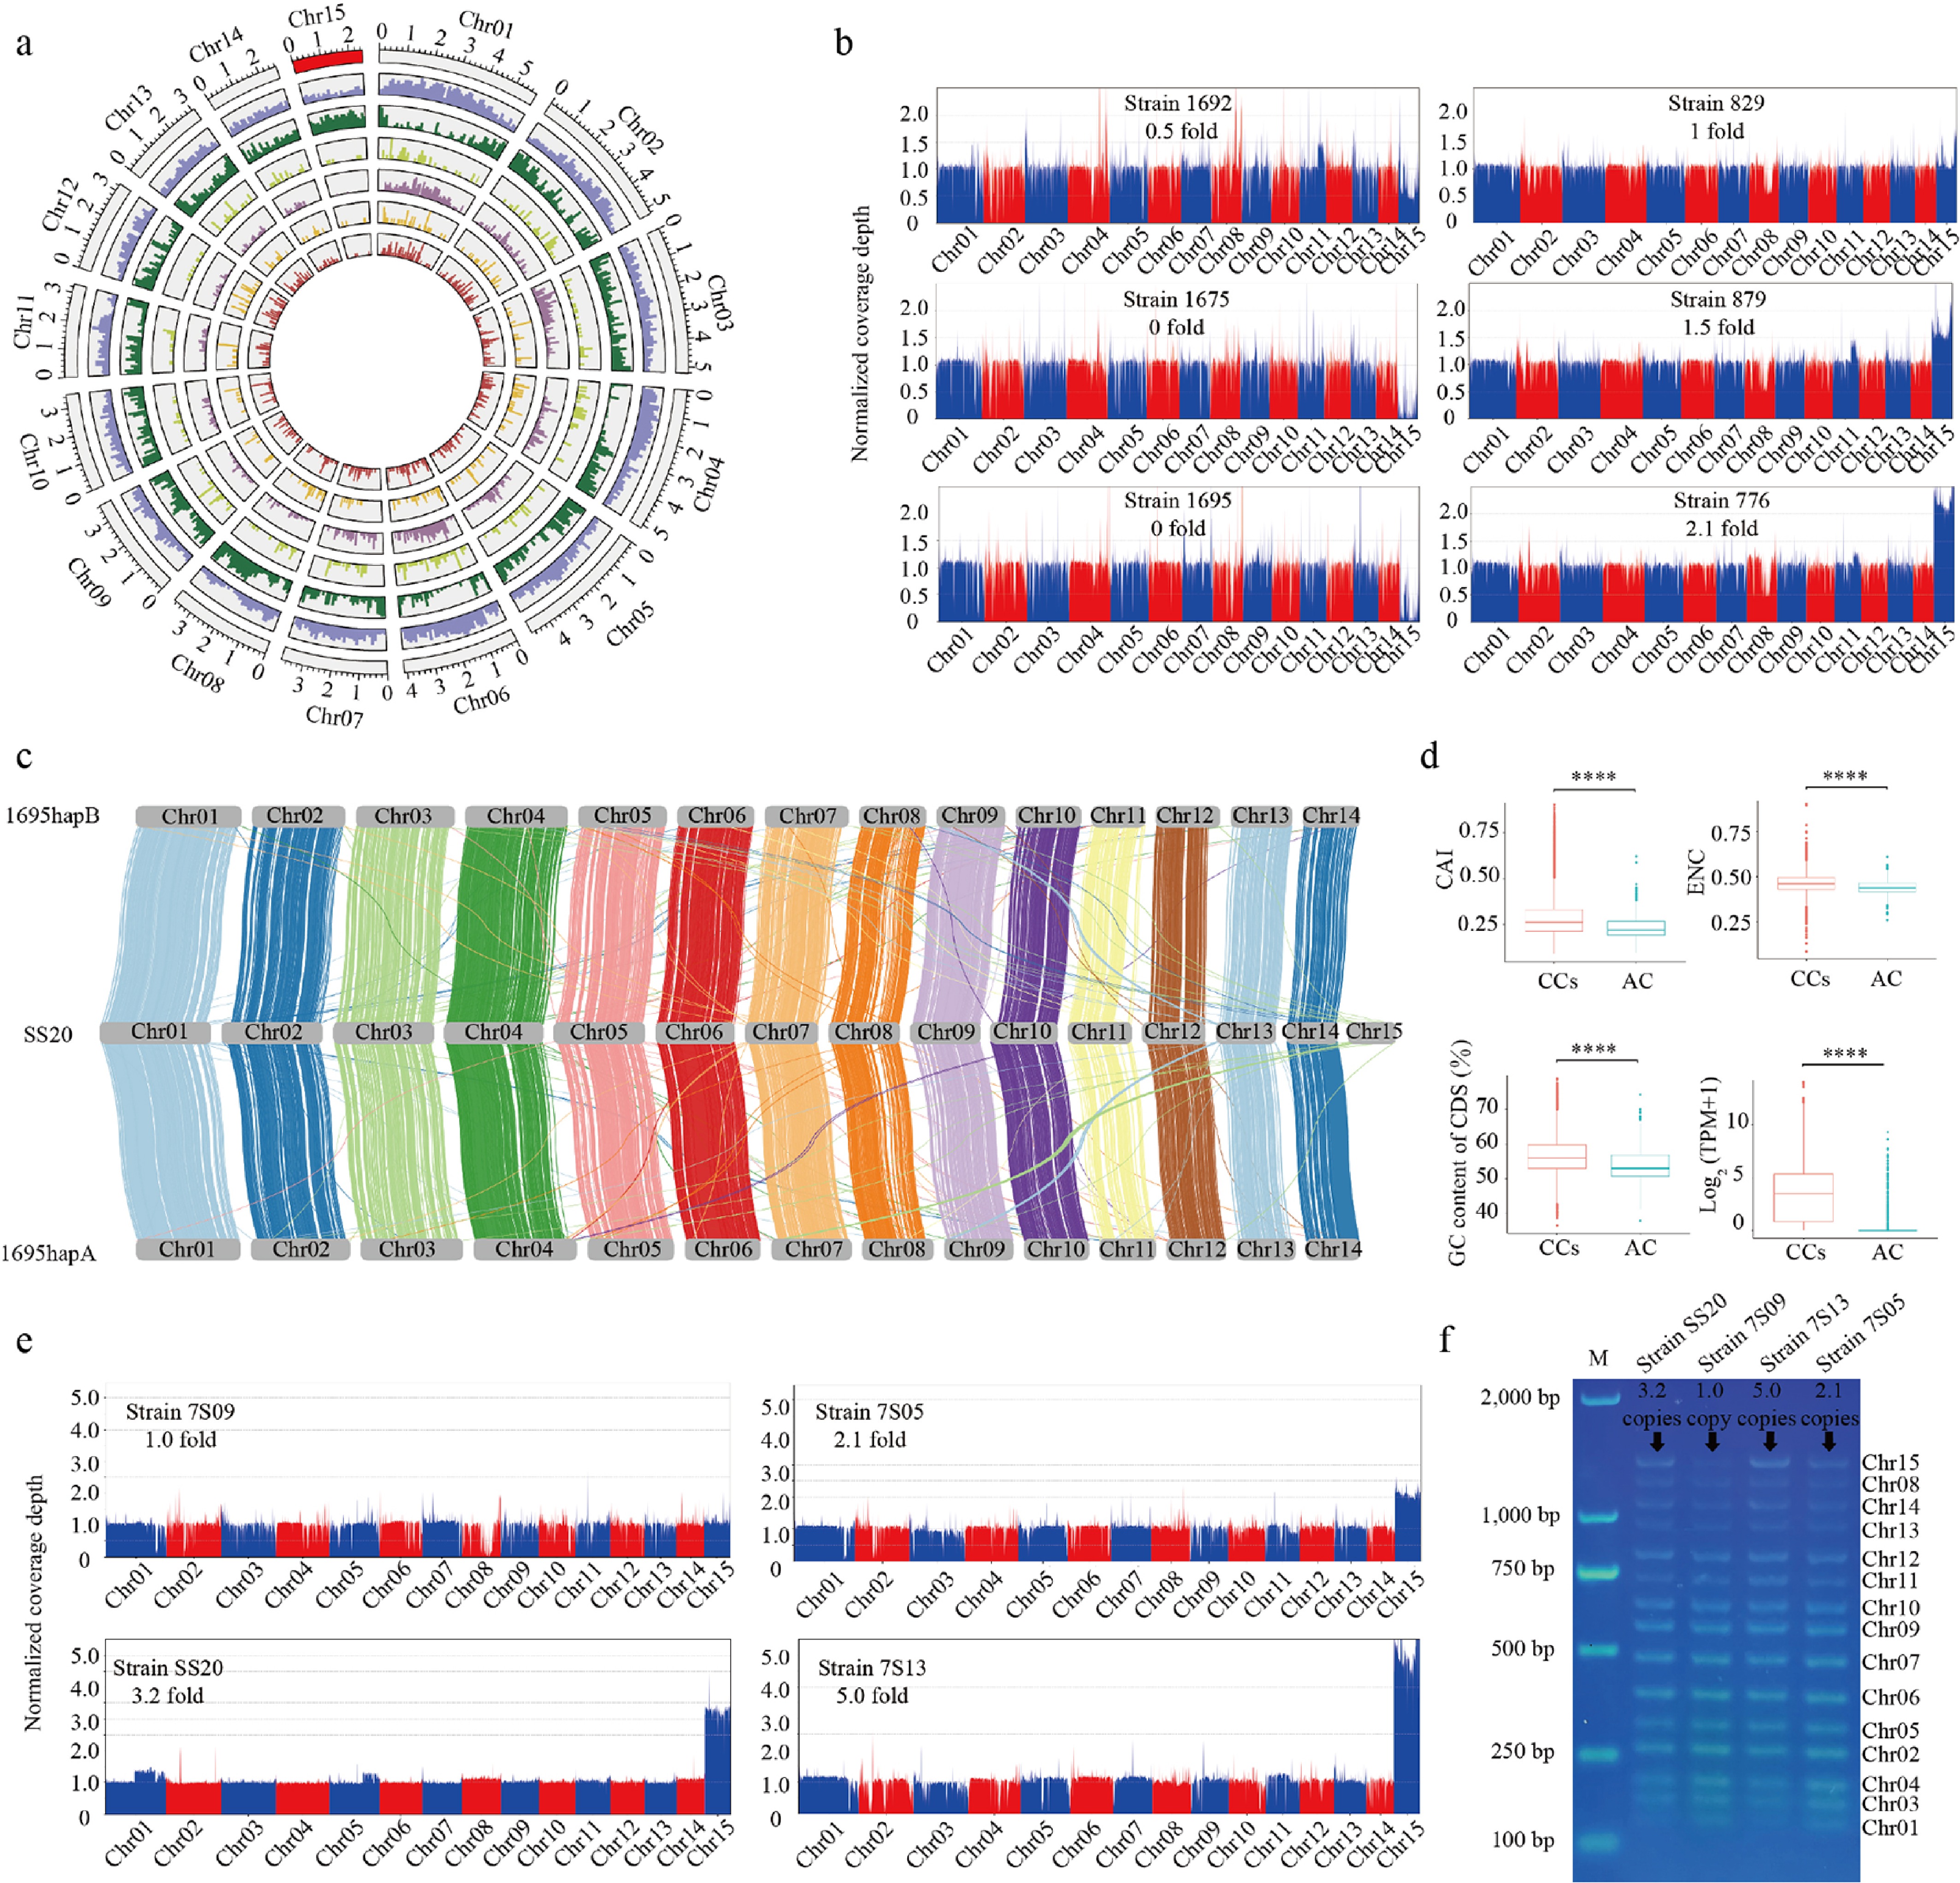
Figure 1.
Confirmation of Chr15 as an accessory chromosome (AC). (a) Circos plot of the T2T_SS20 genome. The AC is highlighted in red. Moving inward from the periphery, the tracks show chromosome length, gene density, repetitive sequences, proteases, BUSCO genes, CAZymes, and secretory proteins. (b) Detection of variable ploidy of AC in heterokaryotic strains using resequencing data. Six representative strains are shown here; the remaining 28 strains are presented in Supplementary Fig. S5. (c) Genome-wide synteny analysis comparing the two haplotypes of strain 1695 with the T2T_SS20 genome. (d) Codon usage bias of AC genes assessed using the Mann–Whitney U test. A total of 13,405 genes from CCs and 374 genes from the AC are analyzed (**** p < 0.0001). (e) Detection of variable ploidy of Chr15 in sexual progeny derived from strain 776 using resequencing data. Four representative strains are shown here; the remaining 23 strains are presented in Supplementary Fig. S6. (f) Different ploidy levels of AC detected by multiplex PCR. The inferred copy number of the AC based on resequencing coverage is indicated. Primer sets used are detailed in Supplementary Table S2. Increased band intensity corresponds to additional copies (indicated by arrowheads). M: marker; SS20, 7S09, 7S13, and 7S05 are the analyzed strains.
-
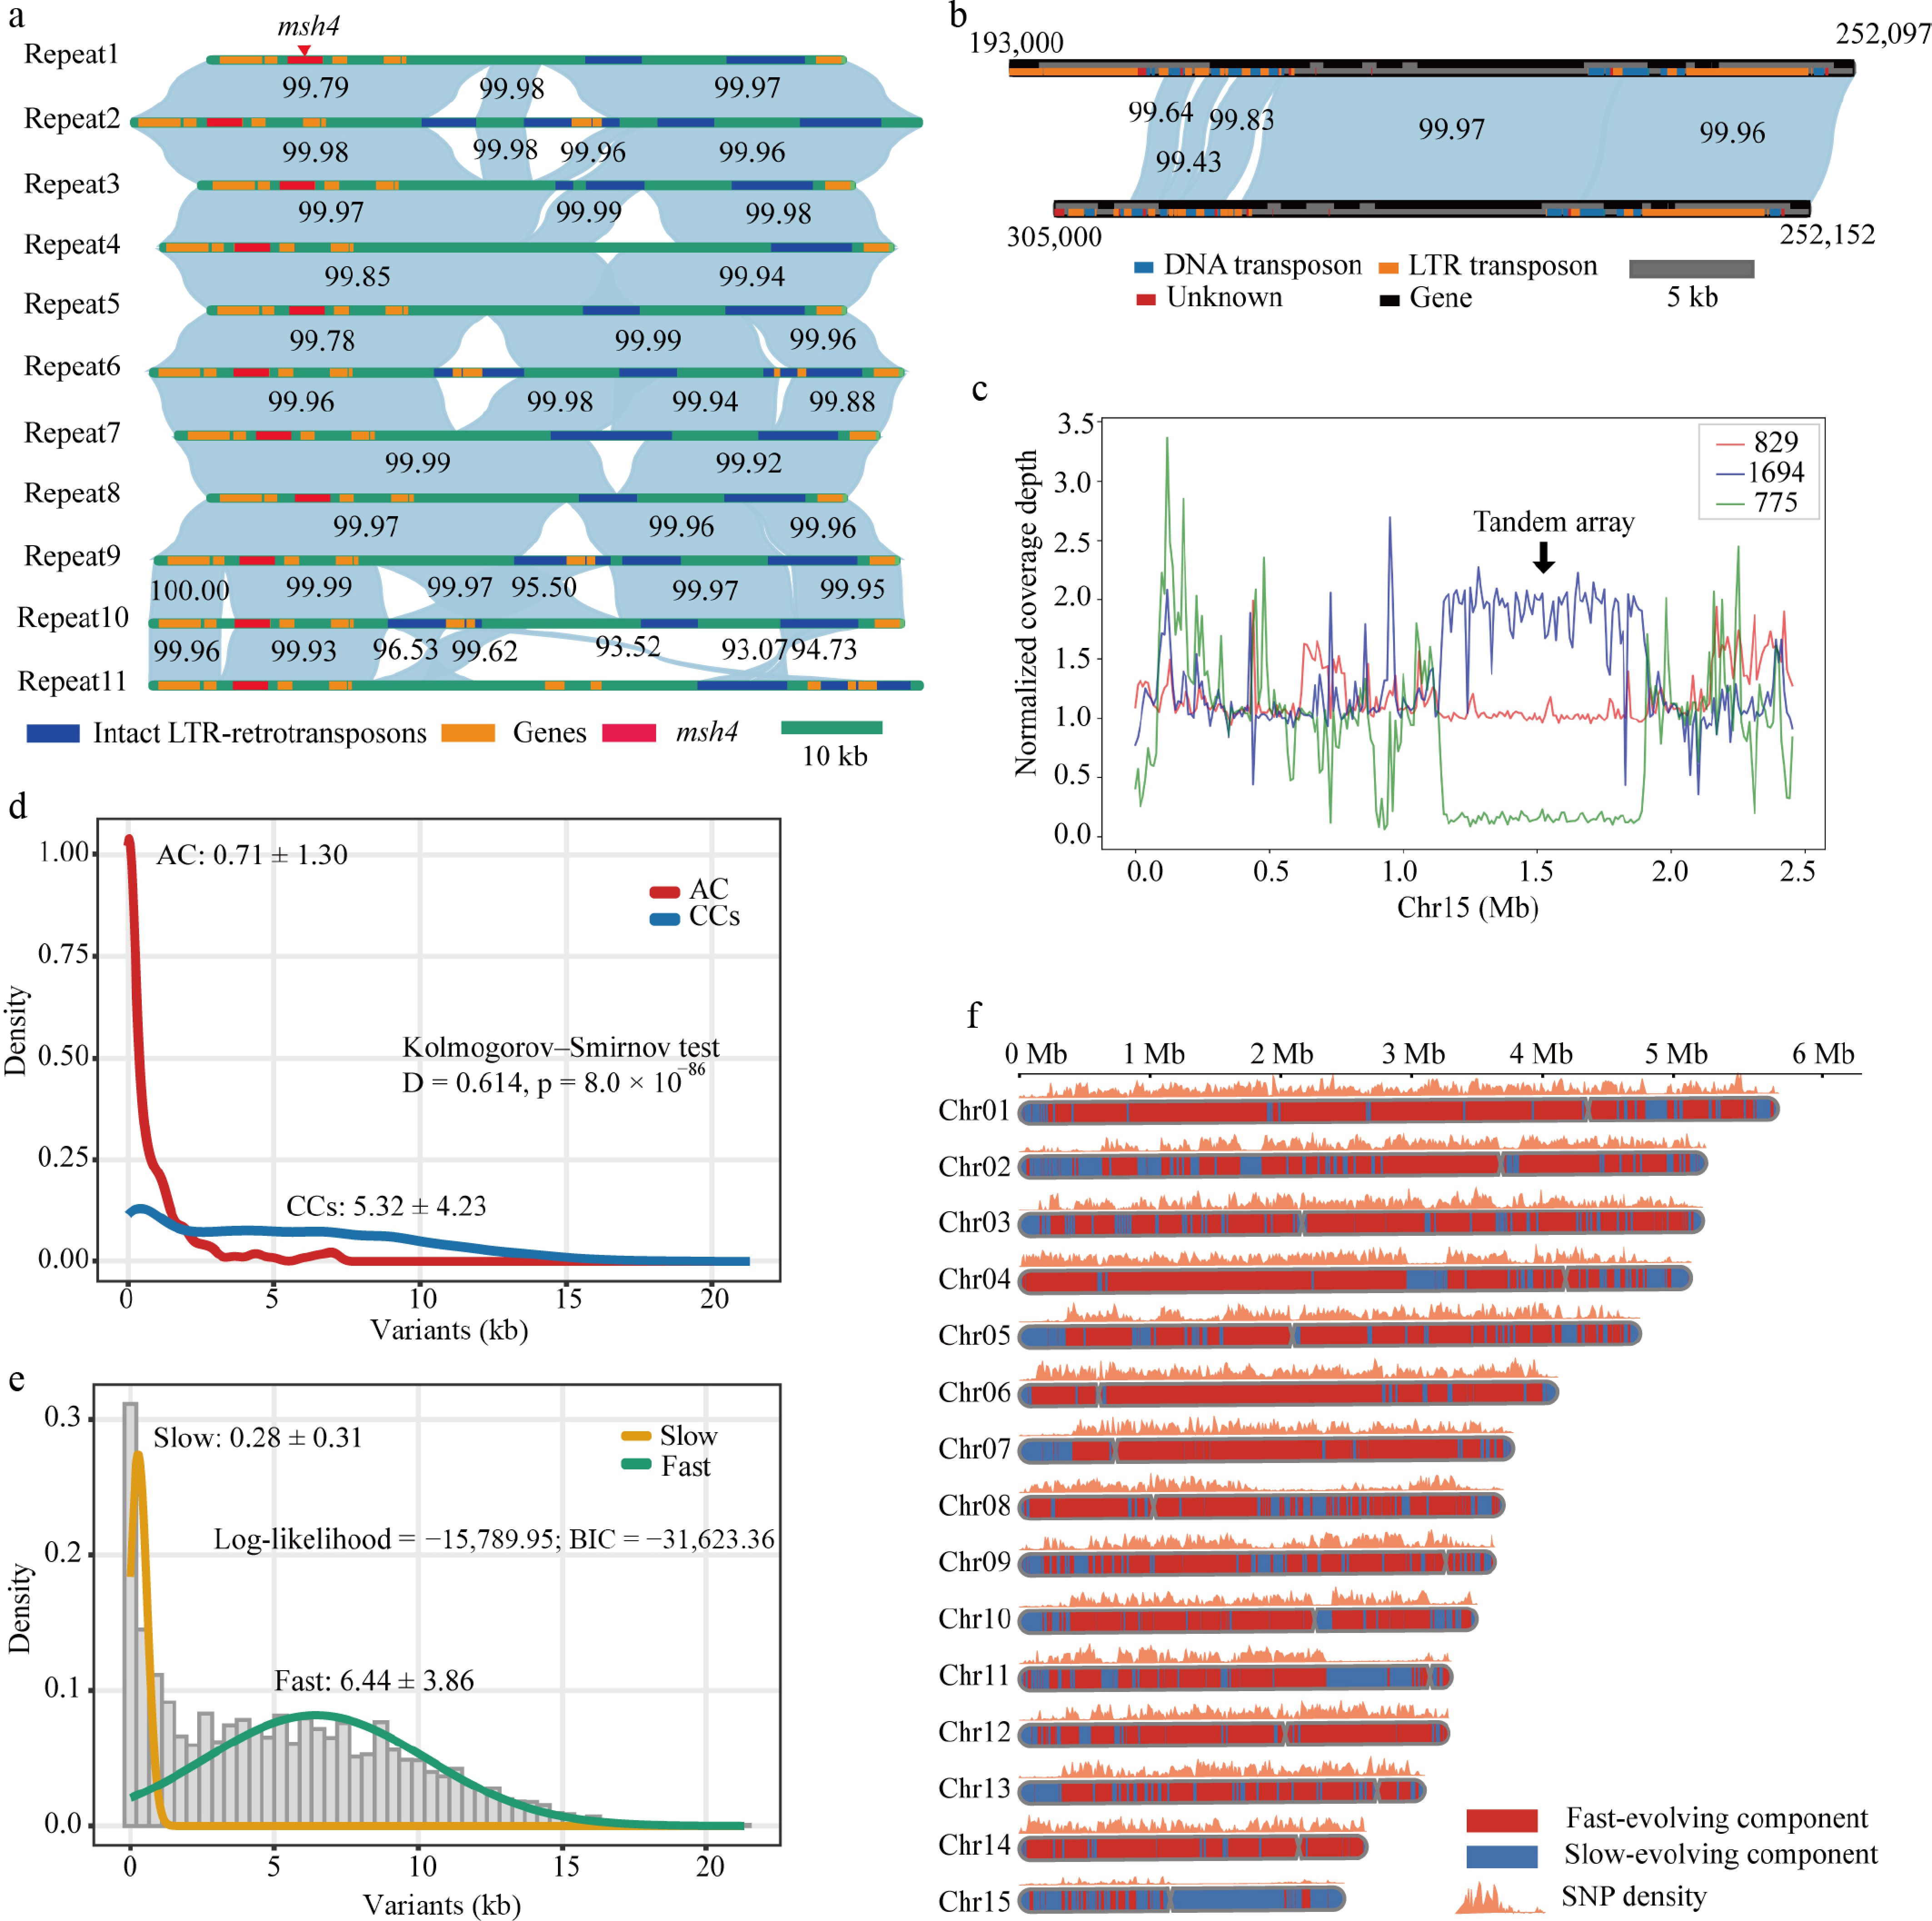
Figure 2.
Genomic features and evolution of the accessory chromosome (AC). (a) Tandem array structure on the AC. Pairwise alignments among the 11 tandem repeat units (Repeat1–Repeat11) on the AC reveal a high degree of collinearity and sequence identity. Shaded ribbons connect homologous regions between repeat units, with percentage sequence identity indicated. Gene models, including protein-coding genes, the msh4 locus, and intact LTR retrotransposons, are shown along each repeat unit. (b) Large inverted repeat structure on the AC. Sequence identity between the two inverted repeat arms is represented by the shaded ribbon. Colored tracks indicate annotated genomic features, including protein-coding genes and repeat elements. The numerical labels indicate the positions of structures on the AC. (c) Dosage plasticity of the tandem array across heterokaryotic strains. Strains 775, 829, and 1694 are heterokaryotic strains exhibiting different copy numbers of the tandem array. (d) Distribution of SNP density in AC and CCs. Distributions of SNP density (variants per kb) show that the AC exhibits a significantly lower SNP density than the CCs. (e) Histogram of SNP density in 10-kb windows, with two Gaussian components estimated using the Expectation–Maximization algorithm. (f) Distribution of fast- and slow-evolving regions across chromosomes.
-
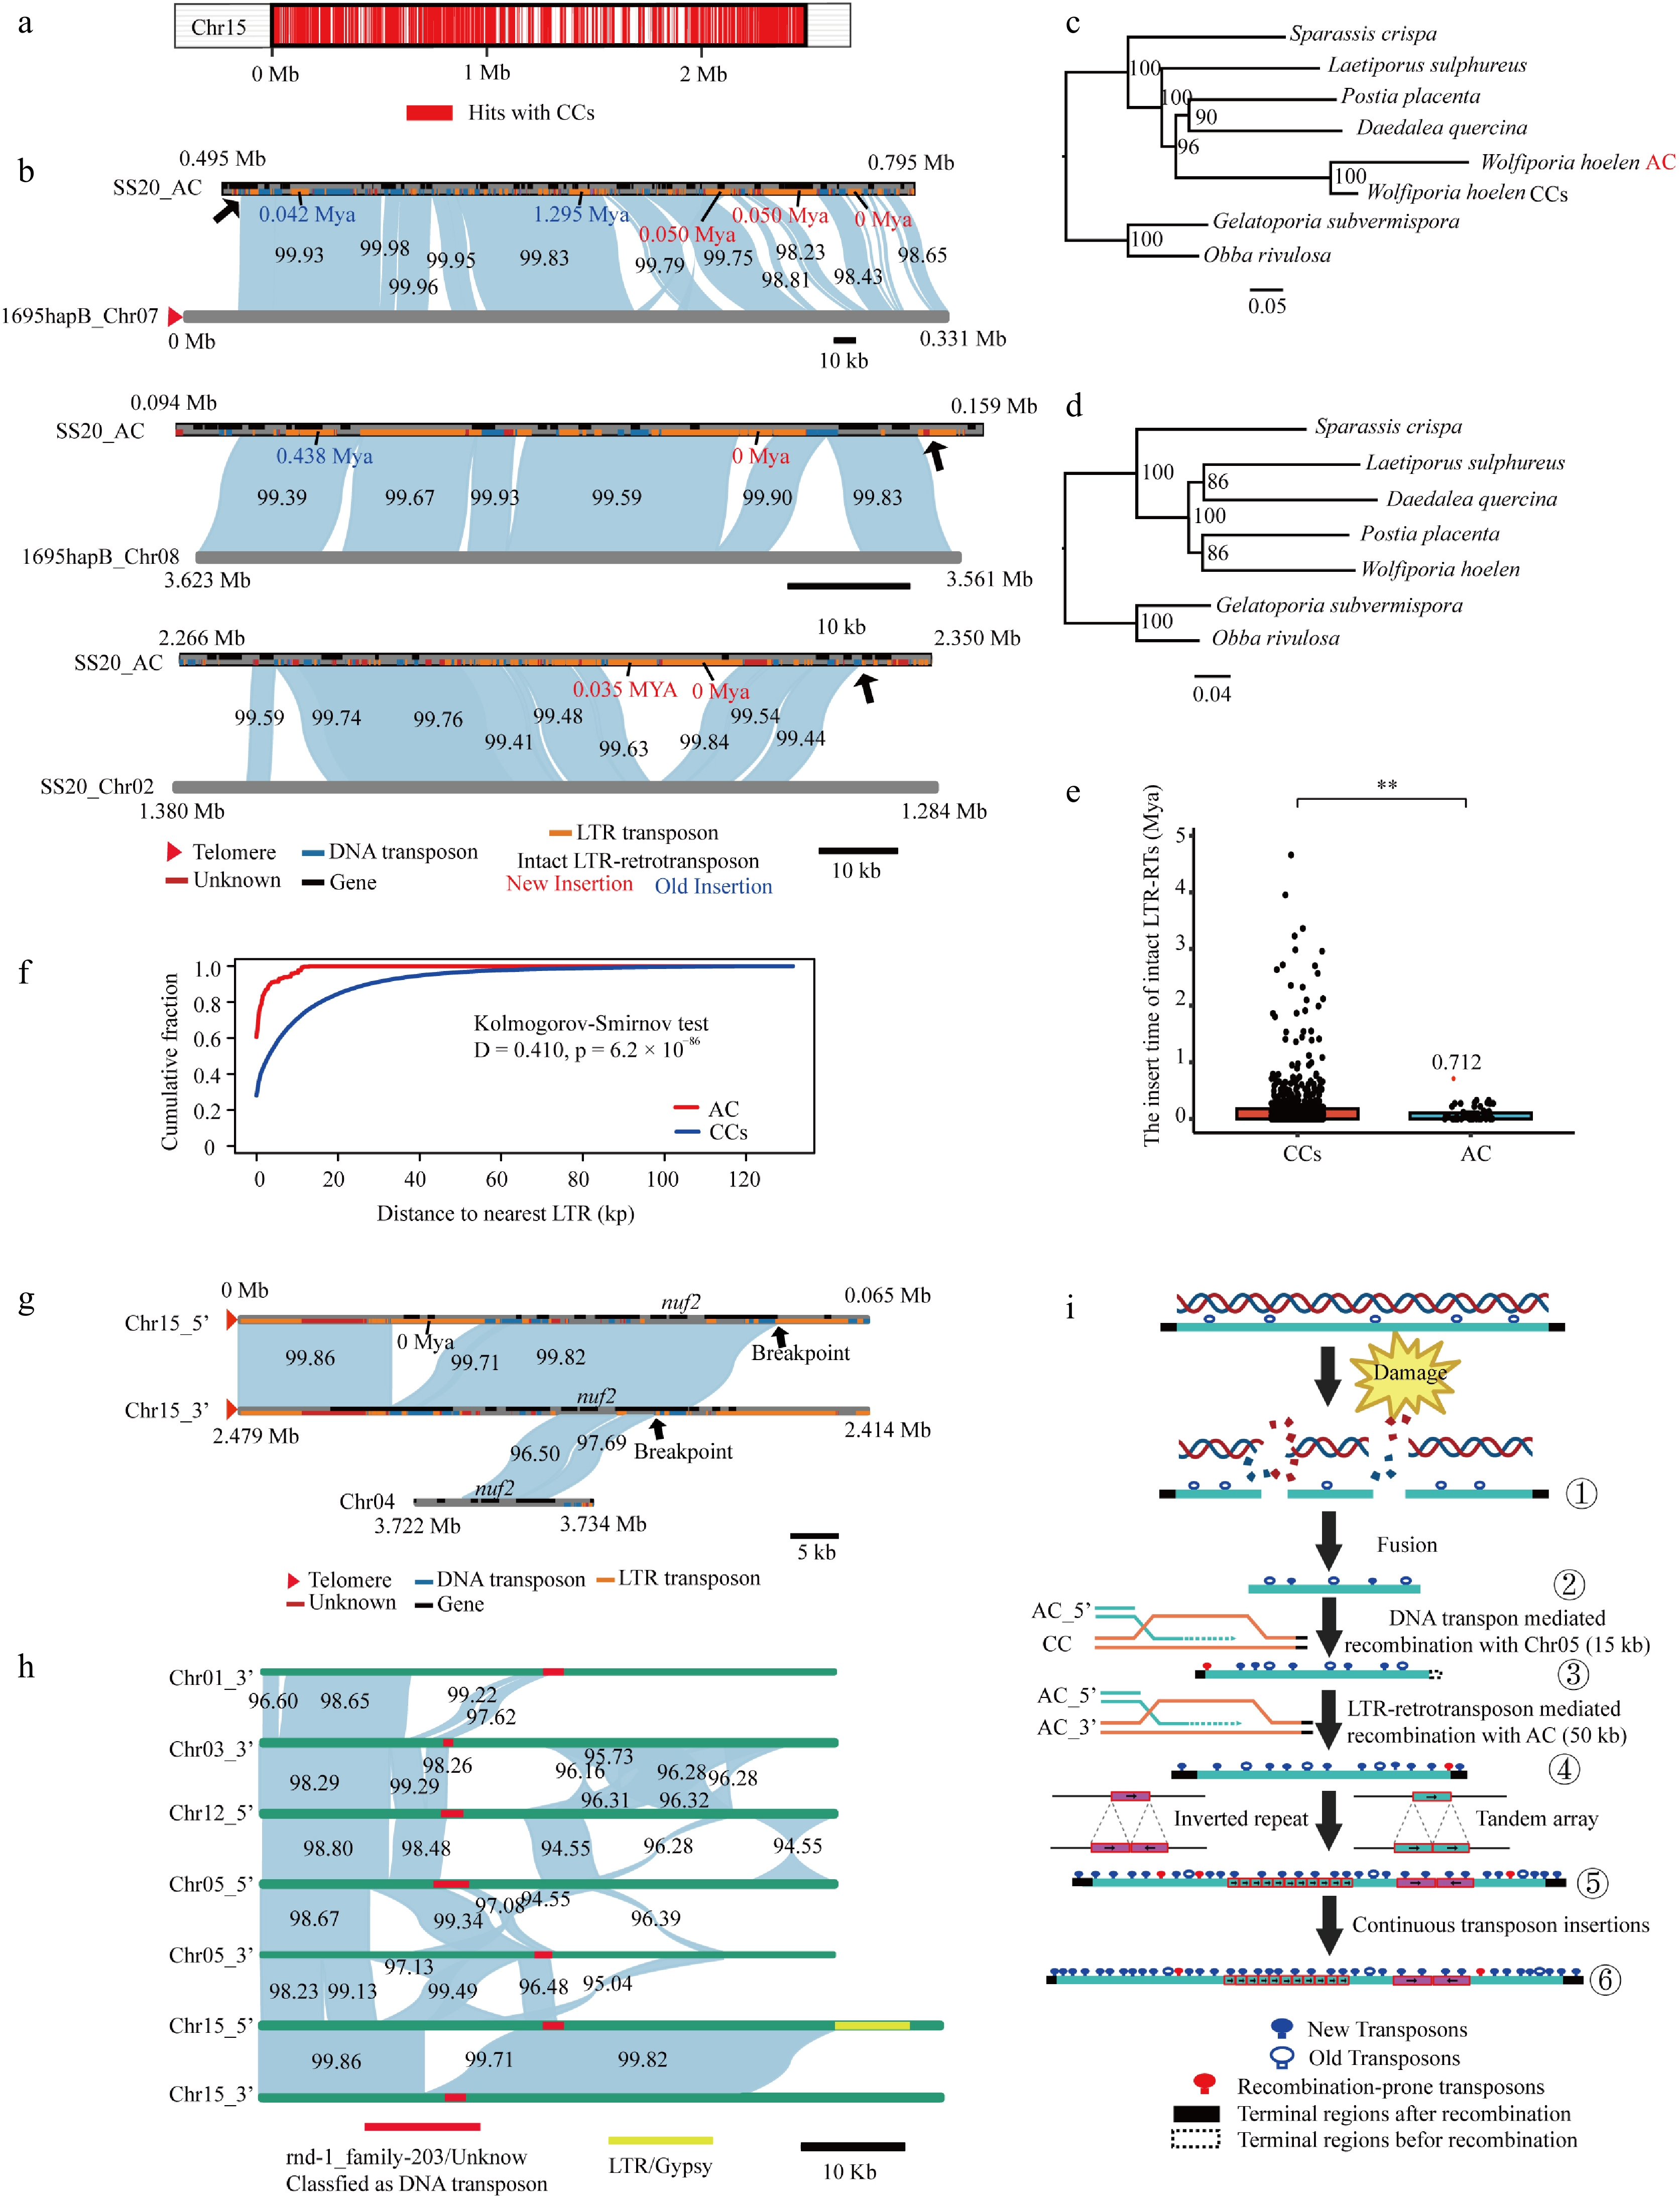
Figure 3.
Evidence supporting an endogenous origin and TE-associated structural evolution of the accessory chromosome (AC). (a) Genome-wide distribution of homologous regions between AC and CCs. (b) Three large syntenic regions between CCs and AC. The first two regions correspond to 1695 hapB, and the third corresponds to T2T_SS20 Chr04. Shaded ribbons connect syntenic regions, with sequence identity indicated. Insertion times of intact LTR retrotransposon (LTR-RT) on the AC are marked. Black arrows indicate TE-enriched breakpoint regions. (c) Phylogenetic tree based on 50 shared single-copy orthologous proteins from the CCs, AC, and six related Polyporales species. (d) Phylogenetic tree based on 3,344 shared single-copy orthologous proteins of W. hoelen and six related Polyporales species. (e) Comparison of LTR insertion times between AC and CCs using the Mann–Whitney U test (CCs: 787 insertions; AC: 46 insertions; ** p < 0.01). The red outlier represents a putative ancestral insertion that was undetected in the CCs of SS20 and 1695 genomes, as it deviates from the remaining data points. Mya, million years ago. (f) Cumulative distribution of absolute distances between genes and LTR-RT elements on the AC and CCs. (g) Collinearity of genomic regions harboring CC and AC nuf2. TE-enriched breakpoint regions are marked by black arrows. Straight line denotes the LTR insertion time. (h) Collinearity between AC termini and potential CC source regions. (i) Proposed model for the origin and evolution of the AC. Damage and breakage of an ancestral chromosome generated a fragmented intermediate, which subsequently fused and acquired telomeric ends through sequential transposon-mediated recombination events. The 5' end formed by DNA transposon-mediated recombination with Chr05 across a 15 kb homologous region, whereas the opposite end was stabilized by LTR retrotransposon-mediated recombination with the AC itself across a 50 kb homologous region, leading to telomere homogenization. Subsequent structural rearrangements, including inverted repeats and tandem arrays, together with continuous transposon insertions, drove further remodeling and expansion of the chromosome. Blue filled symbols indicate new transposons, blue open symbols indicate old transposons, and red symbols indicate recombination-prone transposons. Black and dashed boxes mark terminal regions after and before recombination, respectively. Step 1, chromosome breakage. Step 2, chromosome fusion. Step 3, telomere acquisition. Step 4, telomere homogenization. Step 5, structural evolution. Step 6, chromosome expansion.
-
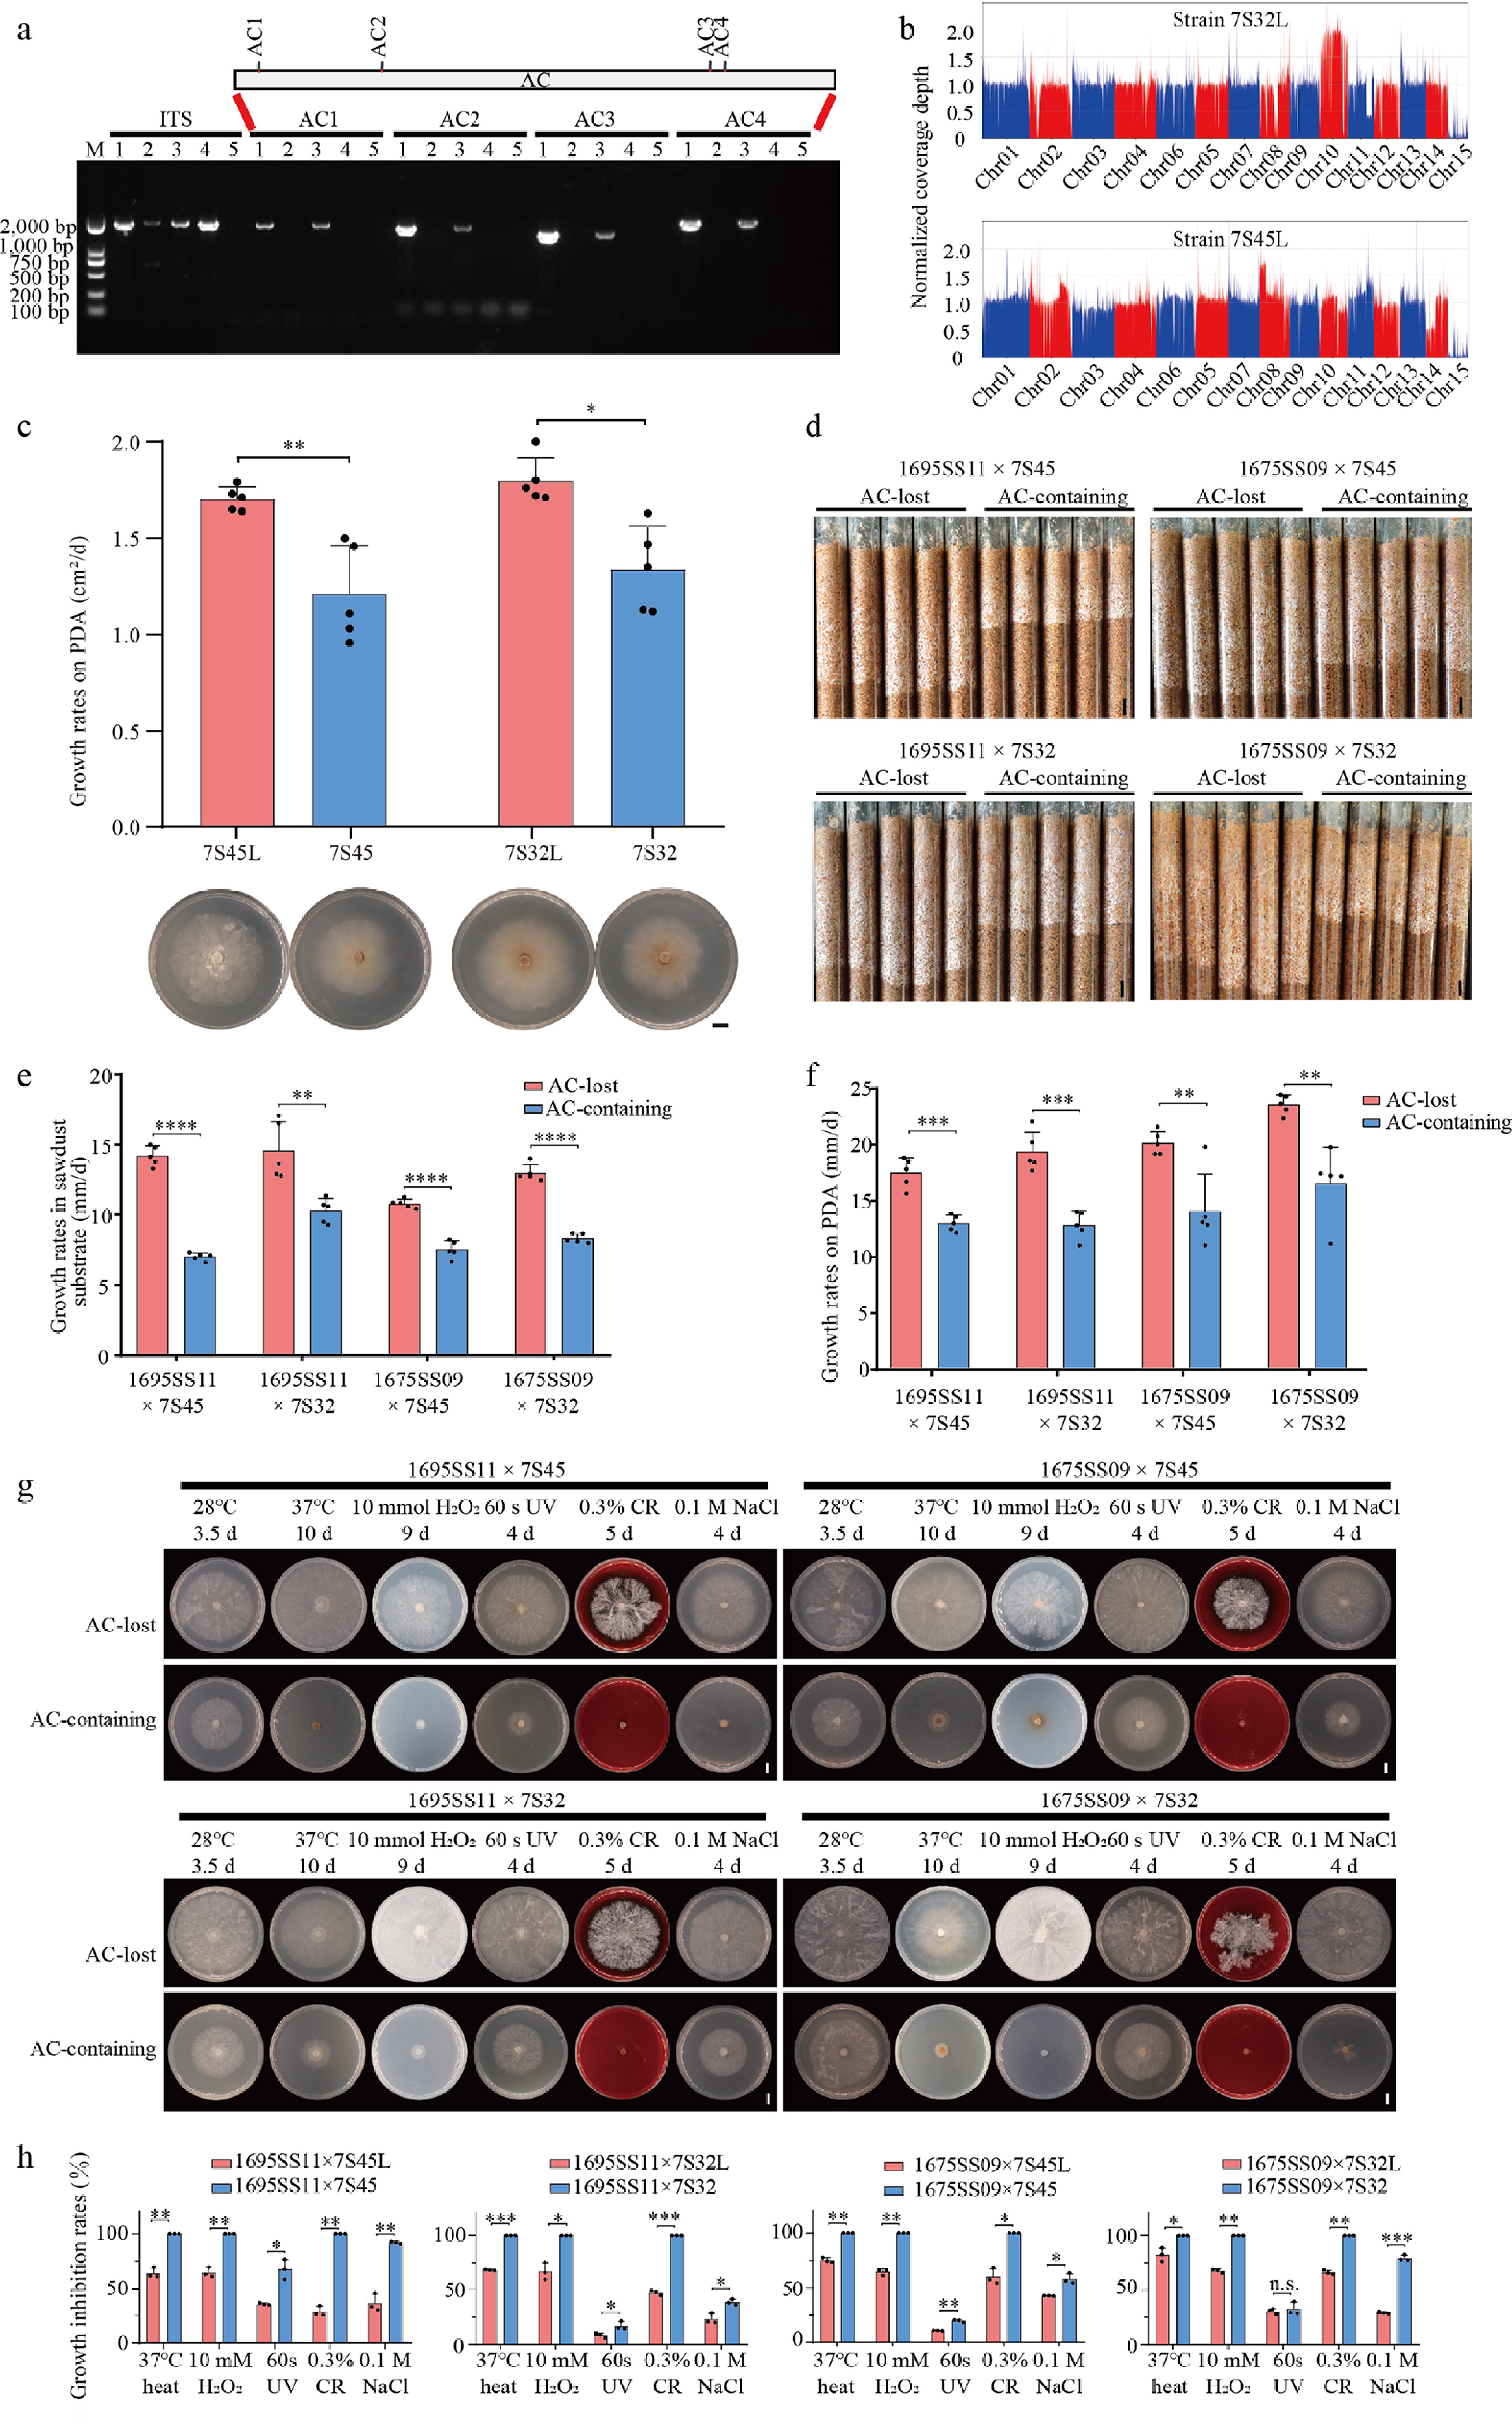
Figure 4.
Phenotypic consequences of the accessory chromosome (AC) loss. (a) PCR confirmation of AC loss during culturing on PDA supplemented with 50 μg/mL benomyl. AC1–AC4 denote four distinct segments of the AC, with their positions schematically shown above the gel image. Primer sequences are provided in Supplementary Table S4. ITS, internal transcribed spacer; M, DNA marker; lane 1, strain 7S32; lane 2, strain 7S32L; lane 3, strain 7S45; lane 4, strain 7S45L; lane 5, H2O (negative control). 7S32L and 7S45L are AC-loss derivatives of 7S32 and 7S45, respectively. (b) Normalized whole-genome resequencing coverage profiles confirming loss of the AC. (c) Comparison of growth rates on PDA before and after AC loss in two sexual progeny (independent-samples t-test, n = 5; * p < 0.05; ** p < 0.01). Bar = 1 cm. (d), (e) Phenotypic comparison and growth rates of AC-containing and AC-lost strains in pine sawdust across four matched pairs of heterokaryotic strains (independent-samples t-test, n = 5; ** p < 0.01; **** p < 0.0001). Bar = 1 cm. (f) Growth rates of AC-containing and AC-lost strains on PDA across four matched pairs of heterokaryotic strains (independent-samples t-test, n = 5; ** p < 0.01; *** p < 0.001). (g) Representative colony of AC-lost and AC-containing heterokaryotic strains under multiple stress conditions. Strain combinations and incubation days are shown above each panel. Bar = 1 cm. (h) Growth inhibition of AC-containing and AC-lost heterokaryotic strains under multiple stress conditions. Growth inhibition rates of four matched pairs of heterokaryotic strains with (blue) or without (red) the AC under various stress treatments, relative to control conditions (28 °C) (CR, congo red; independent-samples t-test; n.s., not significant; * p < 0.05; ** p < 0.01; *** p < 0.001).
-
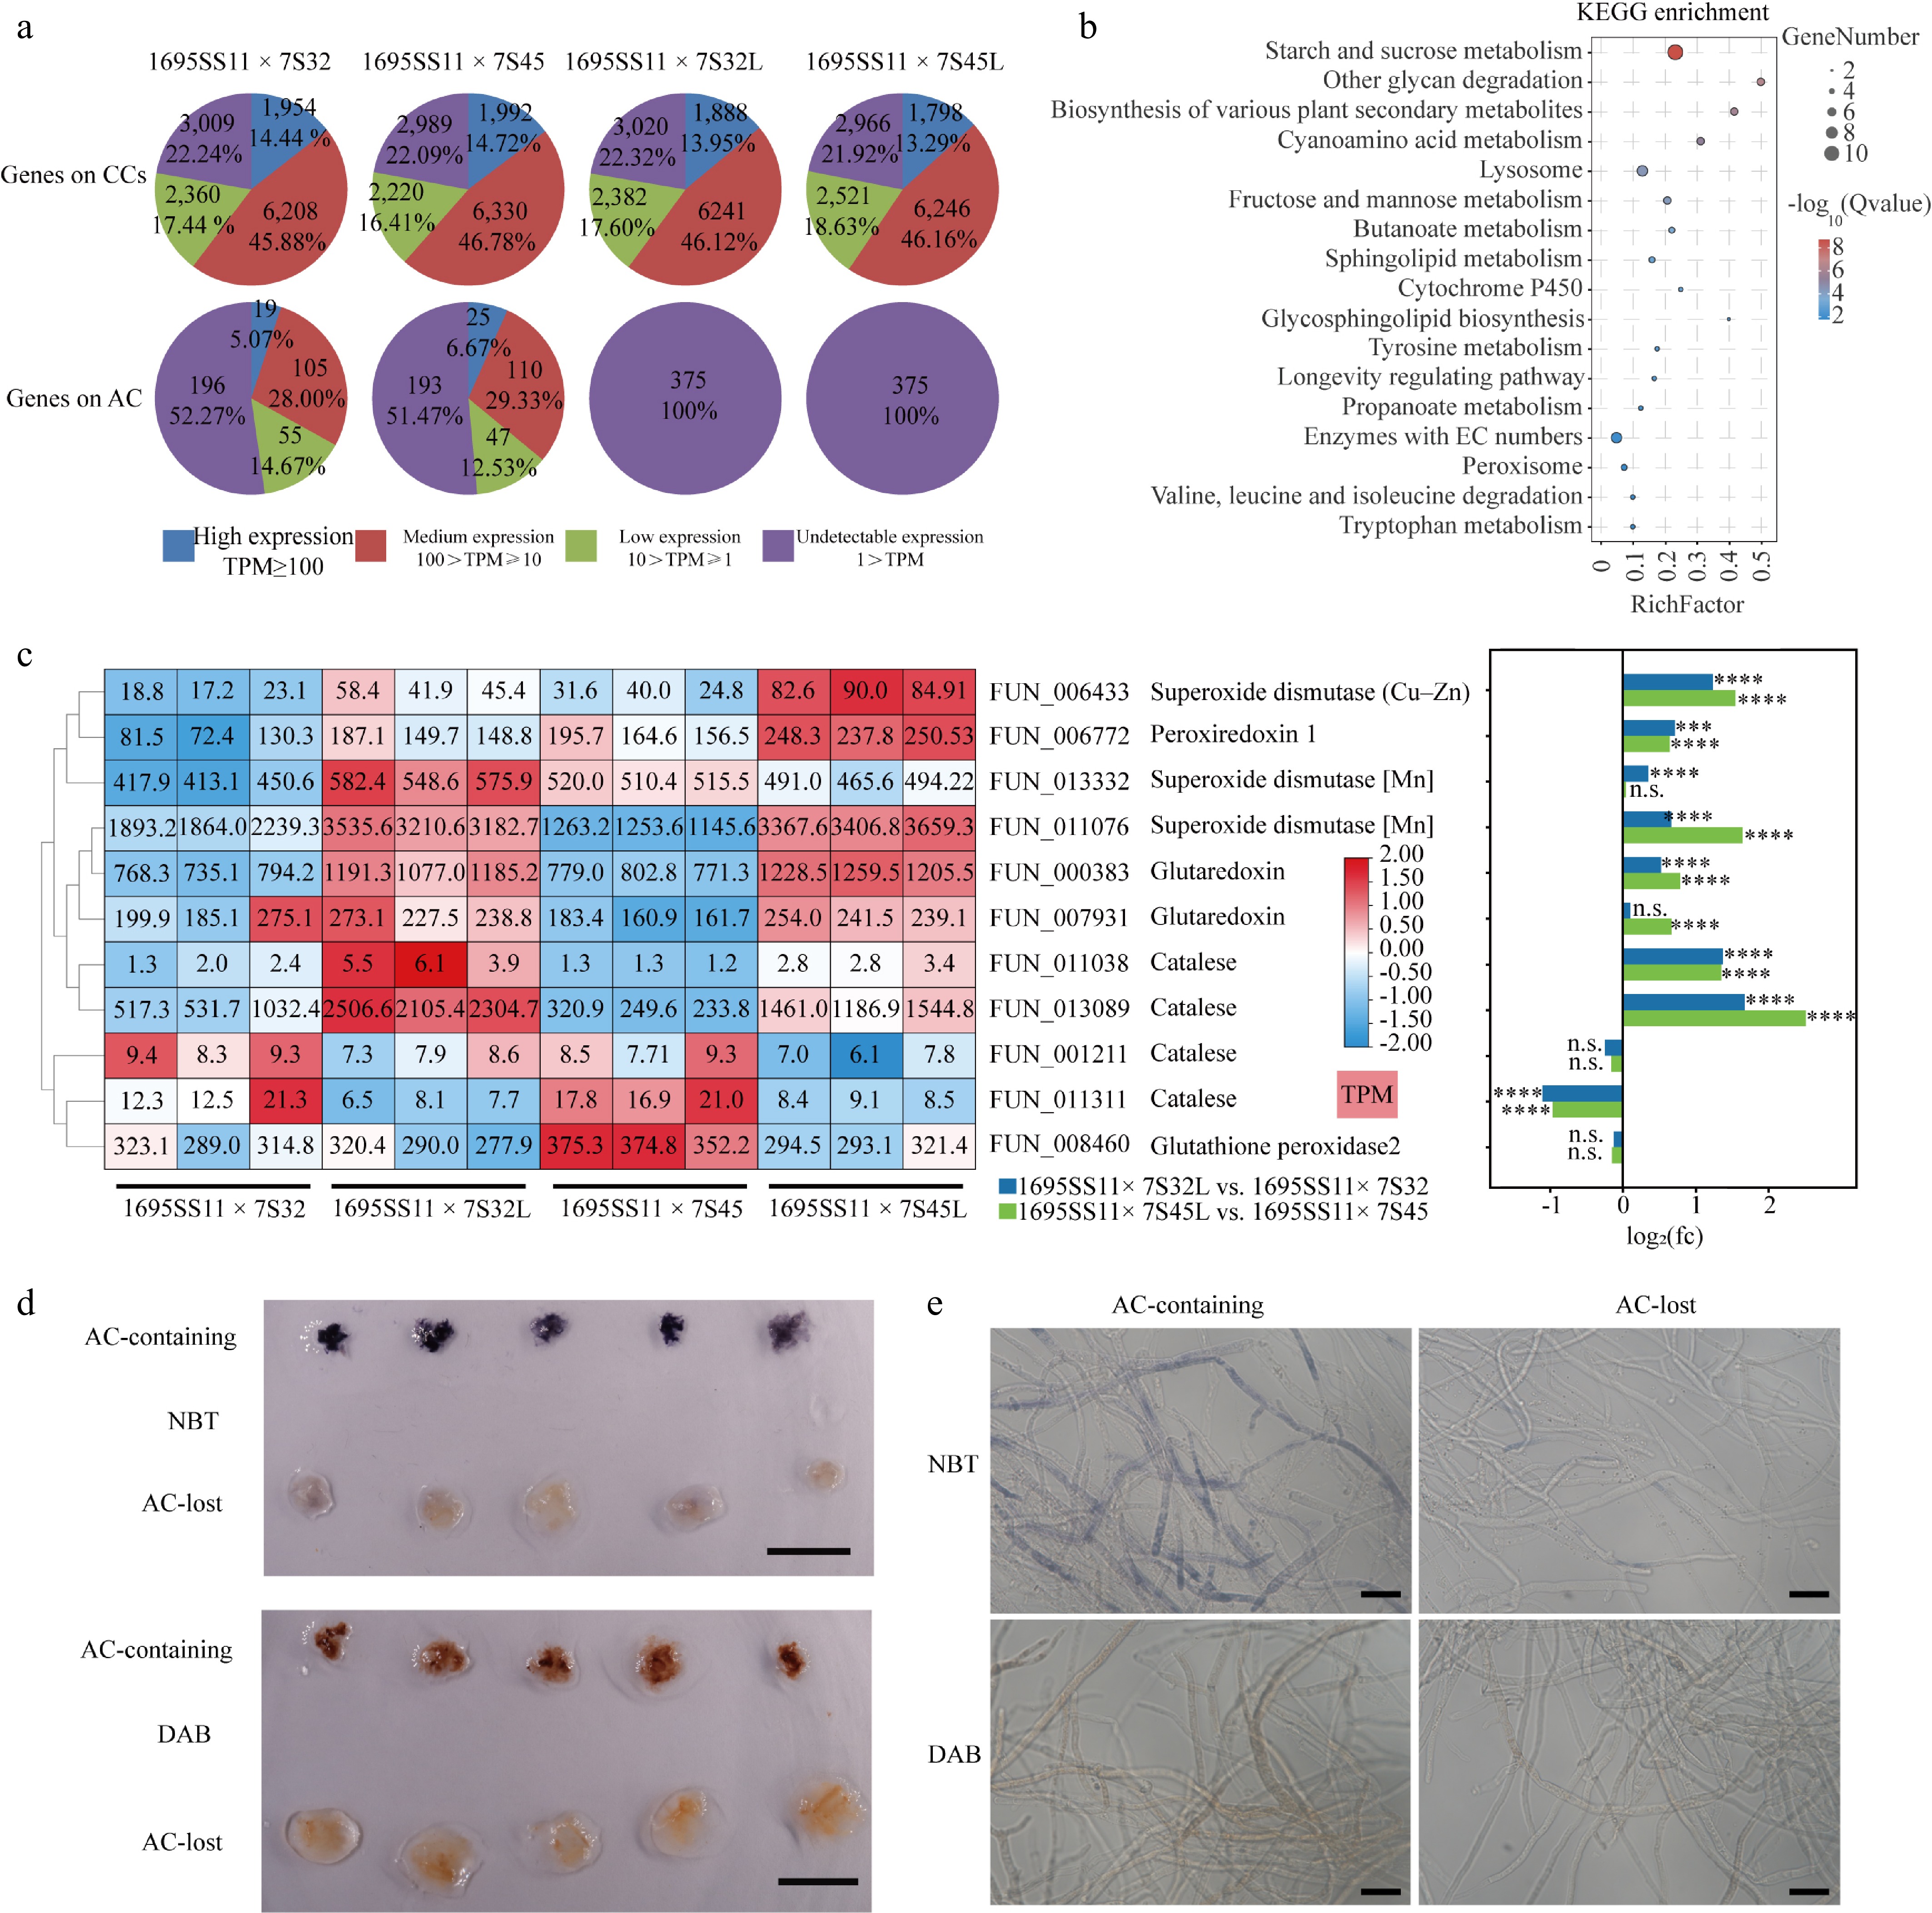
Figure 5.
Transcriptional consequences of the accessory chromosome (AC) loss. (a) Distribution of gene expression levels of CCs and AC in AC-containing and AC-lost strains on PDA. Pie charts show the proportions of genes grouped by expression level on CCs and the AC, based on TPM values from RNA-seq data. Numbers within each sector indicate gene counts and their corresponding percentages. (b) KEGG enrichment of upregulated genes following AC loss. (c) Expression changes in genes involved in antioxidant defense and ROS detoxification (DESeq2; n.s., not significant; *** q < 0.001; **** q < 0.0001). (d), (e) NBT and DAB staining of the AC-containing strain (1675SS09 × 7S32) and the AC-lost strain (1675SS09 × 7S32L). Bar = 1 cm. (f), (g) Microscopic observation of NBT and DAB staining in the AC-containing strain (1675SS09 × 7S32) and the AC-lost strain (1675SS09 × 7S32L). Bar = 20 μm. DAB, diaminobenzidine; NBT, nitro blue tetrazolium chloride.
-
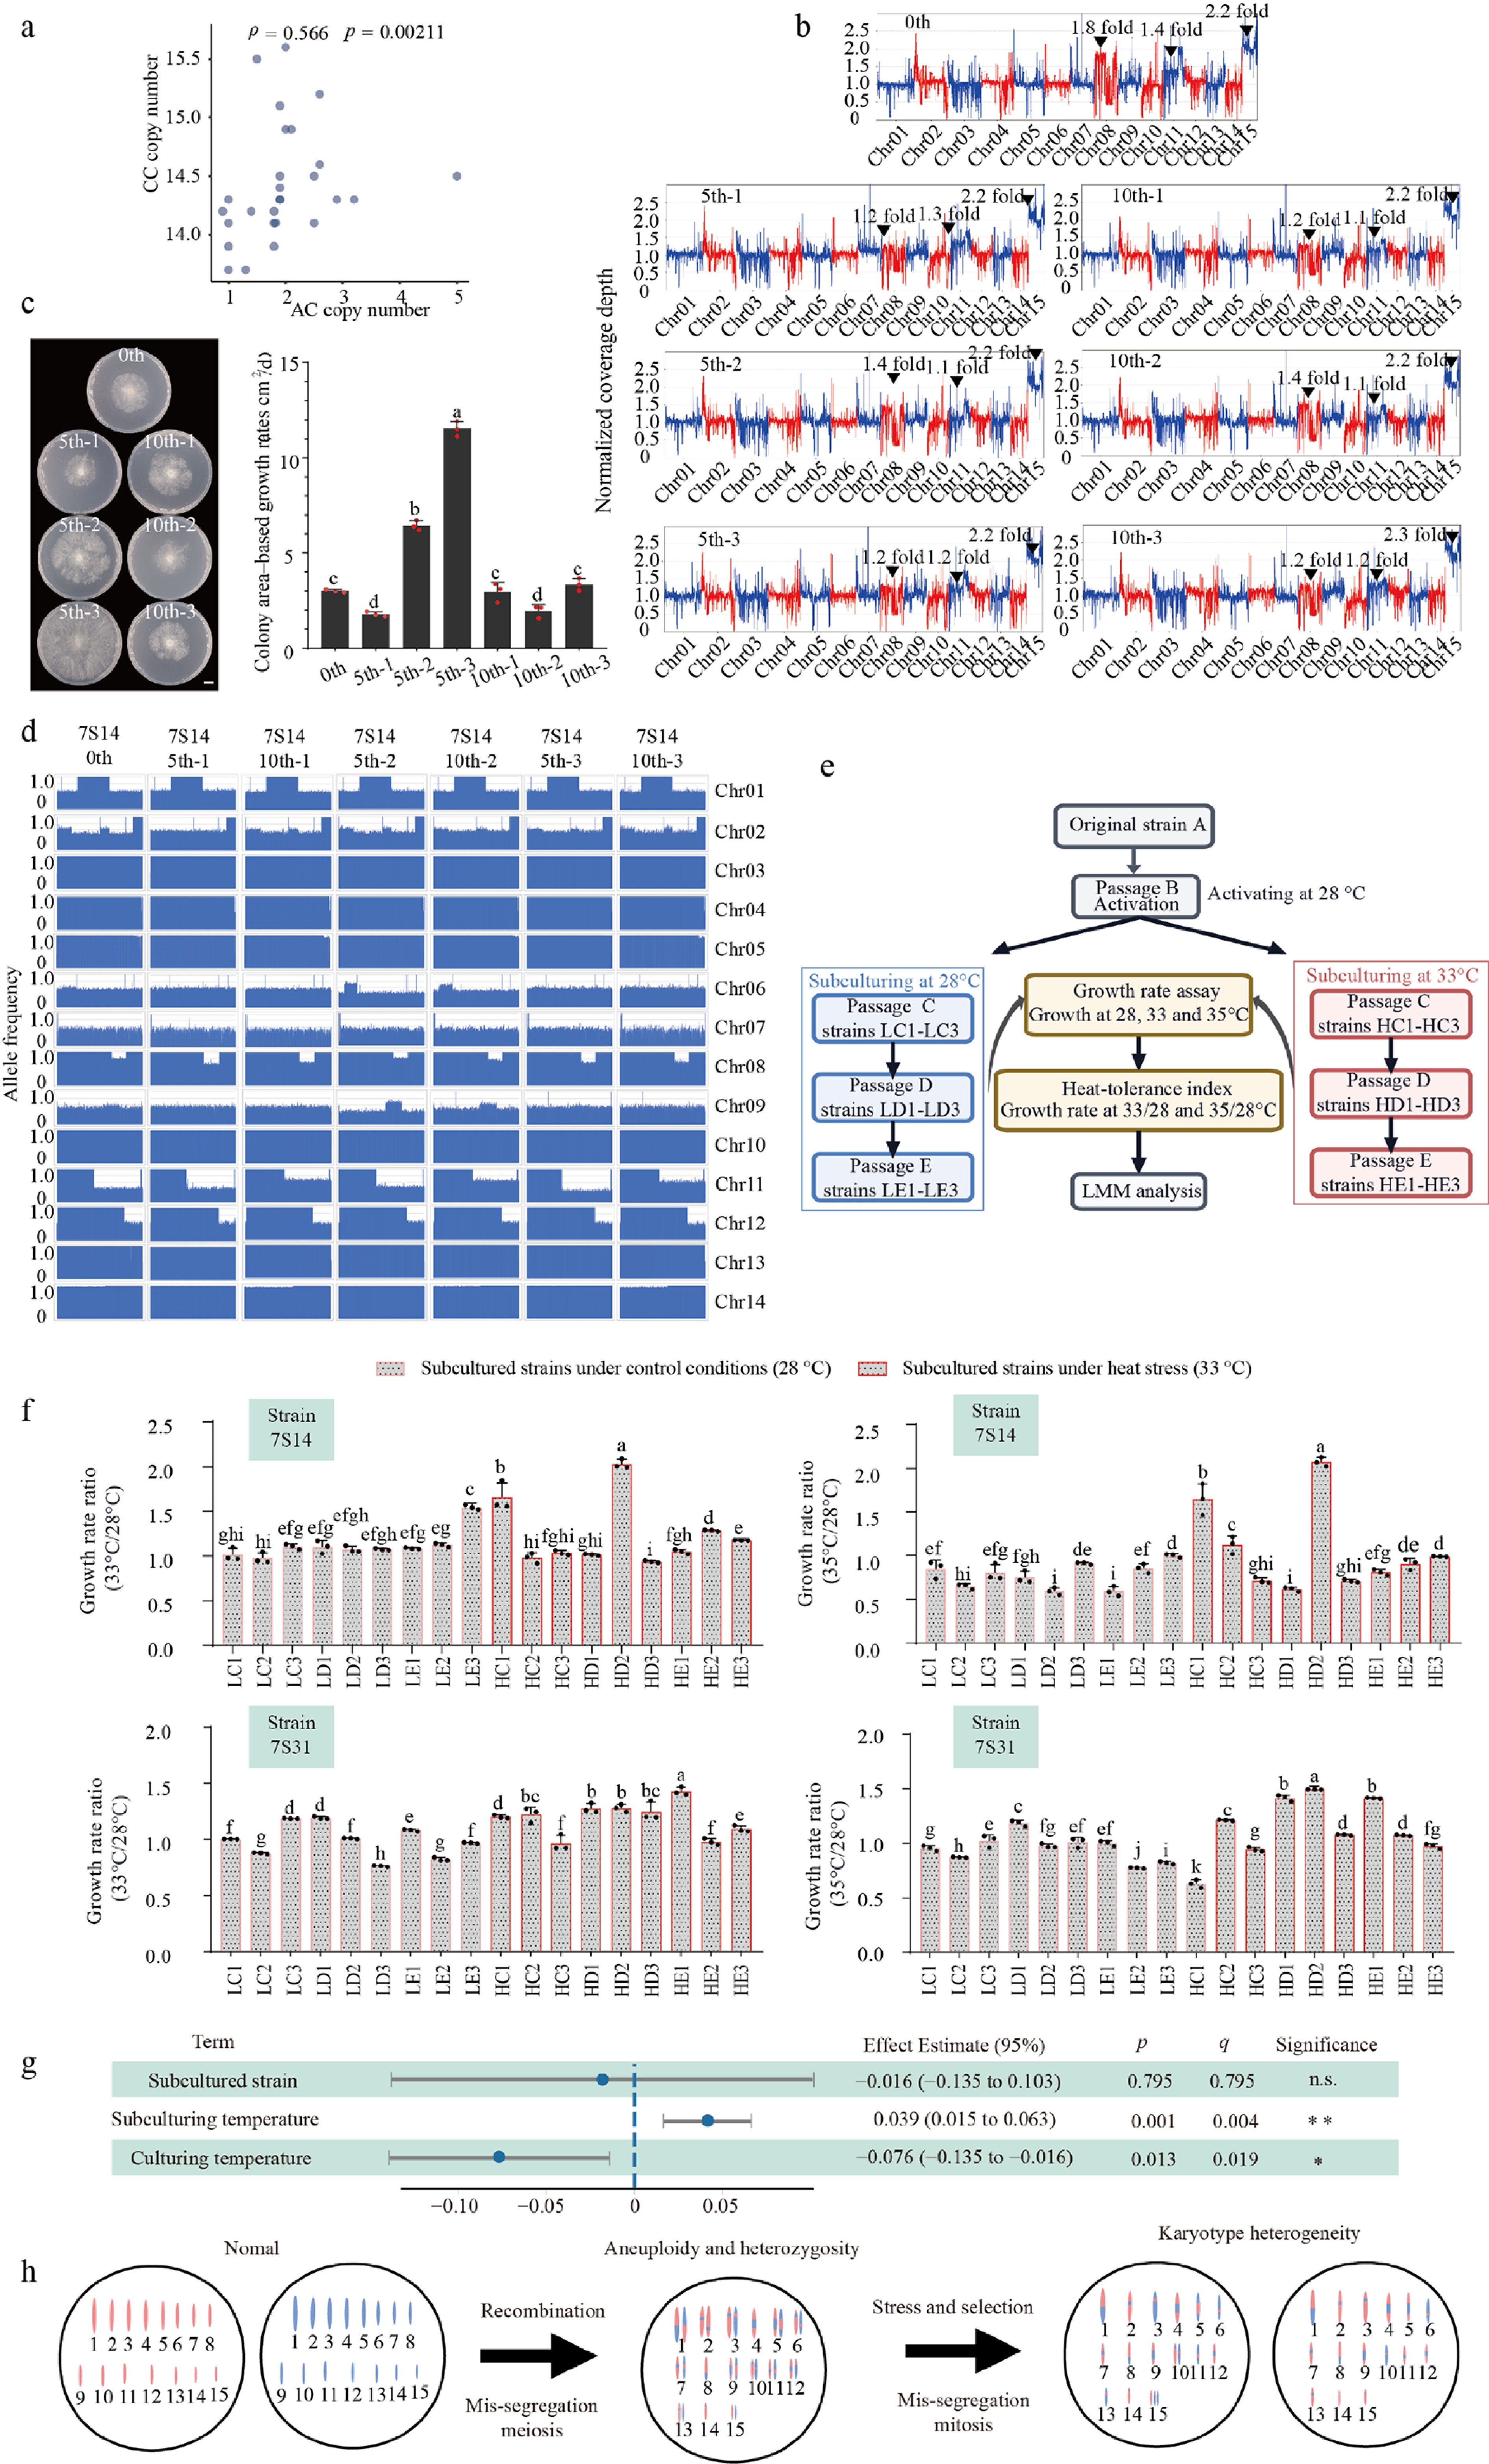
Figure 6.
Impact of accessory chromosome (AC) during the sexual phase. (a) Correlation between AC dosage and CC copy number in sexual progeny derived from strain 776 (Spearman's rank correlation test). (b) Genome coverage of strain 7S14 during serial subculturing (starting strain 0, 5th and 10th generations). Numbers indicate chromosome dosage inferred from normalized coverage. (c) Growth rates of sequenced subcultured derivatives on PDA. Groups labeled with different letters differ significantly according to the LSD post-hoc test (p < 0.05, n = 3). Bar = 1 cm. (d) SNP allele-frequency profiles of subcultured derivatives. (e) Experimental workflow for serial subculture and heat-tolerance assessment. Three biological replicates were included for each generation during serial subculture. LC–LE denote the 3rd to 5th generations serially subcultured at 28 °C, while HC–HE represent the 3rd to 5th generations serially subcultured at 33 °C. (f) Heat tolerance of subcultured strains 7S14 and 7S31 under control and heat stress conditions. LSD post-hoc test, different letters indicate significant differences (p < 0.05, n = 3). (g) Linear mixed model analysis of the effects of subcultured strain (7S14 and 7S31), subculturing temperature (28 and 33 °C) and culturing temperature (33 and 35 °C) on heat tolerance, defined as the ratio of growth rate under heat stress to growth rate under control conditions (BH-adjusted q values; n.s., not significant; * q < 0.05; ** q < 0.01). (h) Model for the origin of karyotype heterogeneity. Meiotic mis-segregation initially generates spores carrying both aneuploidy and heterozygosity. During subsequent vegetative propagation, unstable aneuploid chromosomes are progressively lost during stress and recovery, but different nuclei may retain different parental homologs. This produces coexisting nuclei with distinct chromosome complements, resulting in karyotype heterogeneity. Different nuclear karyotypes may confer distinct stress preferences, thereby enabling rapid phenotypic adaptation.
Figures
(6)
Tables
(0)