-
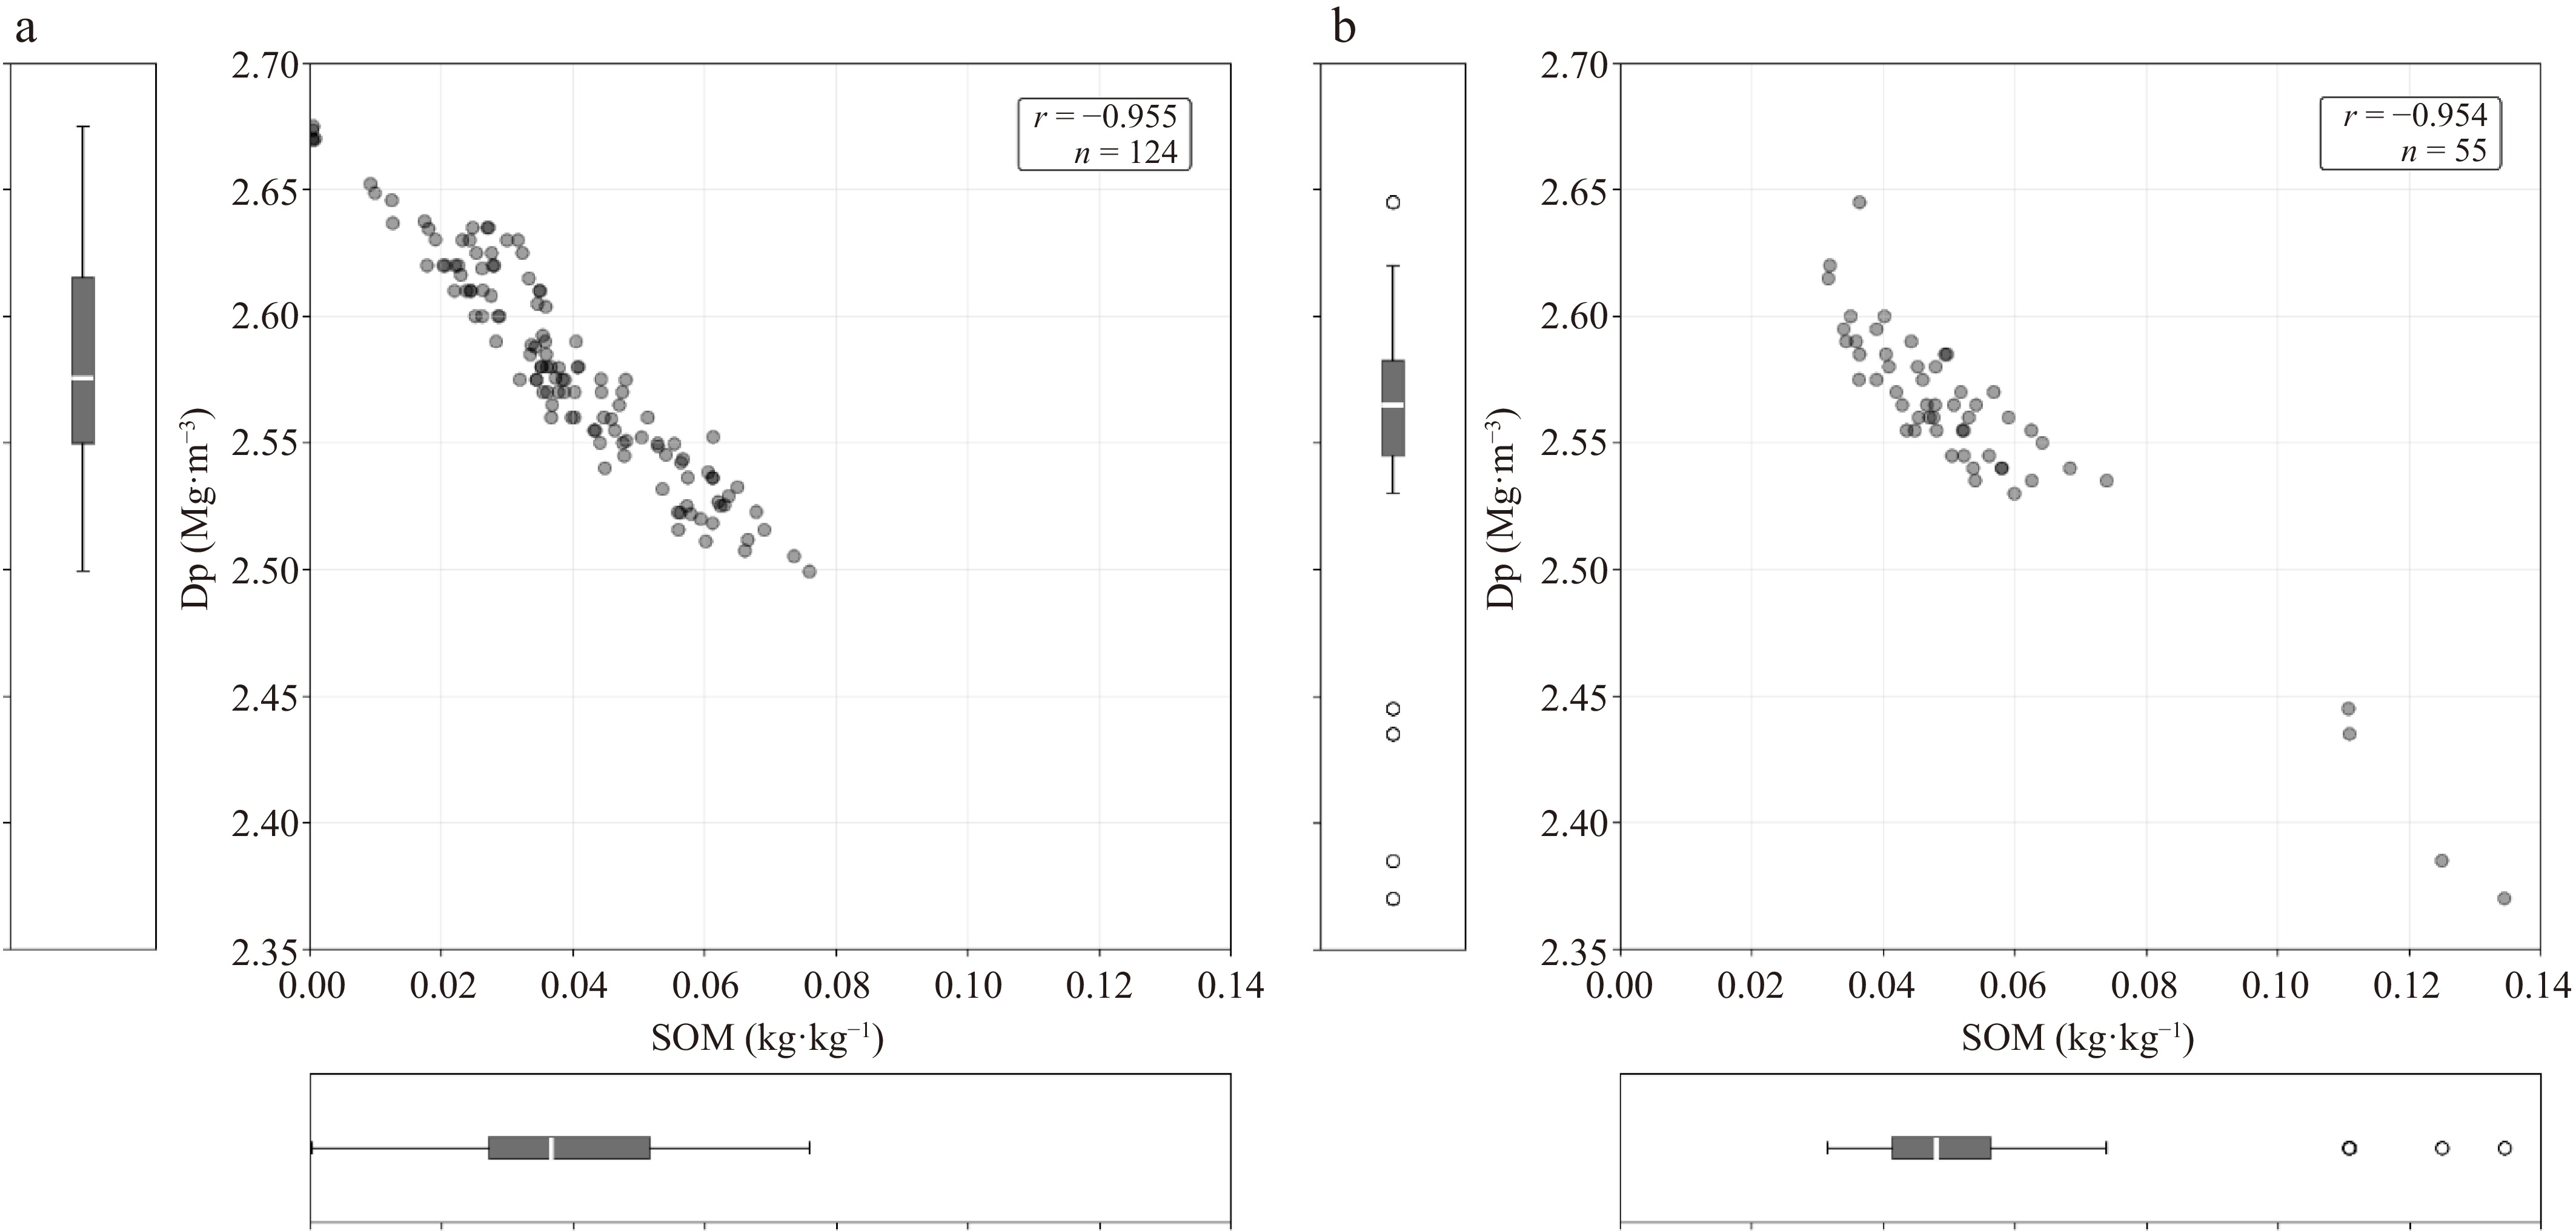
Figure 1.
Relationship between soil particle density (Dp, Mg·m−3) and soil organic matter content (SOM, kg·kg−1) for (a) calibration and (b) validation datasets. Horizontal and vertical bars indicate ± one standard deviation. Scatter plot of Dp vs SOM content for the (a) calibration dataset and (b) validation dataset.
-
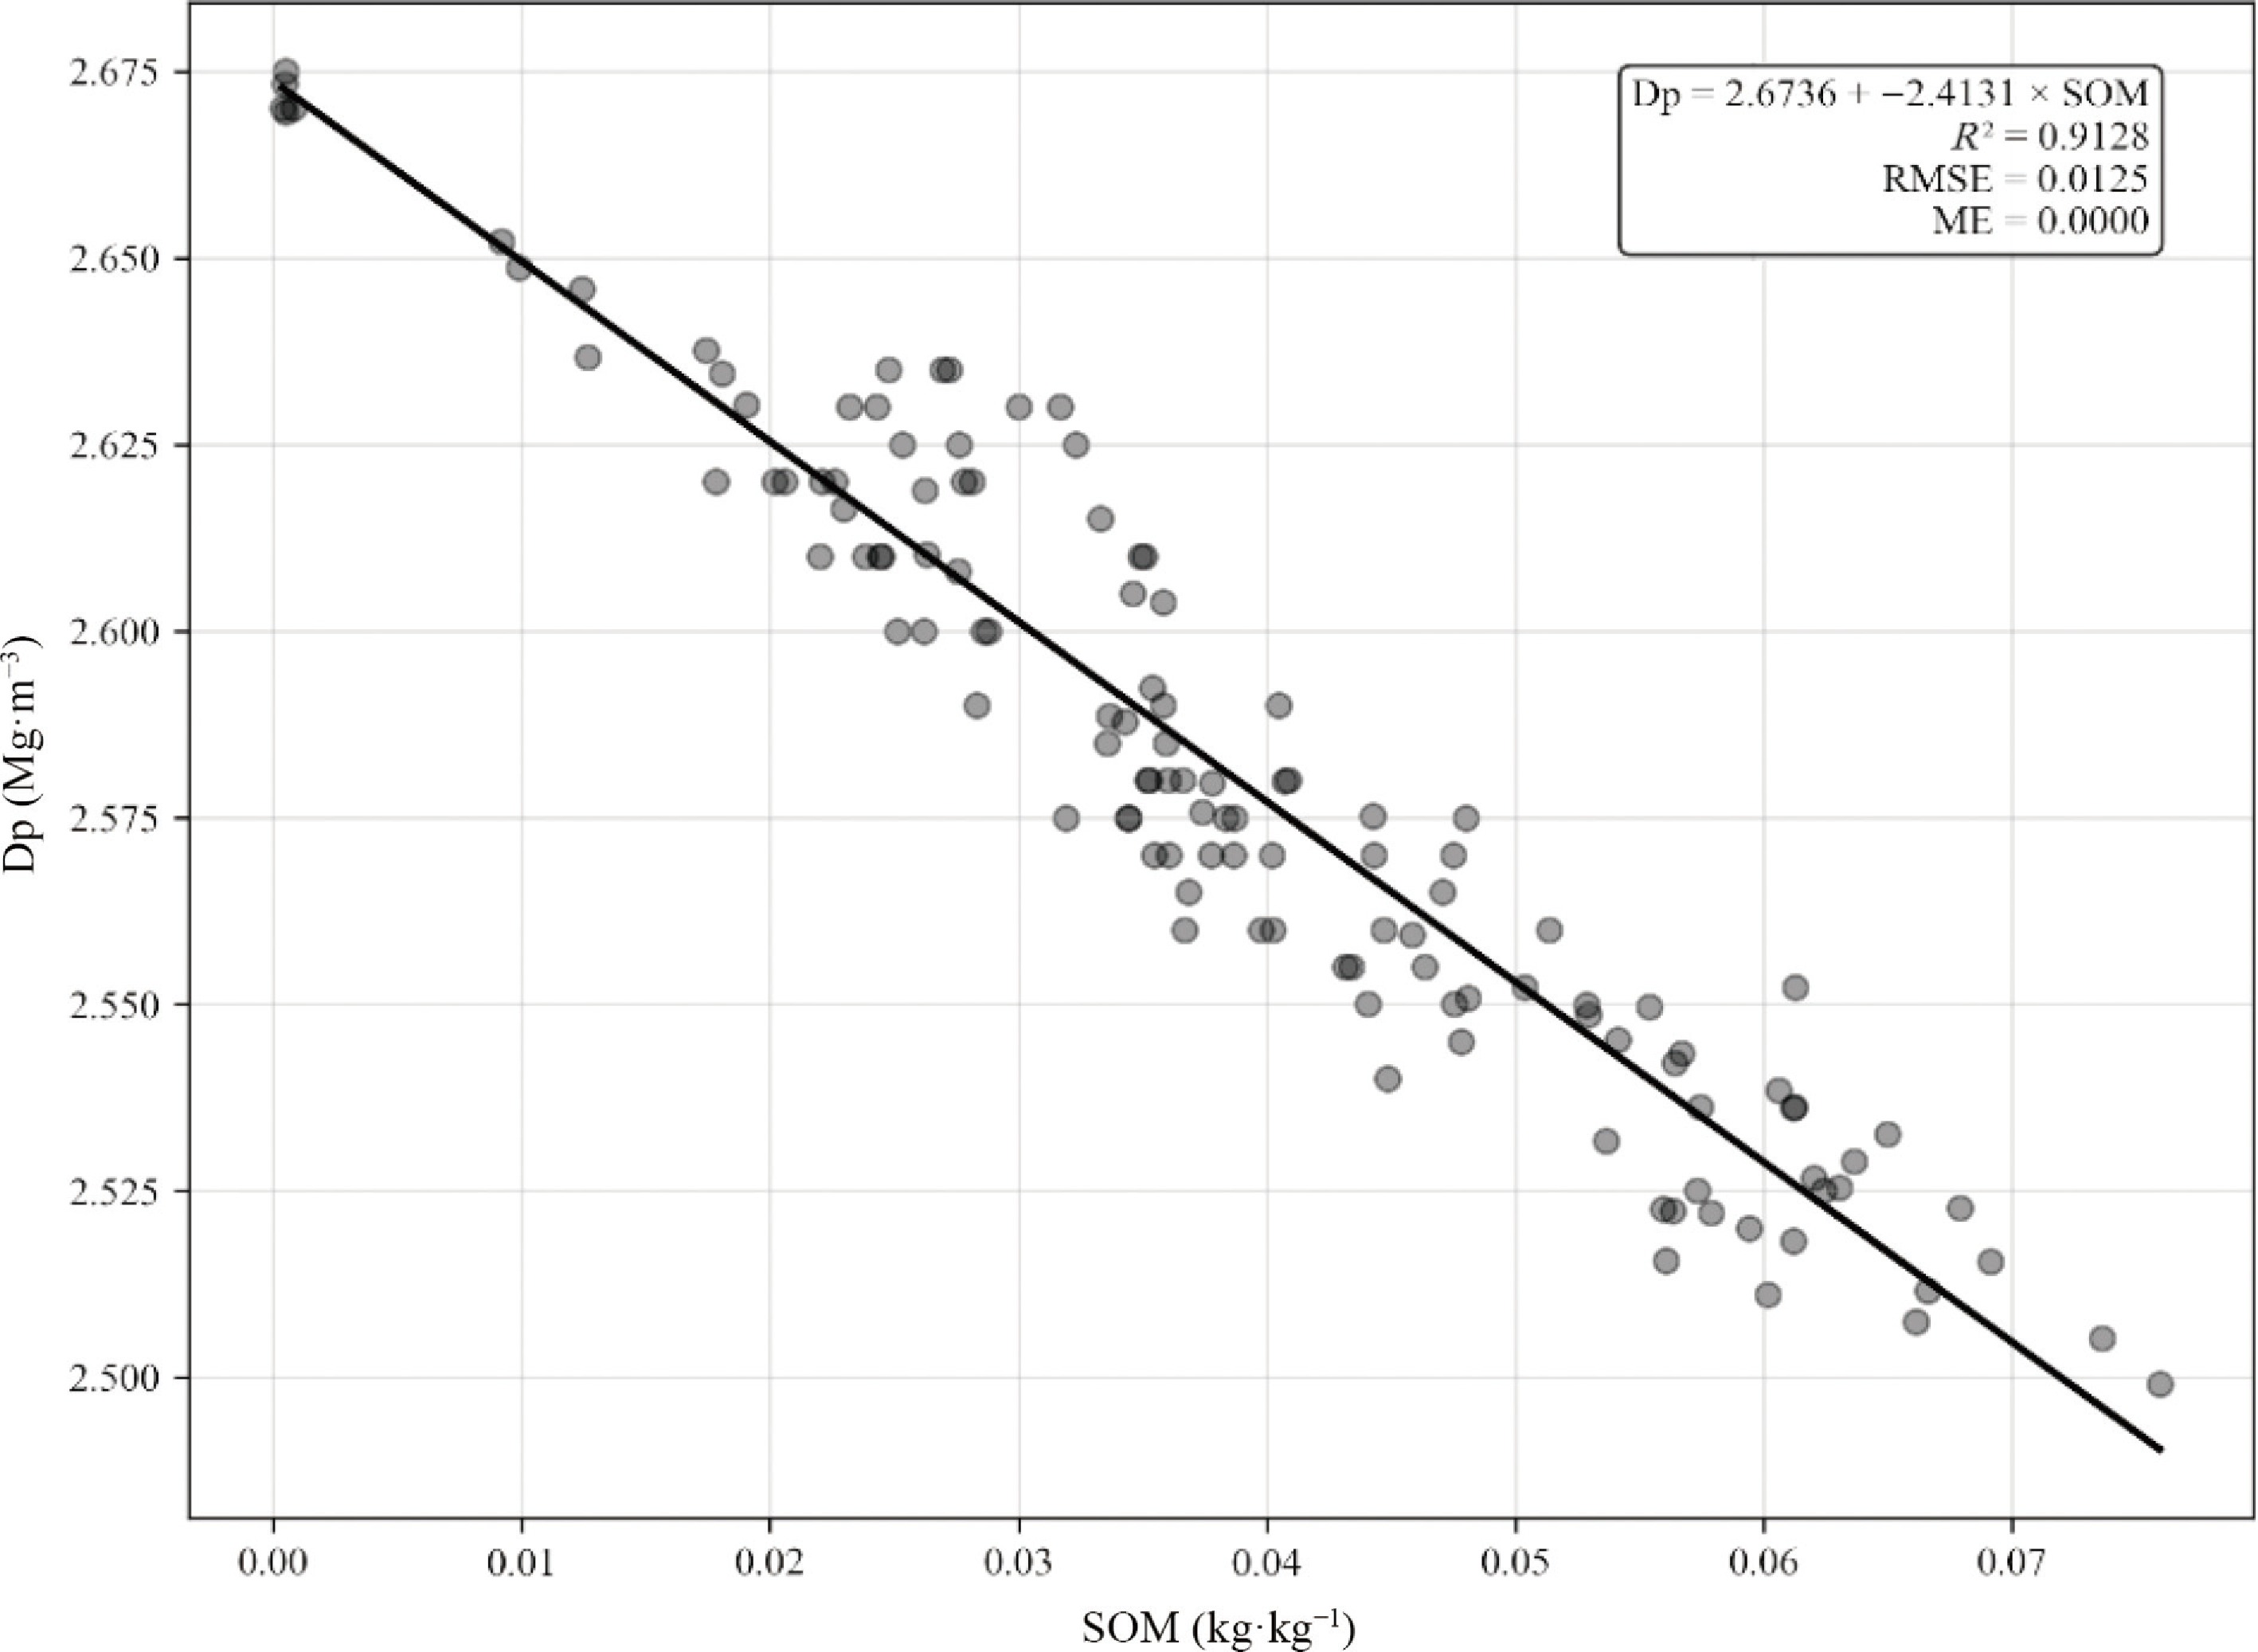
Figure 2.
Relationship between soil particle density (Dp, Mg·m−3) and soil organic matter content (SOM, kg·kg−1) for the calibration dataset (n = 124). The regression line represents the best fit derived using simple linear regression with Eq. (5).
-
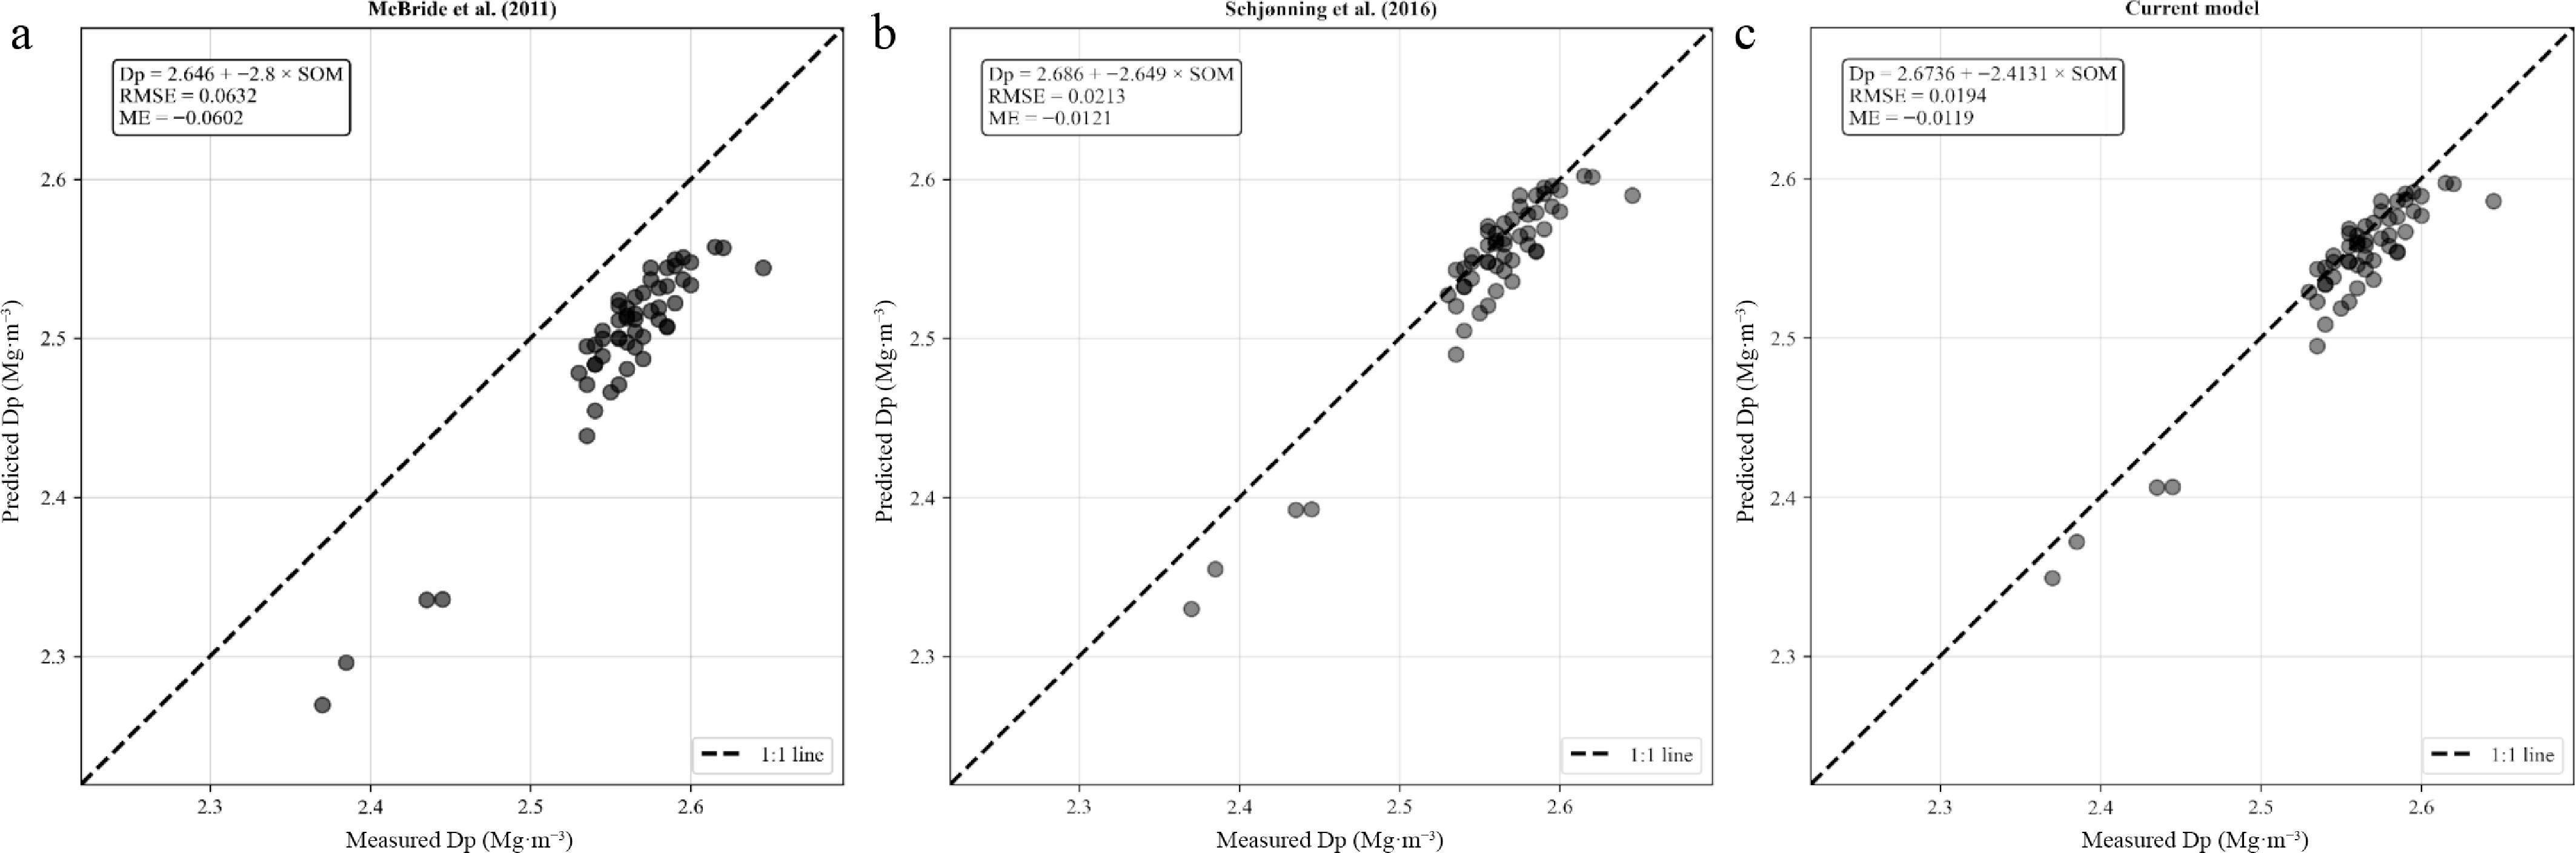
Figure 3.
Comparison of predicted and measured soil particle density (Dp, Mg·m−3) for the validation dataset using three prediction models: (a) McBride[8]; (b) Schjønning[9]; and (c) the current model. The 1:1 reference line indicates perfect agreement between predicted and measured values. Model performance was evaluated using the coefficient of determination (R2), root mean square error (RMSE), and mean error (ME).
-
SOMa (kg·kg−1) Dpb (Mg·m−3) Calibration
data set
(n = 124)Validation data
set (n = 55)Calibration data
set (n = 124)Validation data
set (n = 55)Mean 0.0386 0.0533 2.581 2.557 Median 0.0367 0.0481 2.575 2.565 Minimum 0.0004 0.0316 2.499 2.370 Maximum 0.0759 0.1345 2.675 2.645 a SOM was determined using the loss-on-ignition method as outlined in ASTM F1647-11. b Dp was determined following the ASTM D5550-14 standard test method for specific gravity of soil solids by gas pycnometer. Table 1.
Soil organic matter content (SOM) and particle density (Dp) of calibration and validation data sets.
-
Table 2.
Root mean square error (RMSE) and mean error (ME) for Dp (Mg·m−3) predictions for 55 samples from the validation data set using the McBride (Eq. [1]), Schjønning (Eq. [2]), and the current model (Eq. [5]).
Figures
(3)
Tables
(2)