-
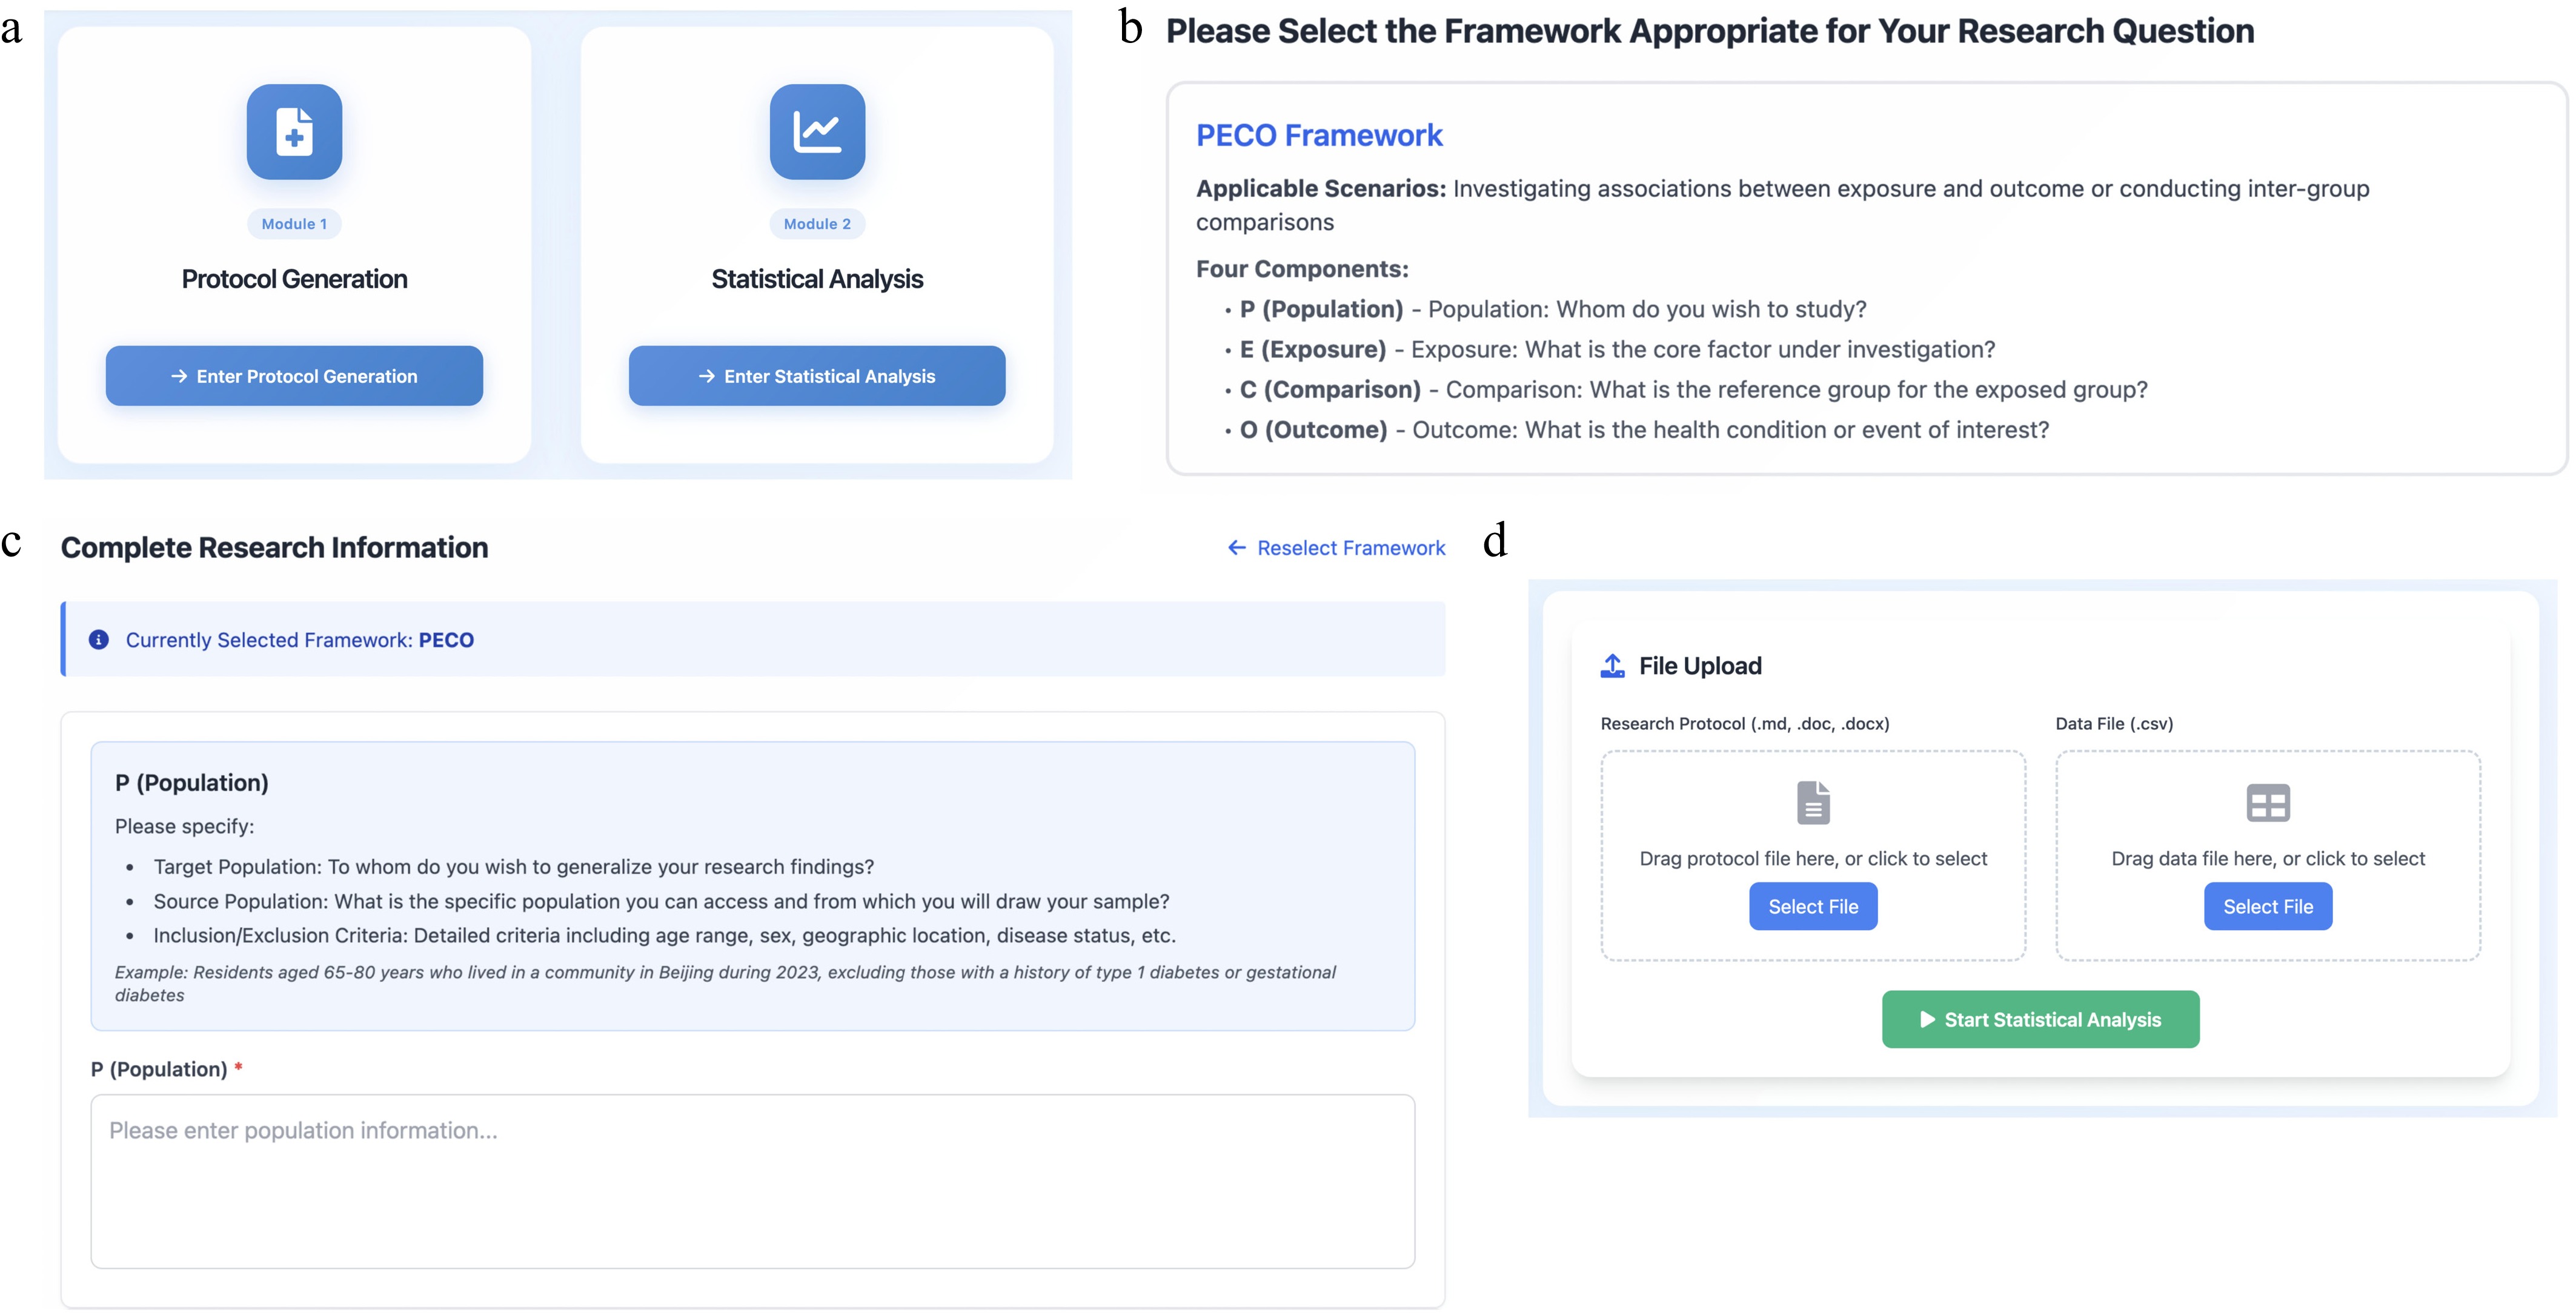
Figure 1.
Minimalist user interface and end-to-end workflow of AgenMed_CSS. (a) Landing page where users select either Module 1 (Protocol Generation) or Module 2 (Statistical Analysis), reflecting the system's 'planning–execution' dichotomy. (b) In Module 1, the Planning Design Agent starts by guiding users to select an appropriate question framework (e.g., PECO) to structure the research intent. (c) The user then completes structured research information according to the chosen framework, which is used to generate and iteratively refine a standardized intelligent design protocol. (d) In Module 2, the Execution Analysis Agent accepts the finalized protocol and a local dataset for analysis, initiating a closed-loop analysis that ensures data privacy and full traceability.
-
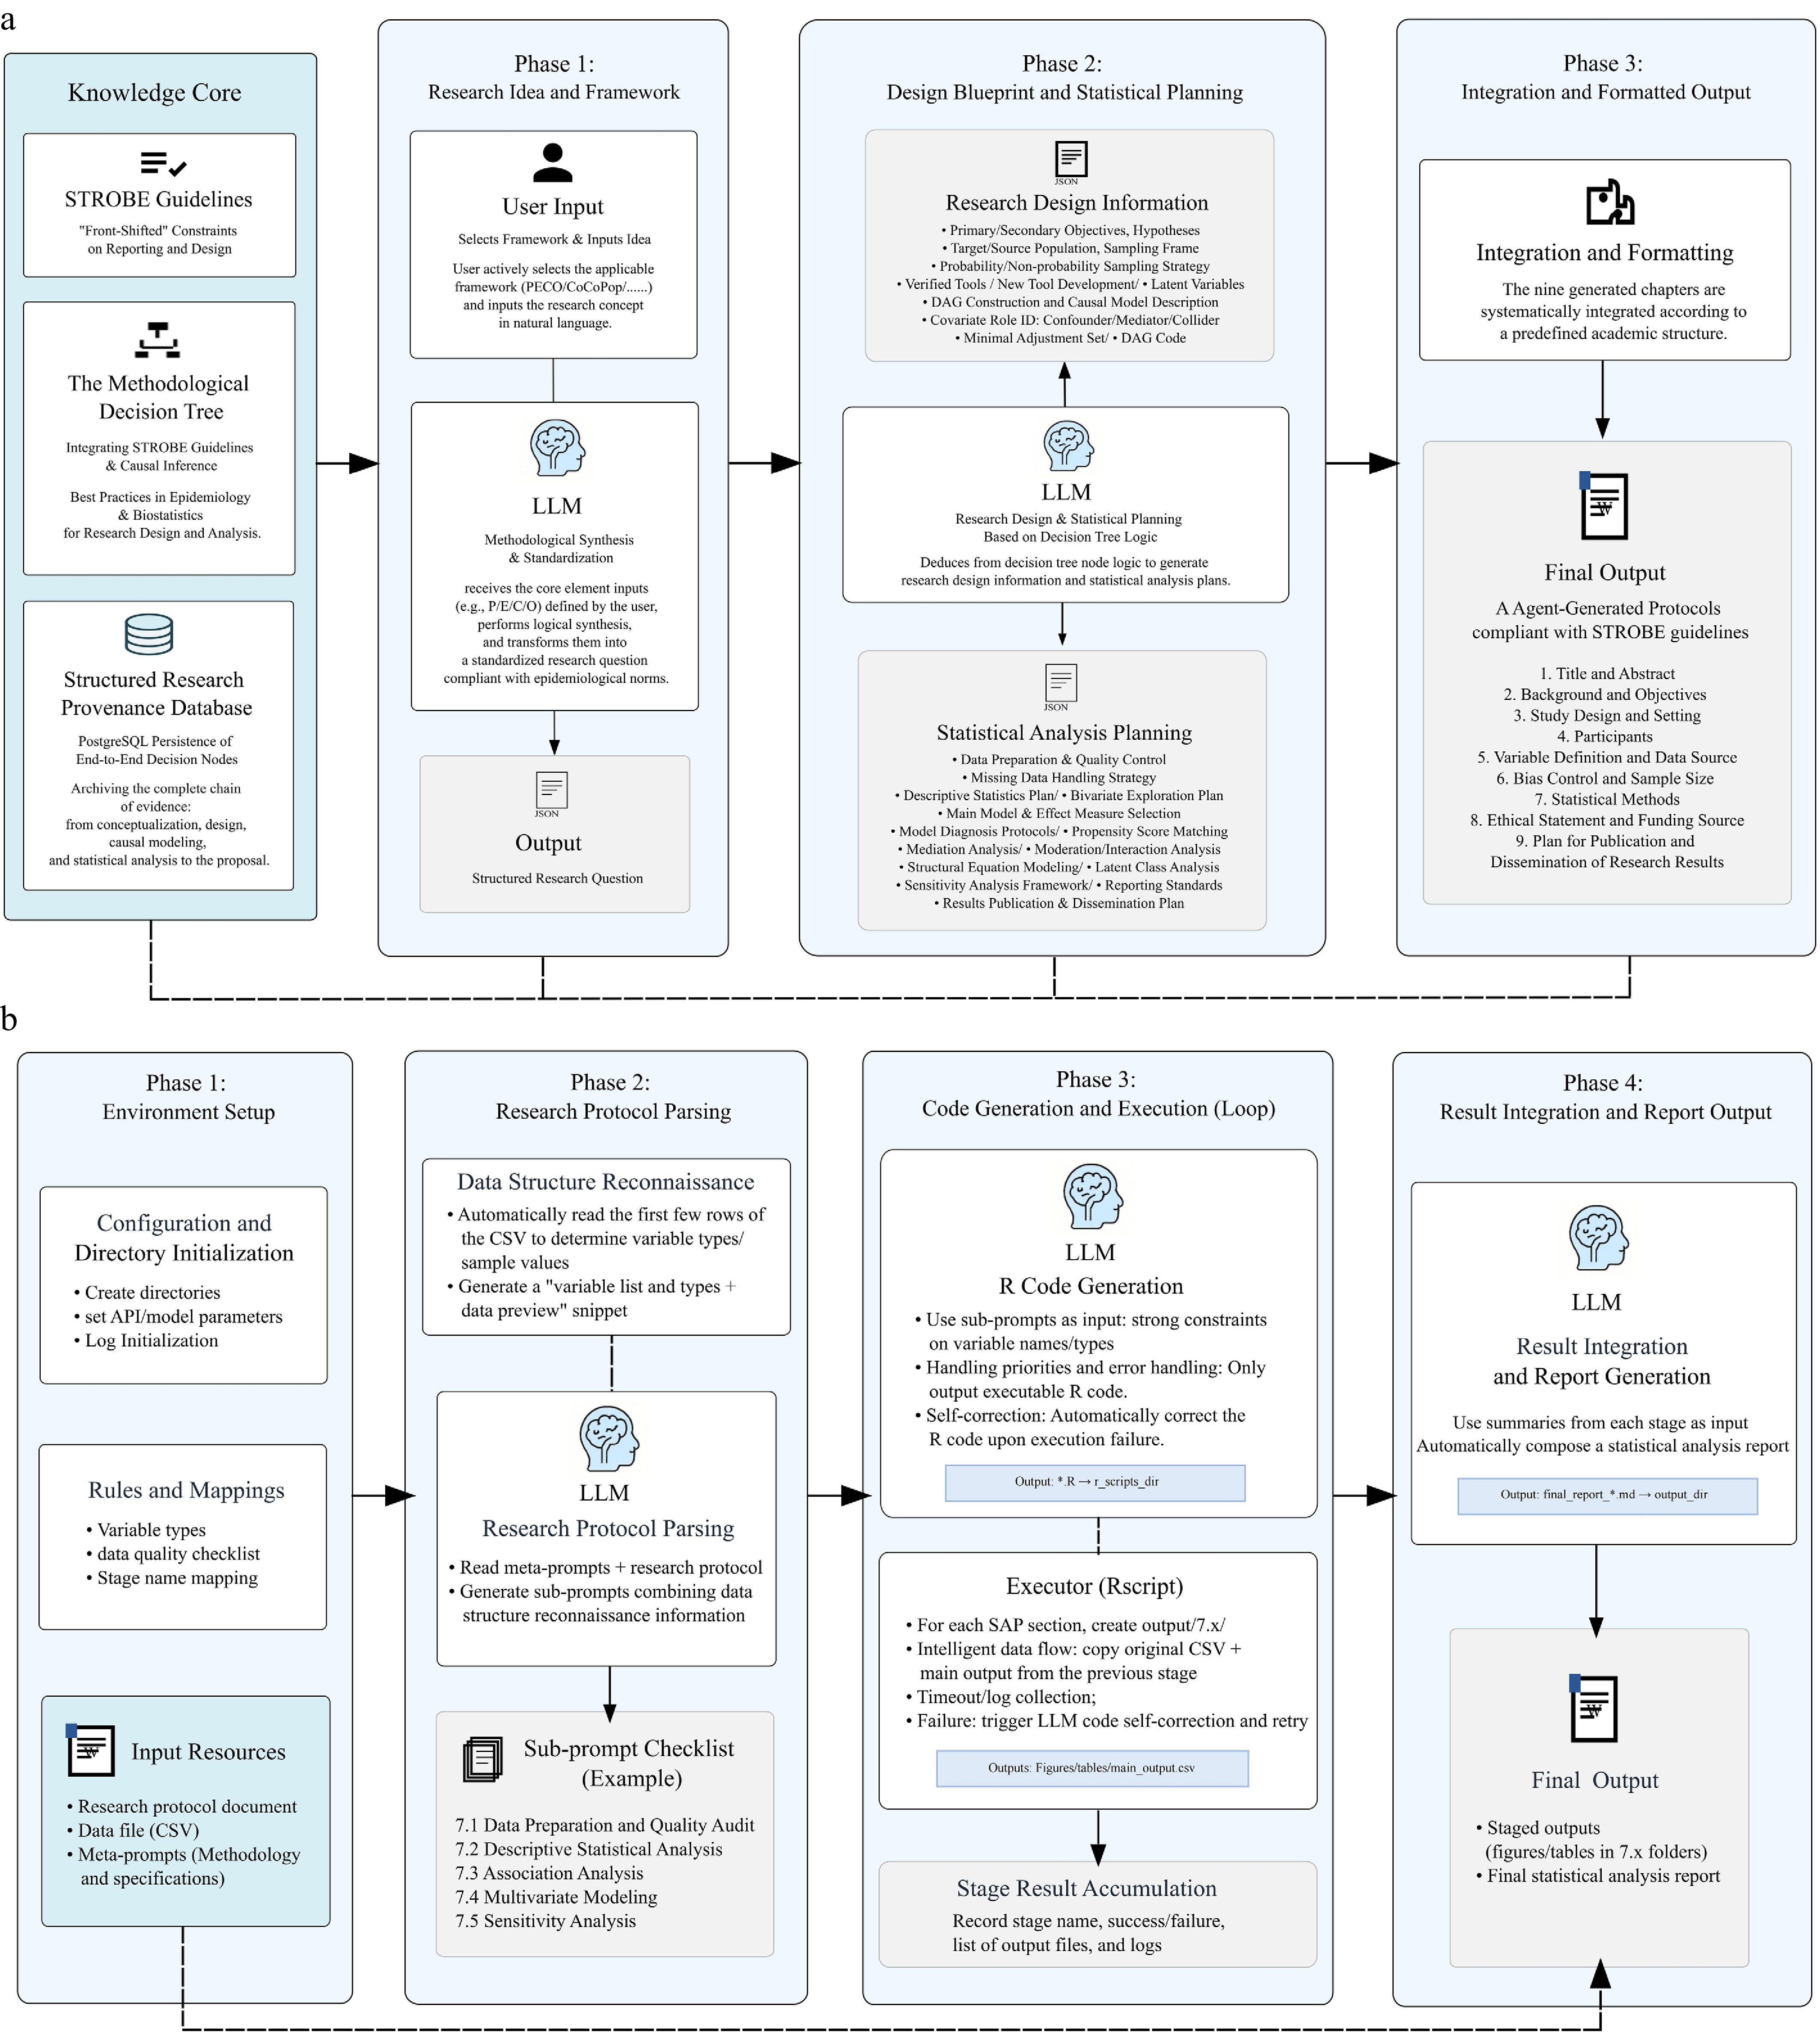
Figure 2.
Dual-agent architecture for reproducible, privacy-preserving epidemiological research. (a) Planning design agent. User input is structured via a question framework (e.g., PECO/CoCoPop) and translated into a standardized intelligent design protocol; the statistical analysis chapter (see Supplementary File 1, Material S7, Chapter 7) serves as the executable analysis specification. (b) Execution analysis agent. The protocol and a local dataset are ingested to run a staged analysis: protocol parsing, iterative R code generation/execution with error-driven self-repair, and integration of figures/tables into the final report.
-
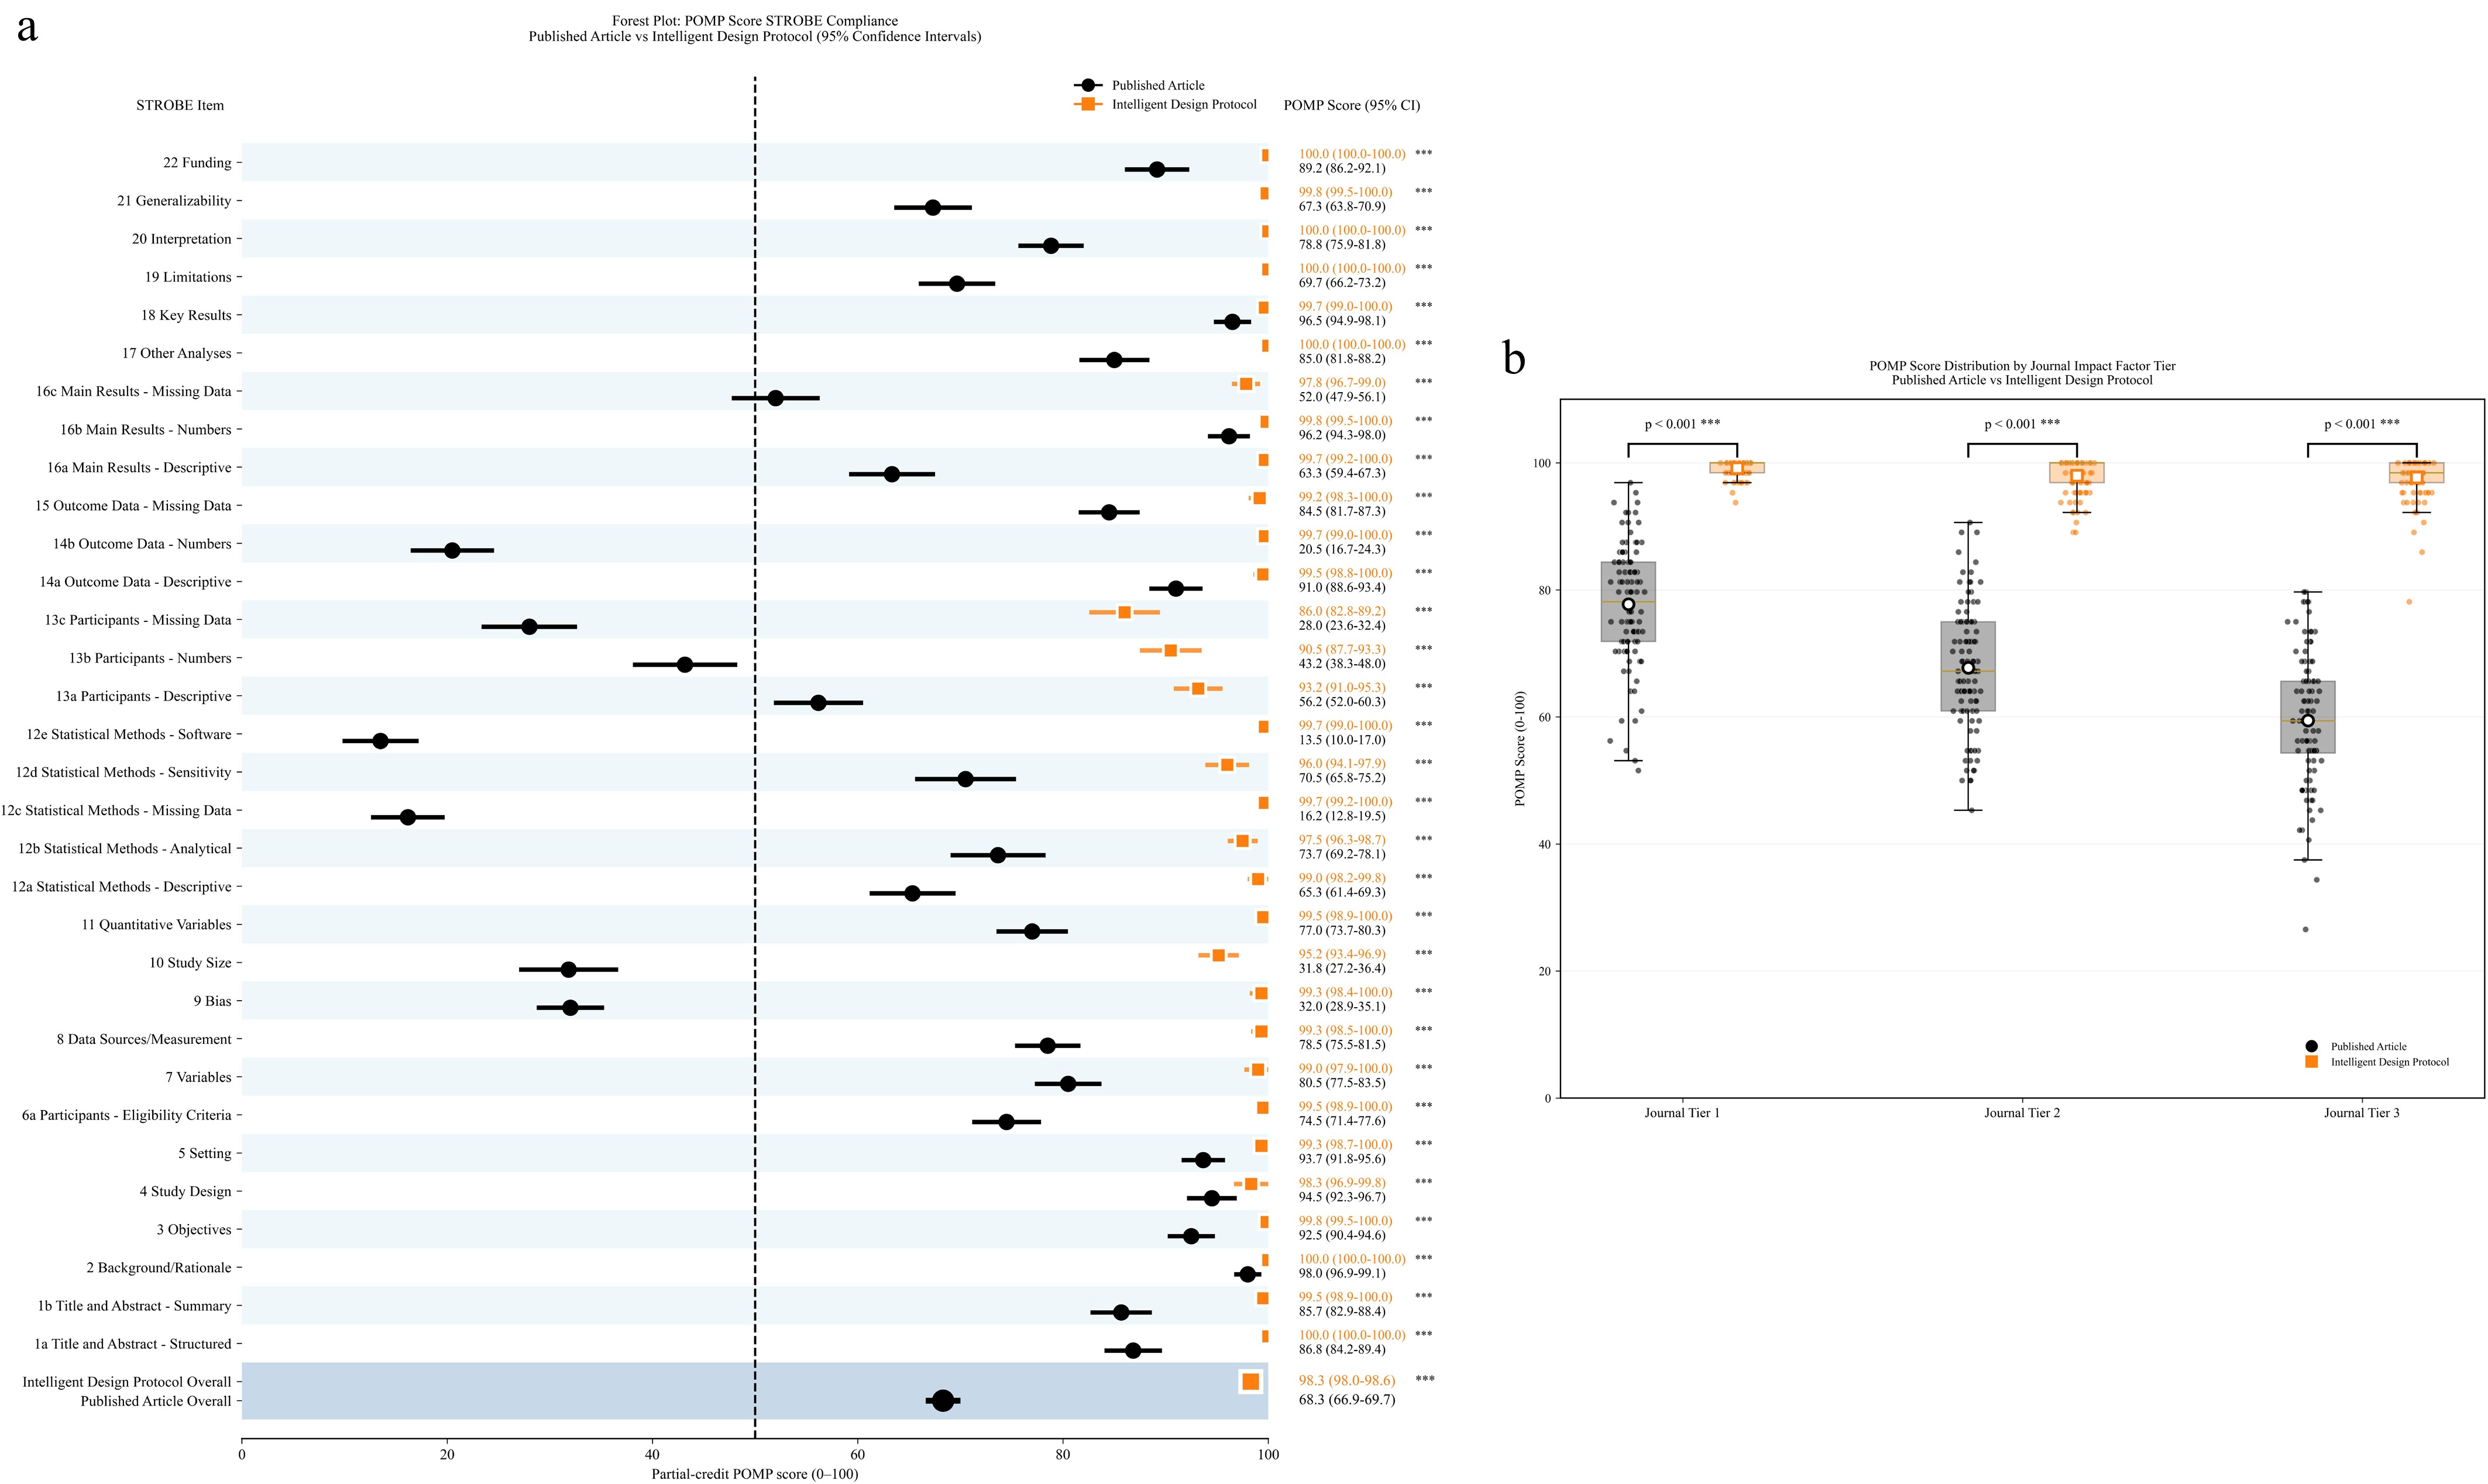
Figure 3.
Benchmarking methodological rigor: agent-generated protocols vs. peer-reviewed articles. (a) Forest plot displaying item-level compliance with the STROBE_CSS checklist. Data points represent the mean percent of maximum possible (POMP) score, and error bars indicate 95% confidence intervals (CIs). The comparison contrasts the planning design agent's output (orange) with the original matched peer-reviewed studies (black; n = 300). The bottom rows present the aggregate methodological quality scores for both groups. (b) Distribution of overall POMP scores stratified by journal ranking (tiers 1, 2, and 3 correspond to JCR Q1, Q2, and Q3). Box plots show the median (center line), upper and lower quartiles (box limits), and 1.5× interquartile range (whiskers). p-values were calculated using two-sided paired t-tests (p < 0.001). The source data is provided in Supplementary File 2.
-
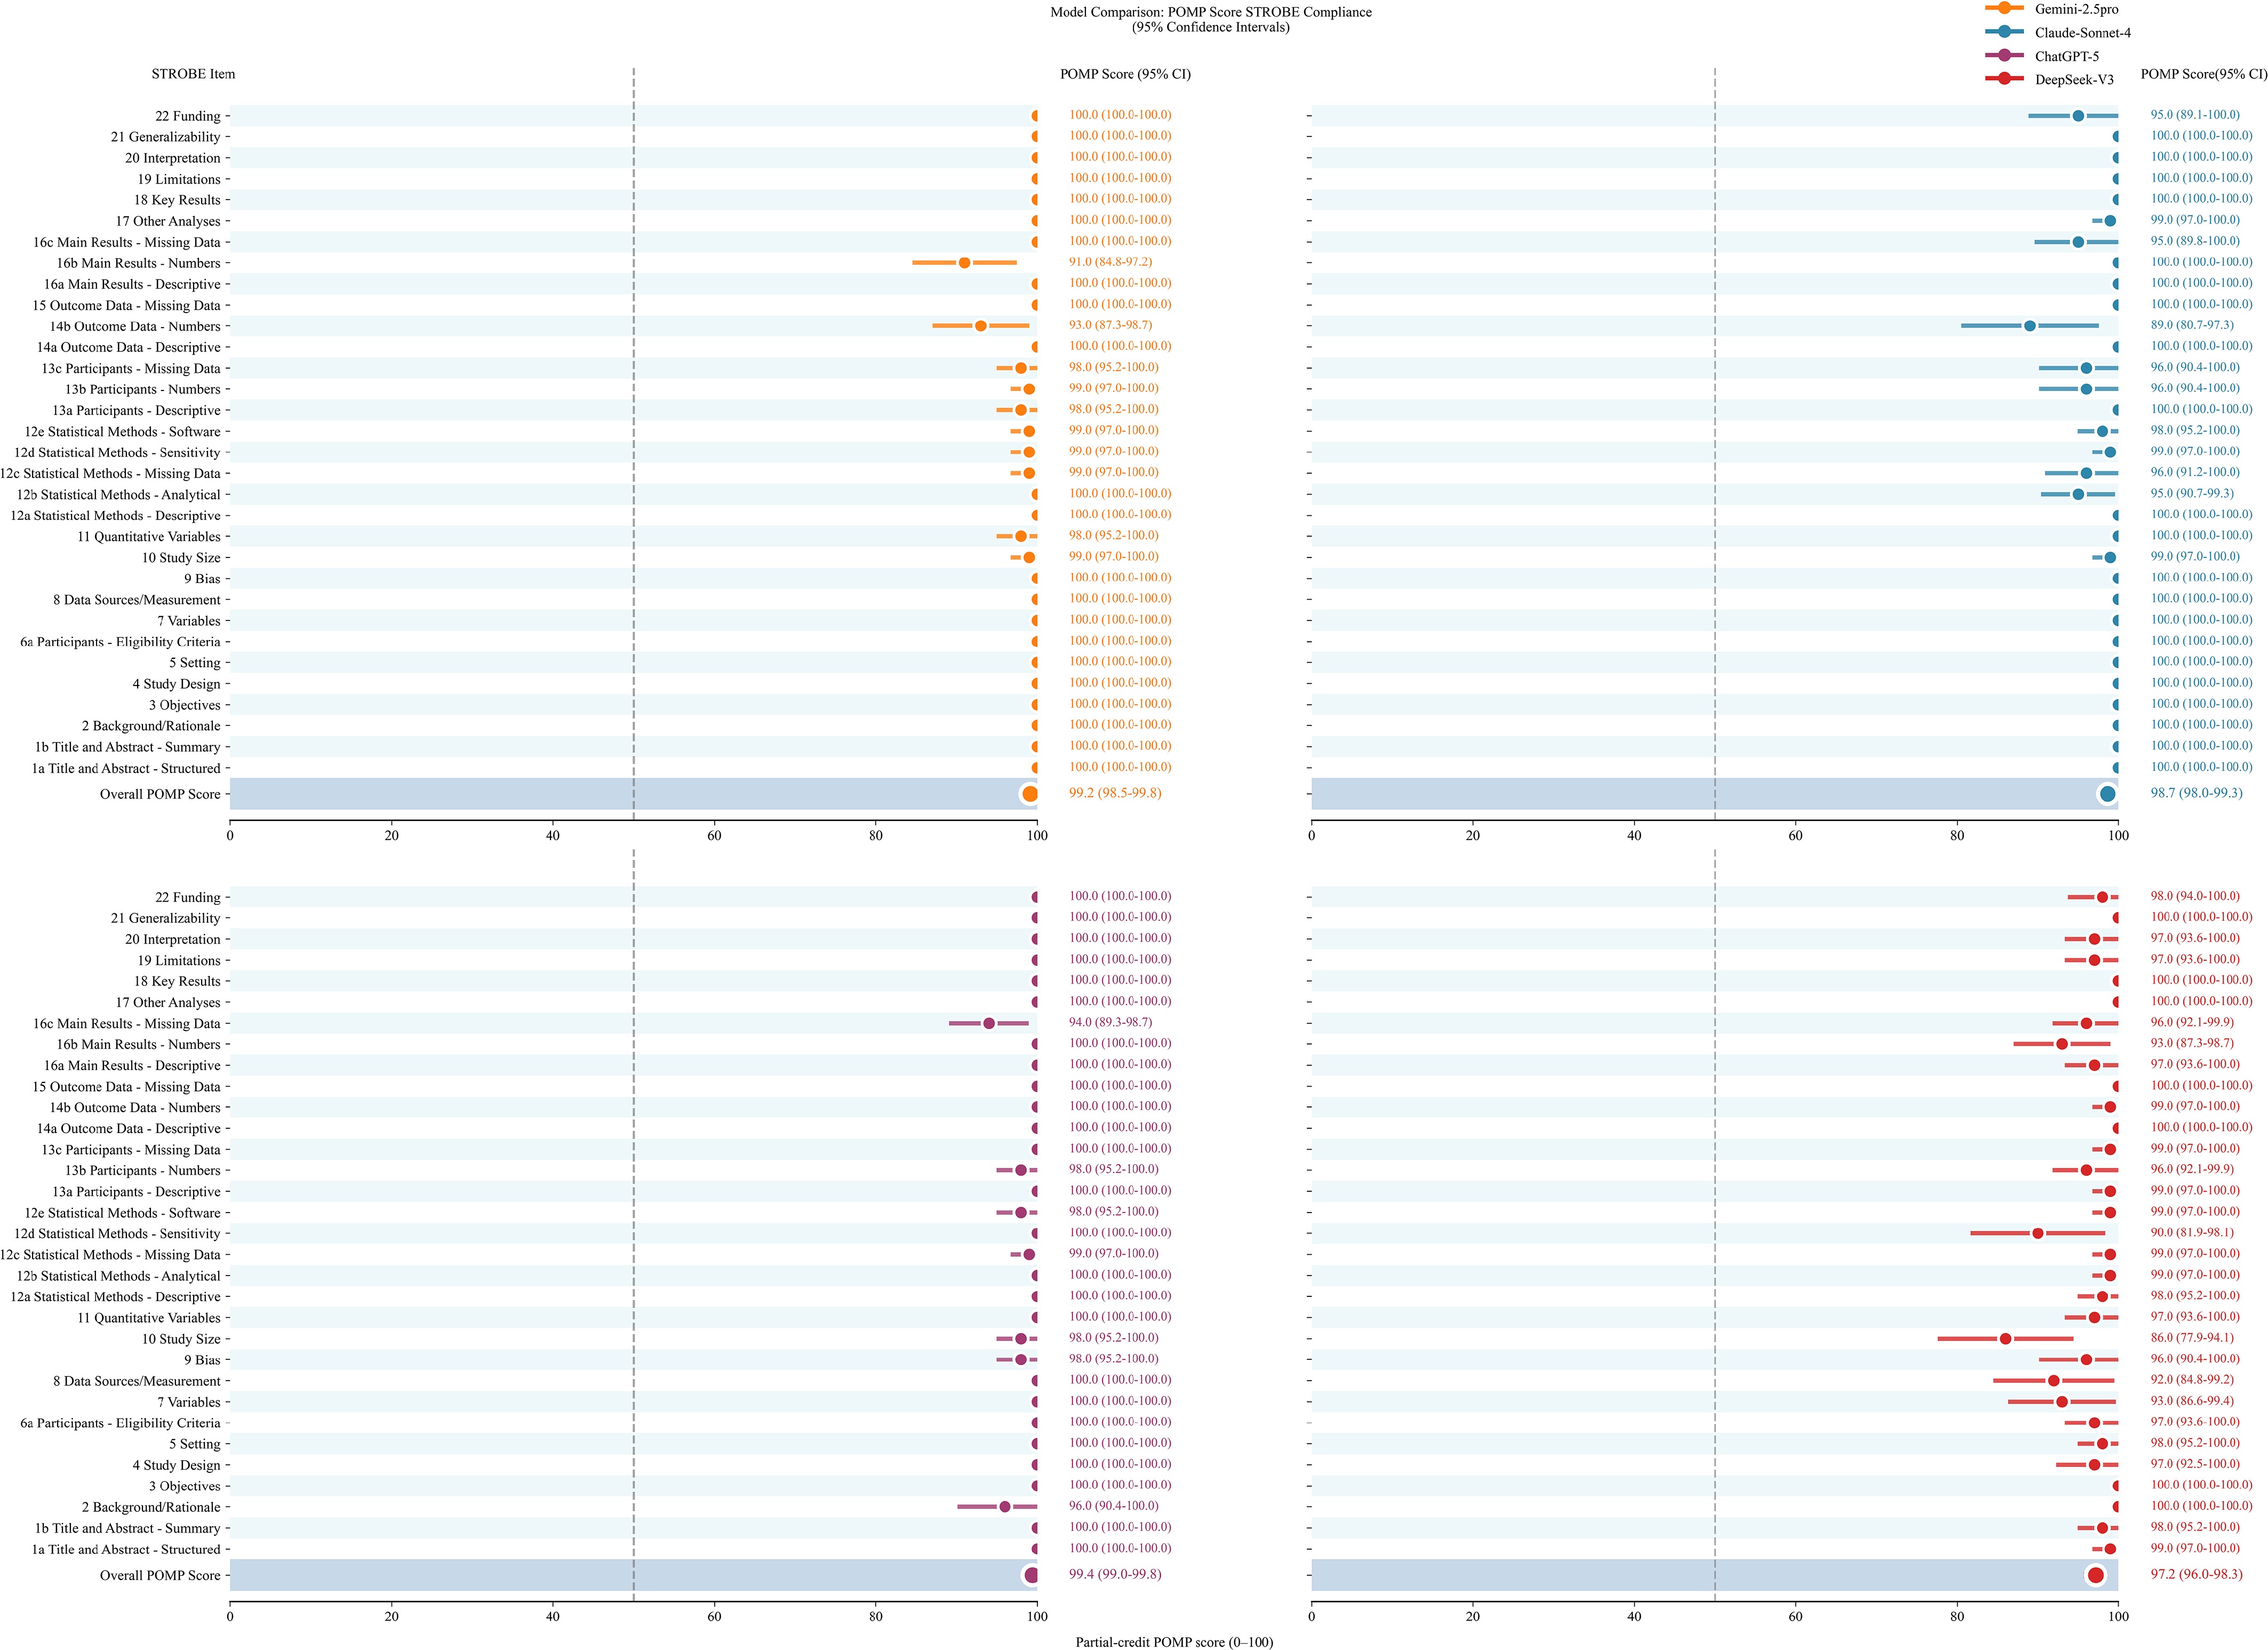
Figure 4.
Structural constraints attenuate intrinsic model stochasticity. Forest plots display item-level STROBE compliance scores across four distinct large language model backends integrated into the planning design agent: Gemini 2.5 Pro (top left), Claude-Sonnet-4 (top right), ChatGPT-5 (bottom left), and DeepSeek-V3 (bottom right). Center points represent the mean percent of maximum possible (POMP) score derived from n = 50 independent protocol generations for a single standardized reference project. Error bars denote 95% confidence intervals. The 'overall POMP score' (bottom row of each panel) quantifies the global methodological completeness, illustrating high backend-level output consistency under the same constraint architecture. The source data is provided in Supplementary File 2
-
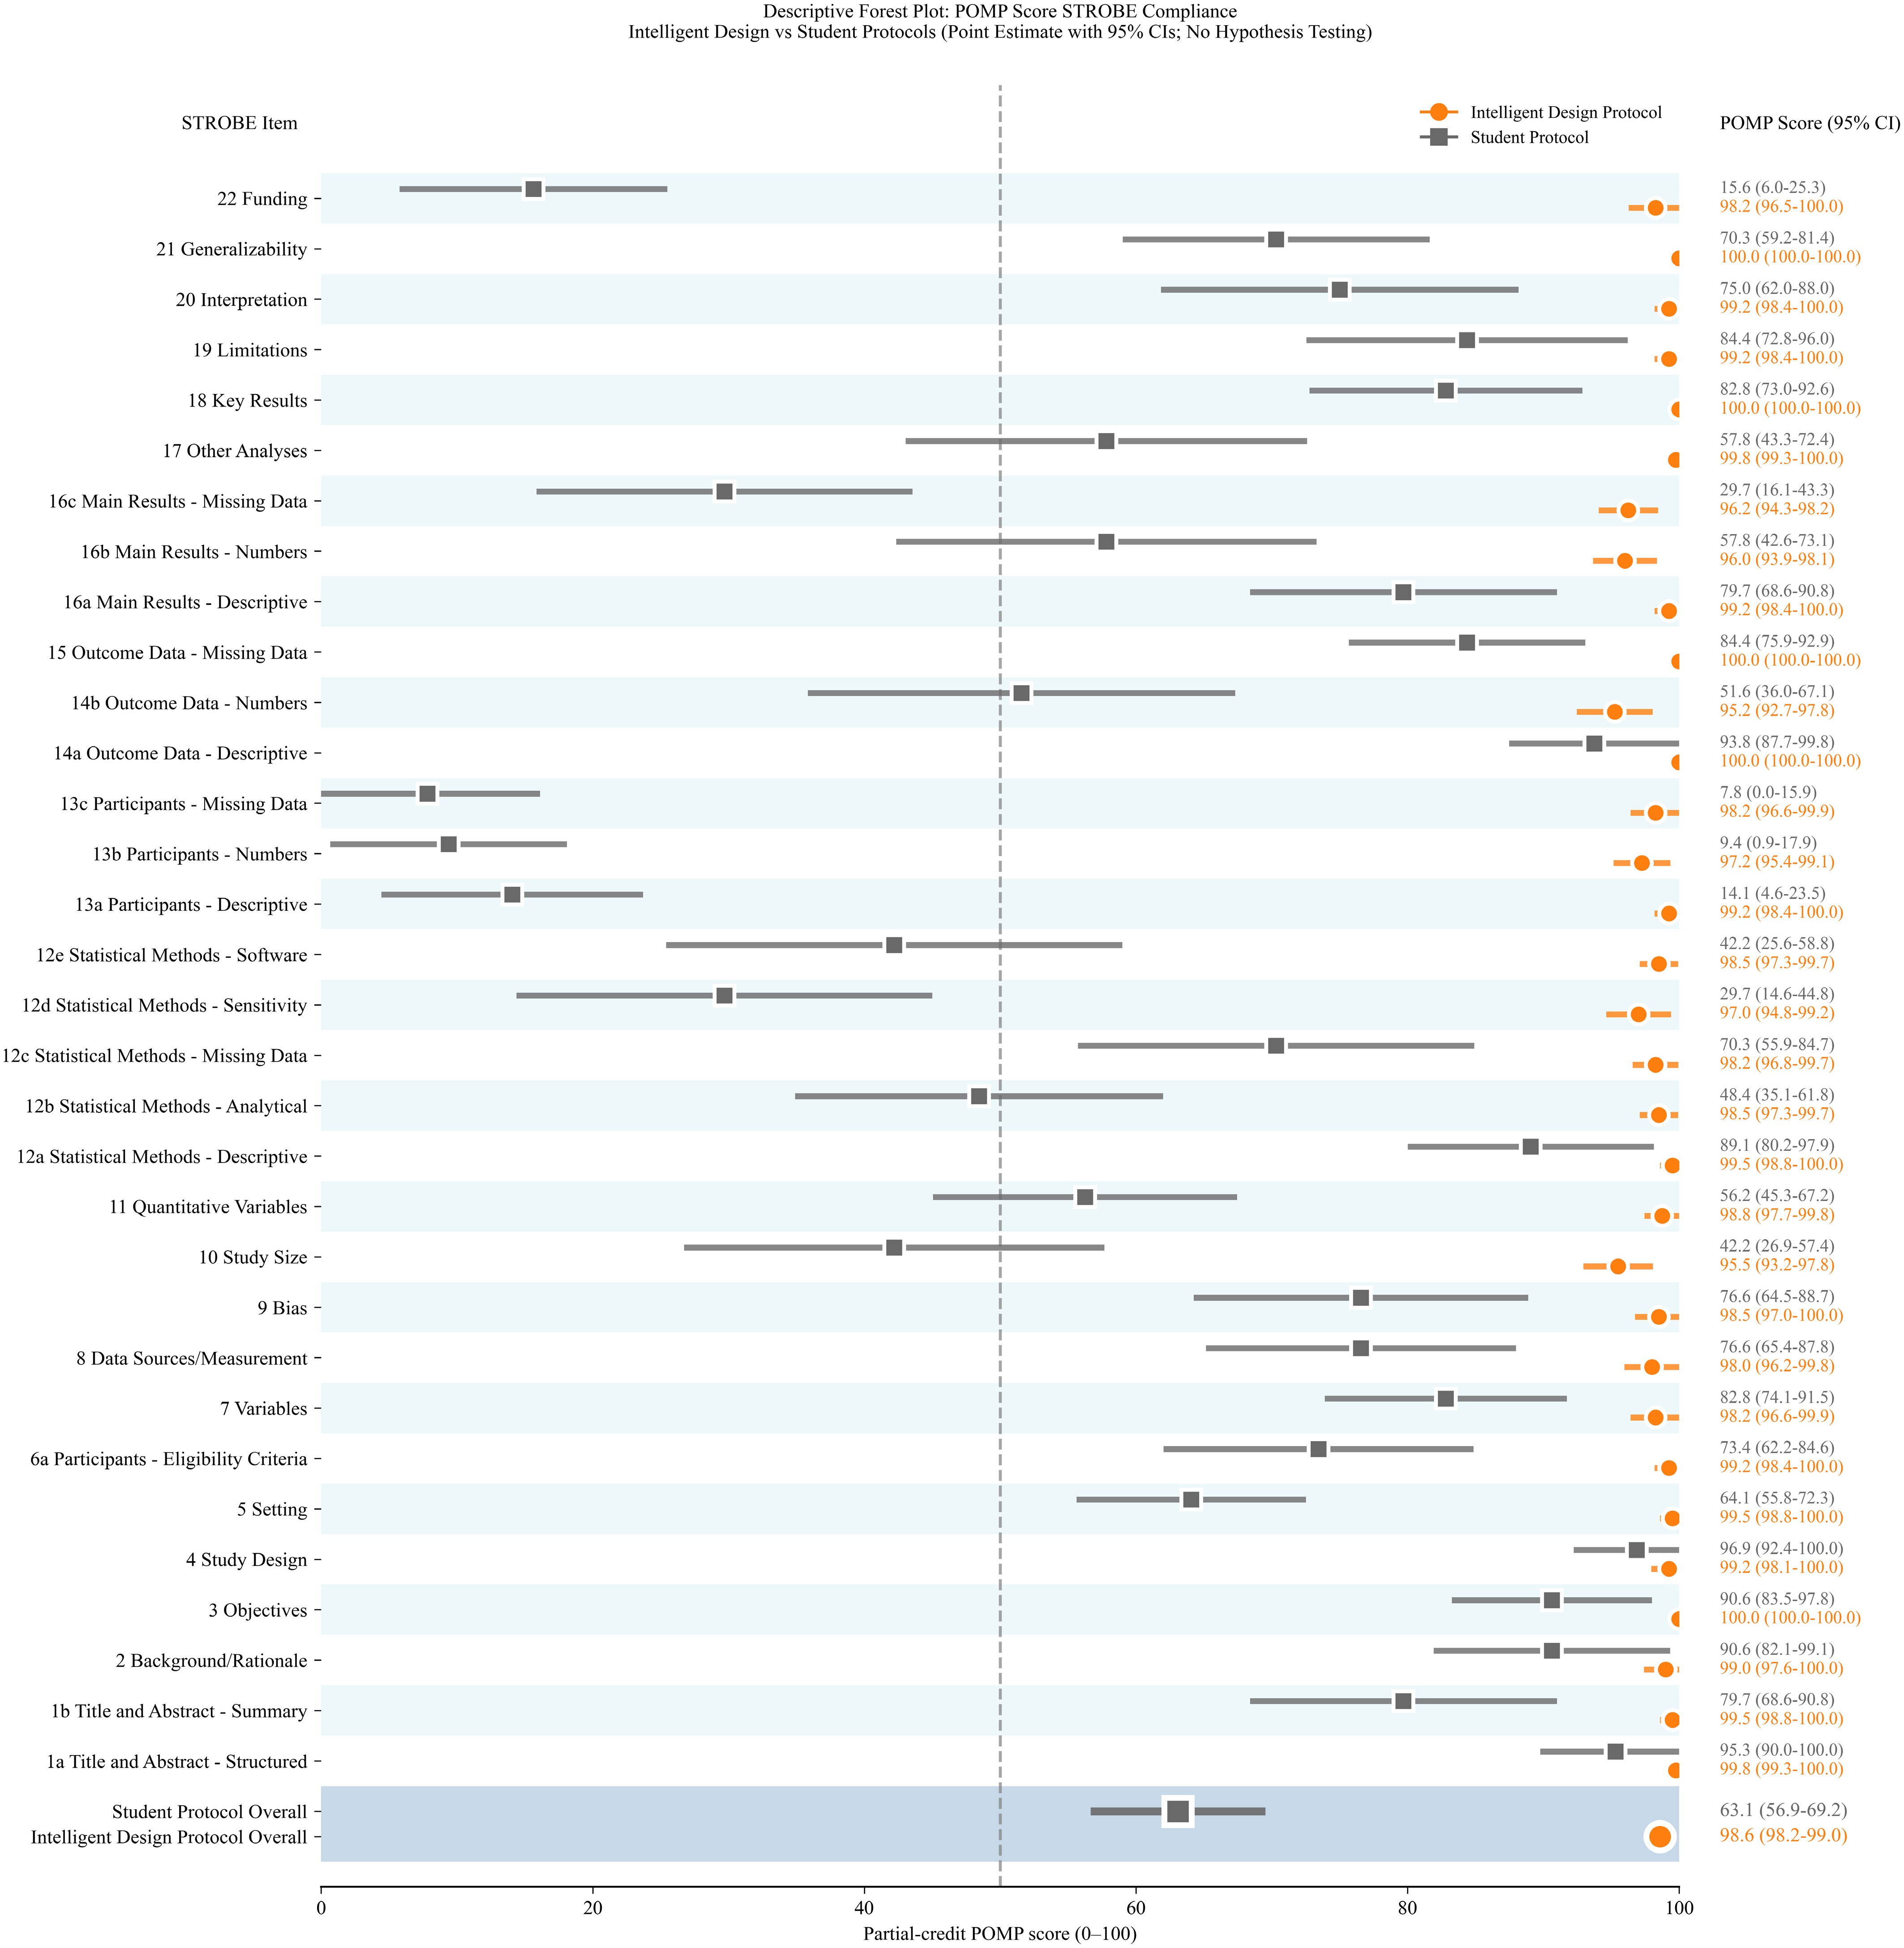
Figure 5.
Methodological scaffolding prevents the failure of unconstrained human-AI collaboration. Forest plot contrasting itemized STROBE compliance between the planning design agent (orange circles; n = 200 pooled from four models) and an unconstrained human-AI collaboration group comprising students using generic large language models (grey squares; n = 32). Data points represent mean percent of maximum possible (POMP) scores; horizontal error bars denote 95% confidence intervals. The significant gap in the aggregate 'overall' score (bottom row), combined with the substantial variance observed in the control group (wide error bars), visually quantifies the 'practice-norm gap'. This demonstrates that without the rigid constraints of the agentic framework, access to advanced AI tools alone fails to mitigate human cognitive blind spots or ensure checklist-based methodological completeness. The source data is provided in Supplementary File 2.
-
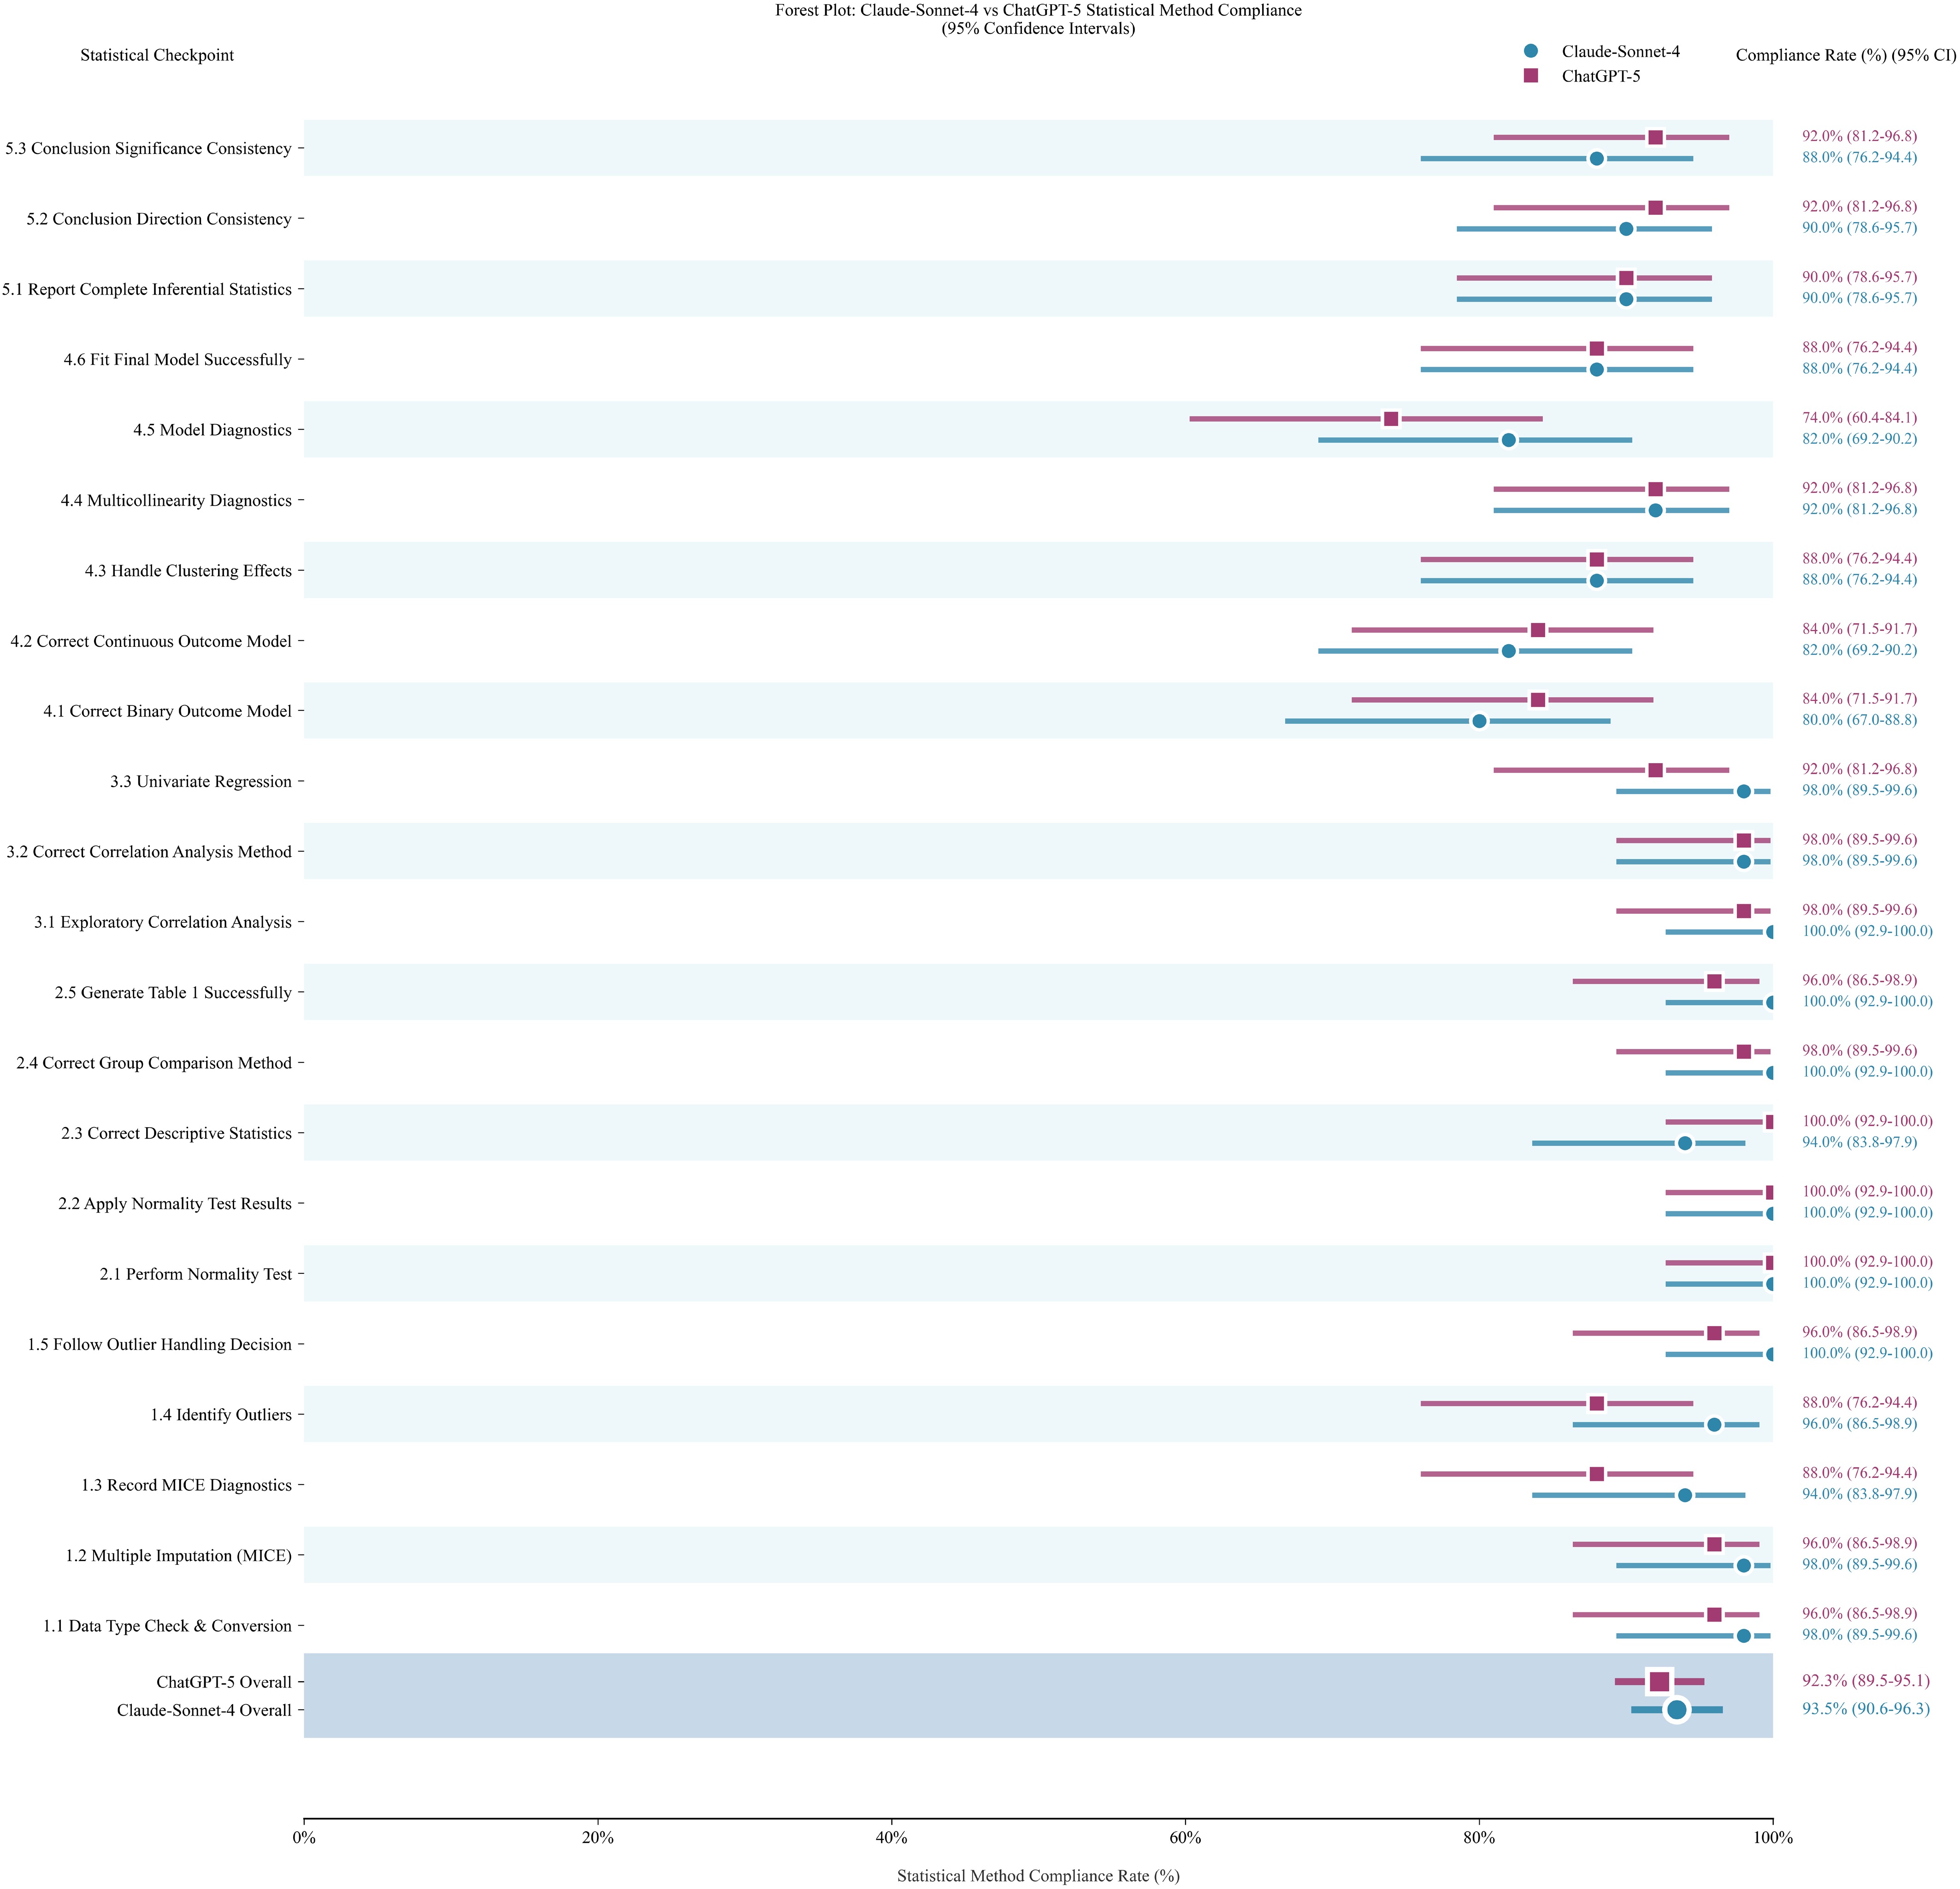
Figure 6.
Execution fidelity in translating abstract logic into concrete code. Forest plot evaluating the execution analysis agent's reliability in operationalizing statistical plans. The y-axis details 22 binary checkpoints derived from the study protocol (see Supplementary File 1, Material S7, Chapter 7), ranging from initial data type conversion to final model diagnostics. Performance is compared between Claude-Sonnet-4 (blue circles) and ChatGPT-5 (maroon squares) backends. Data points represent the mean compliance rate calculated from n = 50 independent execution loops for each model, with horizontal error bars denoting 95% confidence intervals. The high aggregate adherence rates (bottom shaded region) and the visual overlap between the two series demonstrate that the system consistently bridges the gap between methodological intent and computational reality, regardless of the underlying model architecture. The source data is provided in Supplementary File 2.
-
Section Metric All (n = 18) Articles (n = 9) Protocols (n = 9) A. Expert consensus POMP scores Mean ± SD (%) − 75.03 ± 12.11 95.10 ± 2.39 95% CI − 65.72–84.35 93.27–96.94 B. Inter-rater reliability ICC (A,5) (95% CI) − 0.92 (0.79, 0.98) −0.25 (−0.99, 0.55) − Relaxed agreement − 76.70% 91.00% C. Automated–expert calibration Pearson r 0.91 (p < 0.001) − − − Lin's CCC 0.83 − − − Mean bias −3.3 −9.58 2.99 − MAE 6.74 10.49 2.99 Data are presented as mean ± SD or point estimates with 95% confidence intervals (CIs). Section A quantifies the methodological completeness gap, where five-rater expert consensus confirms that agent-generated protocols outperform matched peer-reviewed articles. Section B reports inter-rater reliability and relaxed item-level agreement. The anomalous ICC value for the protocol group reflects a ceiling effect caused by restricted between-object variance, as experts consistently rated these protocols near the maximum score; it should therefore be interpreted together with the relaxed agreement metric. Section C reports automated–expert calibration at the object level using Pearson r, Lin's concordance correlation coefficient (CCC), mean bias, and MAE. Abbreviations: CCC, Lin's concordance correlation coefficient; ICC, intraclass correlation coefficient; MAE, mean absolute error; POMP, percent of maximum possible score. The source data is provided in Supplementary File 2. Table 1.
Expert validation of protocol completeness and automated scoring calibration.
Figures
(6)
Tables
(1)