-
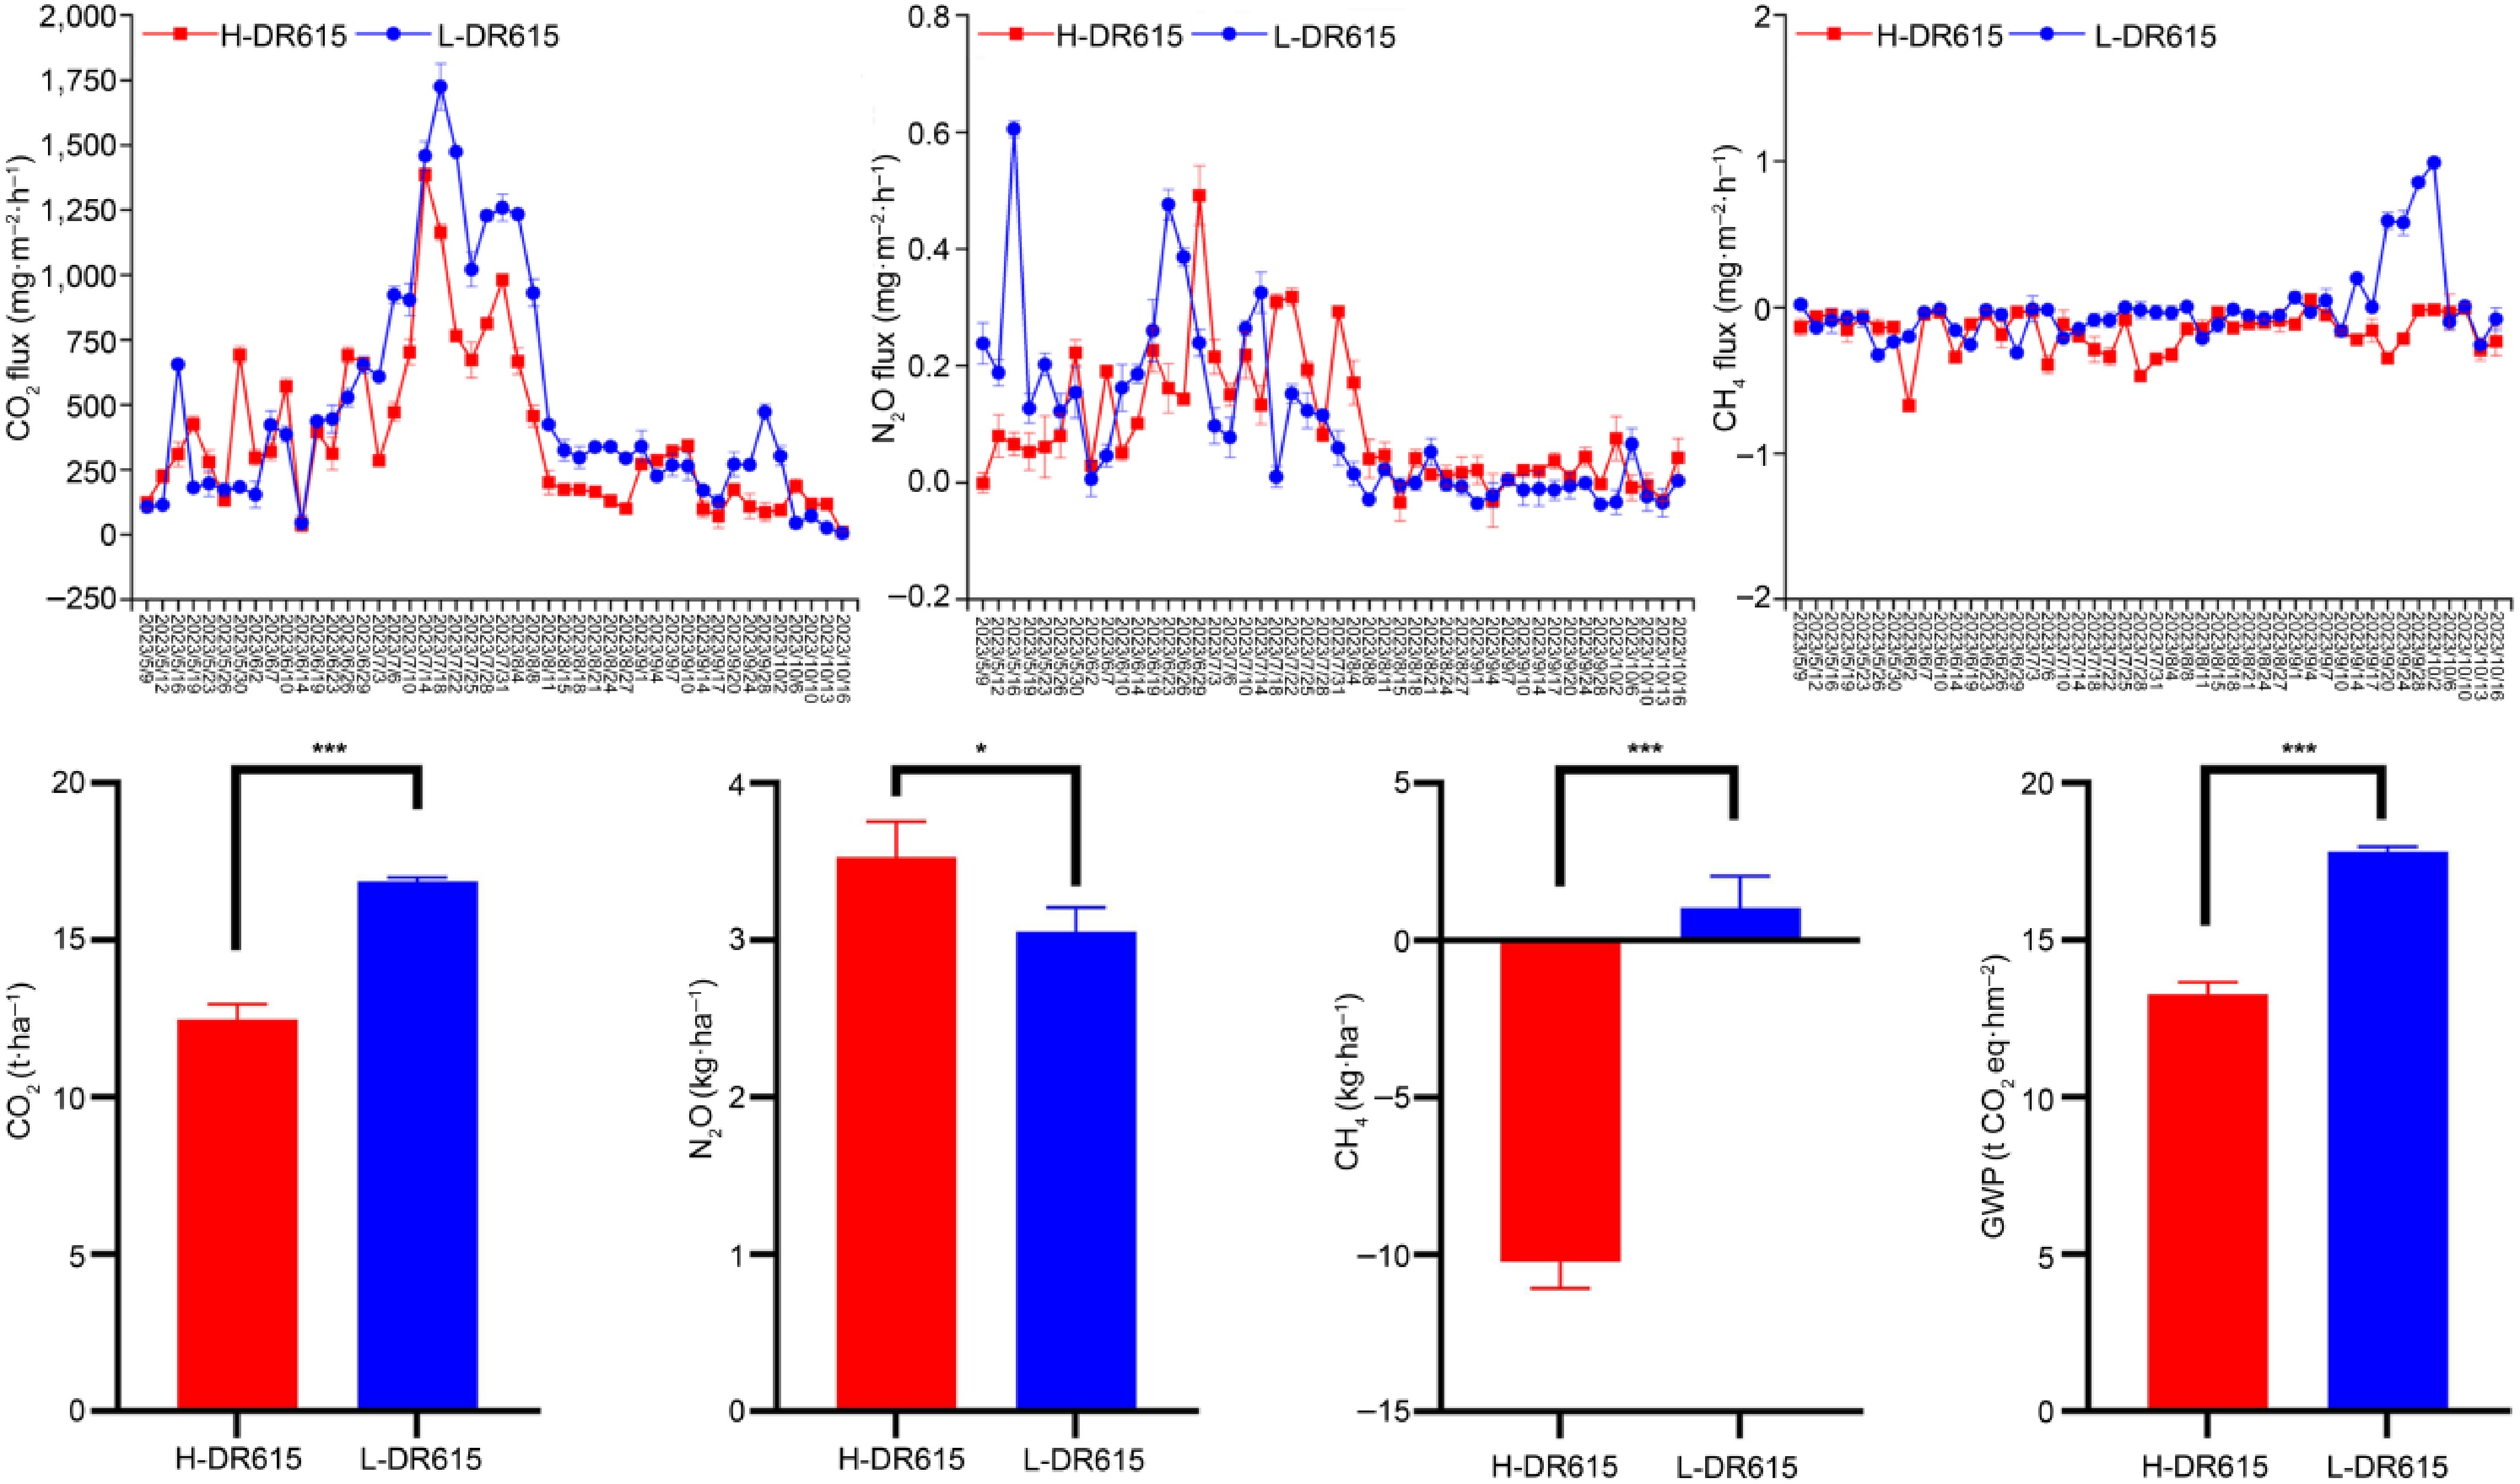
Figure 1.
Temporal dynamics of soil GHG emissions under NGDR cultivation at two altitudes (* p < 0.05, *** p < 0.001).
-
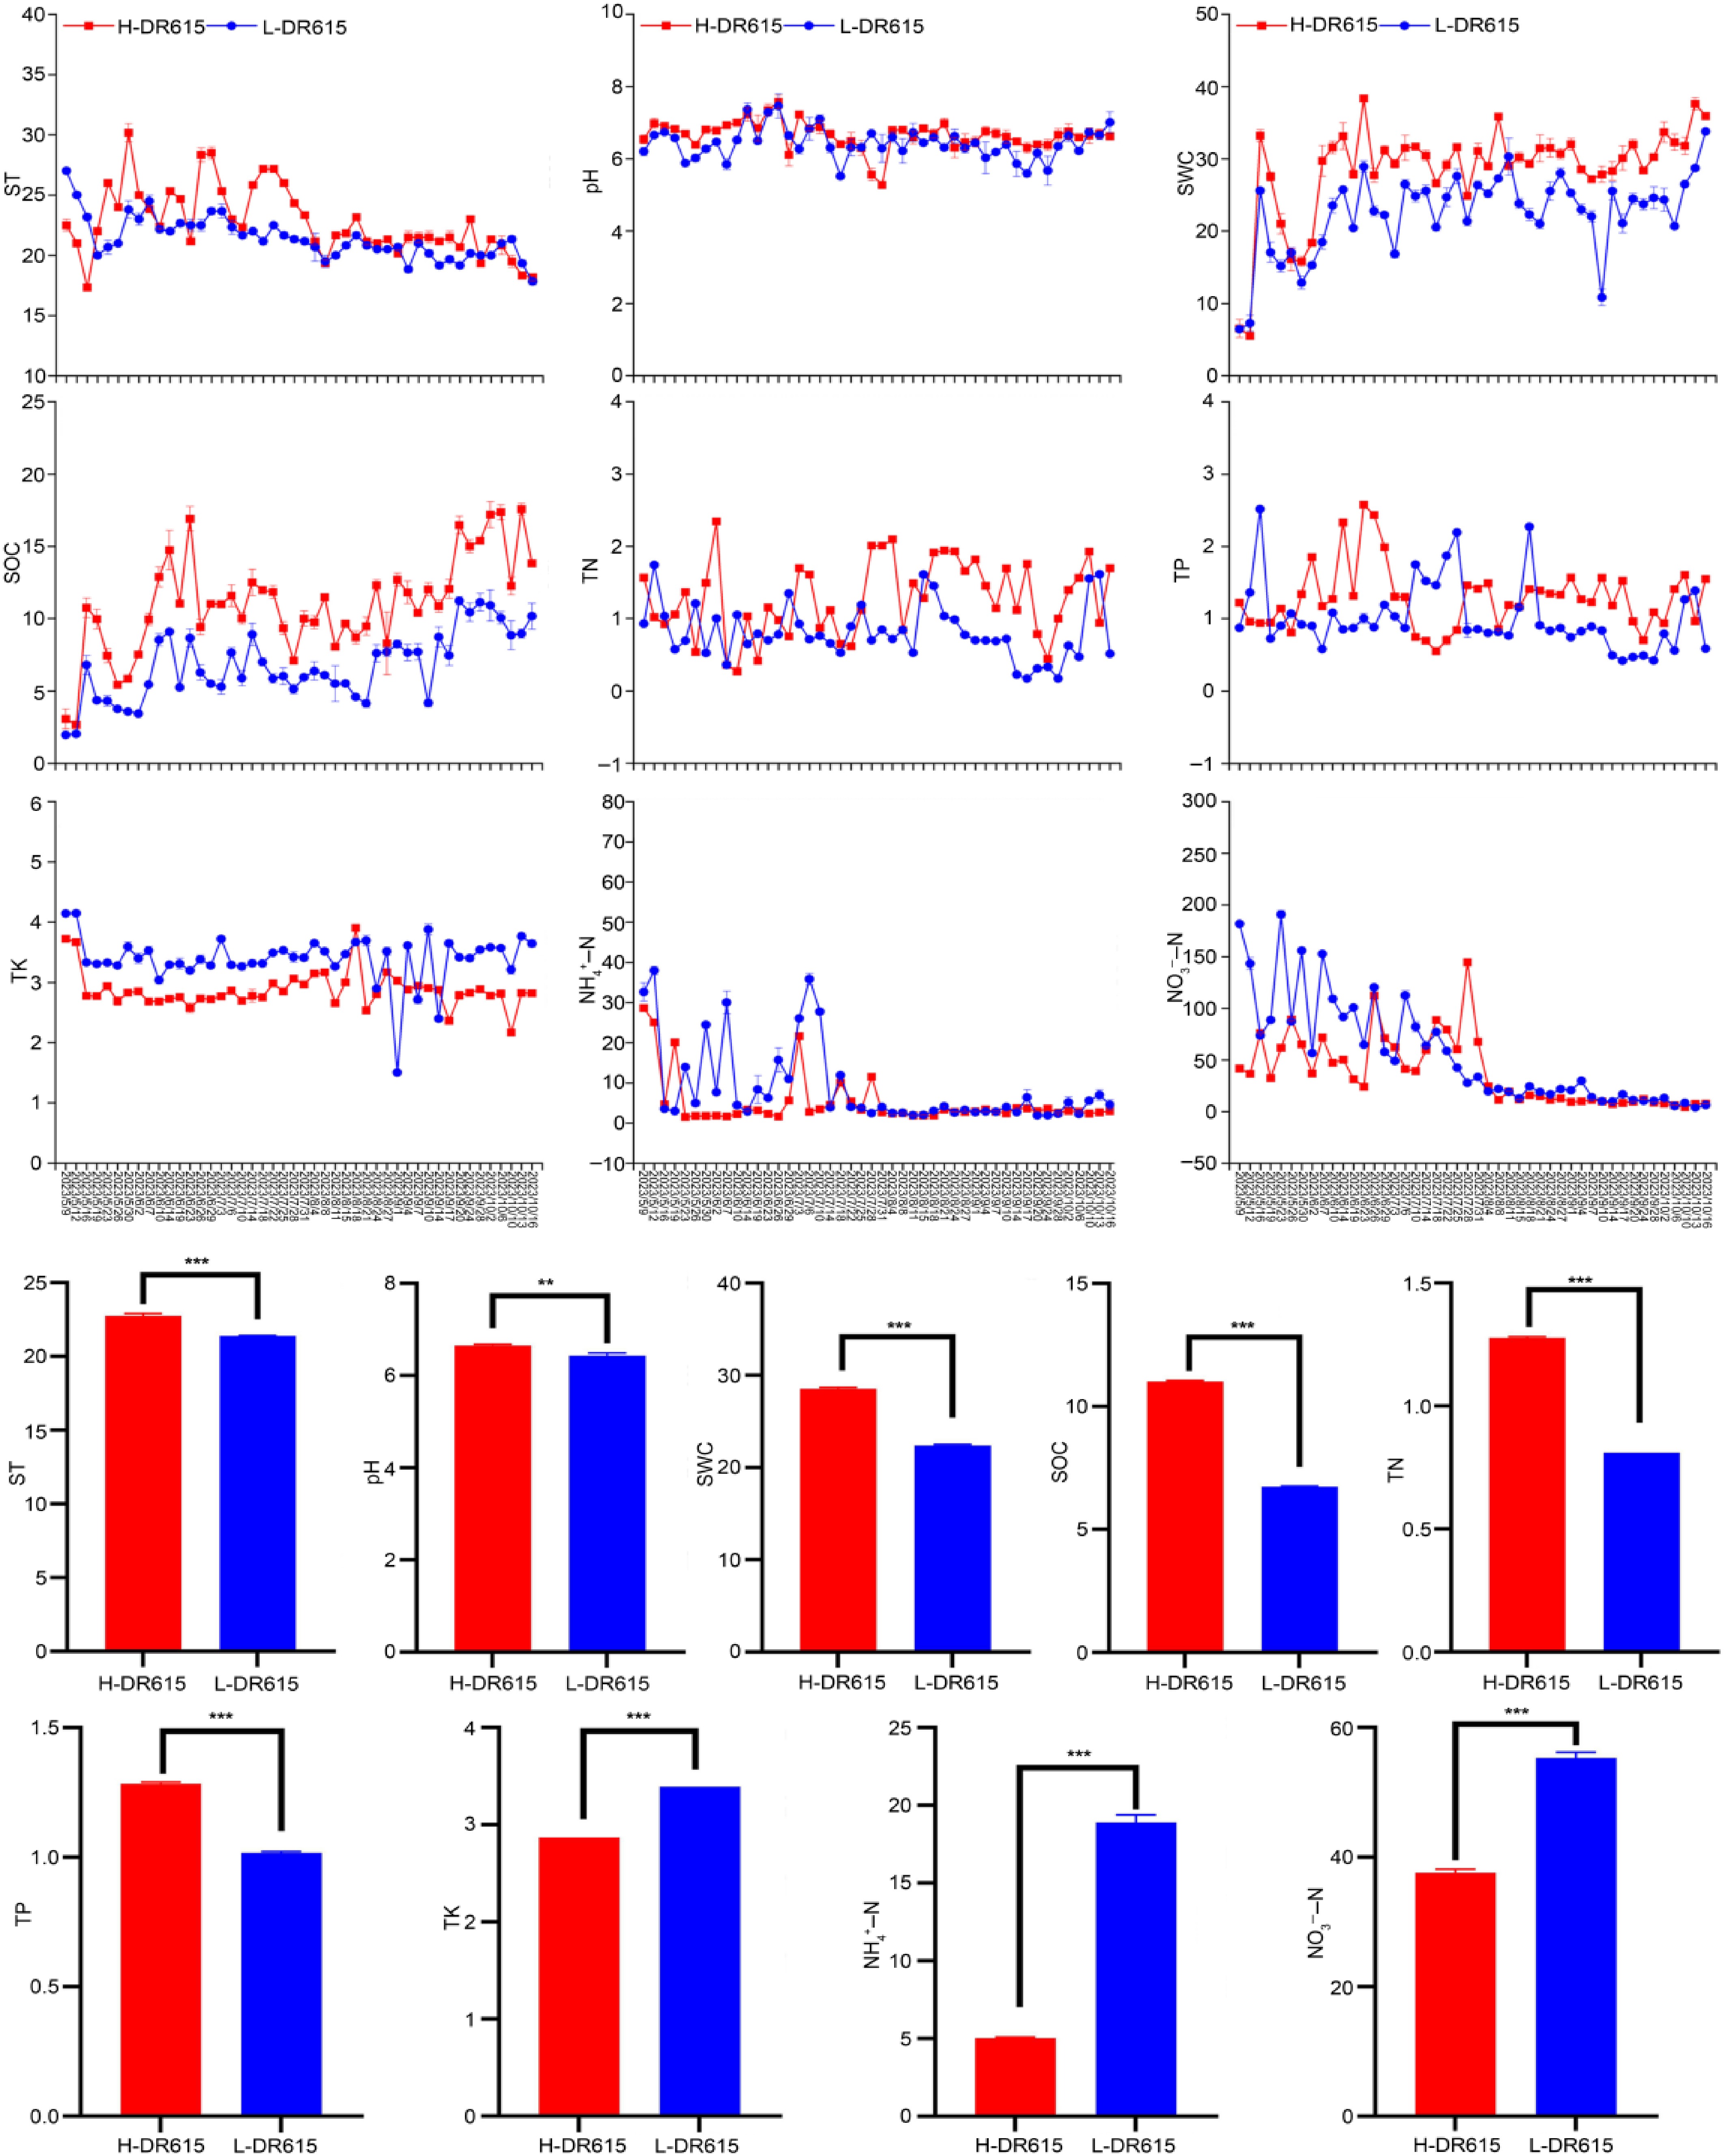
Figure 2.
Variation in edaphic properties under NGDR cultivation at two altitudes (** p < 0.01, *** p < 0.001).
-
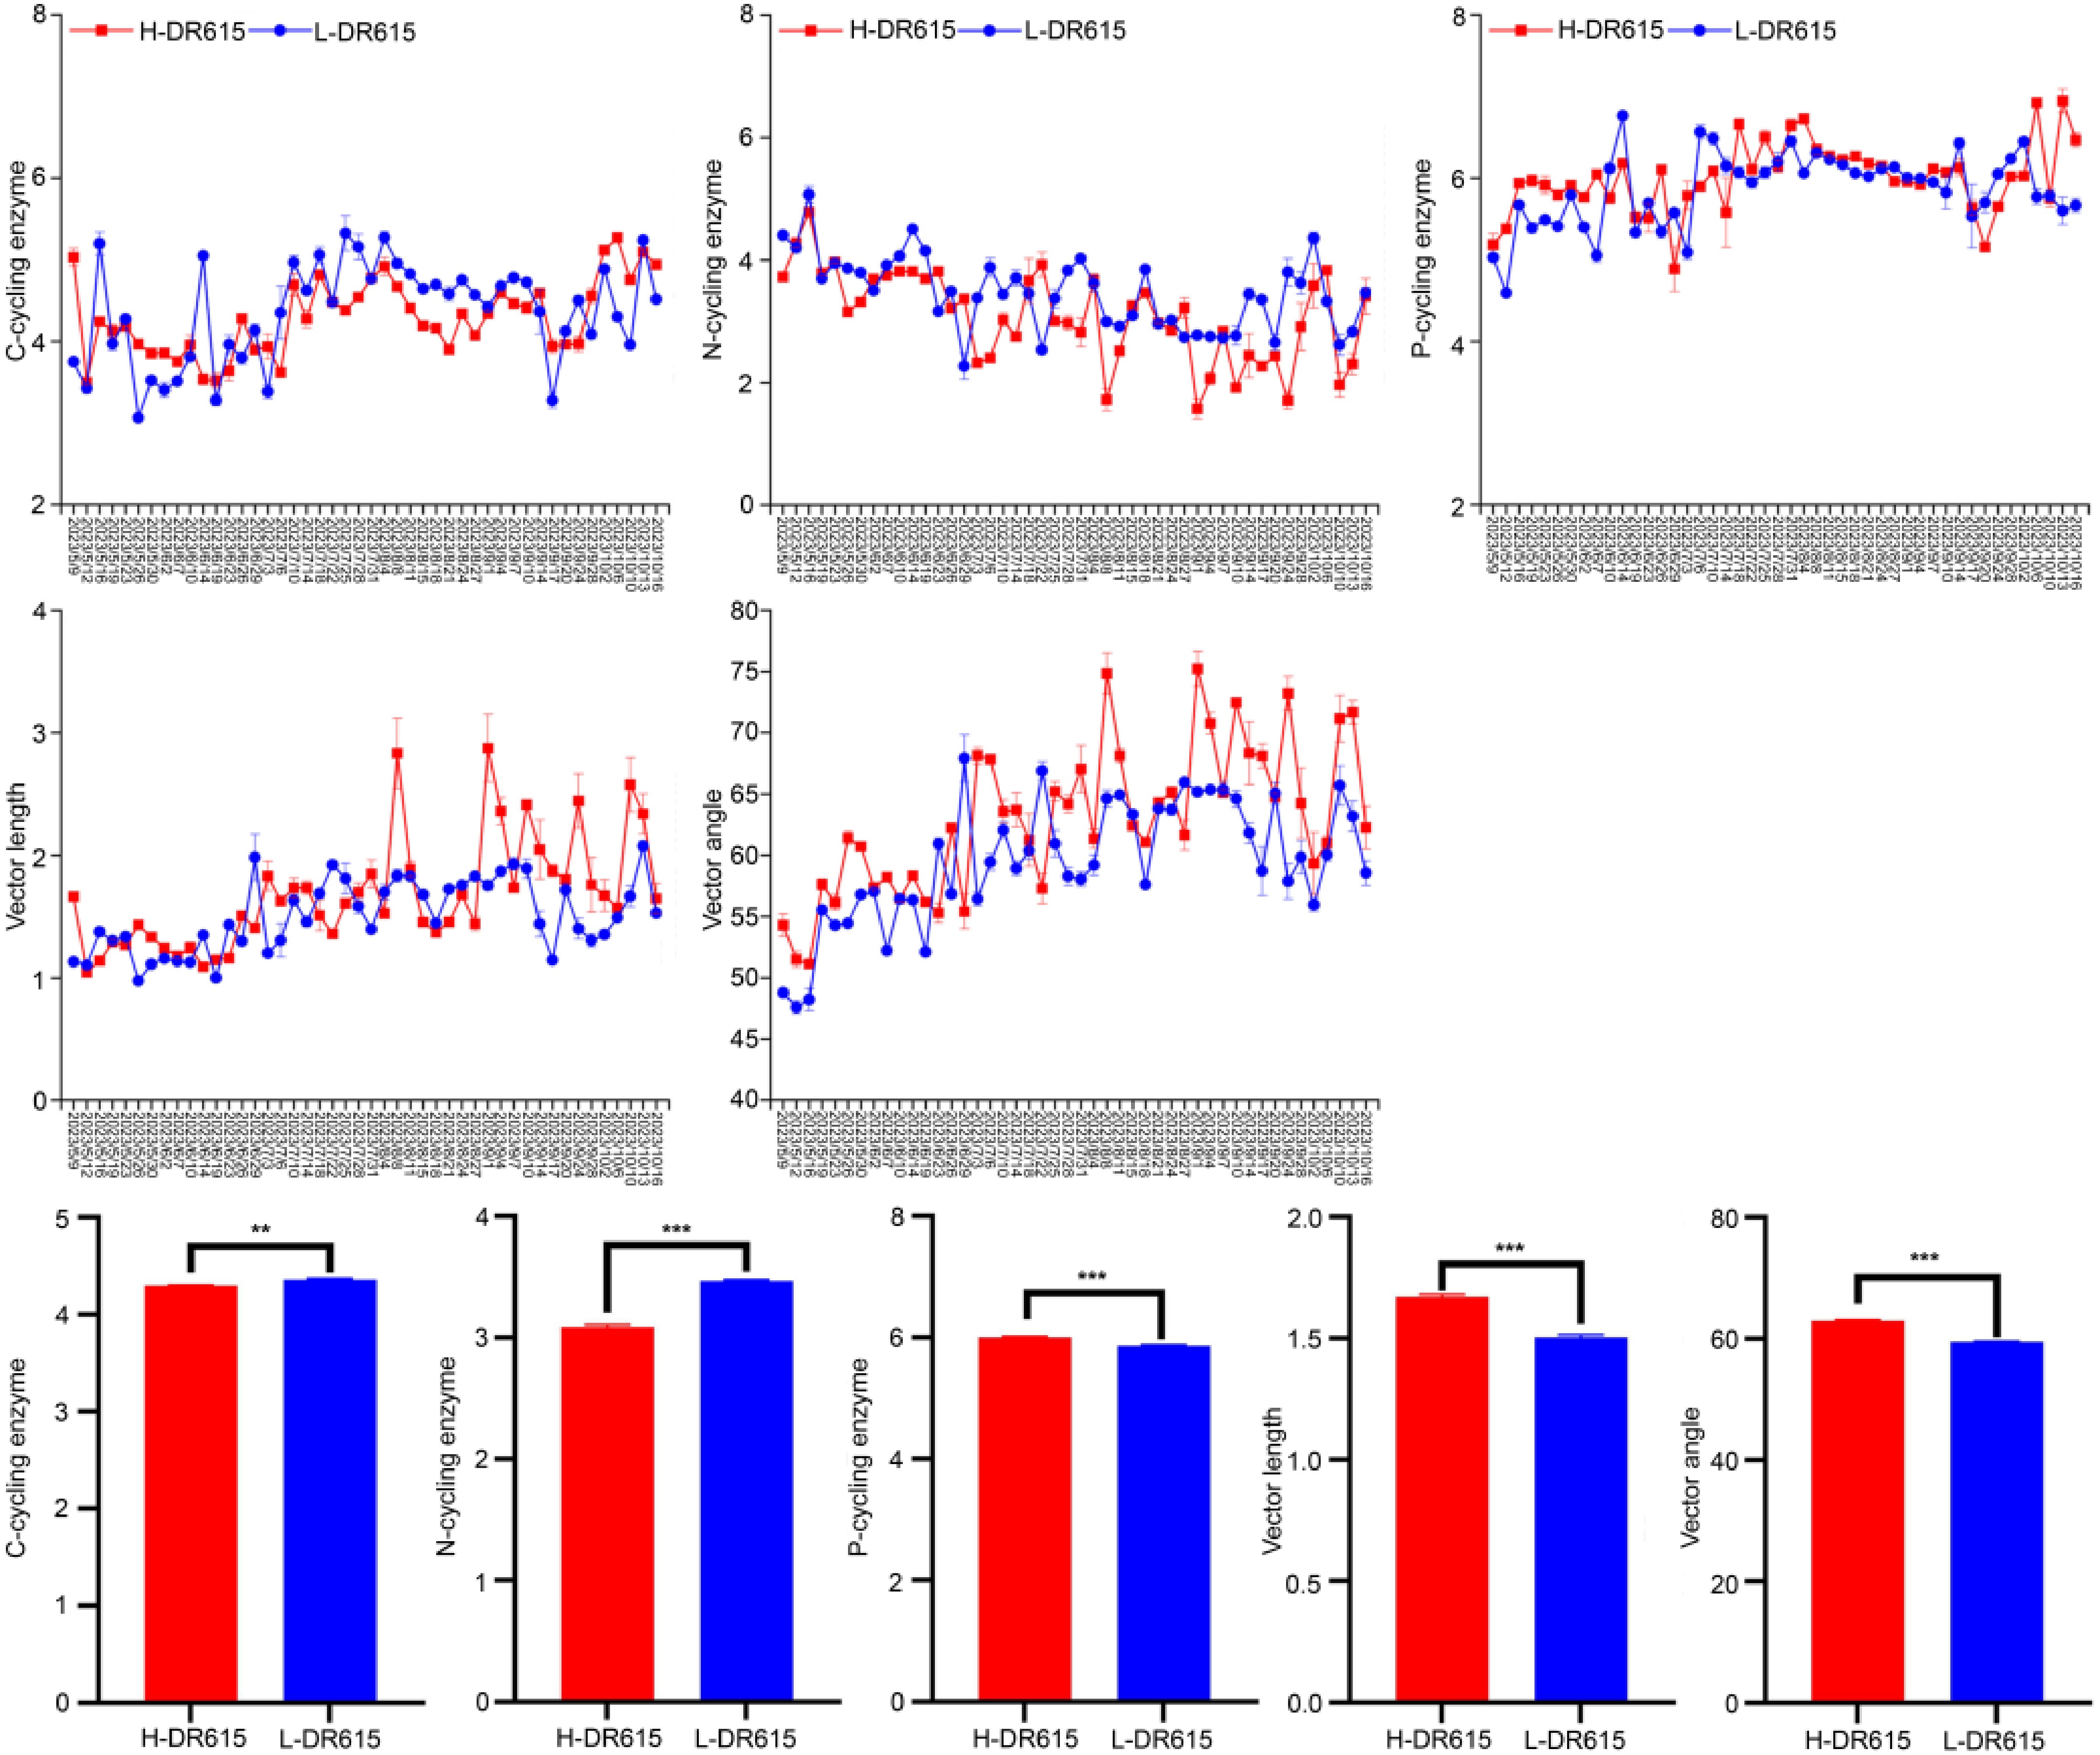
Figure 3.
Variation in EEAs under NGDR at two altitudes (** p < 0.01, *** p < 0.001).
-
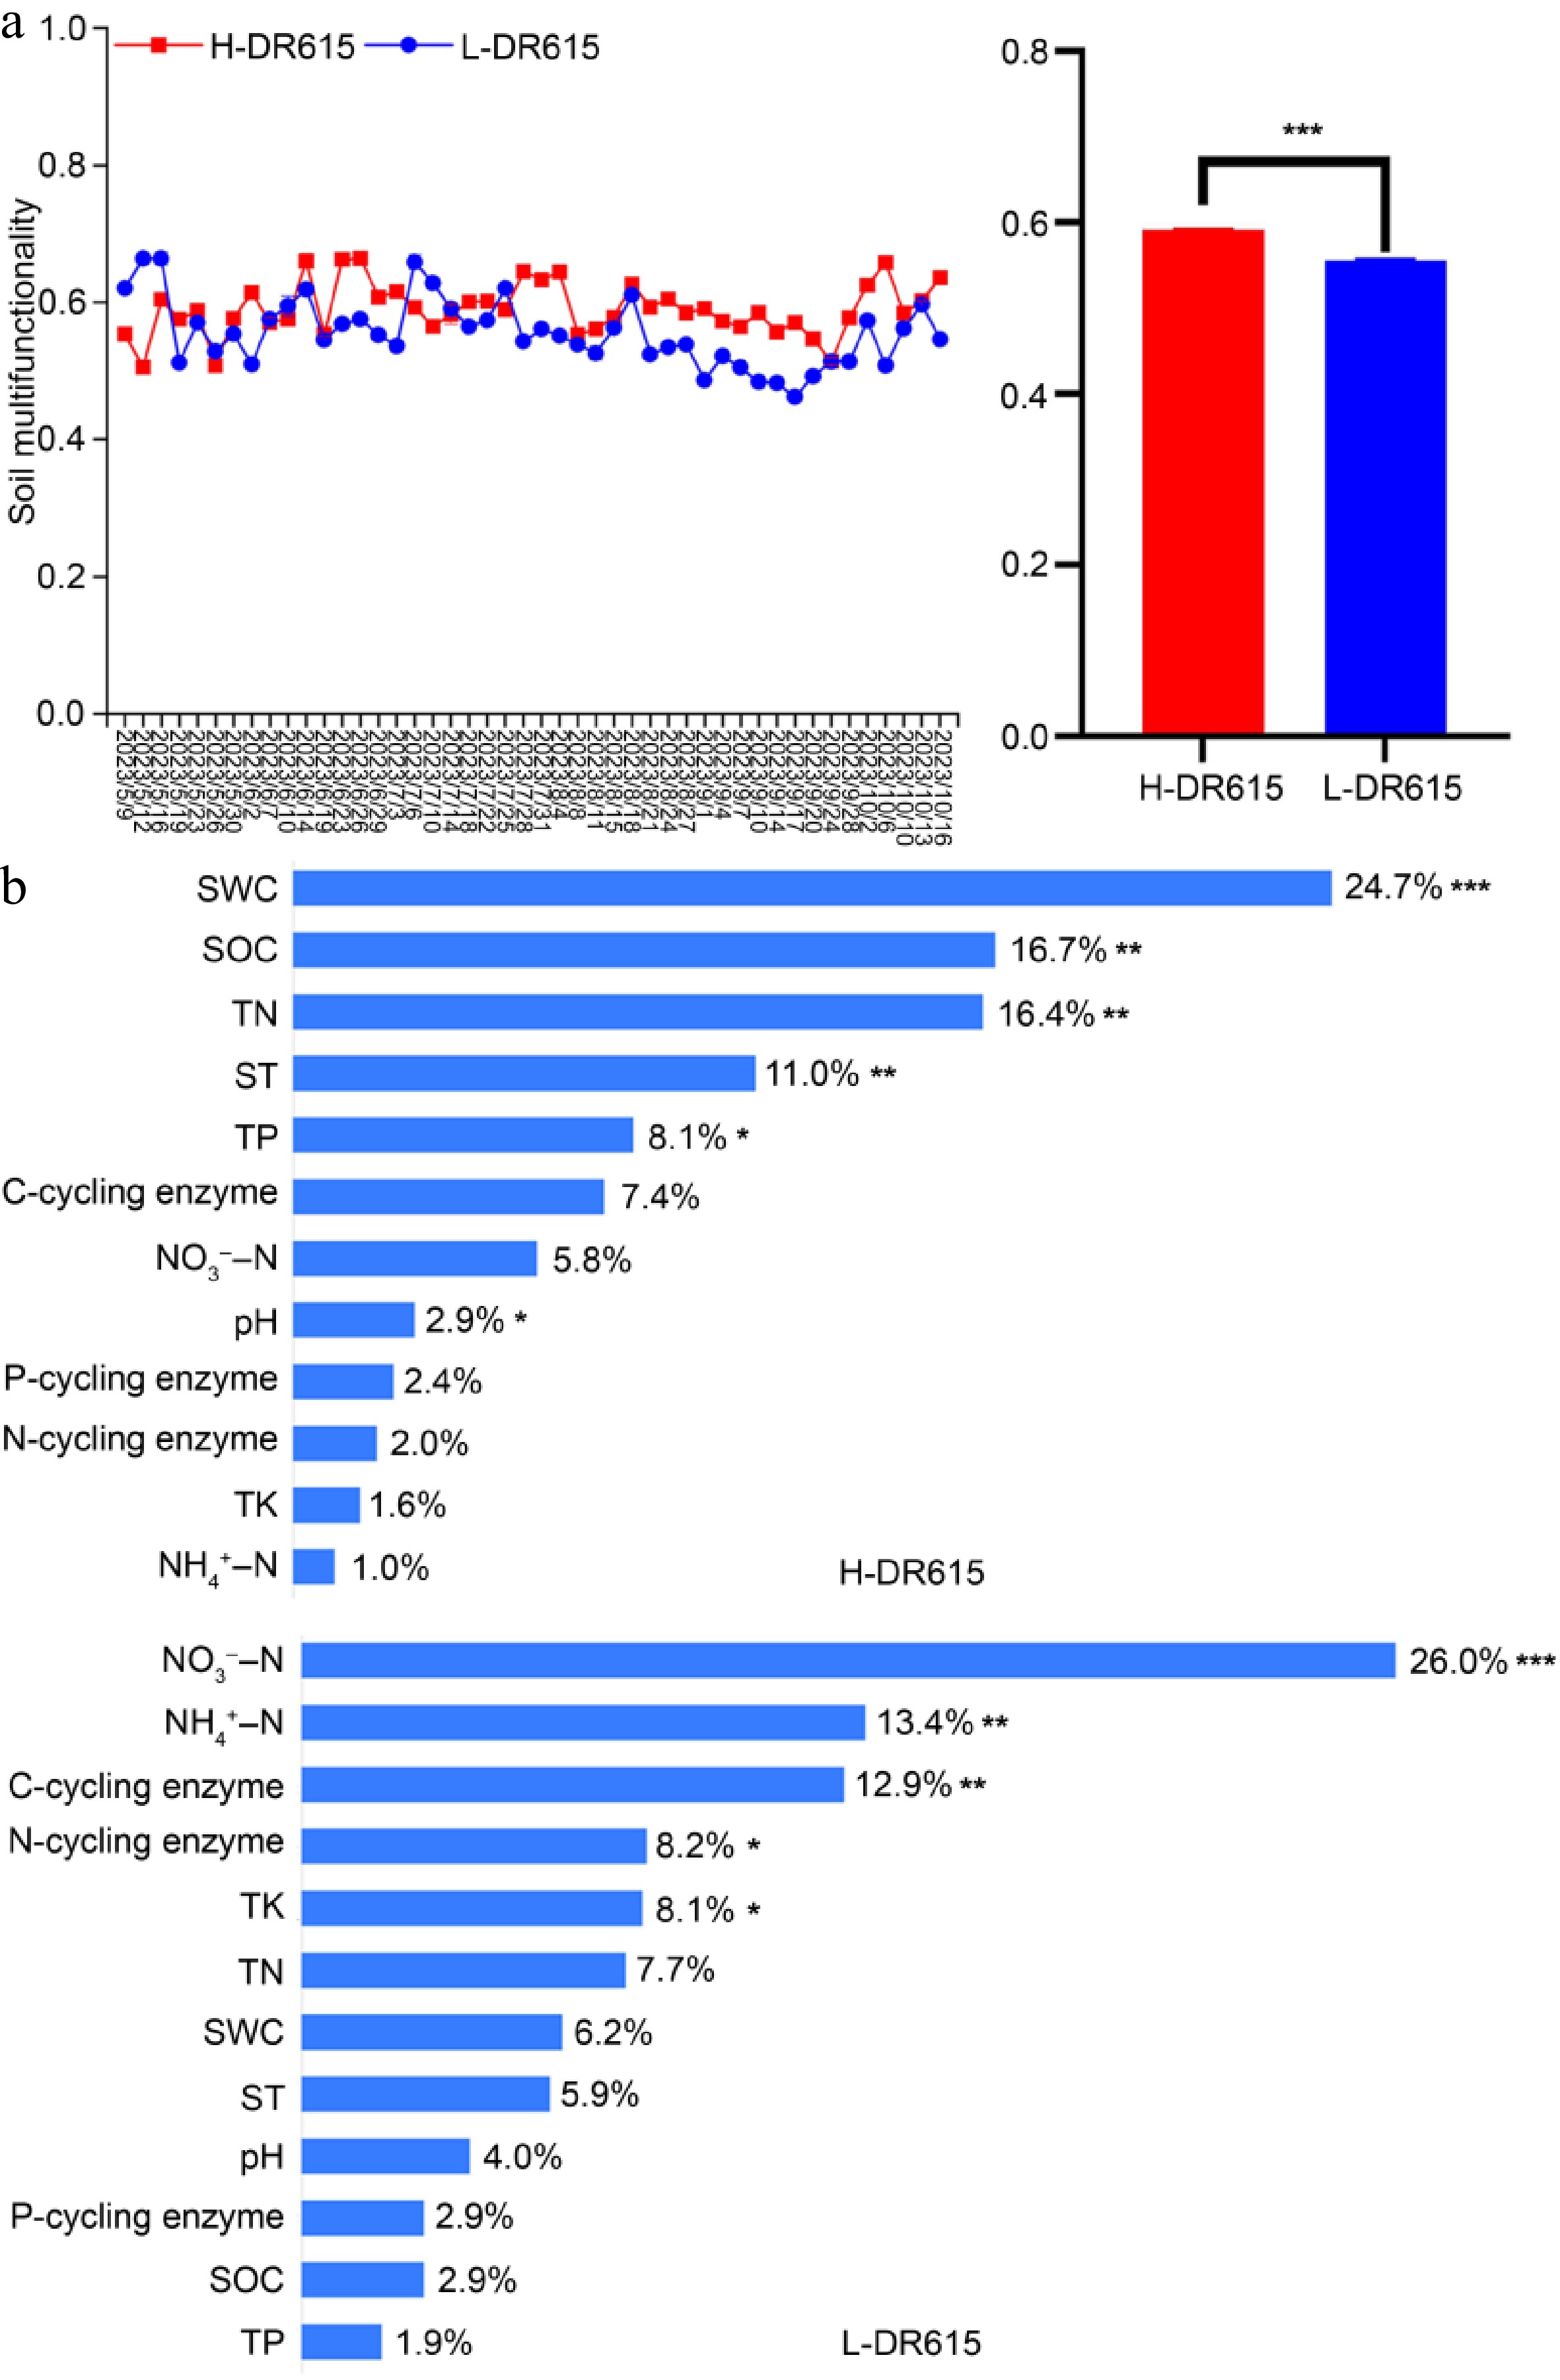
Figure 4.
Changes in (a) SMF and (b) influencing factors (* p < 0.05, ** p < 0.01, *** p < 0.001).
-
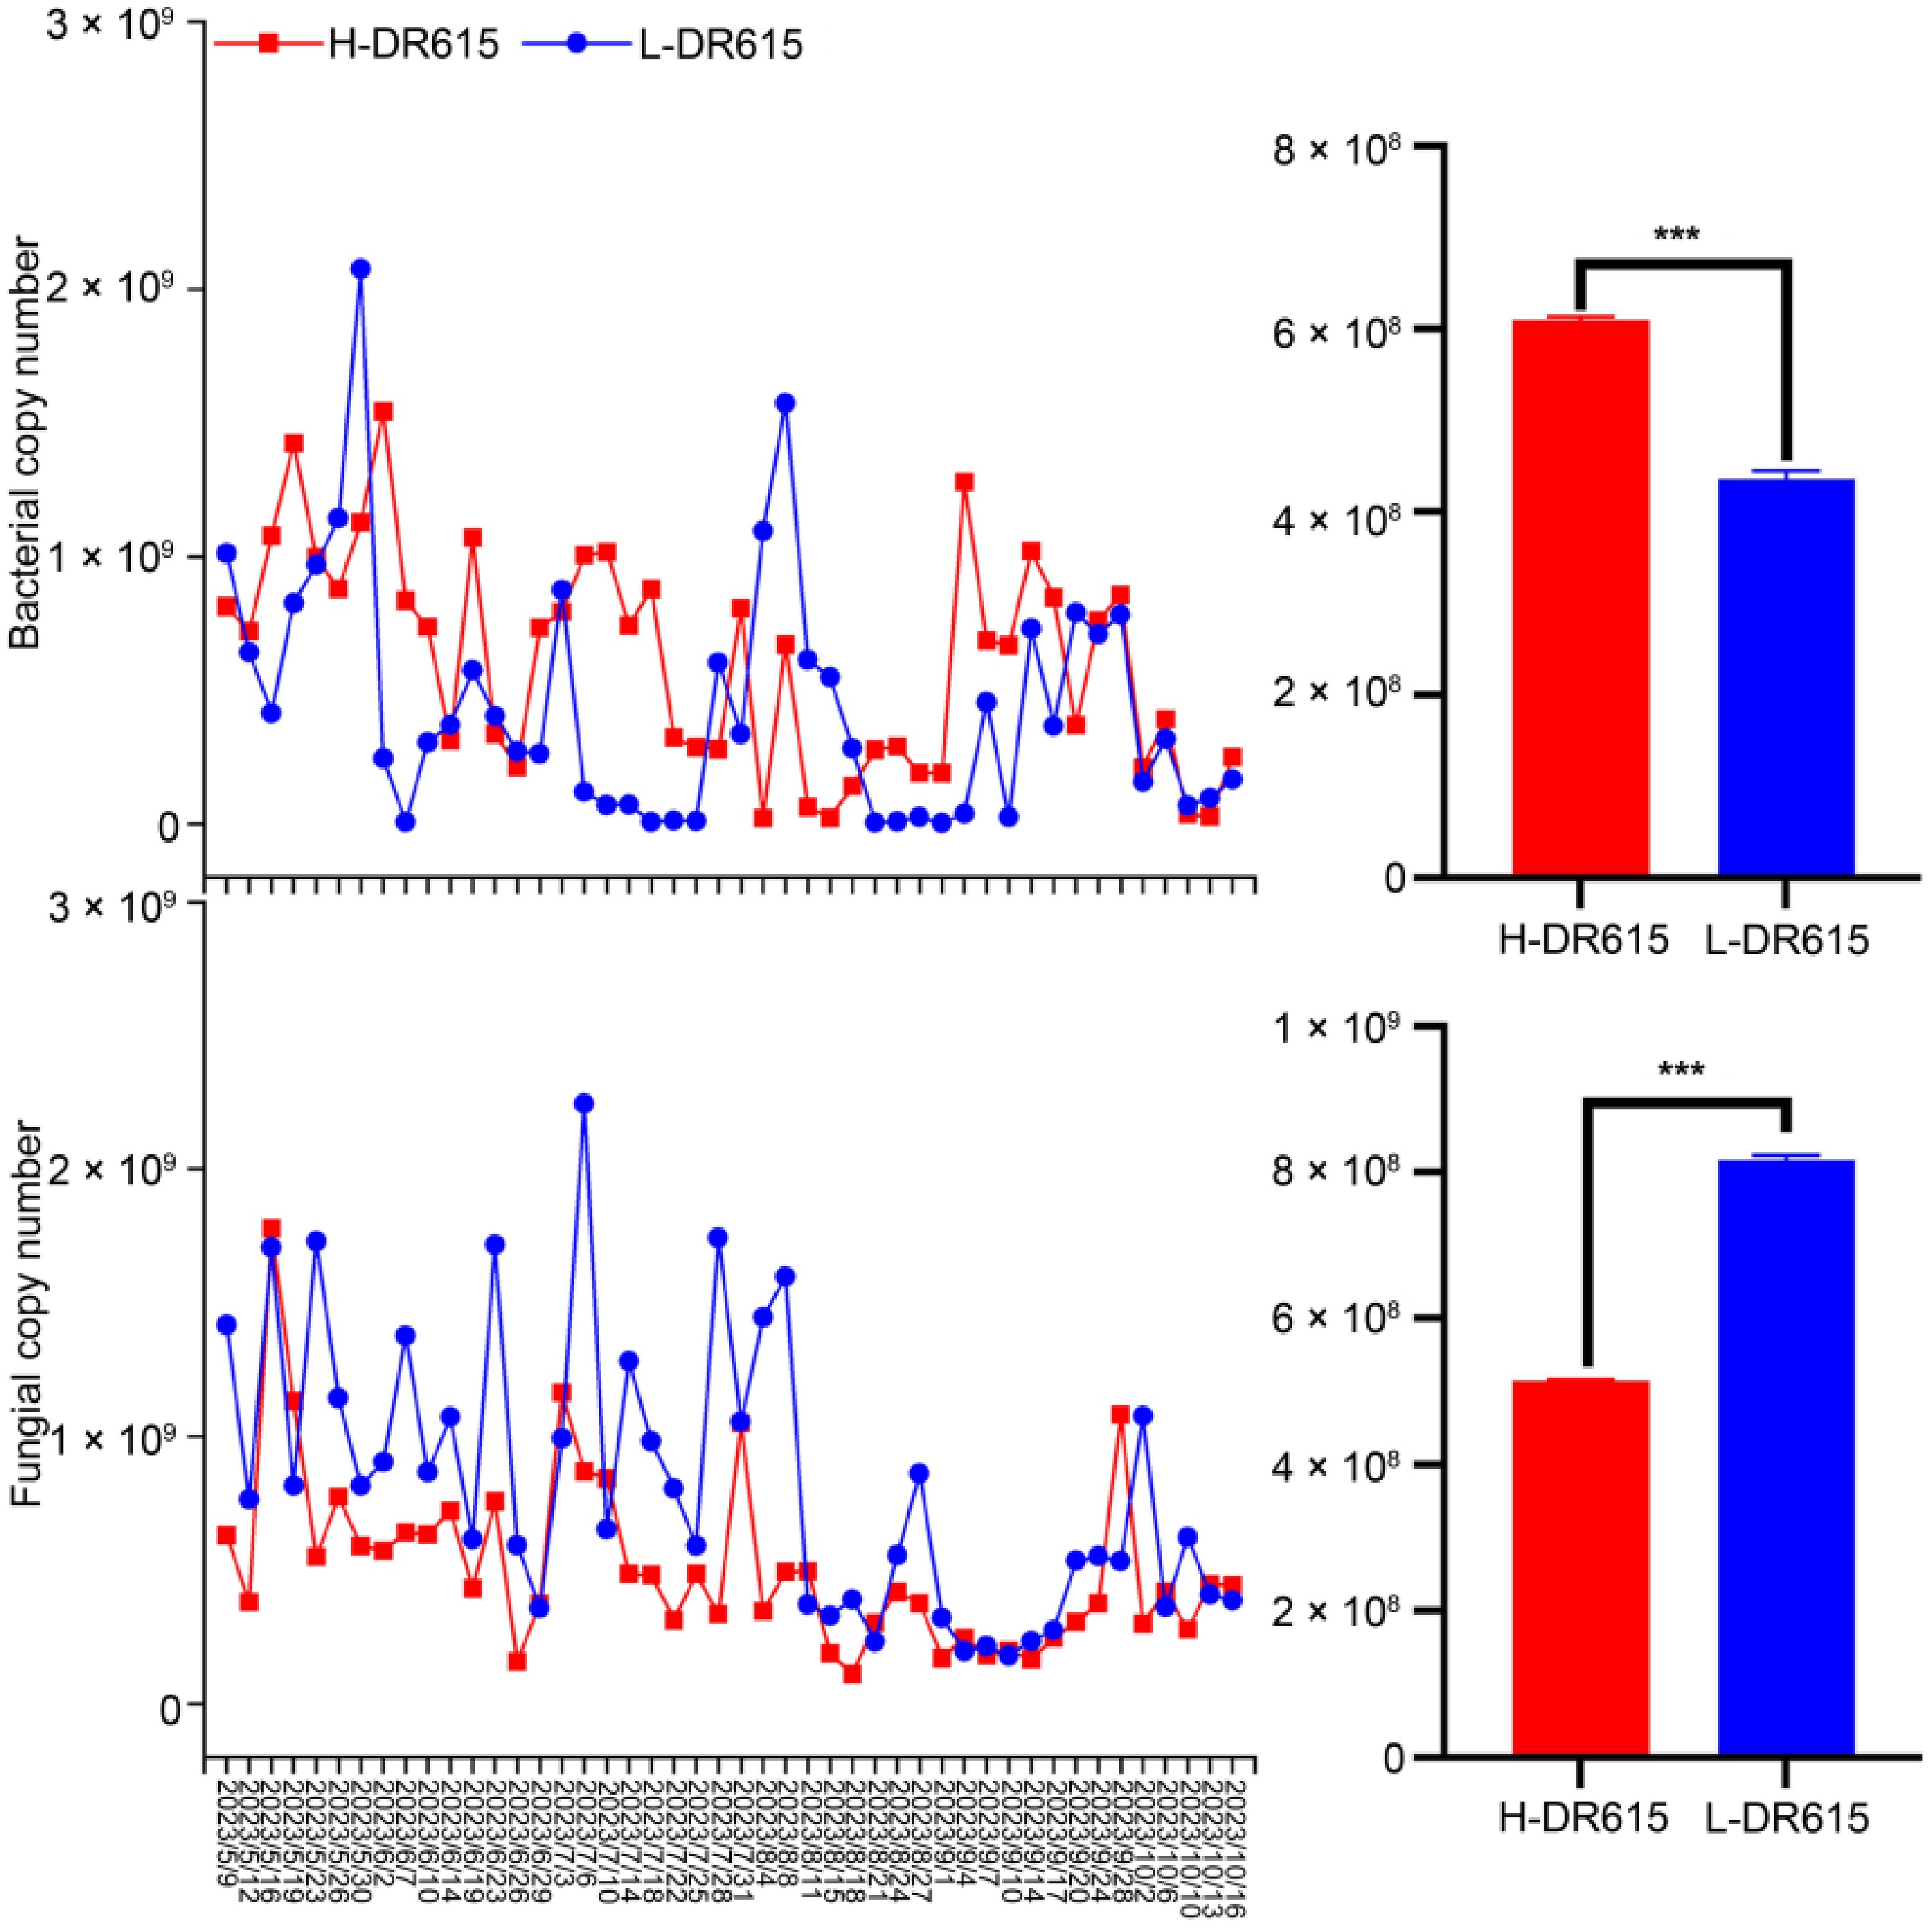
Figure 5.
Variations in soil bacterial and fungal copy numbers under two altitudinal treatments (*** p < 0.001).
-
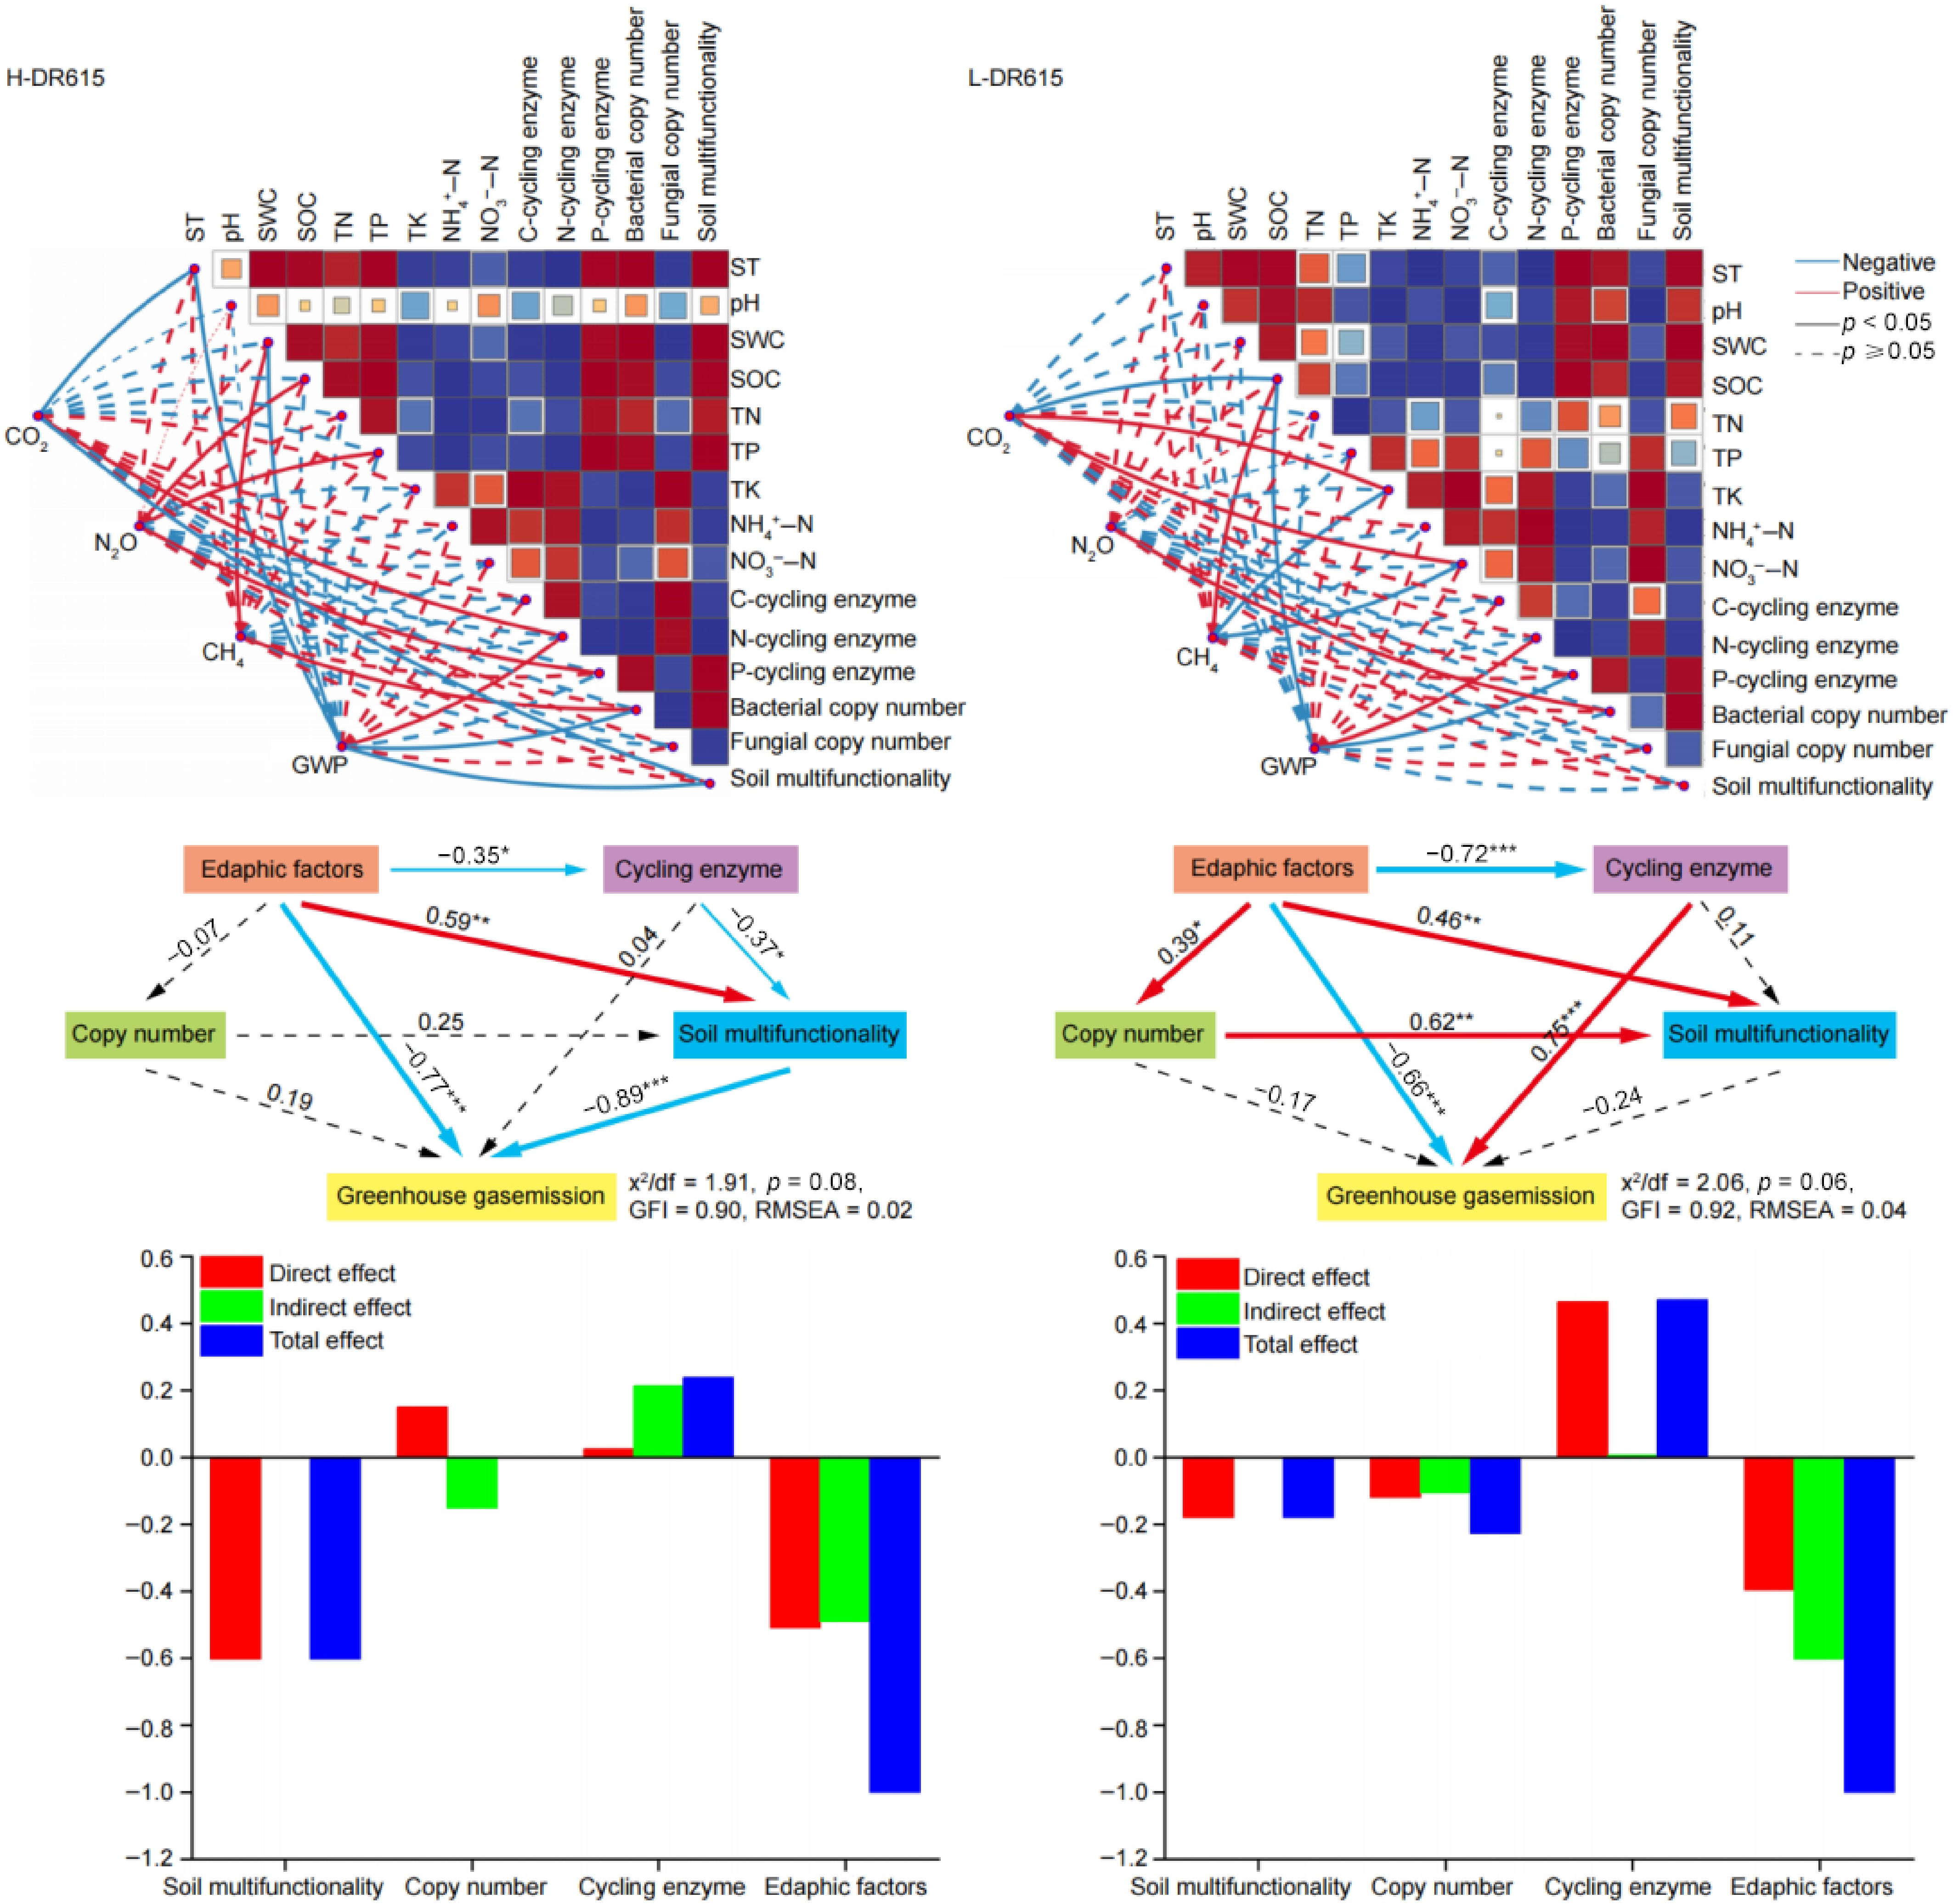
Figure 6.
(a) Spearman correlation heatmap, (b) structural equation modeling, and (c) standardized effect analysis. Red and blue arrows indicate significant positive and negative relationships, respectively (* p < 0.05, ** p < 0.01, *** p < 0.001).
Figures
(6)
Tables
(0)