-
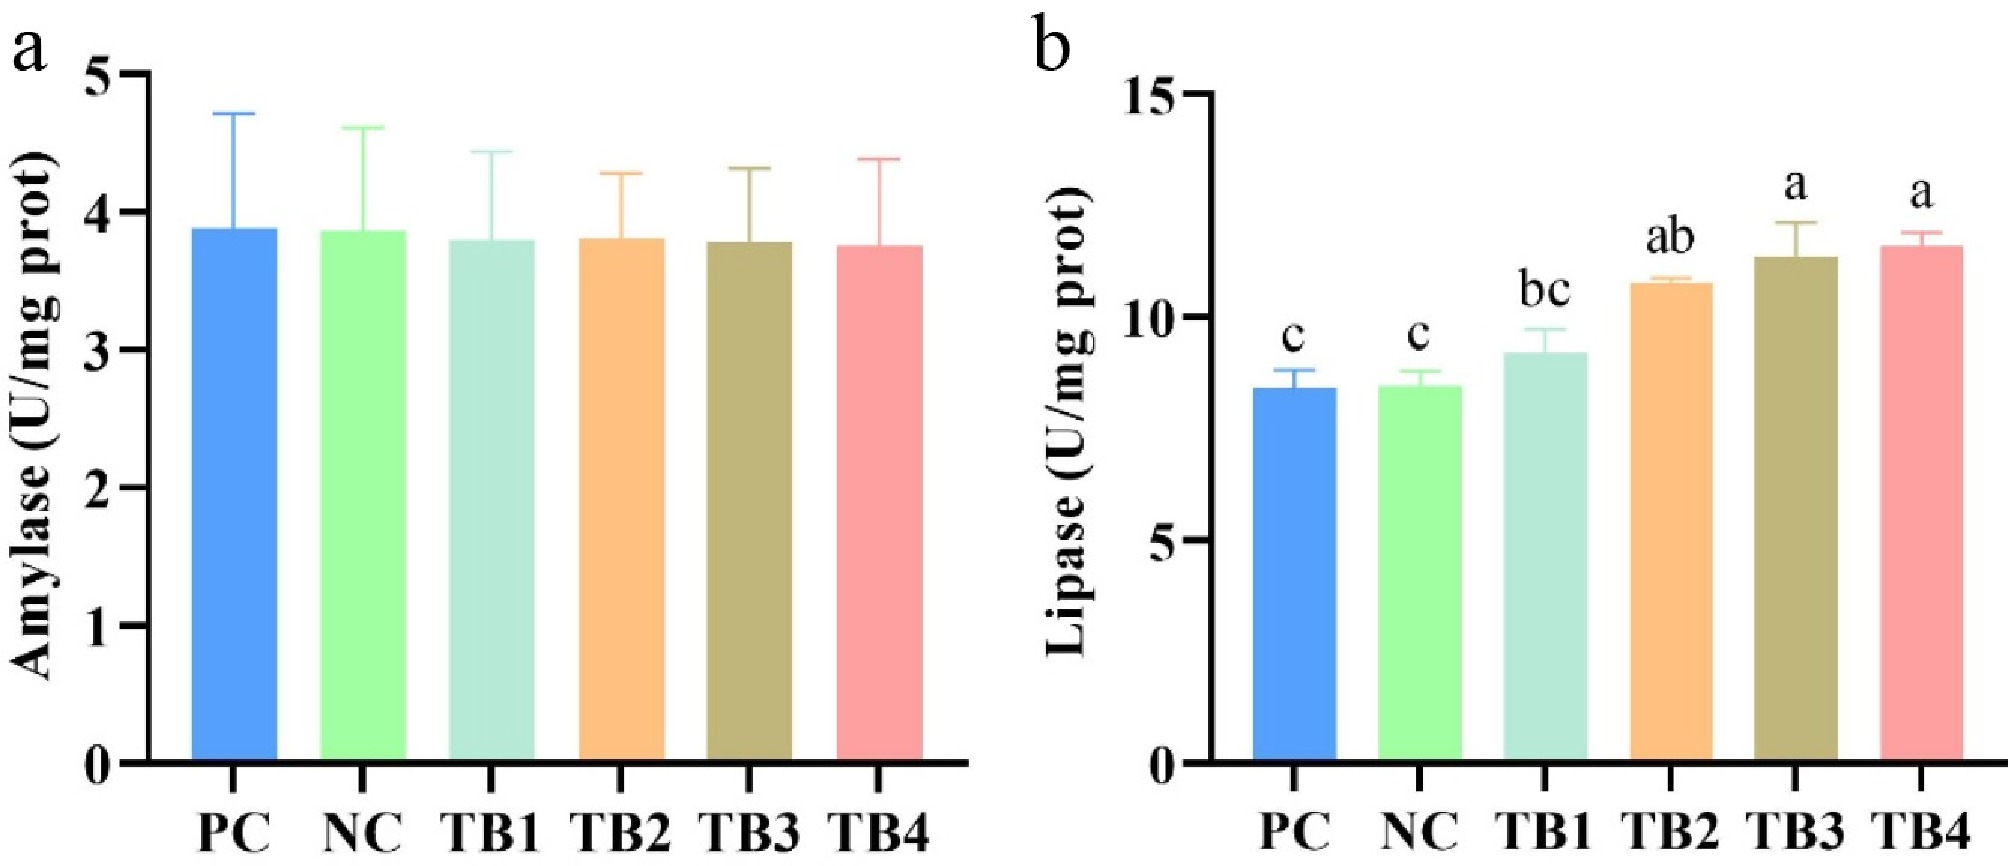
Figure 1.
The effect of substitution of fish meal and addition of different levels of tributyrin on intestinal enzymatic activities of M. nipponense. Note: (a) amylase; (b) lipase. Values are presented as mean ± SEM (n = 9). Different letters indicate significant differences between treatments (p < 0.05).
-
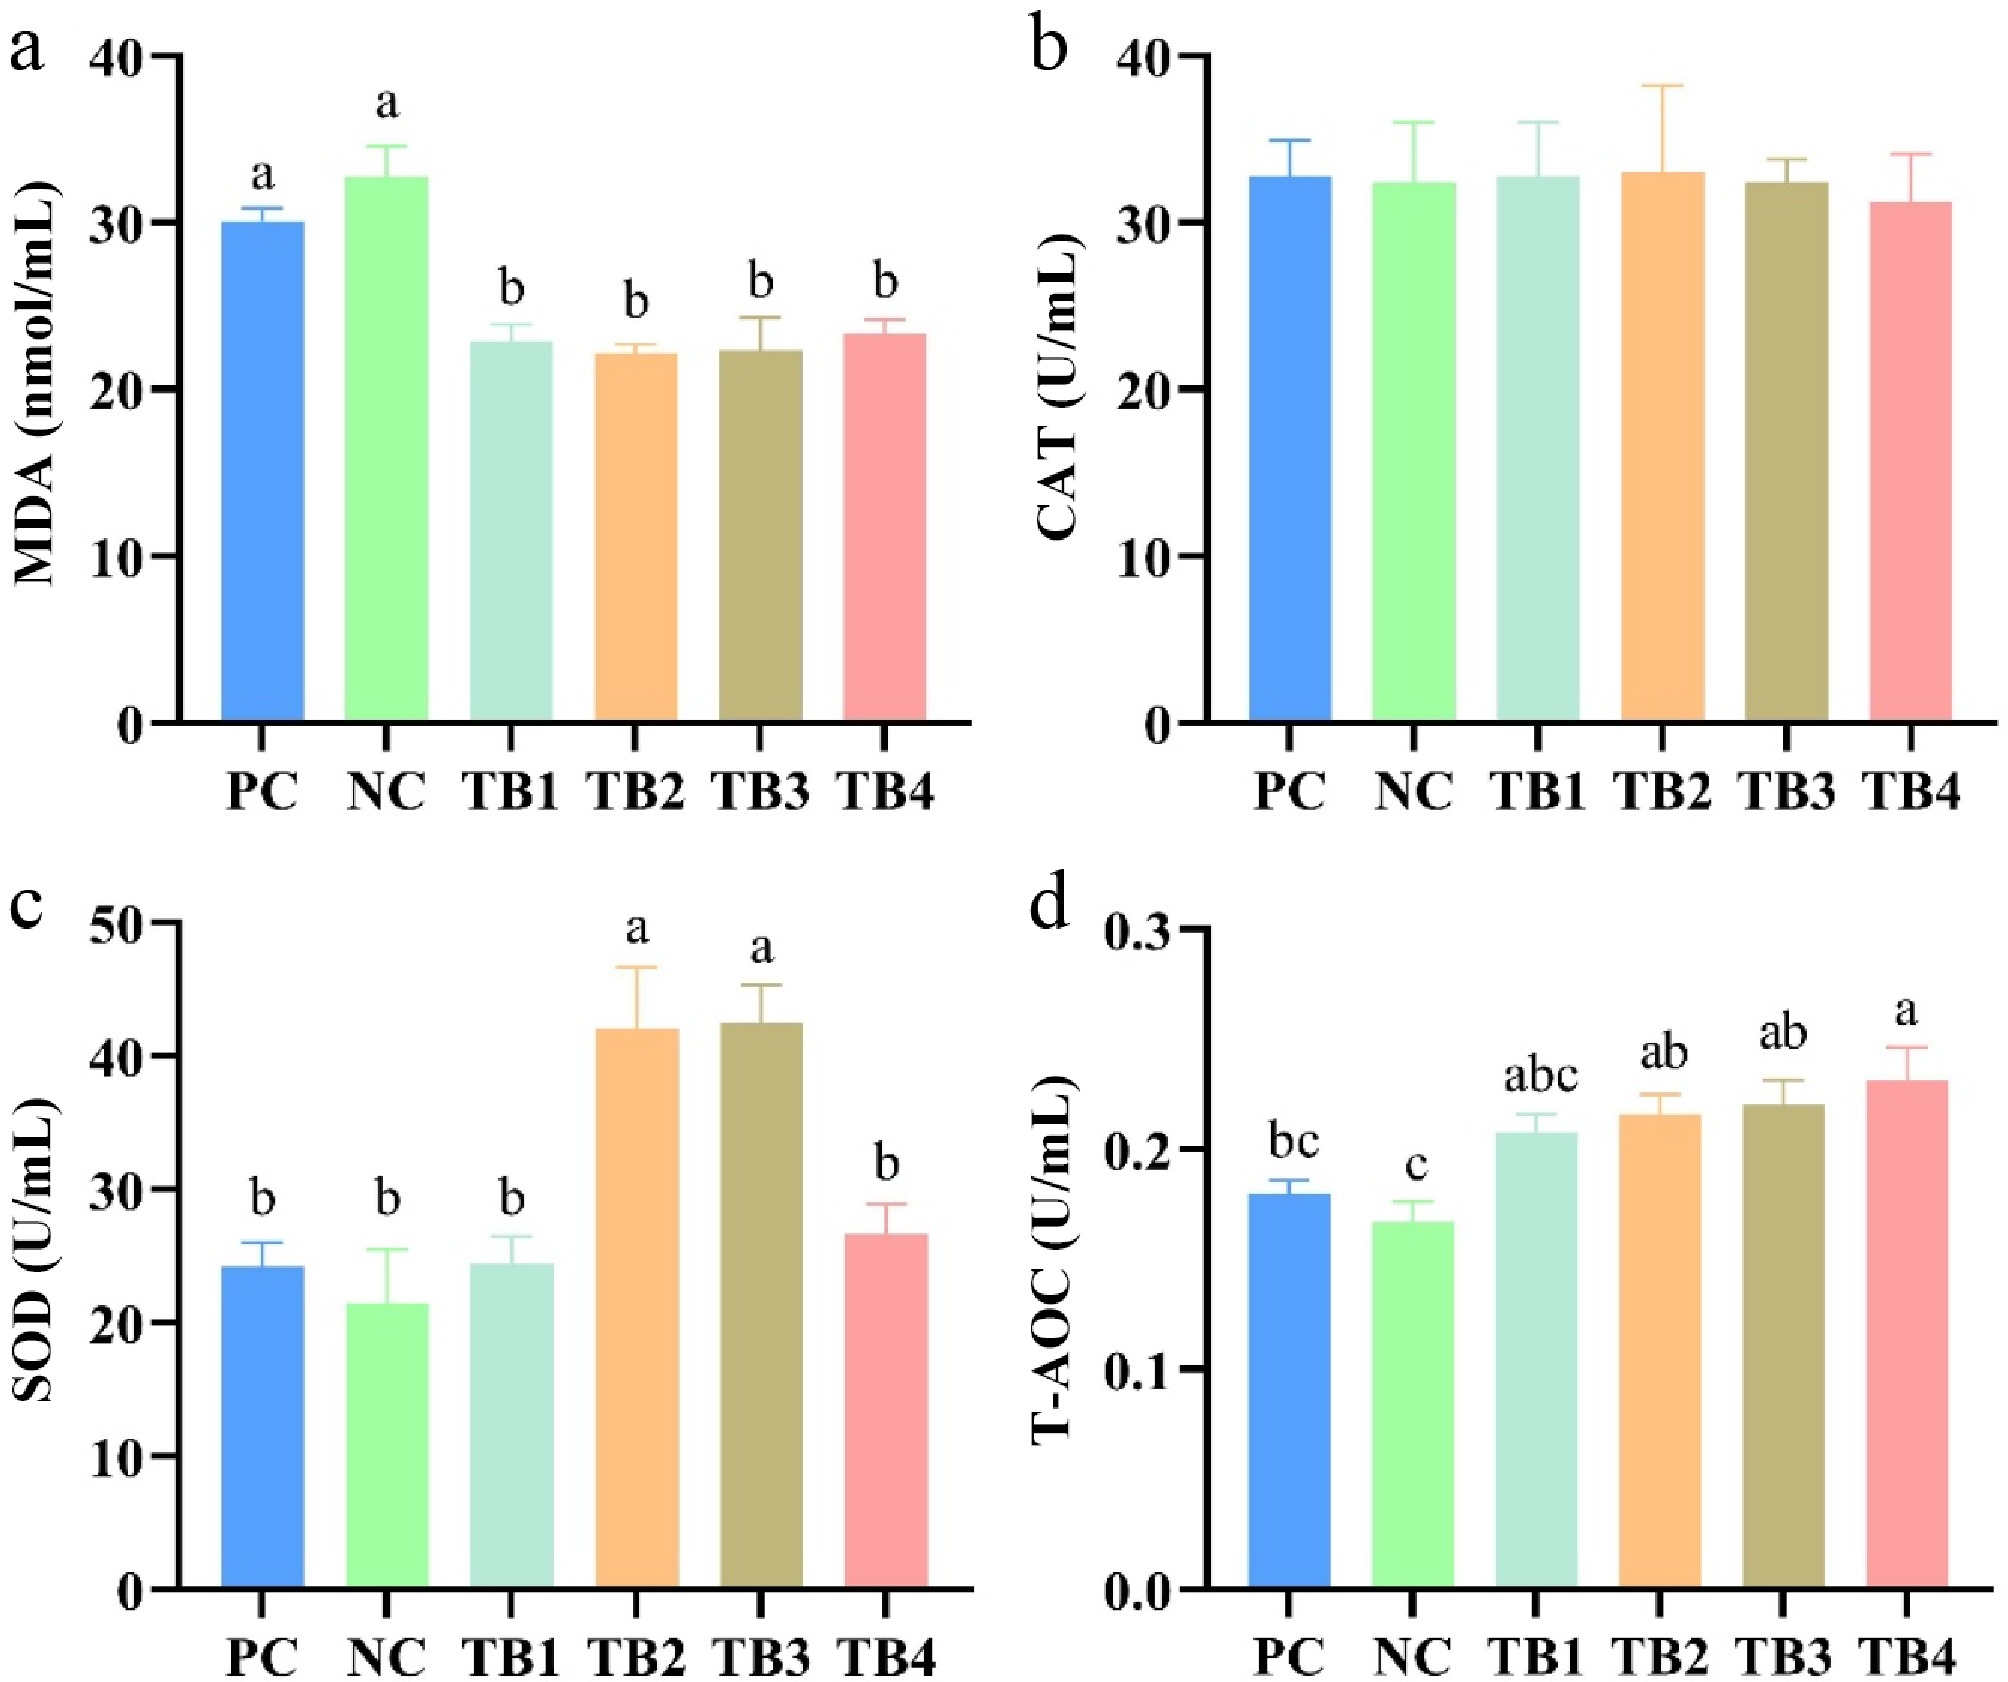
Figure 2.
The effect of substitution of fish meal and addition of different levels of tributyrin on antioxidant enzymatic capacity in hemolymph of M. nipponense. Note: (a) malondialdehyde (MDA); (b) catalase (CAT); (c) superoxide dismutase (SOD); (d) total antioxidant capacity (T-AOC). Values are presented as mean ± SEM (n = 9). Different letters indicate significant differences between treatments (p < 0.05).
-
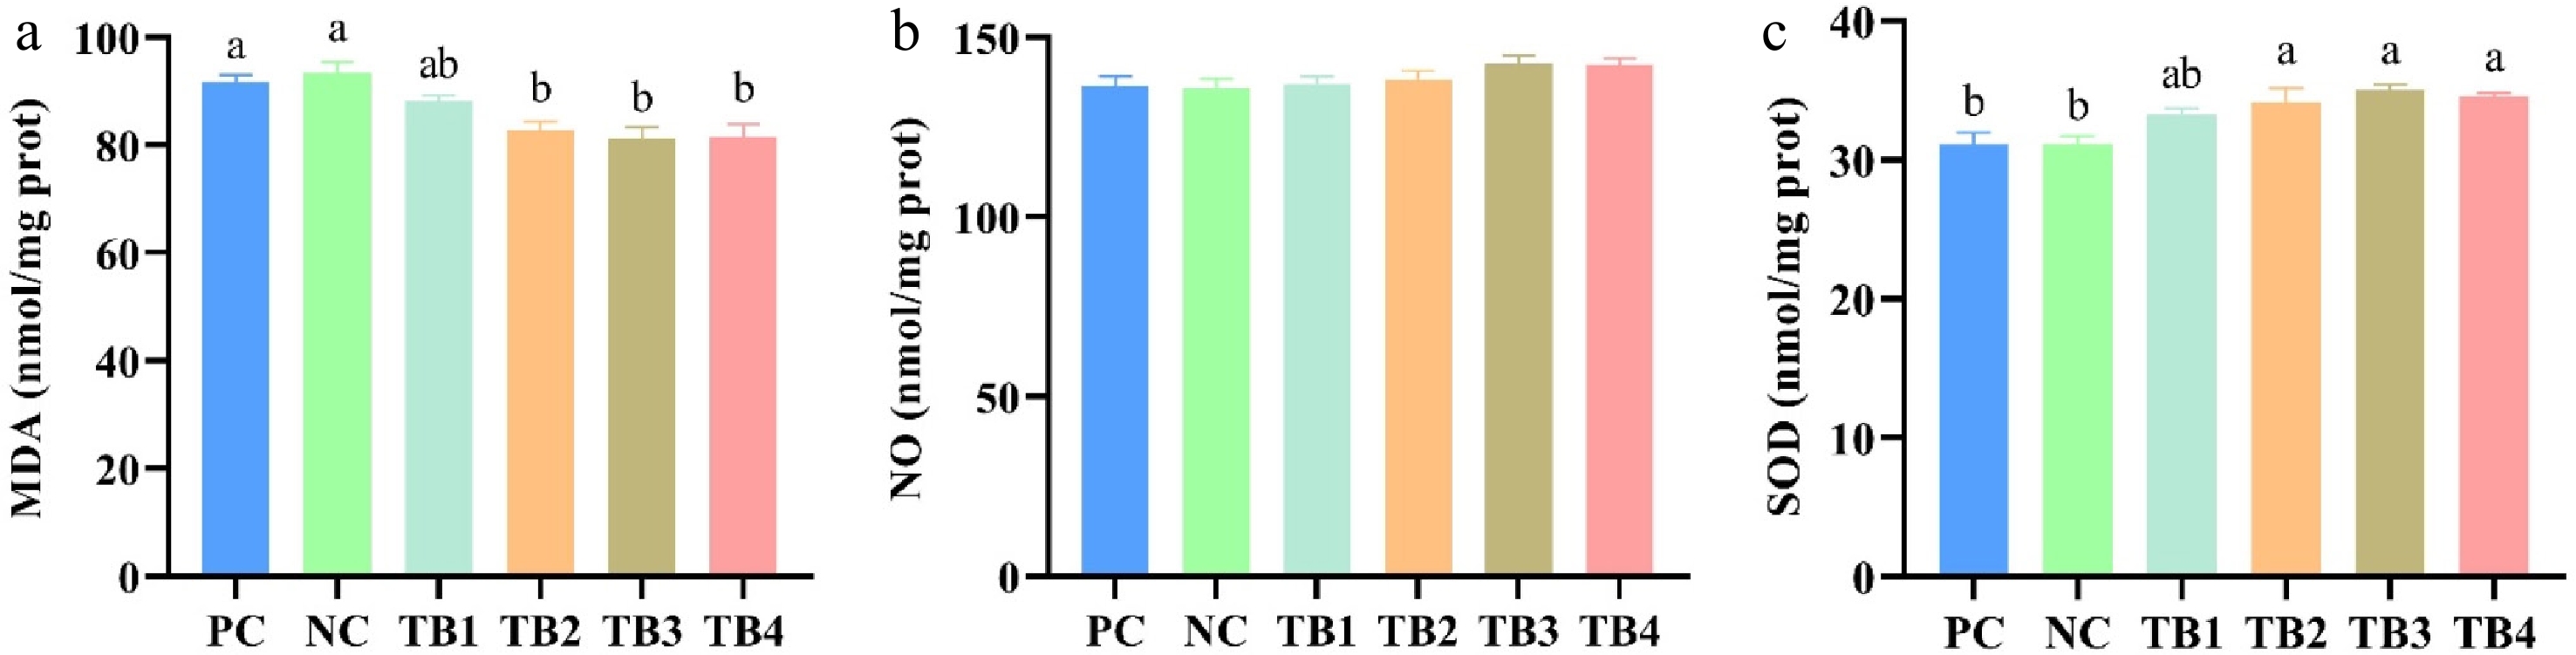
Figure 3.
The effect of substitution of fish meal and addition of different levels of tributyrin on antioxidant enzymatic capacity in hepatopancreas of M. nipponense. Note: (a) malondialdehyde (MDA); (b) superoxide dismutase (SOD); (c) nitrous oxide (NO). Values are presented as mean ± SEM (n = 9). Different letters indicate significant differences between treatments (p < 0.05).
-
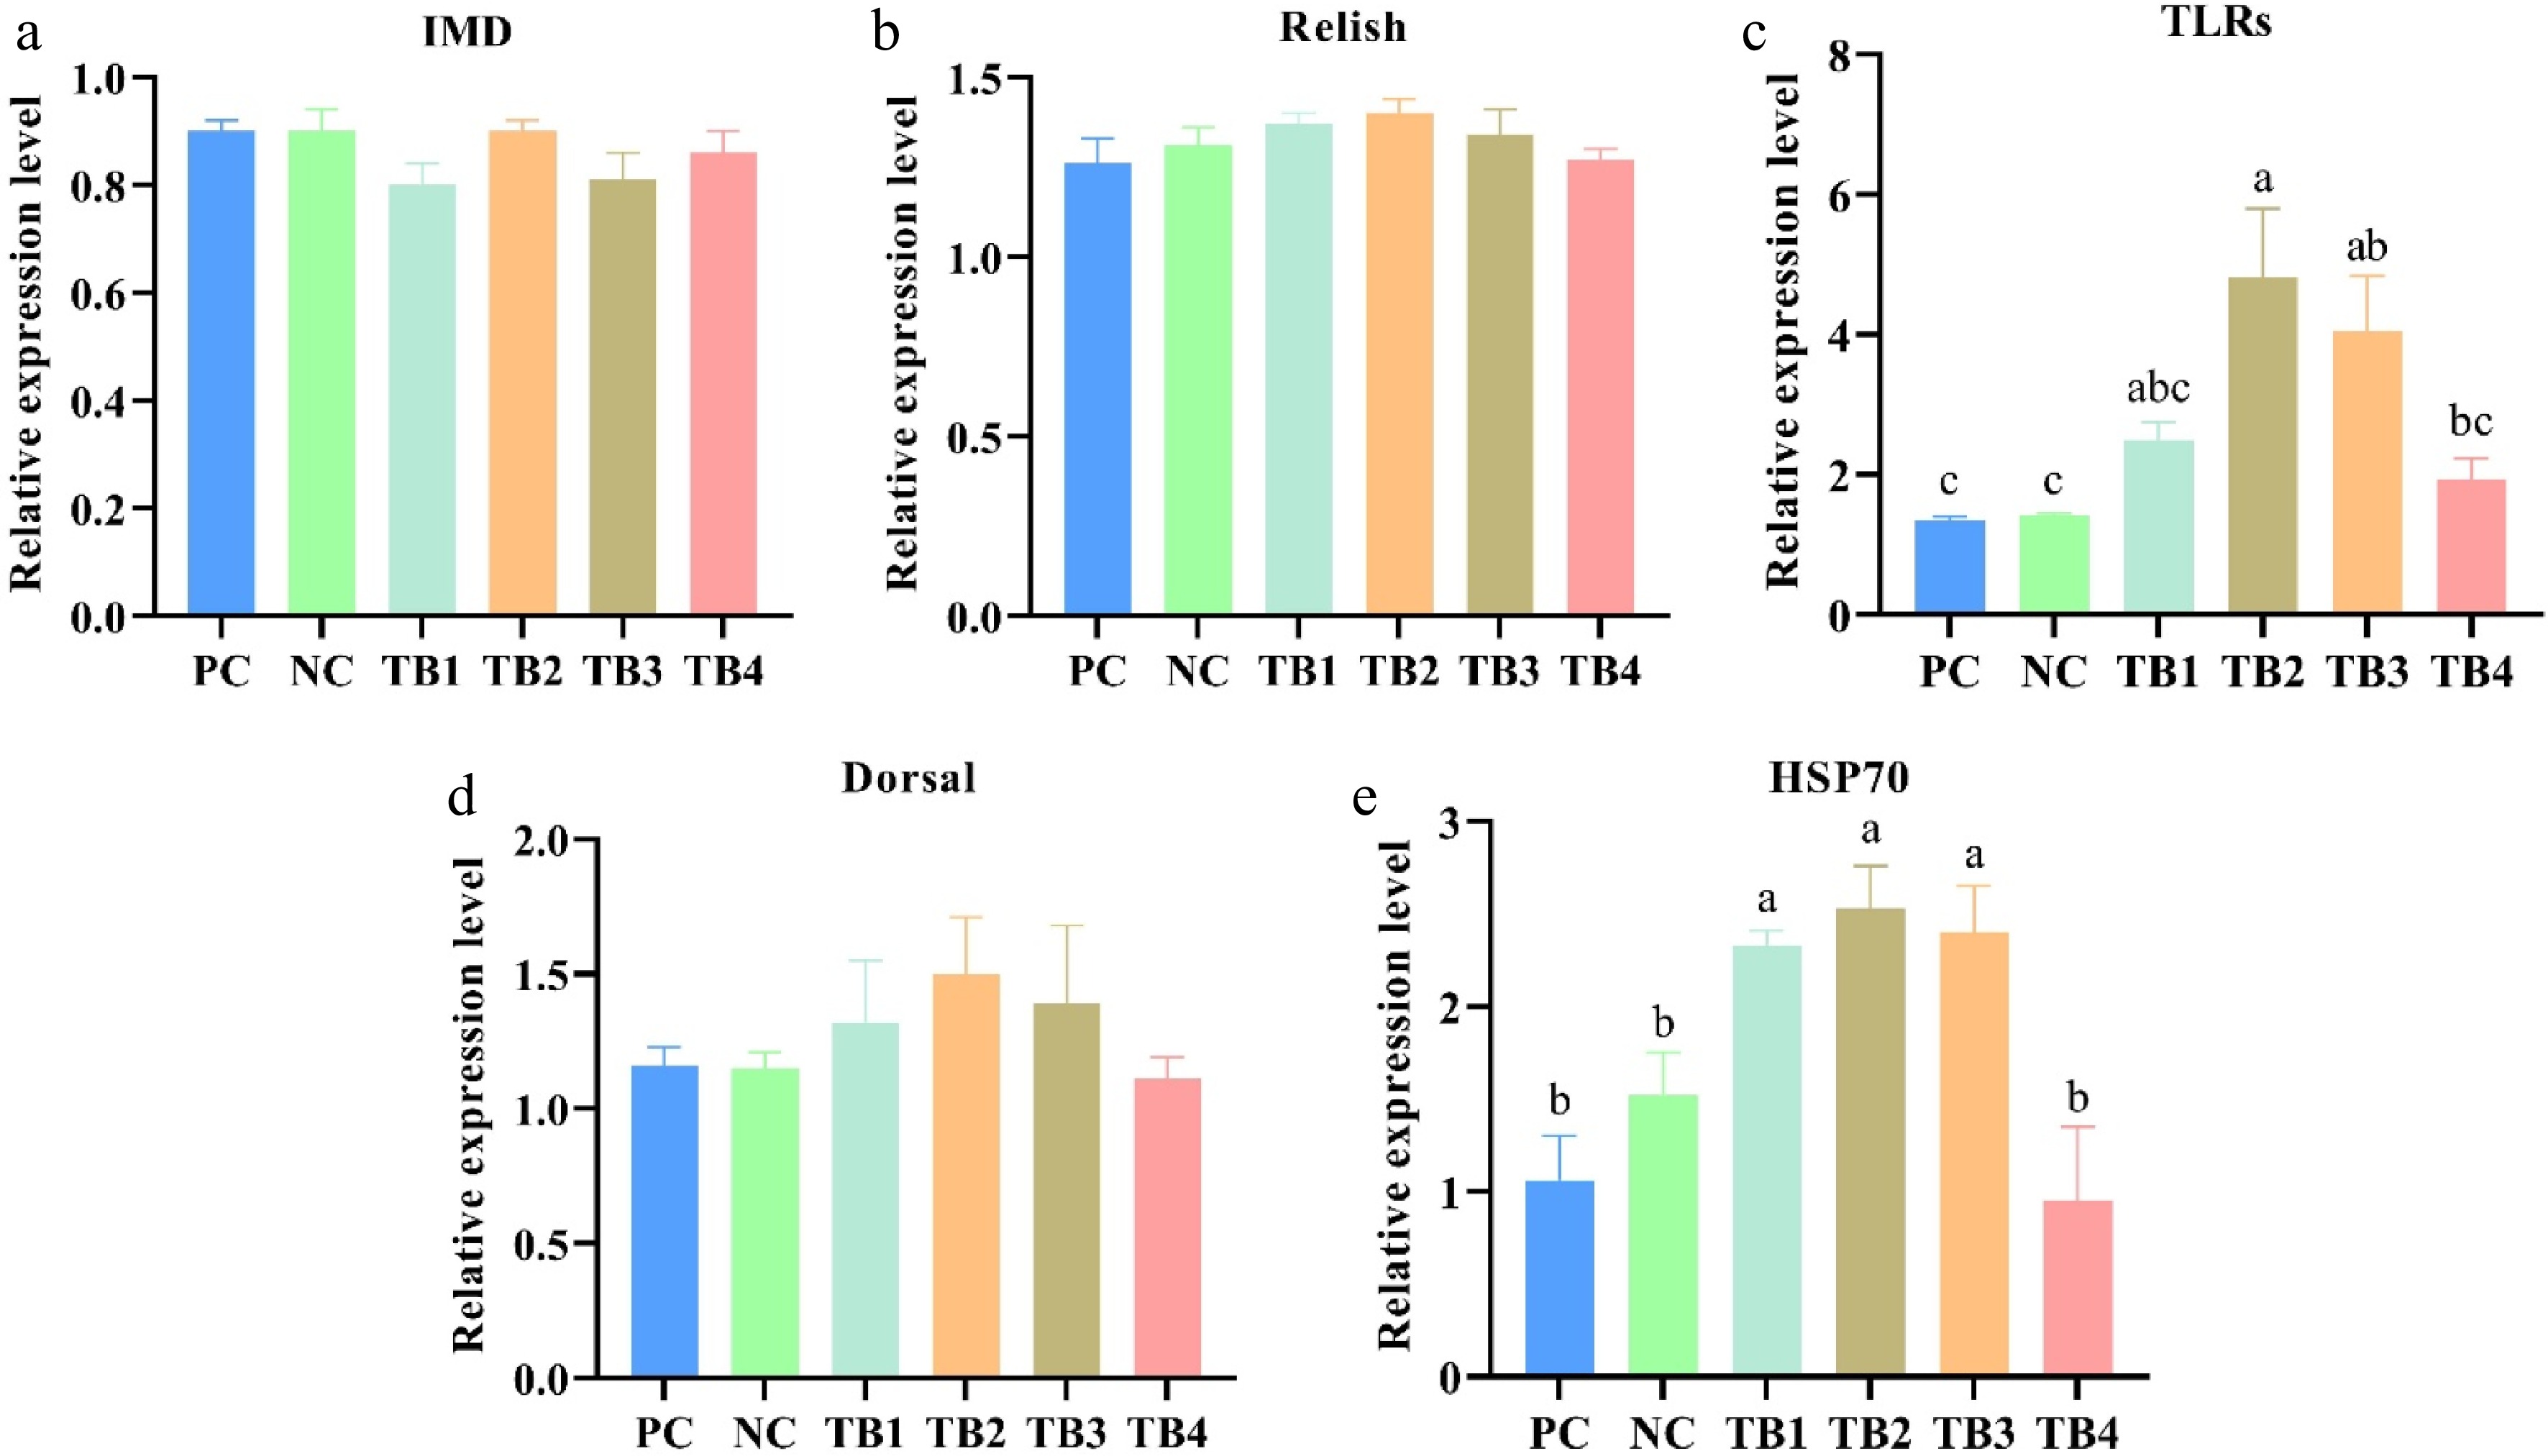
Figure 4.
The effect of substitution of fish meal and addition of different levels of tributyrin on immune related genes expression in hepatopancreas of M. nipponense. Note: (a) Immune deficiency (IMD); (b) Relish; (c) Toll-like receptors (TLRs); (d) Dorsal; (e) Heat shock protein 70 (HSP70). Values are presented as mean ± SEM (n = 9). Different letters indicate significant differences between treatments (p < 0.05).
-
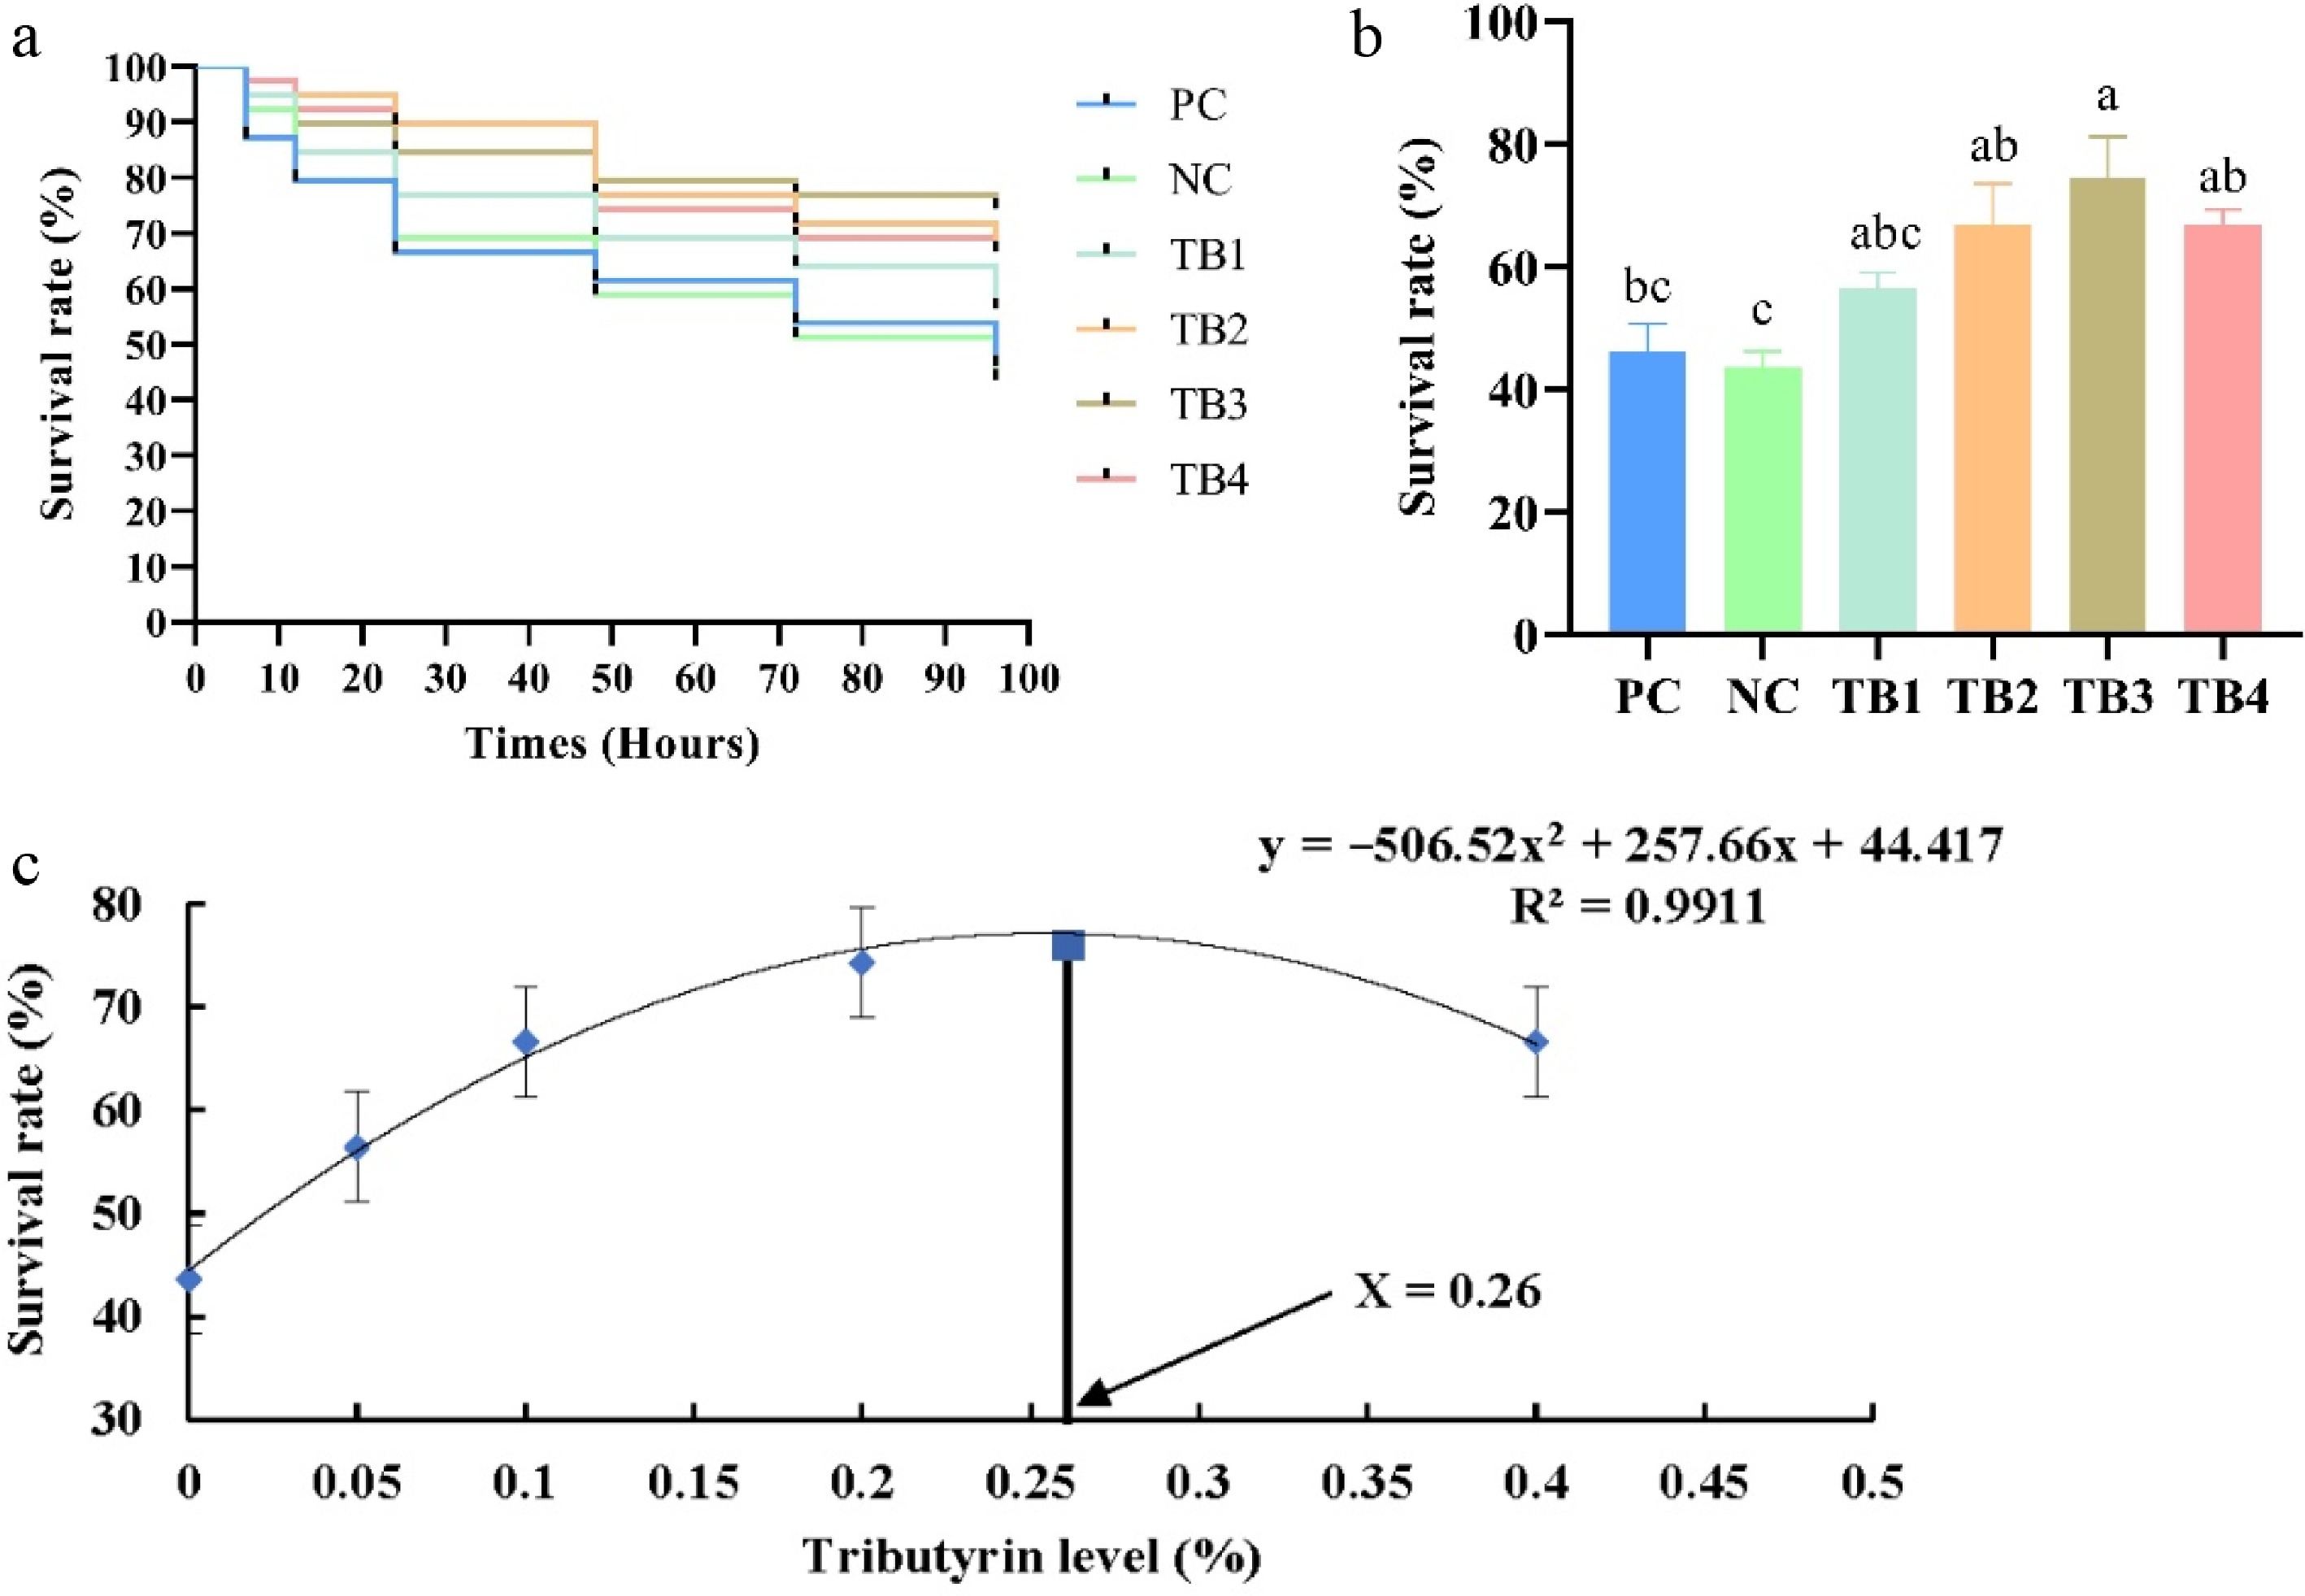
Figure 5.
Effect of dietary tributyrin on the survival rate of M. nipponense against Vibrio cholerae (2 × 10⁷ CFU/mL). Note: (a) the survival rate of M. nipponense at different time periods after injection of bacteria; (b) the survival rate of M. nipponense after 96 h of injection of bacteria; (c) the optimum level of ferulic acid supplementation based on second-order polynomial analysis on the survival rate of M. nipponense after 96 h of bacterial challenge. Values are presented as mean ± SEM (n = 39). Different letters indicate significant differences between treatments (p < 0.05).
-
Ingredients Diets PC NC TB1 TB2 TB3 TB4 FM1 30.00 25.00 25.00 25.00 25.00 25.00 SBM1 22.00 30.00 30.00 30.00 30.00 30.00 Rapeseed meal2 10.00 10.00 10.00 10.00 10.00 10.00 Shrimp meal2 6.00 6.00 6.00 6.00 6.00 6.00 Squid paste2 3.00 3.00 3.00 3.00 3.00 3.00 α-Starch 20.48 17.48 17.43 17.38 17.28 17.08 Oil (fish 1:soy 1)3 1.50 1.50 1.50 1.50 1.50 1.50 Granulesten2 1.50 1.50 1.50 1.50 1.50 1.50 Cholesterol4 1.00 1.00 1.00 1.00 1.00 1.00 Monocalcium phosphate4 0.50 0.50 0.50 0.50 0.50 0.50 Premix5 2.00 2.00 2.00 2.00 2.00 2.00 Vitamin C5 1.00 1.00 1.00 1.00 1.00 1.00 Choline chloride4 0.50 0.50 0.50 0.50 0.50 0.50 Ecdysone2 0.50 0.50 0.50 0.50 0.50 0.50 DMPT2 0.02 0.02 0.02 0.02 0.02 0.02 Tributyrin 50%6 0.05 0.10 0.20 0.40 Total 100 100 100 100 100 100 Proximate composition (dry matter basis) Crude protein 40.31 40.36 40.35 40.35 40.34 40.31 Crude lipid 8.79 8.71 8.71 8.71 8.71 8.71 Ash 11.00 10.26 10.26 10.26 10.26 10.26 Note: 1 FM (fish meal), obtained from Wuxi Tongwei feedstuffs Co., Ltd, Wuxi, China, crude protein 61.3%, crude lipid 8.3%; SBM (soybean meal) obtained from Wuxi Tongwei feedstuffs Co., Ltd, Wuxi, China, crude protein 44.7% (db), crude lipid 1.1% (db); 2 provided by Tongwei Co., Ltd (Wuxi, China);3 oil consisted of a mixture of fish oil and soybean oil with a 1:1 ratio,4 provided by Wuxi Hanove Animal Health Products Co., Ltd (Wuxi, China); 5 vitamin C and mineral premix were produced for shrimps by Wuxi Hanove Animal Health Products; 6 50% efficiency, obtained from Shanghai Menon Biotechnology Co., Ltd (Shanghai, China). Table 1.
Formulation and proximate composition of the experimental diets (% dry matter).
-
Gene Primer sequences (5′-3′) Product length (bp) Amplification efficiency Tm (°C) XXX Ref. TLRs (F) CGACCTCCACGACAACAAGA 186 97.23% 59.97 MH178390 (Gu et al.,[24] 2017) (R) AAAGTTCCTGCACCAATGCG 59.69 Dorsal (F) TACGACCAACGGACAAGAGC 116 93.37% 60.04 OM066734 (Song et al.,[25] 2020) (R) CGCATTGTTGCTGTTTCCCA 59.97 IMD (F) GGCACCAAGCCTTCTTTTCAG 164 126.81% 60.00 (Li et al.,[26] 2018) (R) ATATCCTTCGGGTCGCATTTC 58.23 Relish (F) CGGGAAGTTTGGACGGCATA 198 100.26% 60.39 MZ466551 (Song et al.,[25] 2020) (R) TCGTTTAAGGCTGTCTGGCA 59.61 HSP70 (F) CTTTGAGGTGGCTGGATGGAA 112 100.54% 60.27 KC460343 (Song et al.,[25] 2020) (R) GCAGTTCCGTGAATTTTGGCA 60.27 β-actin (F) GTGCCCATCTACGAGGGTTA 247 110.27% 58.88 MH540111 (Luo et al.,[27] 2018) (R) CGTCAGGGAGCTCGTAAGAC 59.90 Note: the mRNA sequences for each gene were obtained from M. nipponense hepatopancreas transcriptome sequencing database of the Aquatic Disease and Nutrition Laboratory of Freshwater Fisheries Research Center, Chinese Academy of Fishery Sciences. Primers for RT-PCR were designed using Primer 5.0. Table 2.
Real-time PCR primers.
-
Parameters Diets PC NC TB1 TB2 TB3 TB4 IBW (g) 0.39 ± 0.00 0.38 ± 0.00 0.38 ± 0.00 0.38 ± 0.00 0.38 ± 0.00 0.38 ± 0.00 FBW (g) 0.69 ± 0.02 0.67 ± 0.02 0.67 ± 0.02 0.68 ± 0.02 0.68 ± 0.01 0.68 ± 0.01 WGR (%) 79.71 ± 3.05 74.04 ± 3.70 75.93 ± 6.77 76.17 ± 3.95 77.61 ± 2.36 76.57 ± 3.44 SGR (%/day) 1.15 ± 0.03 1.09 ± 0.04 1.11 ± 0.07 1.11 ± 0.04 1.13 ± 0.03 1.11 ± 0.04 SR (%) 86.00 ± 1.15 89.33 ± 3.53 92.00 ± 3.06 88.00 ± 4.00 90.67 ± 0.67 87.33 ± 4.37 FCR 2.52 ± 0.13 2.70 ± 0.20 2.55 ± 0.16 2.54 ± 0.17 2.34 ± 0.12 2.68 ± 0.27 FI (g) 2.44 ± 0.02 2.44 ± 0.09 2.60 ± 0.03 2.67 ± 0.09 2.78 ± 0.14 2.77 ± 0.19 PER 0.92 ± 0.05 0.87 ± 0.07 0.92 ± 0.06 0.91 ± 0.06 1.00 ± 0.05 0.88 ± 0.10 CF (g/cm3) 1.18 ± 0.01 1.18 ± 0.02 1.16 ± 0.00 1.15 ± 0.01 1.13 ± 0.05 1.13 ± 0.02 Note: values are presented as mean ± SEM (n = 3). Different letters indicate significant differences between treatments (p < 0.05). IBW: initial body weight; FBW: final body weight; WGR: weight gain rate; SGR: specific growth rate; SR: survival rate; FCR: feed conversion ratio; FI: feed intake; PER: protein efficiency ratio; CF: condition factor. Table 3.
Growth performance and feed utilization of M. nipponense fed with diets of partially replaced fishmeal and supplemented with different levels of tributyrin.
Figures
(5)
Tables
(3)