-
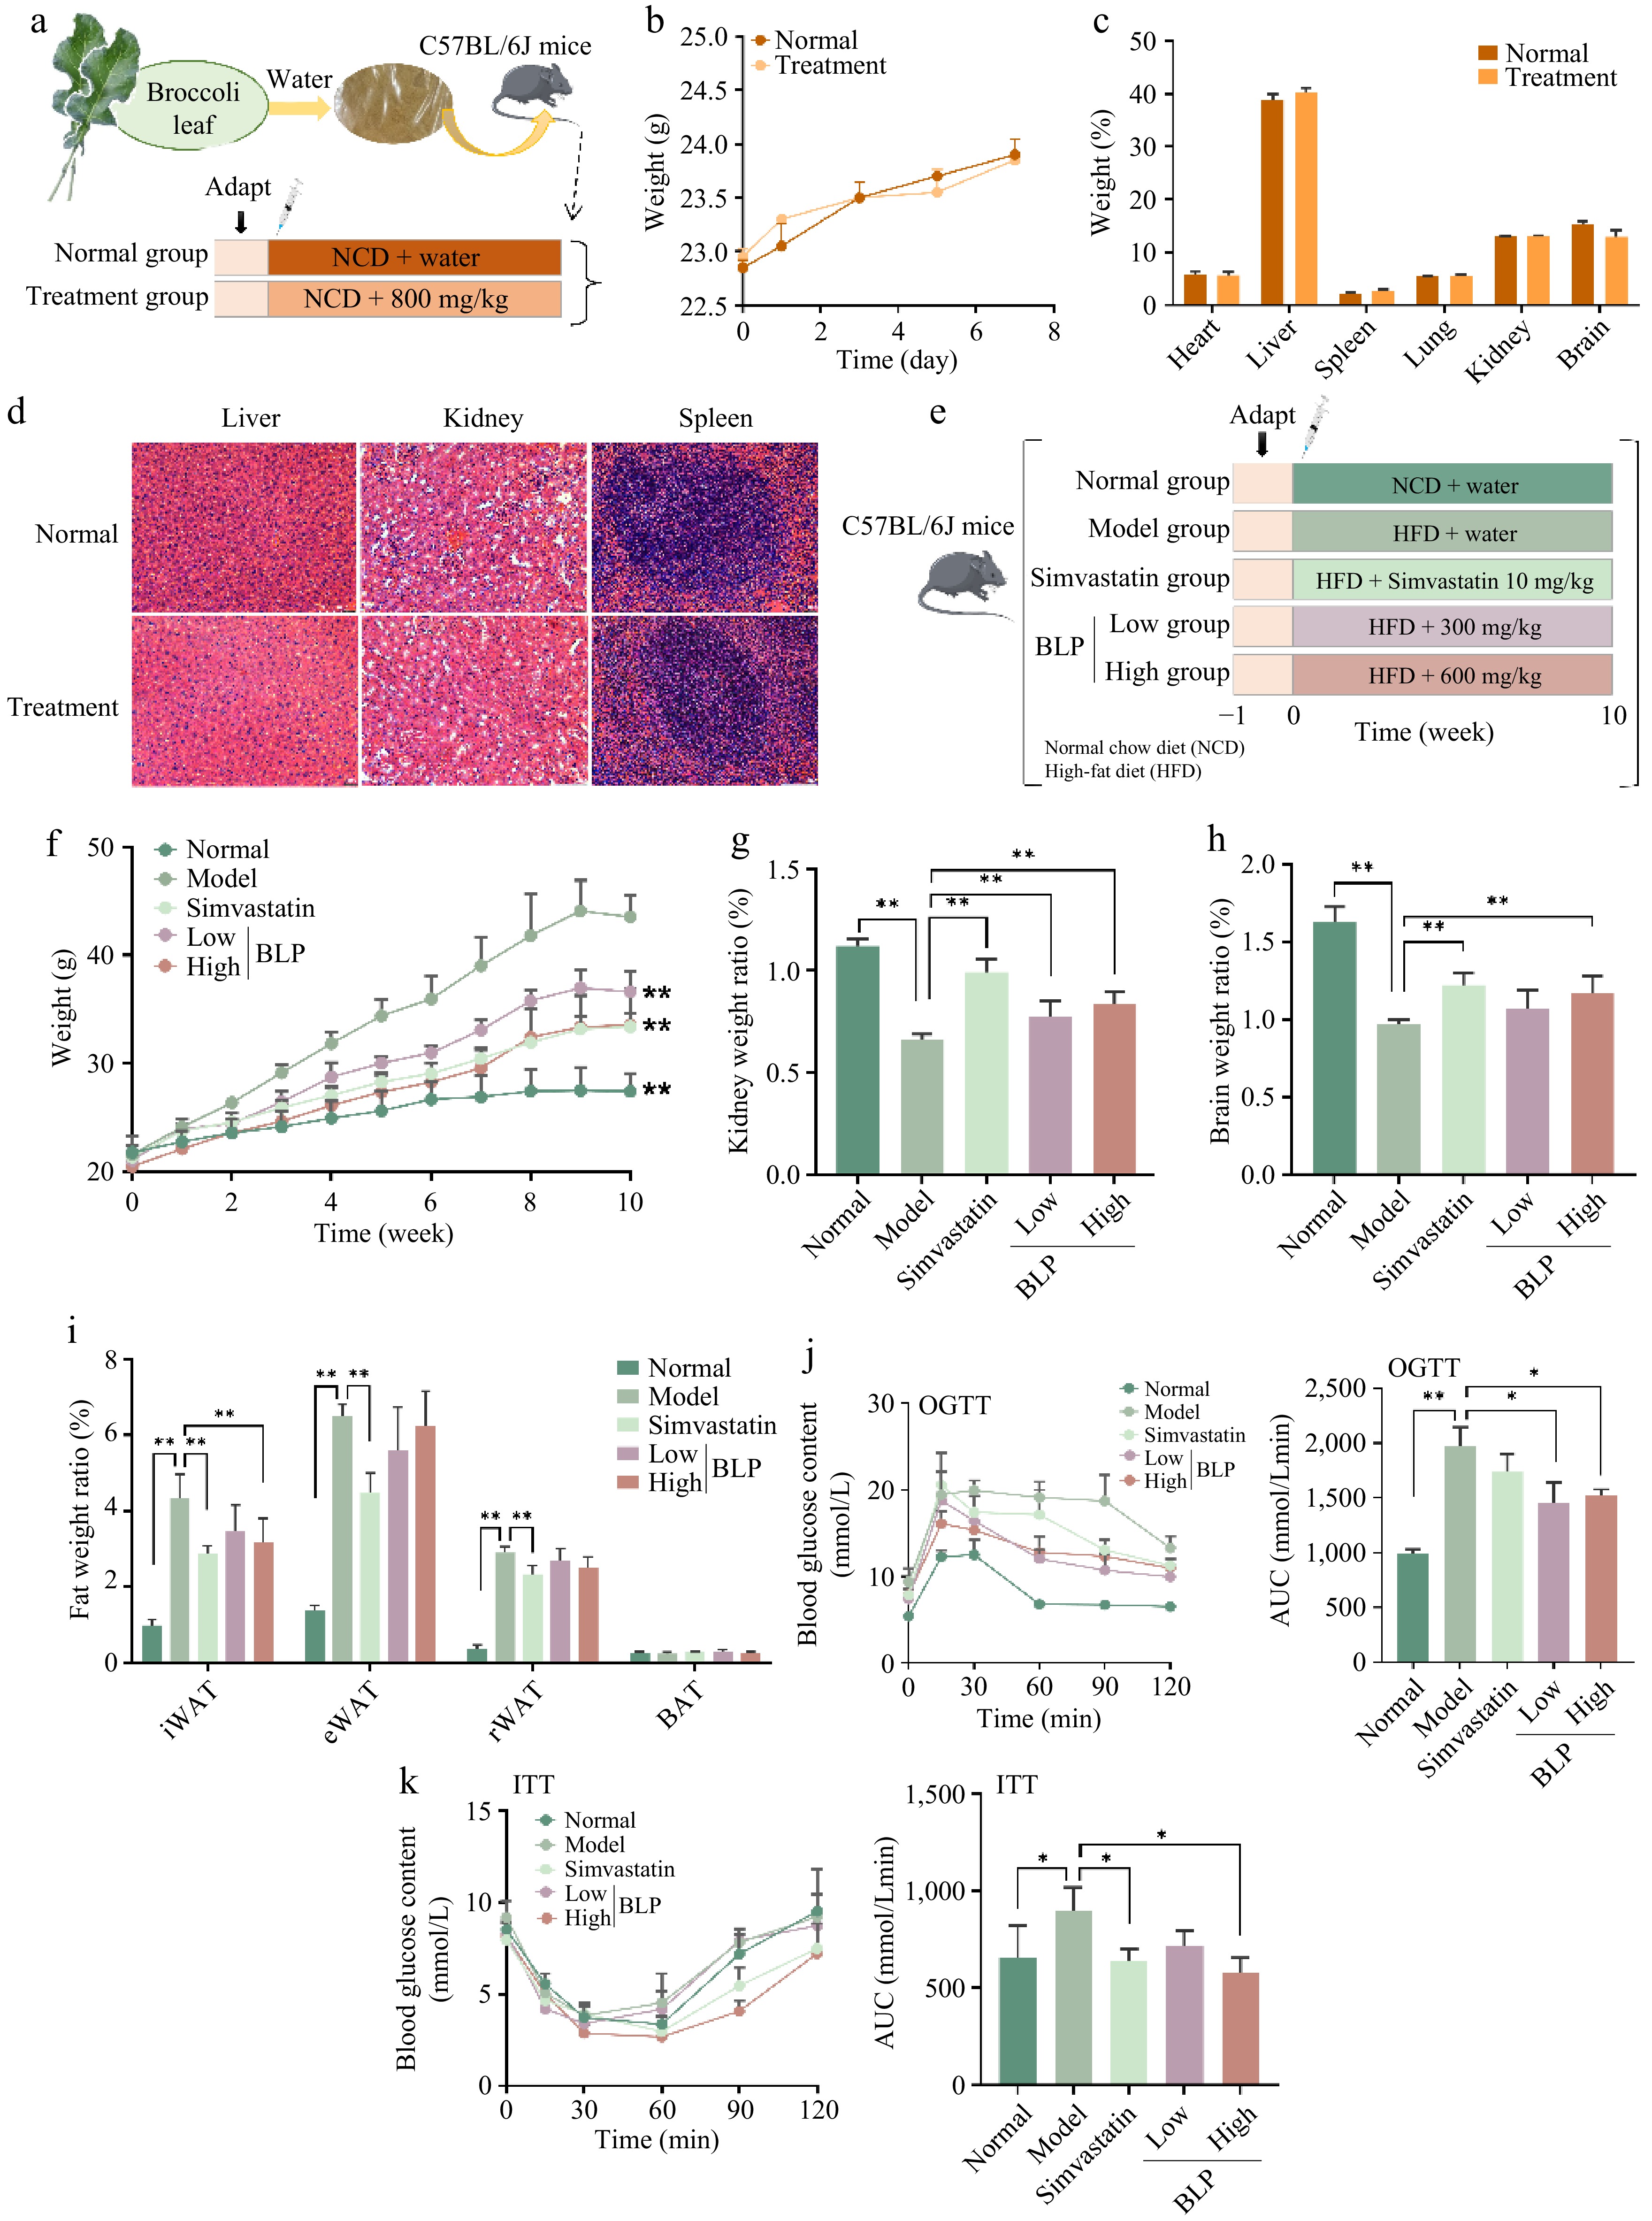
Figure 1.
Experimental design, safety assessment, and preventive effects of BLP in mice. (a) Schematic illustration of the experimental design for safety assessment. (b) Change in body weight. (c) Organ weight percentages. (d) H&E staining of liver, kidney, and spleen tissues, and the scale bar in the lower right corner is 100 μm. (e) Schematic of the experimental design for preventive experiments. (f) Body weight changes over ten weeks, and ** indicates a significant difference (p < 0.01) compared with all groups and the model group in the 10th week. (g) Kidney weight ratio. (h) Brain weight ratio. (i) Fat weight ratios of iWAT, eWAT, rWAT, and BAT. (j) OGTT results and area under the curve (AUC). (k) ITT results and AUC. Body weight changes, OGTT, and ITT data were analyzed using two-way repeated-measures ANOVA, considering both treatment groups and time points as variables, followed by appropriate multiple comparisons. *p < 0.05, **p < 0.01. iWAT, inguinal white adipose tissue; eWAT, epididymal white adipose tissue; rWAT, retroperitoneal white adipose tissue; BAT, brown adipose tissue. OGTT, oral glucose tolerance test; ITT, insulin tolerance test.
-
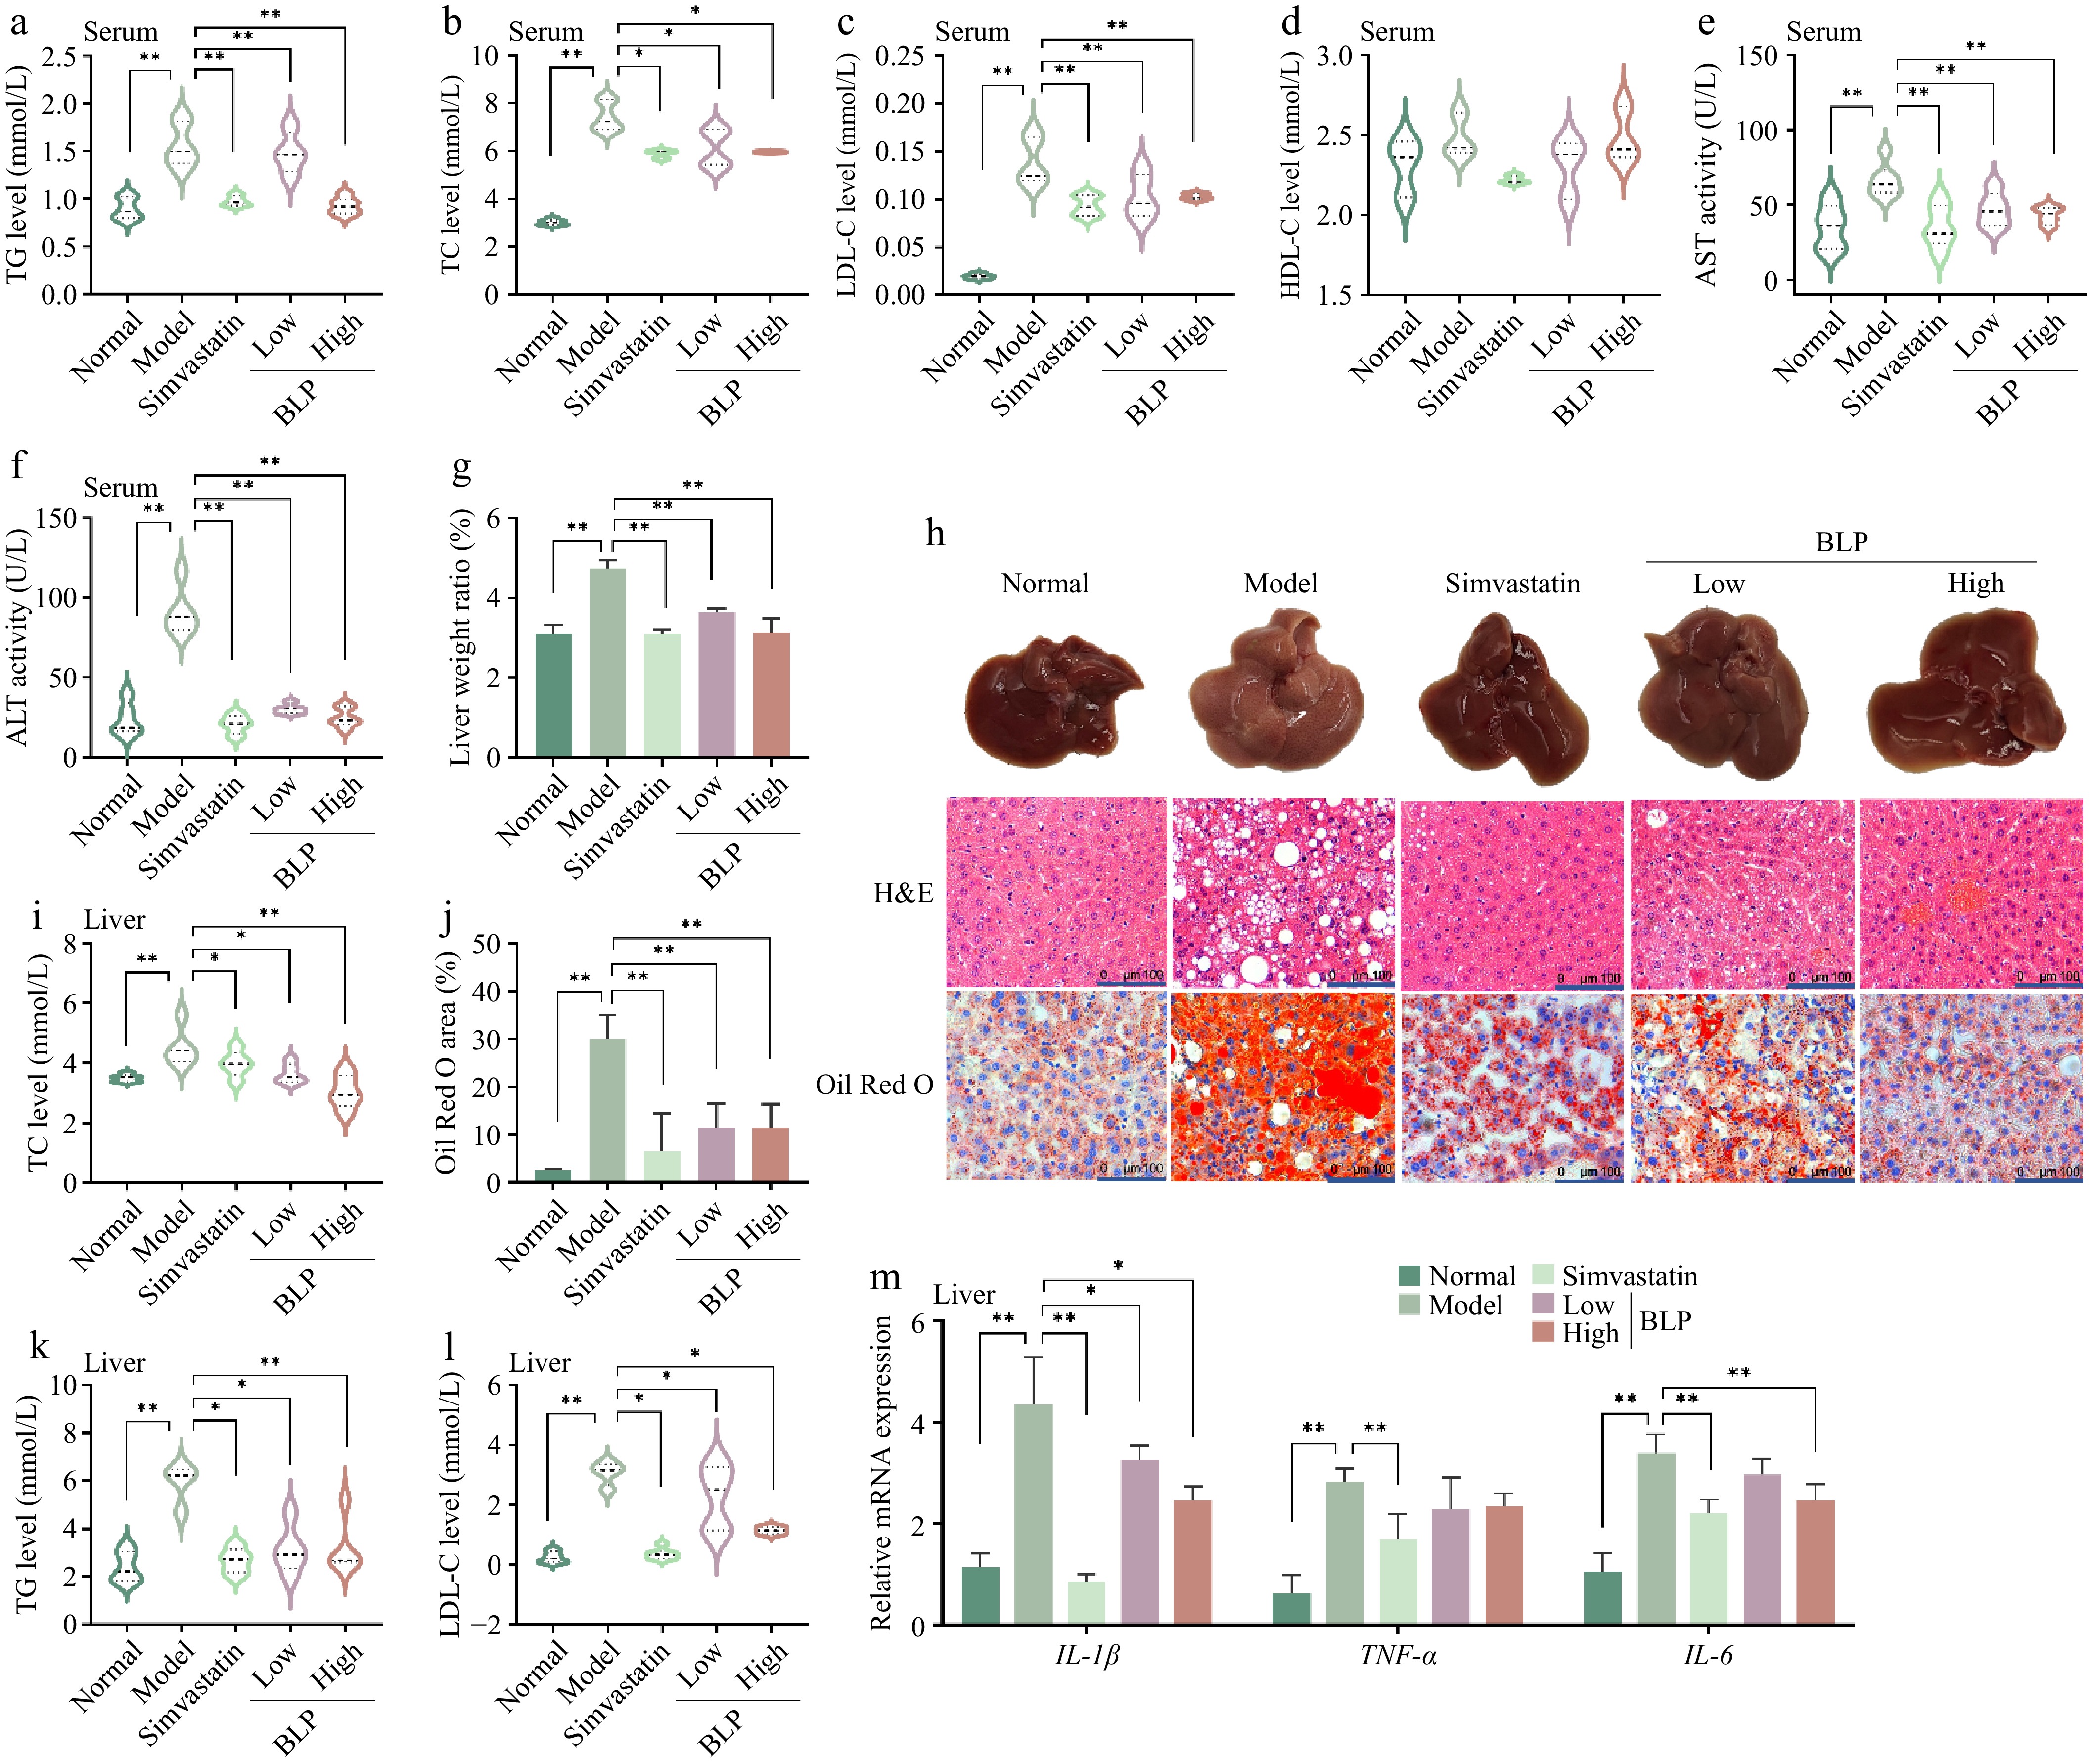
Figure 2.
BLP regulates serum and hepatic lipid profiles and reduces liver inflammation in HFD - induced NAFLD mice. Serum levels of (a) TG, (b) TC, (c) LDL-C, and (d) HDL-C. (e), (f) Serum AST and ALT activities. (g) Liver weight ratio. (h) Representative images of livers and H&E/Oil red O staining. The scale bar at the lower right corner is 100 μm. (i) Quantitative results of Oil Red O staining. Hepatic (j) TG, (k) TC, and (l) LDL-C levels. (m) Relative mRNA expression of pro-inflammatory cytokines (IL-1β, TNF-α, IL-6 genes) in the liver. Data are presented as mean ± SD or median with interquartile range (n = 6). Statistical significance was determined by one-way ANOVA followed by Tukey's multiple comparisons test. * p < 0.05, ** p < 0.01. TG, triglyceride; TC, total cholesterol; LDL-C, low-density lipoprotein cholesterol; IL-1β, interleukin-1 beta; TNF-α, tumor necrosis factor alpha; IL-6, interleukin-6.
-
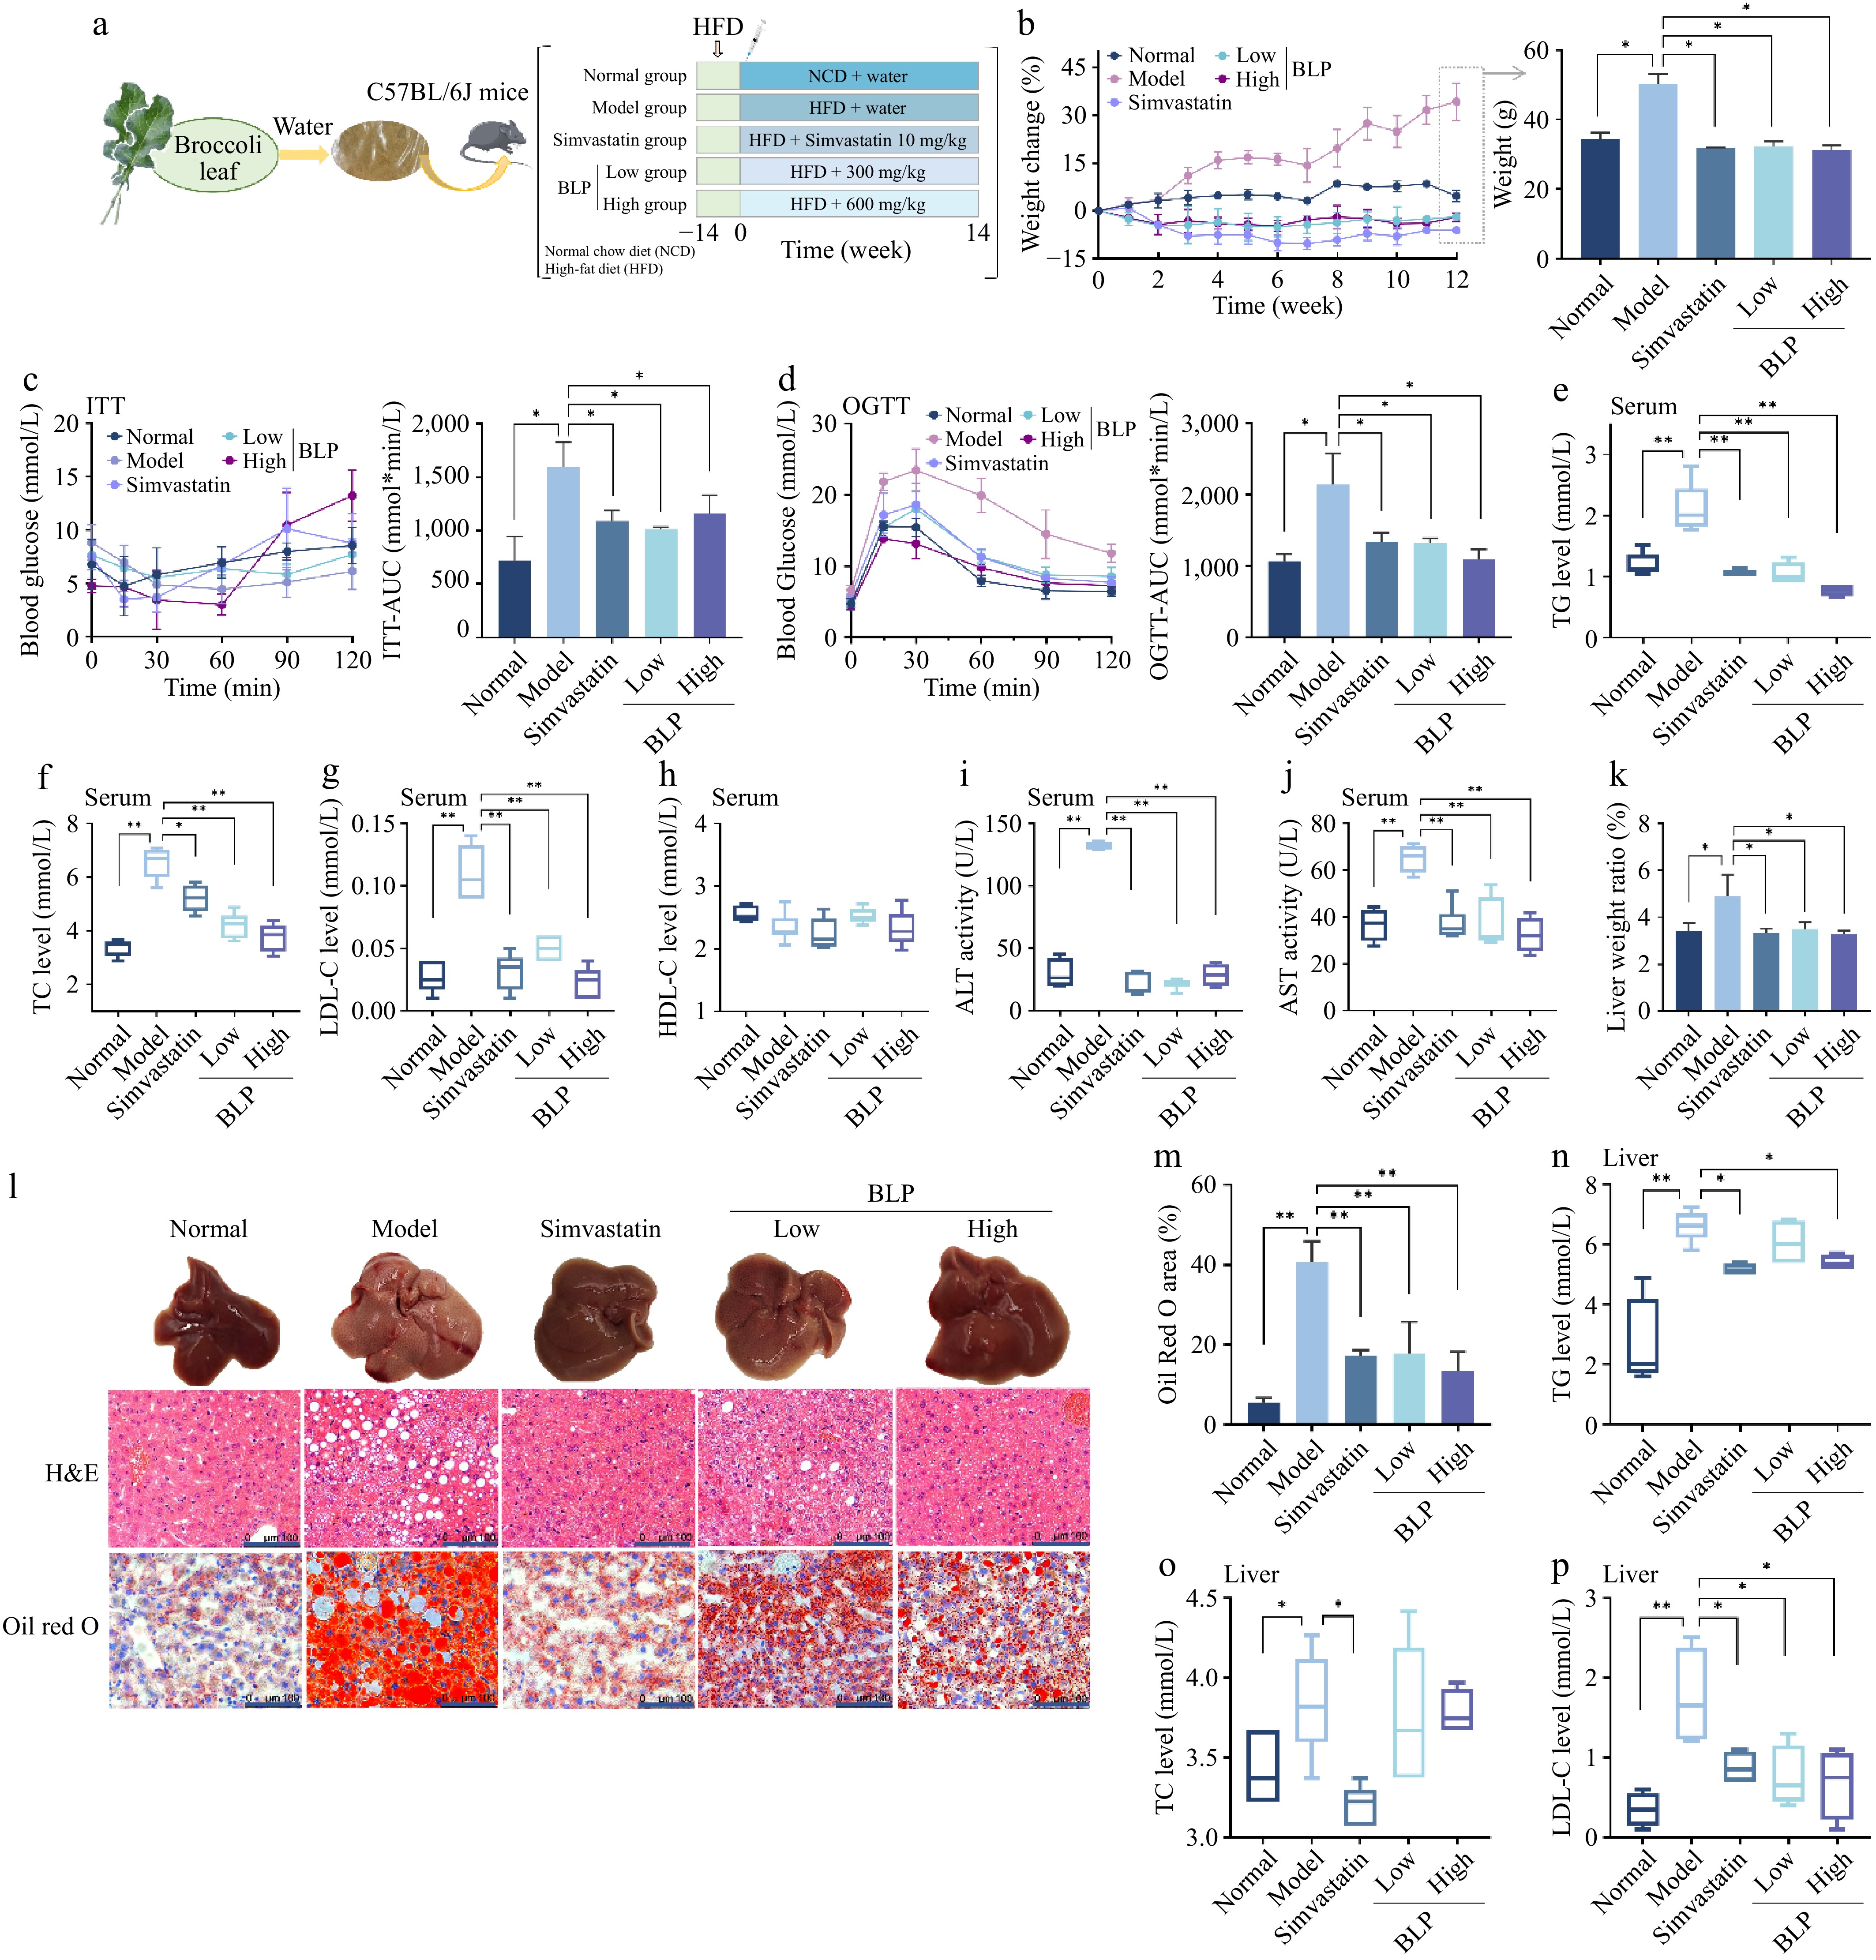
Figure 3.
Therapeutic effects of BLP on body weight, glucose metabolism, and therapeutic regulation in HFD-induced NAFLD mice. (a) Schematic of the therapeutic experimental design. (b) Percentage change in body weight over 14 weeks. (c) ITT and AUC results. (d) OGTT and AUC results. Serum (e) TG, (f) TC, (g) LDL-C, and (h) HDL-C levels. (i), (j) Serum ALT and AST activities. (k) Liver weight ratio. (l) Representative liver images and H&E/oil red O staining, and the scale bar in the lower right corner is 100 μm. (m) Quantitative results of Oil Red O staining. Hepatic (n) TG, (o) TC, and (p) LDL-C levels. Data are presented as mean ± SD or median with interquartile range (n = 6). Statistical significance was determined by one-way ANOVA followed by Tukey's multiple comparisons test. * p < 0.05, ** p < 0.01.
-
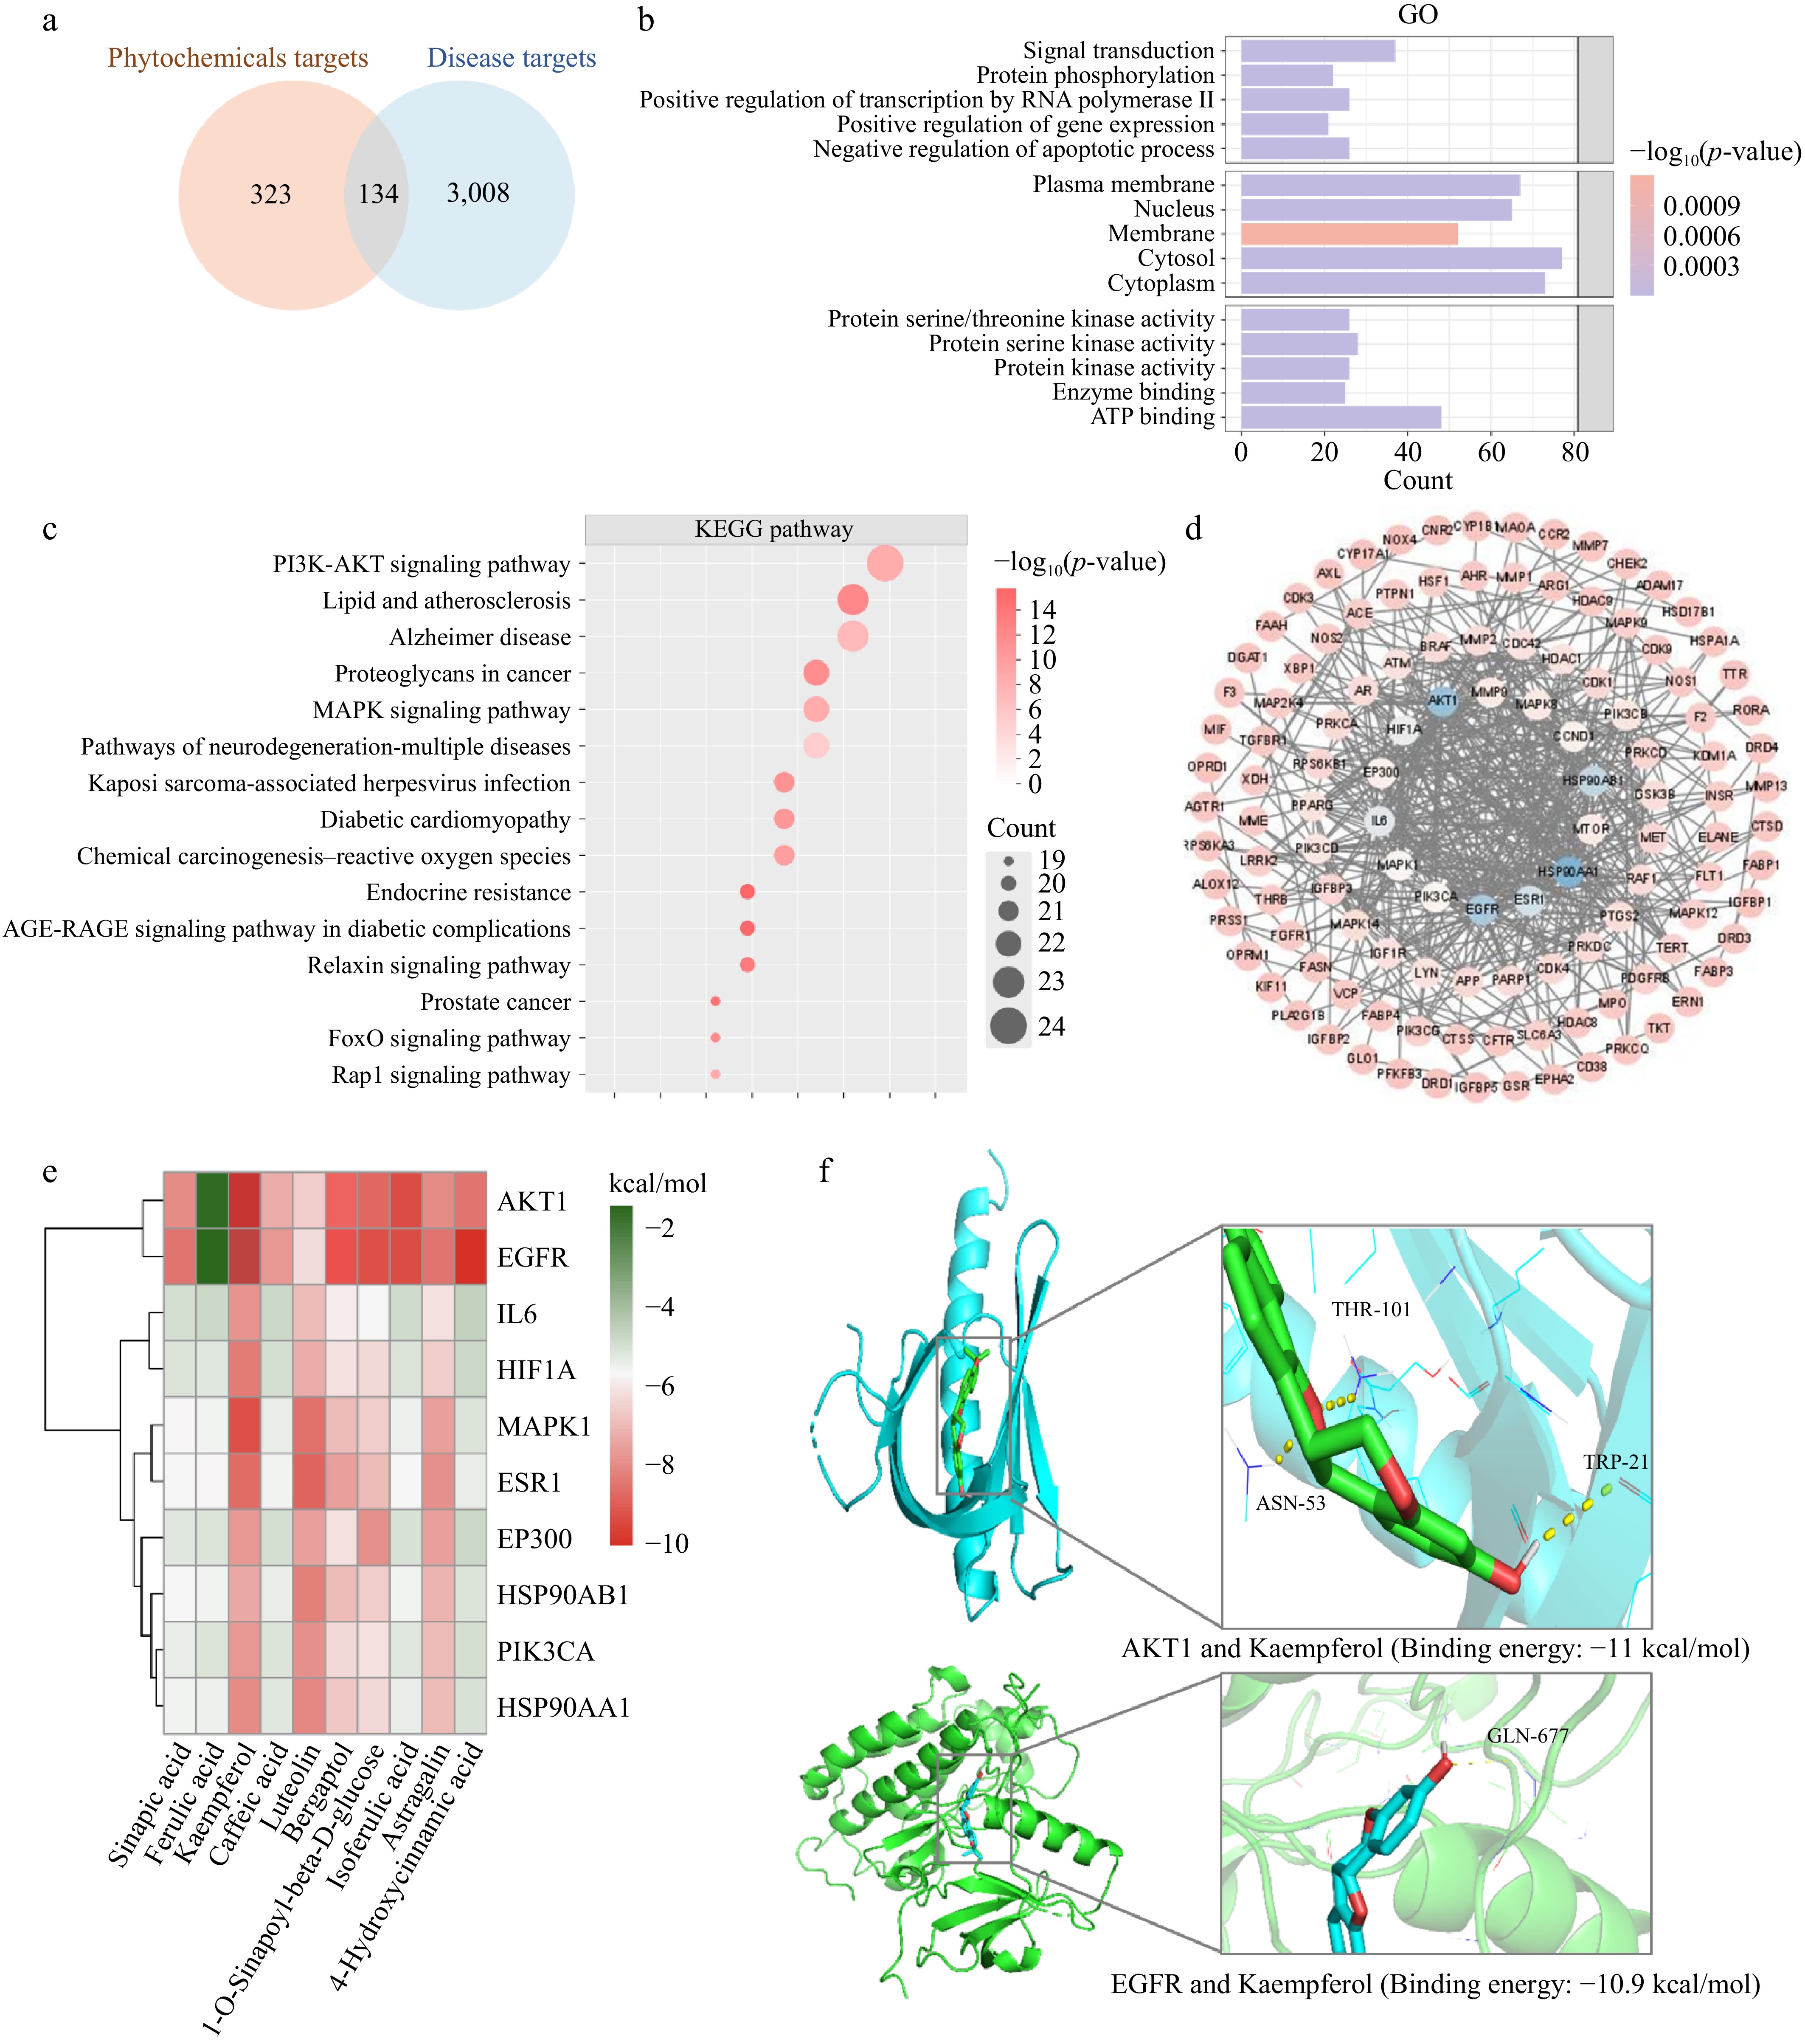
Figure 4.
Integrated bioinformatic and molecular docking analyses reveal key targets of BLP in NAFLD. (a) Venn diagram showing overlapping targets between BLP phytochemicals and NAFLD-associated genes. (b) GO enrichment analysis highlighting biological processes (signal transduction, protein phosphorylation), cellular components (plasma membrane, nucleus), and molecular functions (protein kinase activity, enzyme binding). (c) KEGG pathway analysis showing significant enrichment in PI3K-AKT signaling, lipid metabolism, and other NAFLD-related pathways. (d) PPI network of core targets, illustrating key molecular interactions. (e) Heatmap of binding energies between BLP phytochemicals and potential NAFLD targets. (f) Molecular docking predicted potential interactions between kaempferol and AKT1/EGFR.
-
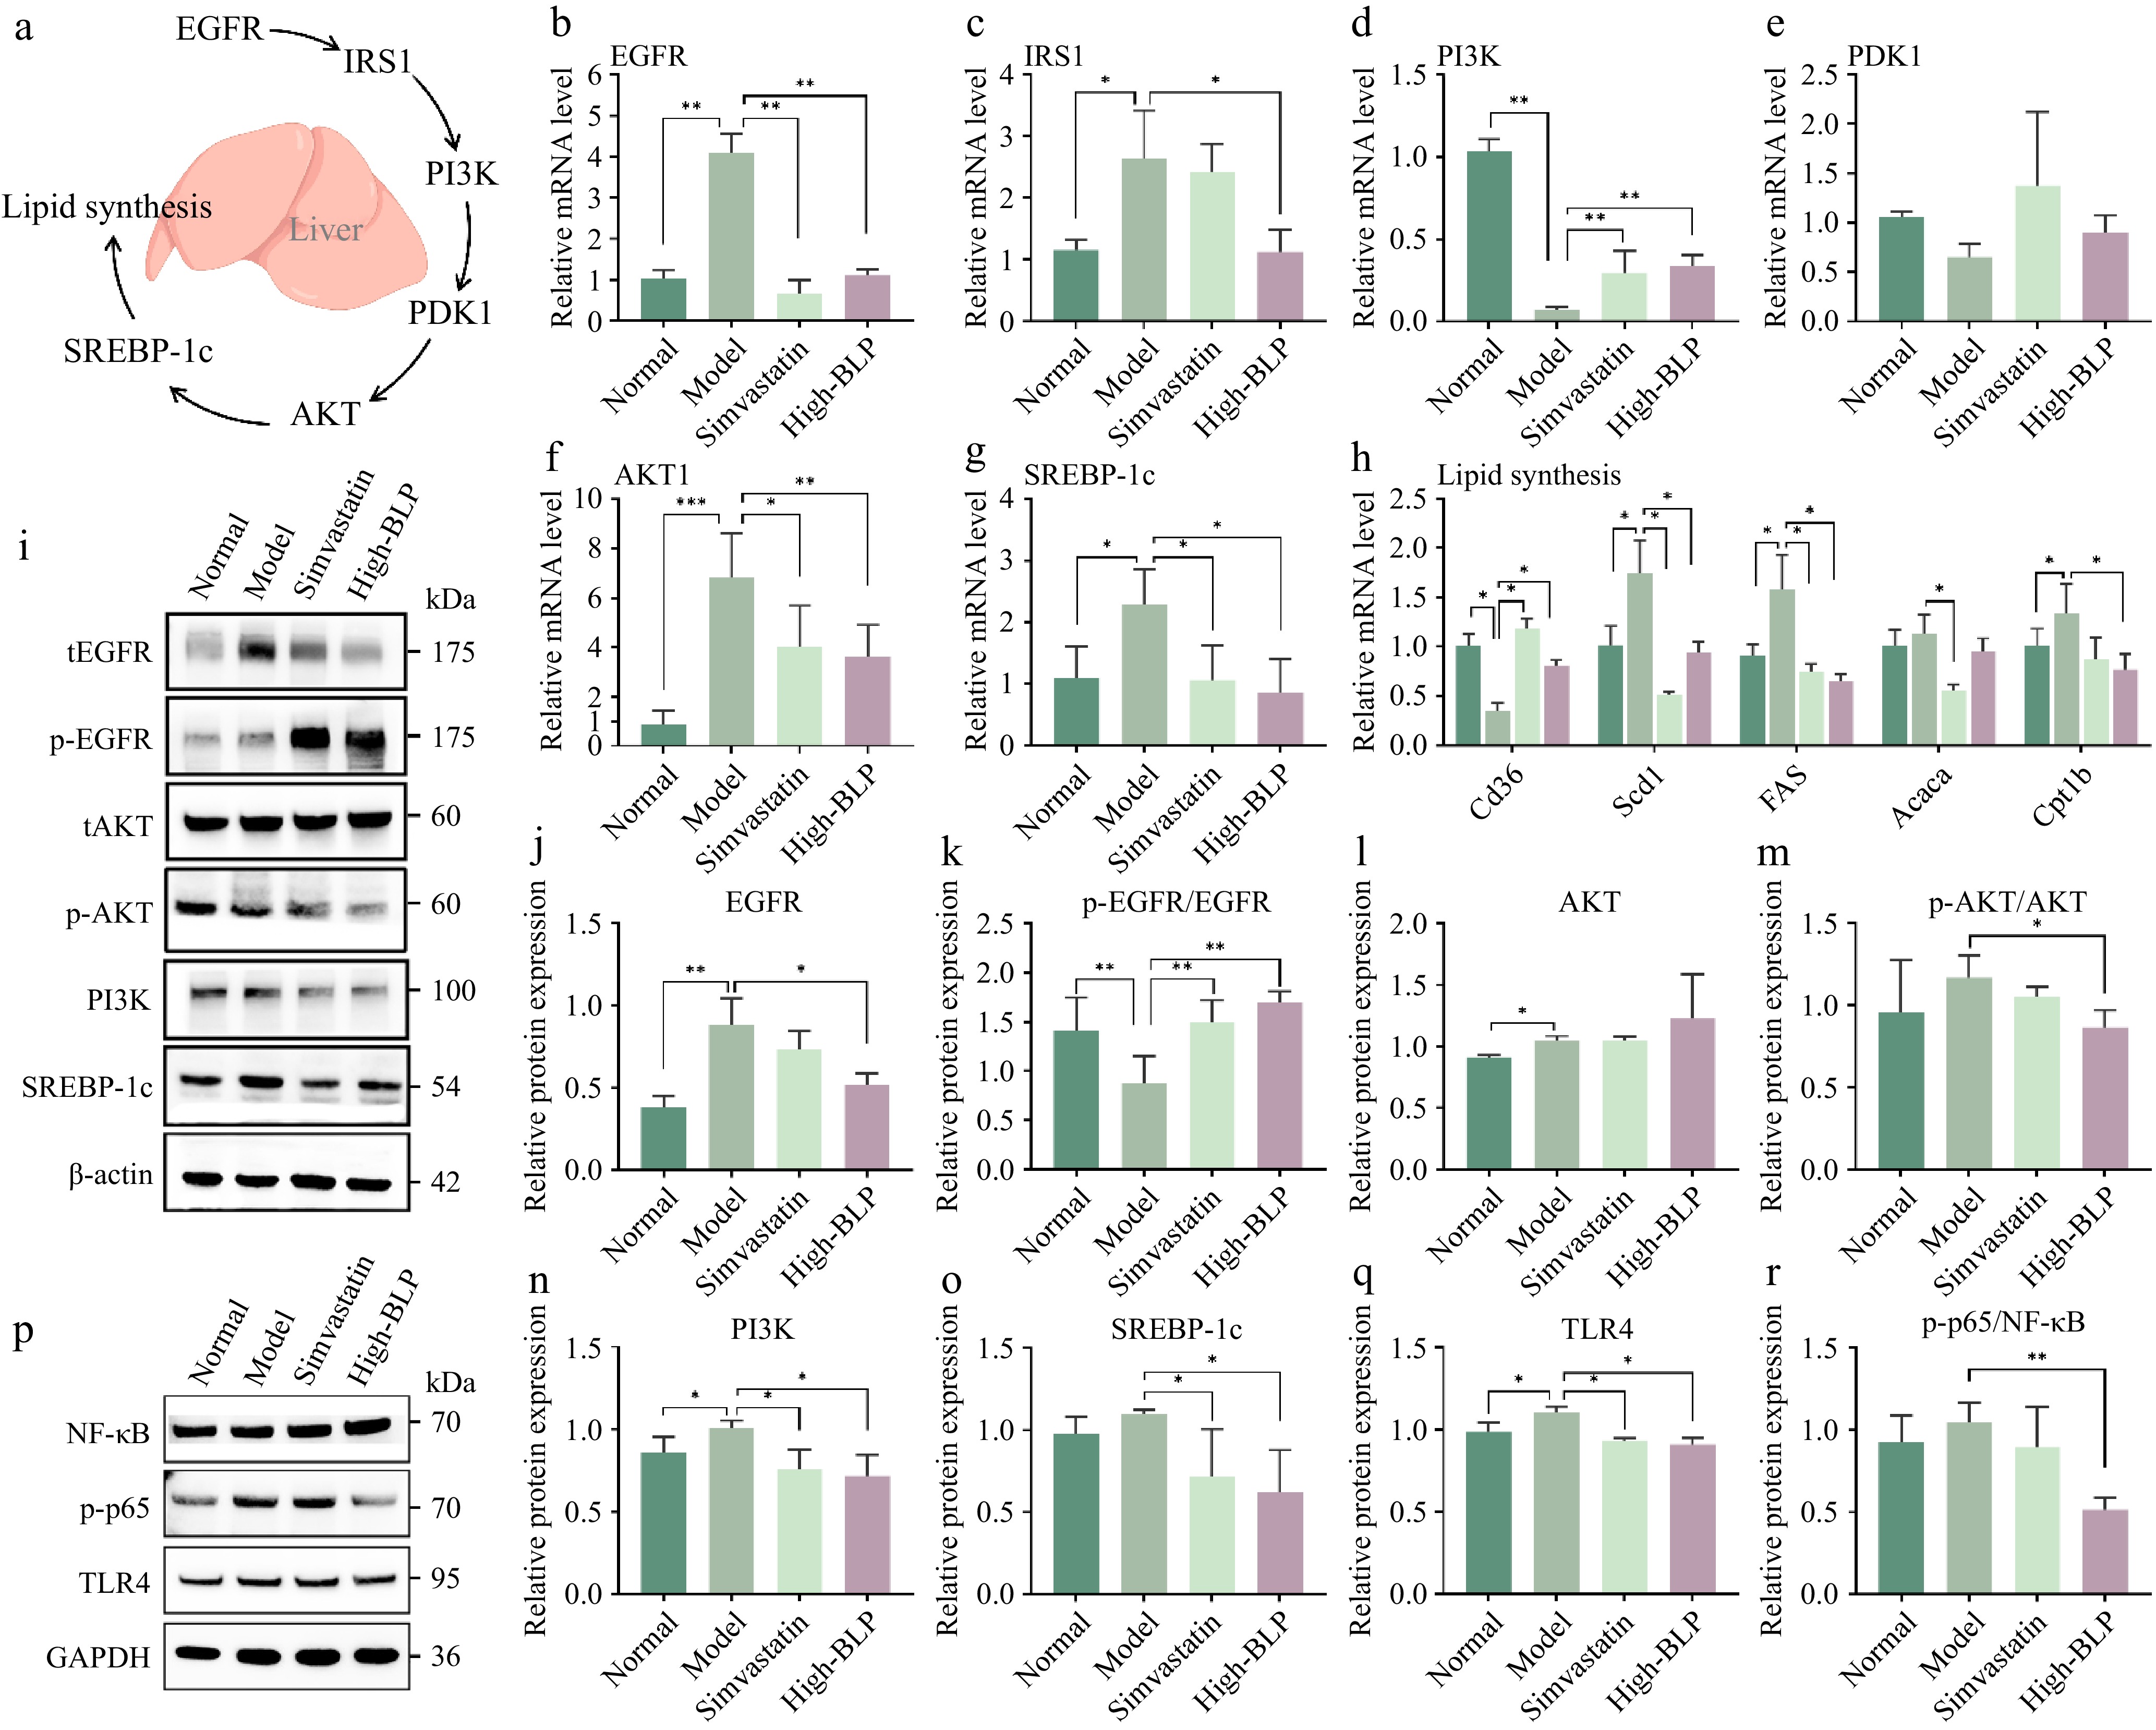
Figure 5.
(a) Schematic diagram of the EGFR/PI3K/AKT/SREBP-1c signaling axis regulating hepatic lipid synthesis. Relative mRNA levels of (b) EGFR, (c) IRSI, (d) PI3K, (e) PDK1, (f) AKT1, and (g) SREBP-1c in mice liver tissues. (h) Relative mRNA levels of lipogenic genes in liver tissues. (i) Representative Western blot bands of tEGFR, p-EGFR, tAKT, p-AKT, PI3K, SREBP-1c, and GAPDH. tEGFR, total EGFR; p-EGFR, Phosphorylated EGFR; tAKT, total AKT; p-AKT, Phosphorylated AKT; Relative protein expression (or phosphorylation ratio) of (j) EGFR, (k) p-EGFR/EGFR, (l) AKT, (m) p-AKT/AKT, (n) PI3K, and (o) SREBP-1c in liver tissues. Western blot bands of (p) NF-κB, p-p65, and TLR4 in liver tissues and (q) quantitative analysis of p-p65/NF-κB and (r) TLR4 in liver tissues. Data are presented as mean ± SD (n = 6 per group). Statistical significance was determined by one-way ANOVA followed by Tukey's multiple comparisons test. * p < 0.05, ** p < 0.01.
-
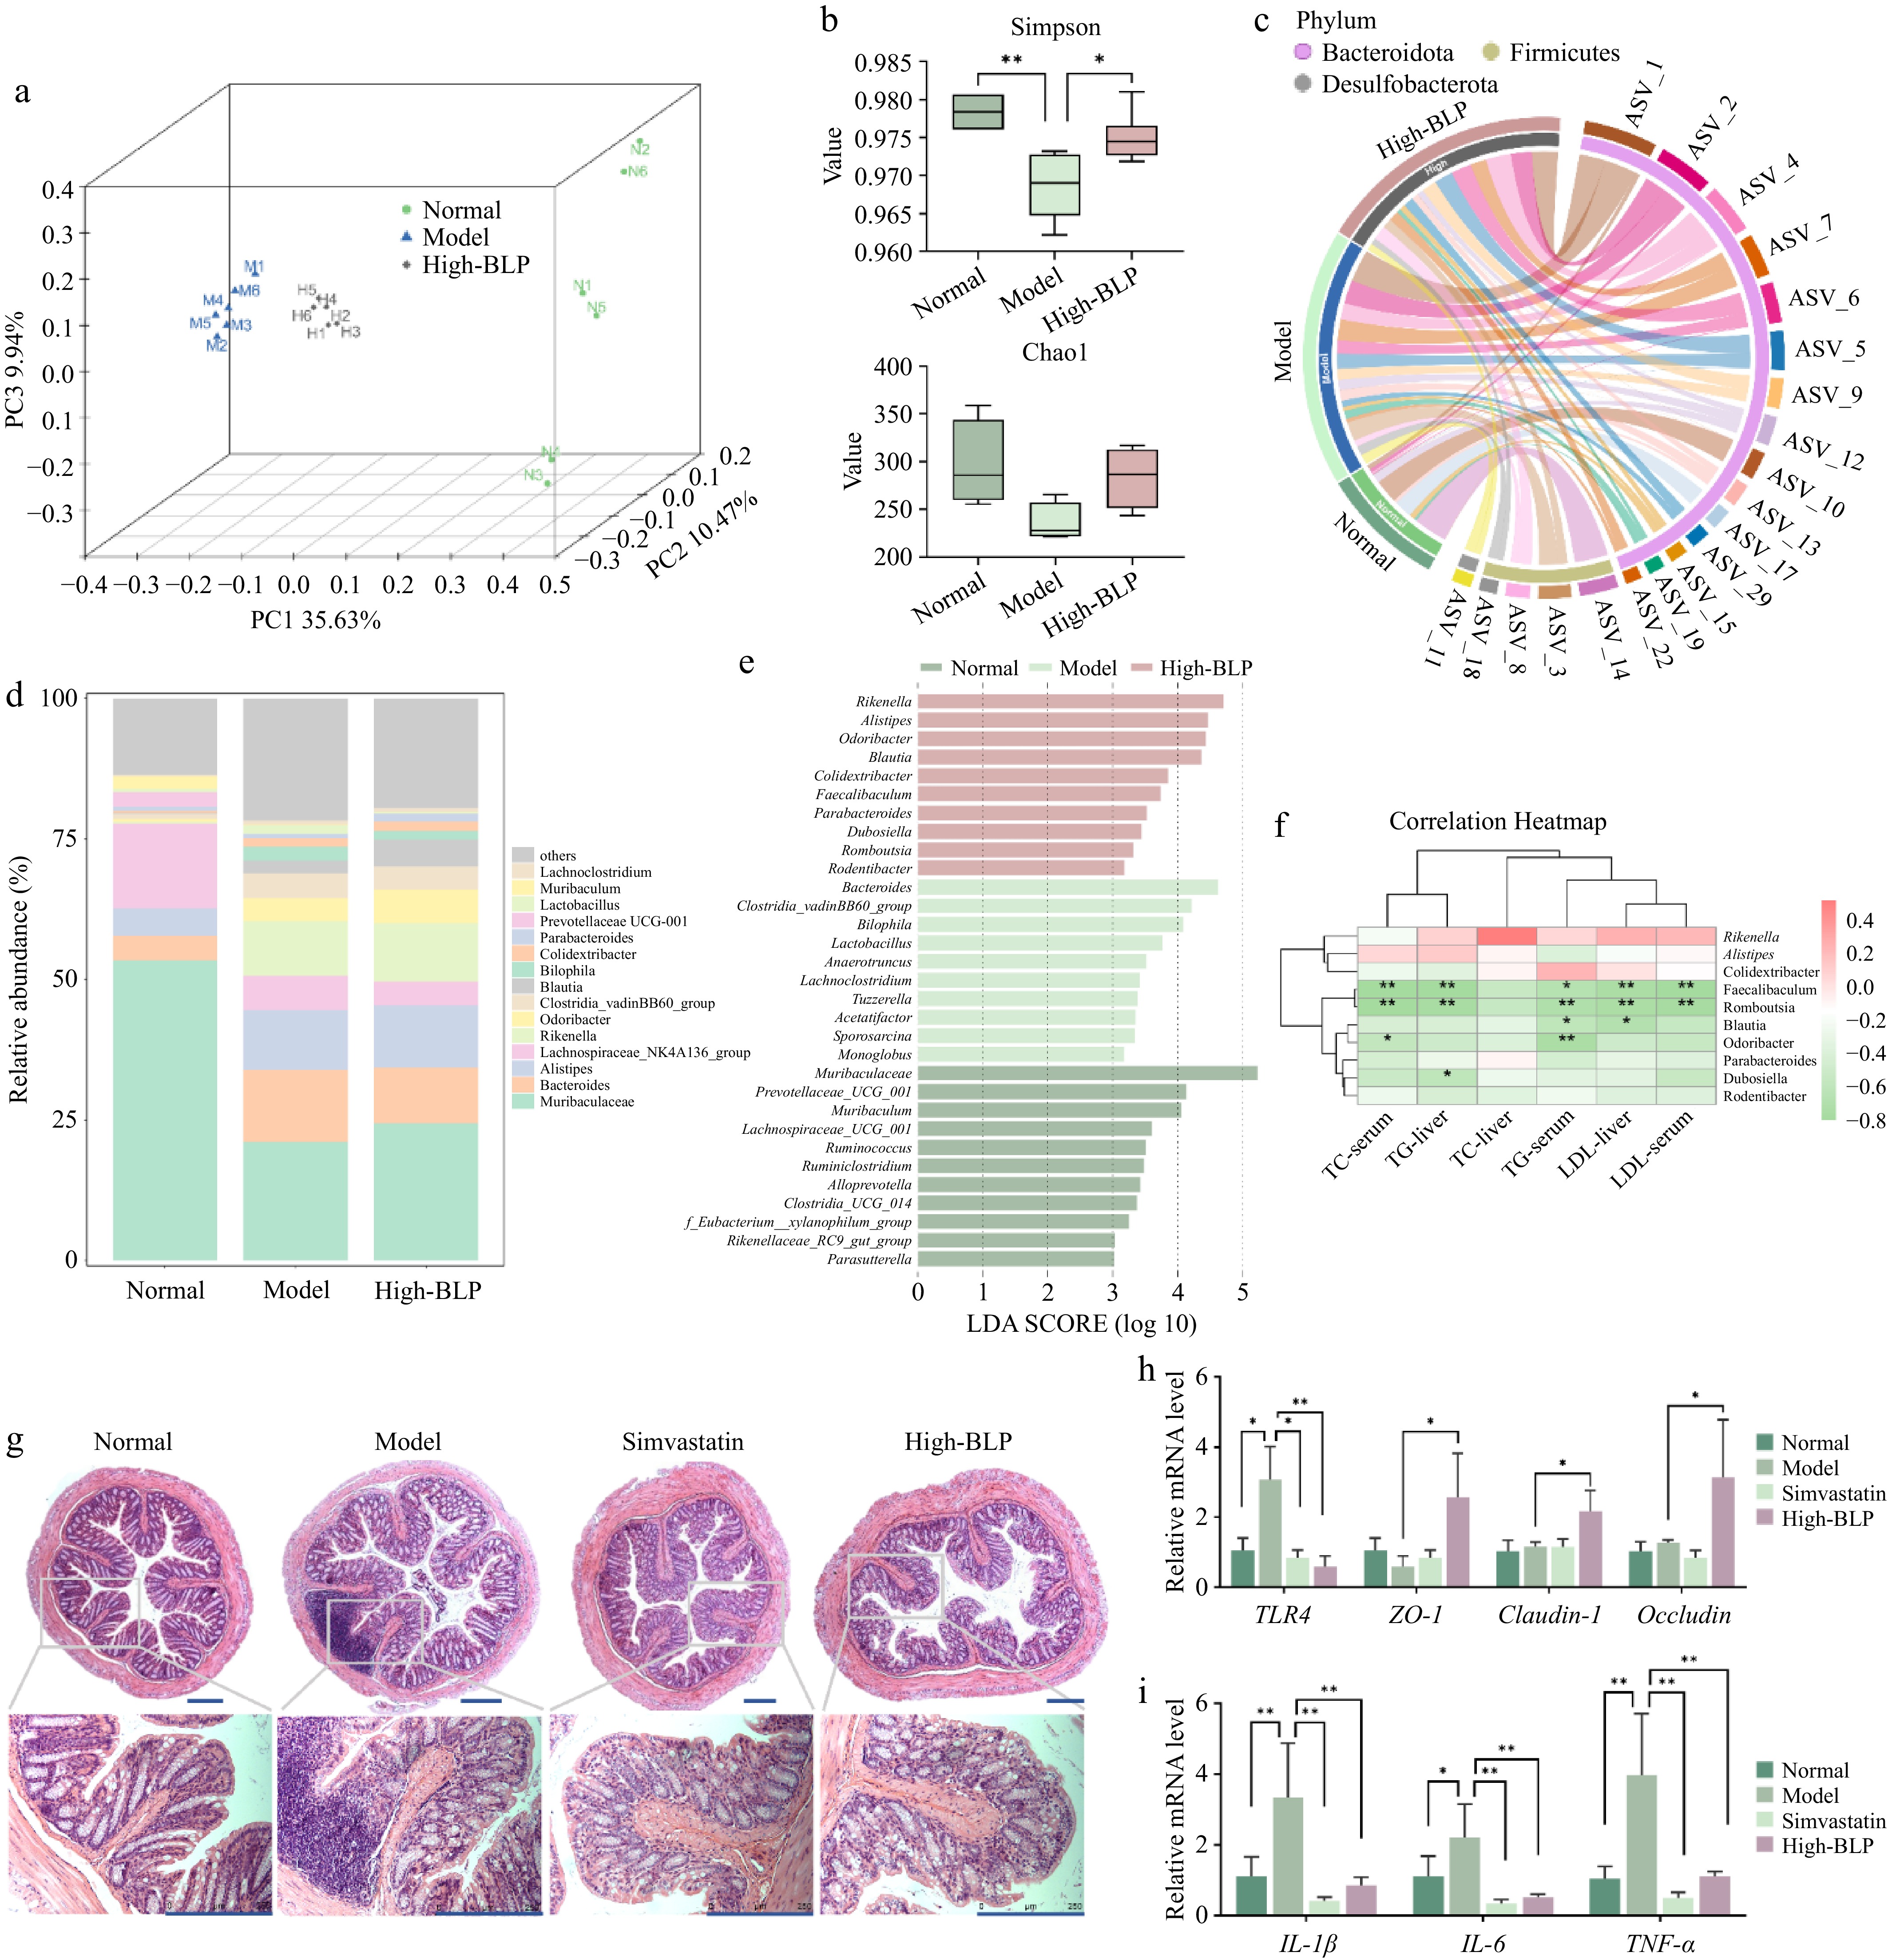
Figure 6.
Effects of BLP on gut microbiota composition in HFD-induced NAFLD mice. (a) PCoA plot showing microbial community separation. (b) Alpha diversity indices (Simpson and Chao1). (c) Circos plot illustrating taxonomic relationships and abundance changes. (d) Relative abundance of dominant bacterial taxa in gut microbiota. (e) LEfSe analysis identifying differentially abundant taxa among groups. (f) Spearman correlations (two-tailed Spearman's rank test) of key genera with metabolic parameters. The color scale represents the (r) correlation coefficient, with red indicating positive correlations and green indicating negative correlations. The intensity of color reflects the strength of the correlation. Statistical significance was determined after false discovery rate (FDR) correction: * p < 0.05, ** p < 0.01. (g) Representative H&E-stained images of gut tissue from each group at 5× and 20× magnifications. The scale bar in the lower right corner is 250 μm. (h) The relative expression levels of TLR4, ZO-1, claudin-1, and occludin genes in the colon. (i) The relative expression levels of IL-1β, IL-6, and TNF-α genes in the colon. Data are presented as mean ± SD or median with interquartile range (n = 6). Statistical significance was determined by one-way ANOVA followed by Tukey's multiple comparisons test. * p < 0.05, ** p < 0.01. PCoA, principal coordinate analysis; LEfSe, linear discriminant analysis effect size.
-
No. Compound name Formula Class Content (%) 1 3-(2-hydroxyphenyl)propanoic acid C9H10O3 Phenylpropanoic acids 0.45 2 Kaempferol C15H10O6 Flavonoids 9.86 3 Luteolin C15H10O6 Flavonoids 9.21 4 Astragalin C21H20O11 Flavonoids 4.35 5 Cyanidin C15H11O6 Flavonoids 2.19 6 Kaempferol 3-gentiobioside C27H30O16 Flavonoids 1.25 7 Cyanidin-3,5-diglucoside C27H31O16 Flavonoids 1.25 8 Cyanidin 3-galactoside C21H21O11 Flavonoids 1.07 9 Kaempferol 3-O-[2″-O-(E)-feruloylgalactosyl-(1→4)-glucoside] C37H38O19 Flavonoids 0.8 10 3-Hydroxyflavone C15H10O3 Flavonoids 0.58 11 Bergaptol C11H6O4 Coumarins and derivatives 5.89 12 Umbelliferone C9H6O3 Coumarins and derivatives 2.1 13 6-Formylumbelliferone C10H6O4 Coumarins and derivatives 1.46 14 Aesculetin C9H6O4 Coumarins and derivatives 0.57 15 Scopoletin C10H8O4 Coumarins and derivatives 0.42 16 Sinapic acid C11H12O5 Cinnamic acids and derivatives 14.45 17 Ferulic acid C10H10O4 Cinnamic acids and derivatives 13.55 18 Caffeic acid C9H8O4 Cinnamic acids and derivatives 6.43 19 1-O-Sinapoyl-β-D-glucose C17H22O10 Cinnamic acids and derivatives 5.11 20 Isoferulic acid C10H10O4 Cinnamic acids and derivatives 5 21 4-Hydroxycinnamic acid C9H8O3 Cinnamic acids and derivatives 4.21 22 trans-Cinnamic acid C9H8O2 Cinnamic acids and derivatives 3.52 23 2-Hydroxycinnamic acid C9H8O3 Cinnamic acids and derivatives 2.18 24 p-Coumaraldehyde C9H8O2 Cinnamaldehydes 4.08 Table 1.
Phenolic compounds identified in broccoli leaf by LC-MS/MS.
Figures
(6)
Tables
(1)