-
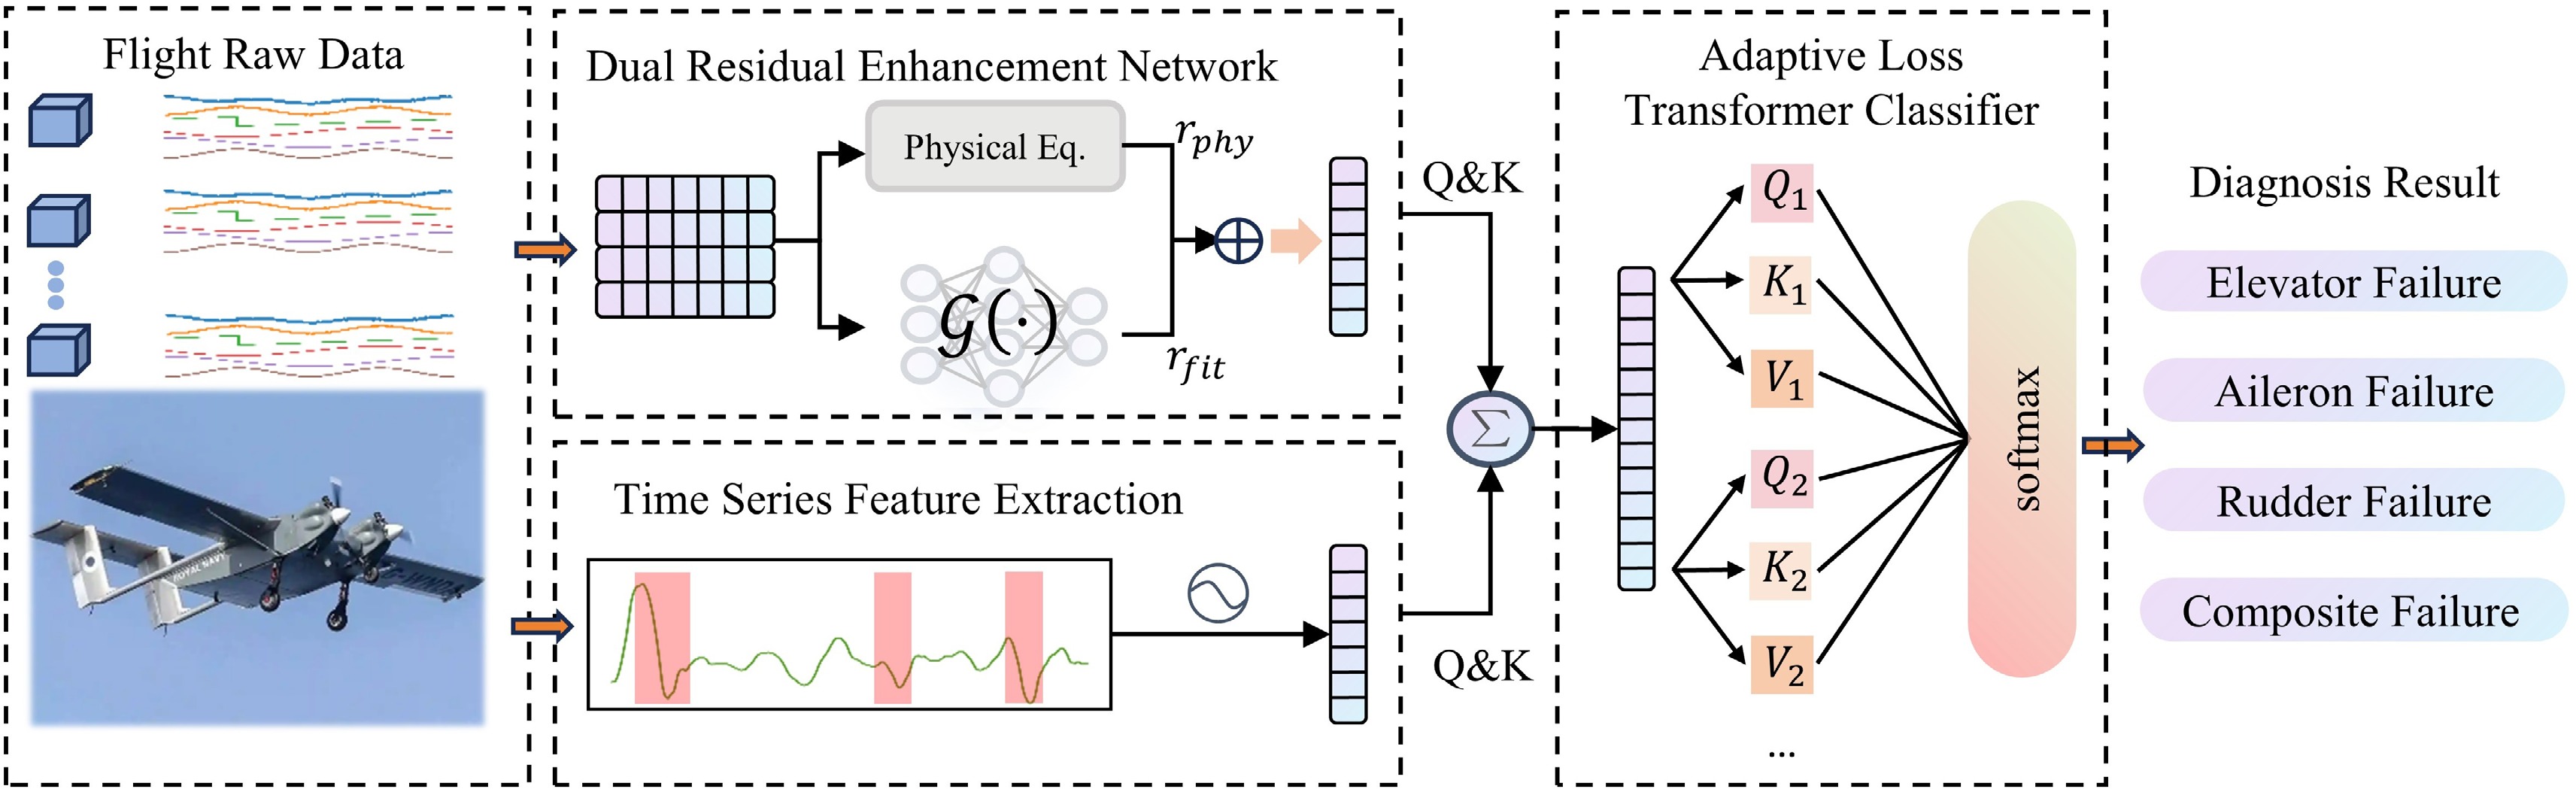
Figure 1.
Overall network architecture of the PIEDRN fault diagnosis model.
-
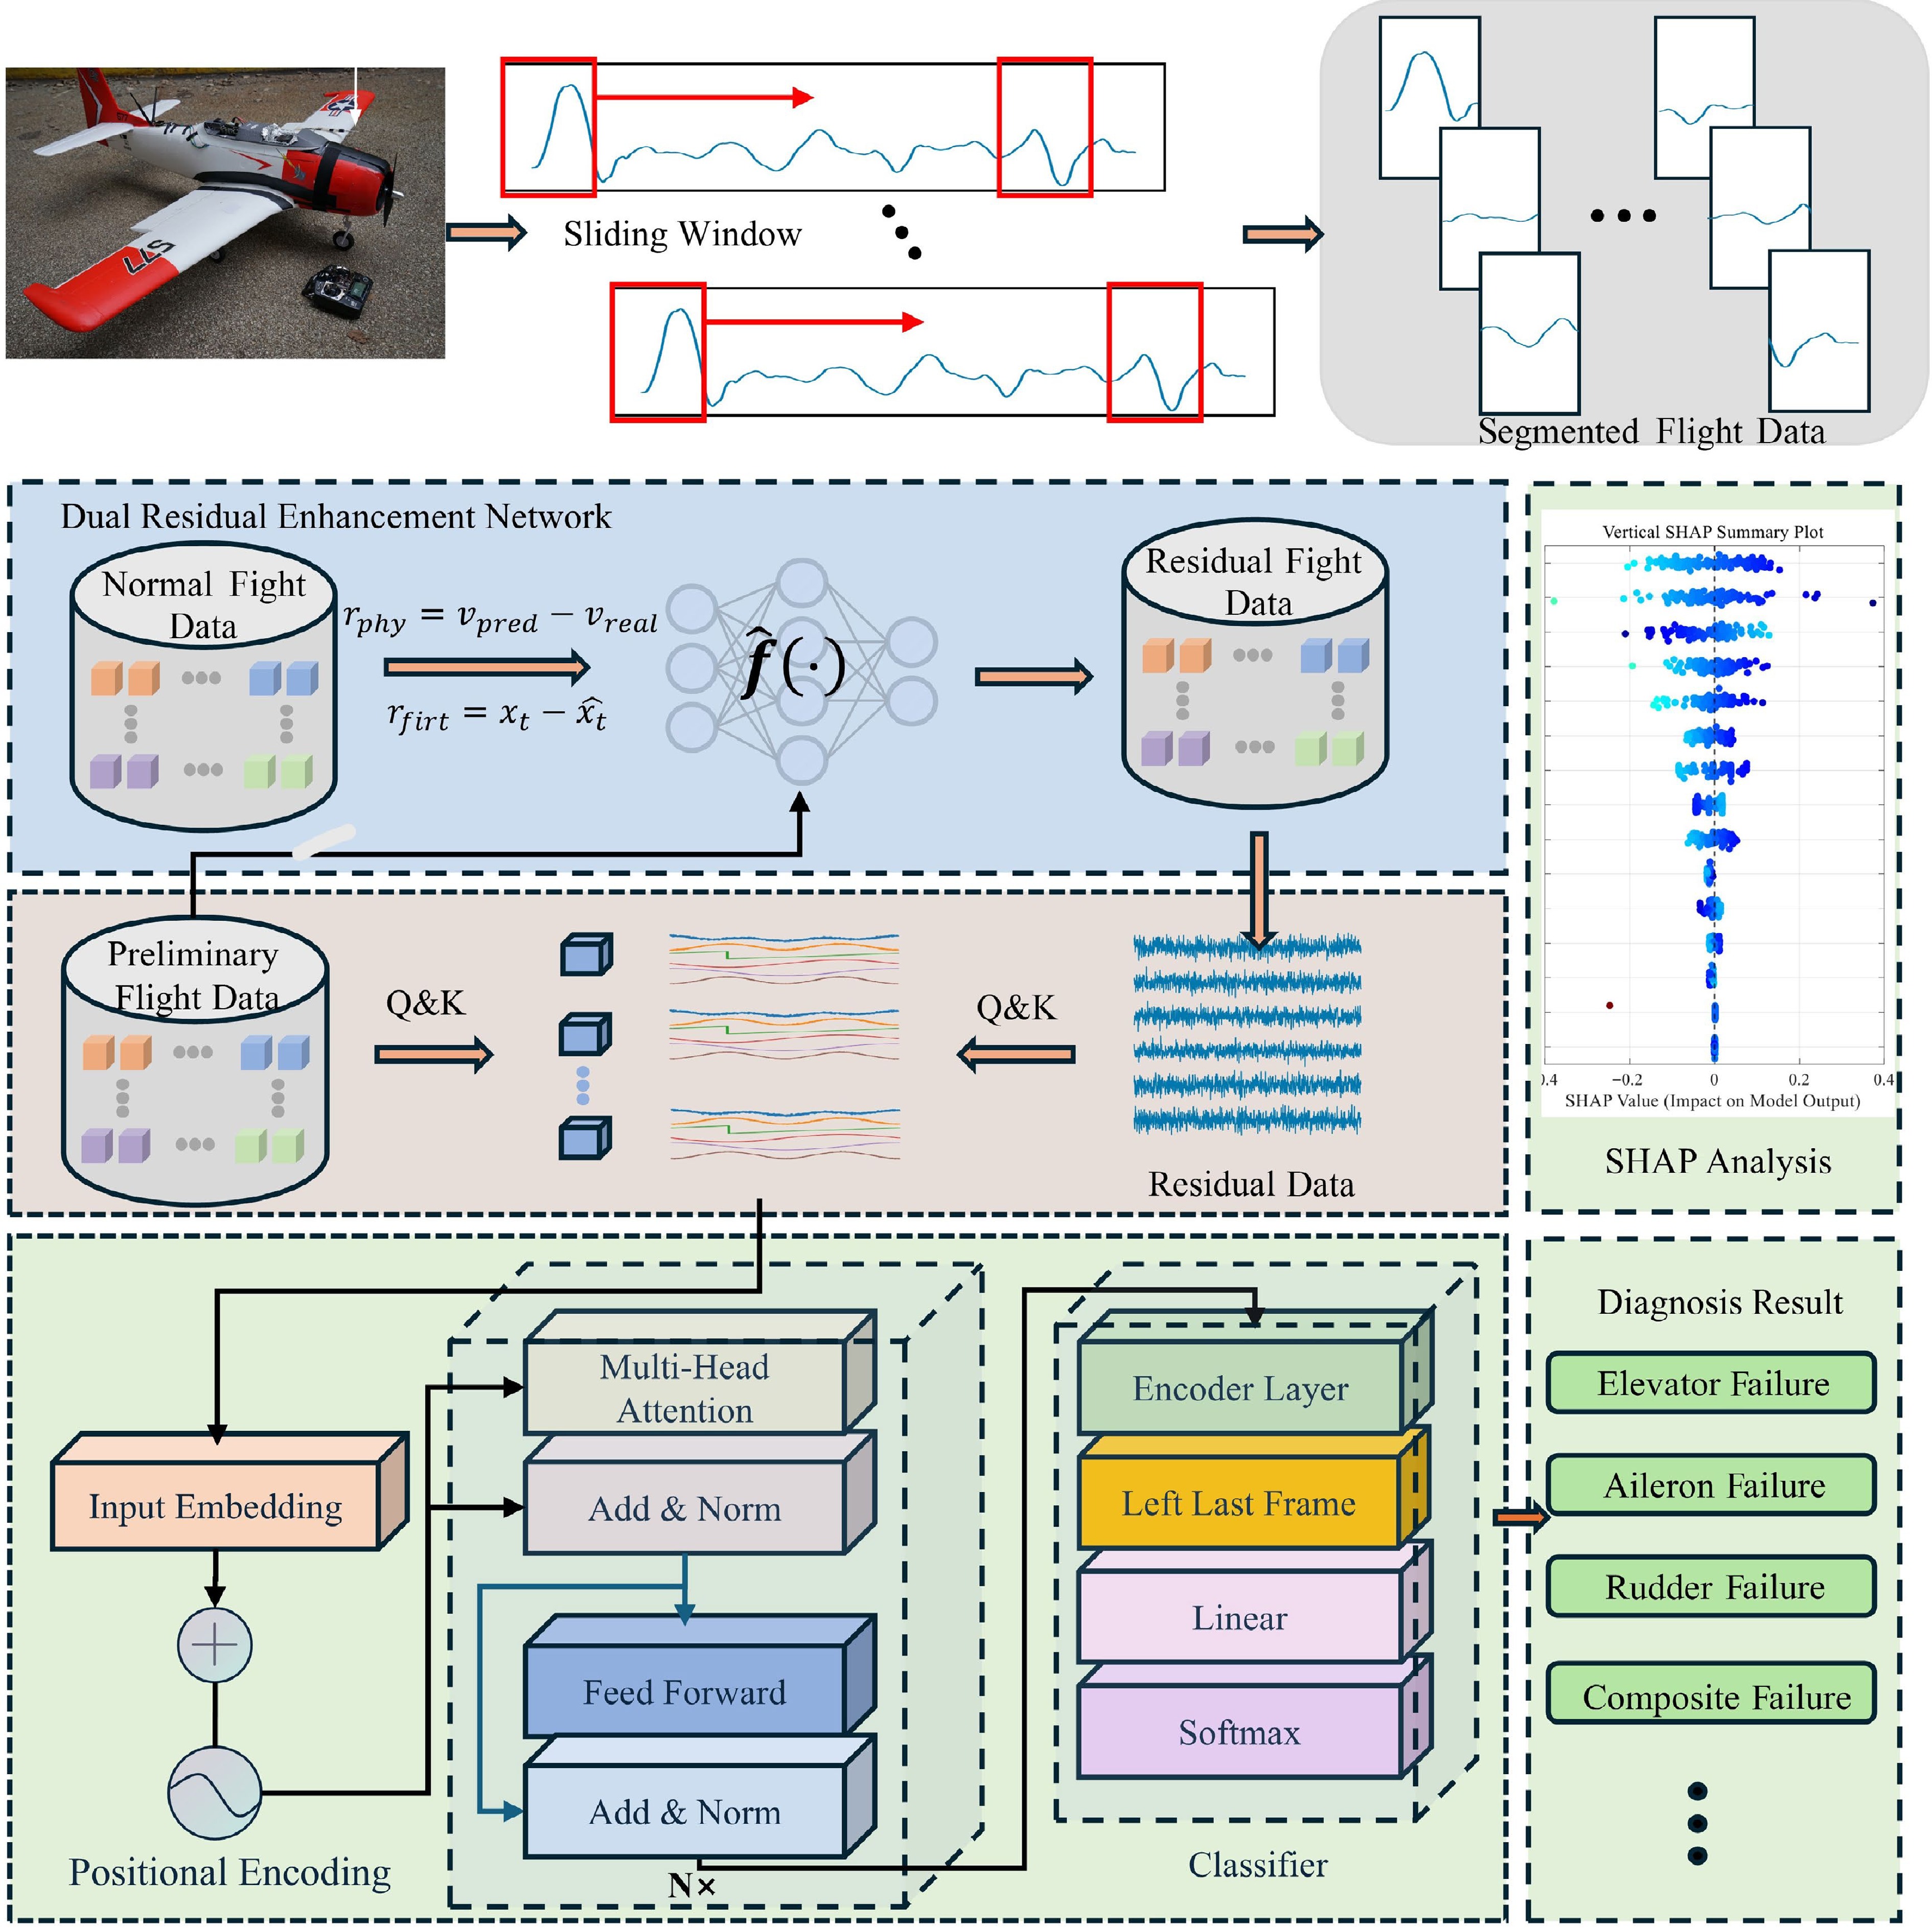
Figure 2.
UAV fault diagnosis procedure based on the proposed PIEDRN model.
-
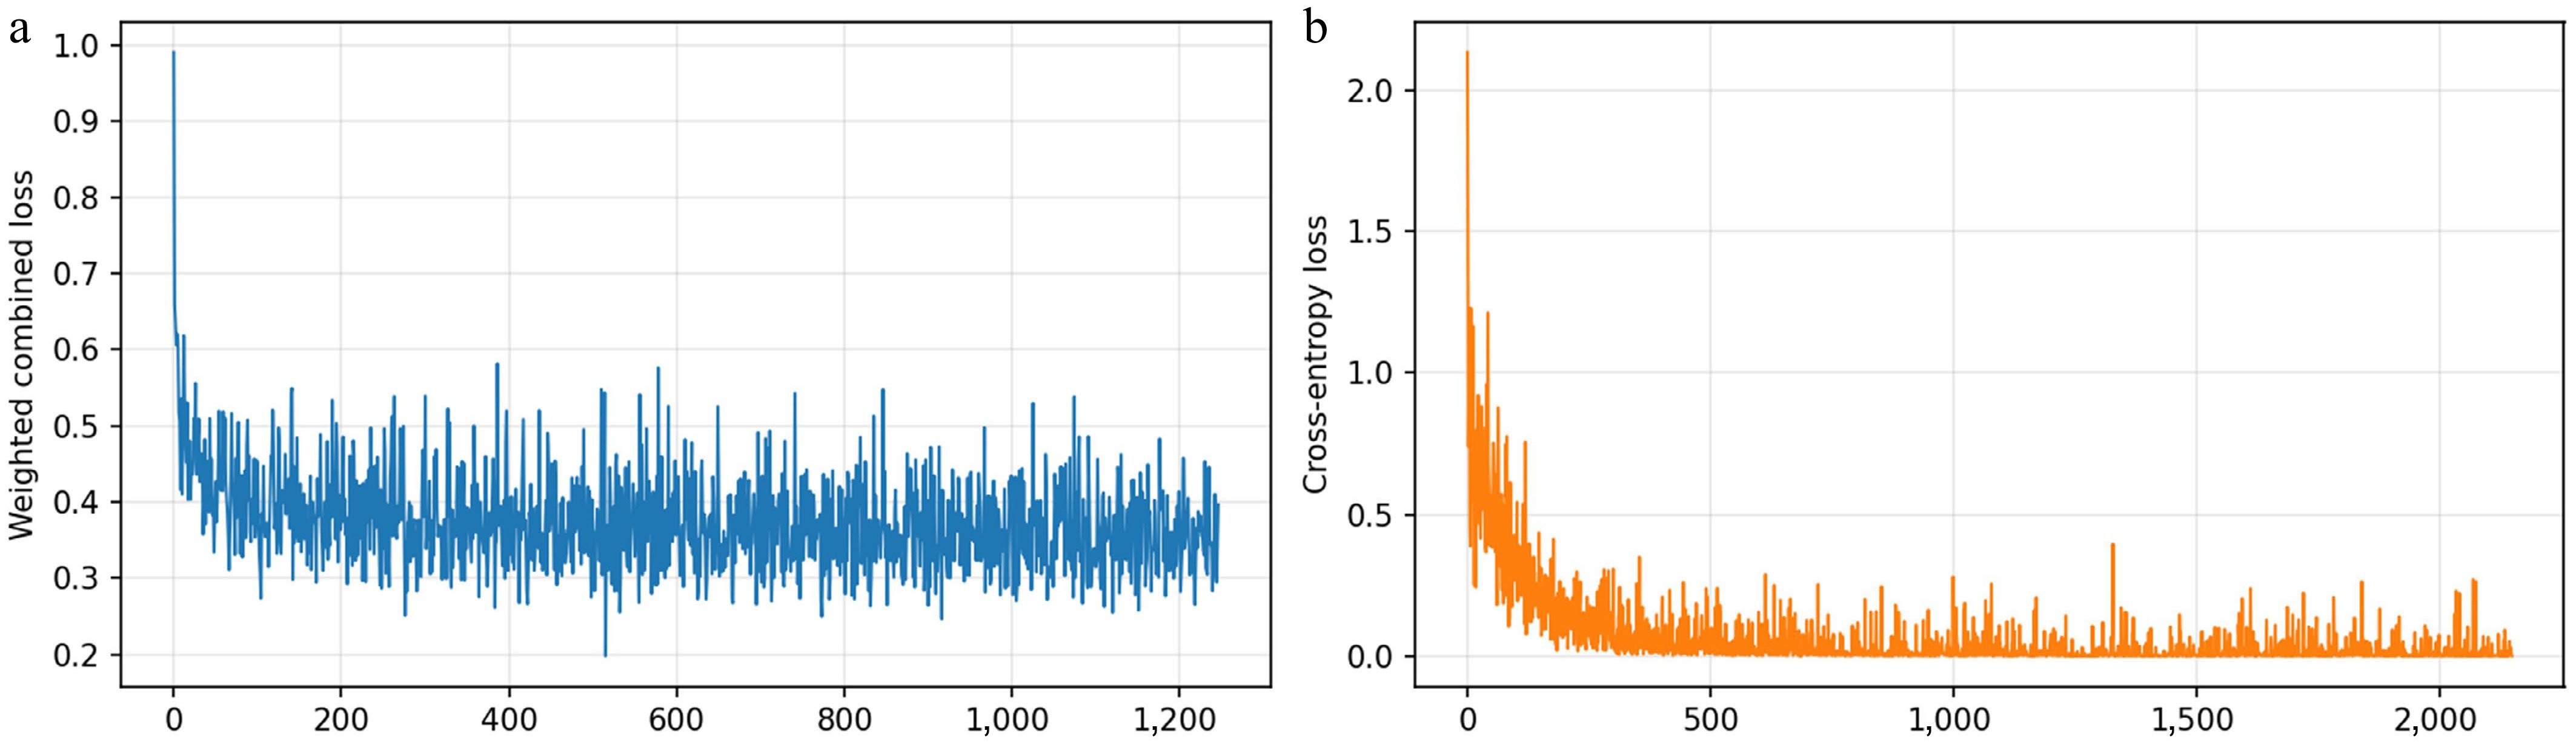
Figure 3.
(a) Training loss curve for the physical information fusion extractor, and (b) loss decay curve for the adaptive loss Transformer classifier.
-
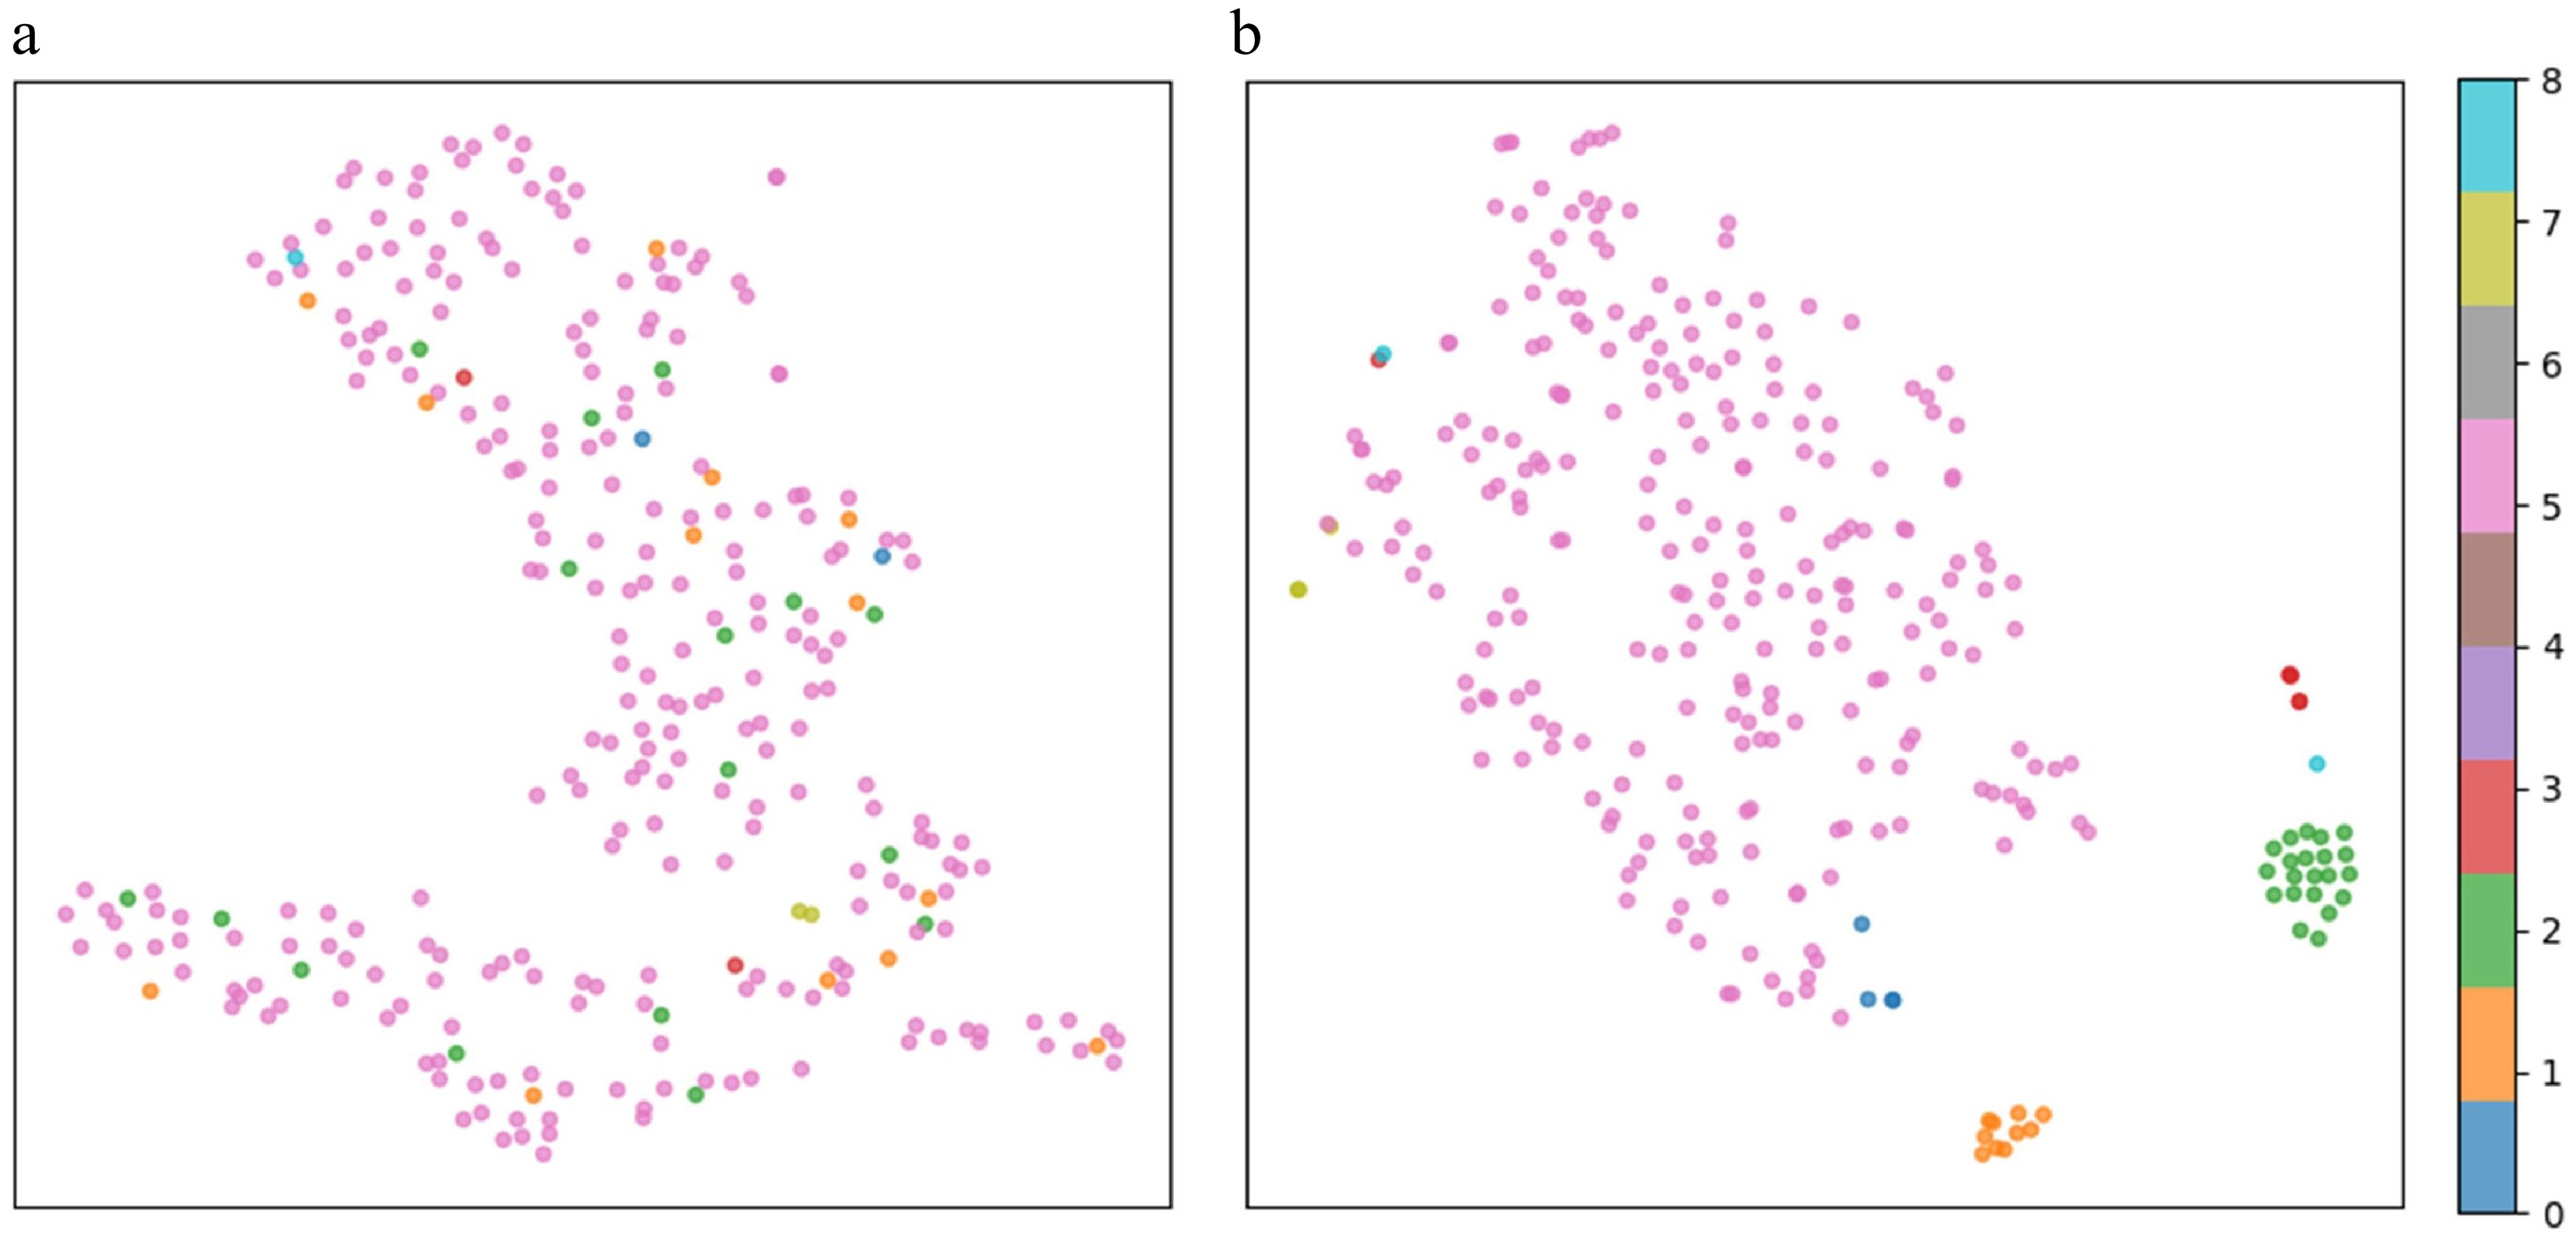
Figure 4.
(a) t-SNE plot without feature clustering, and (b) t-SNE plot after feature clustering by PIEDRN.
-
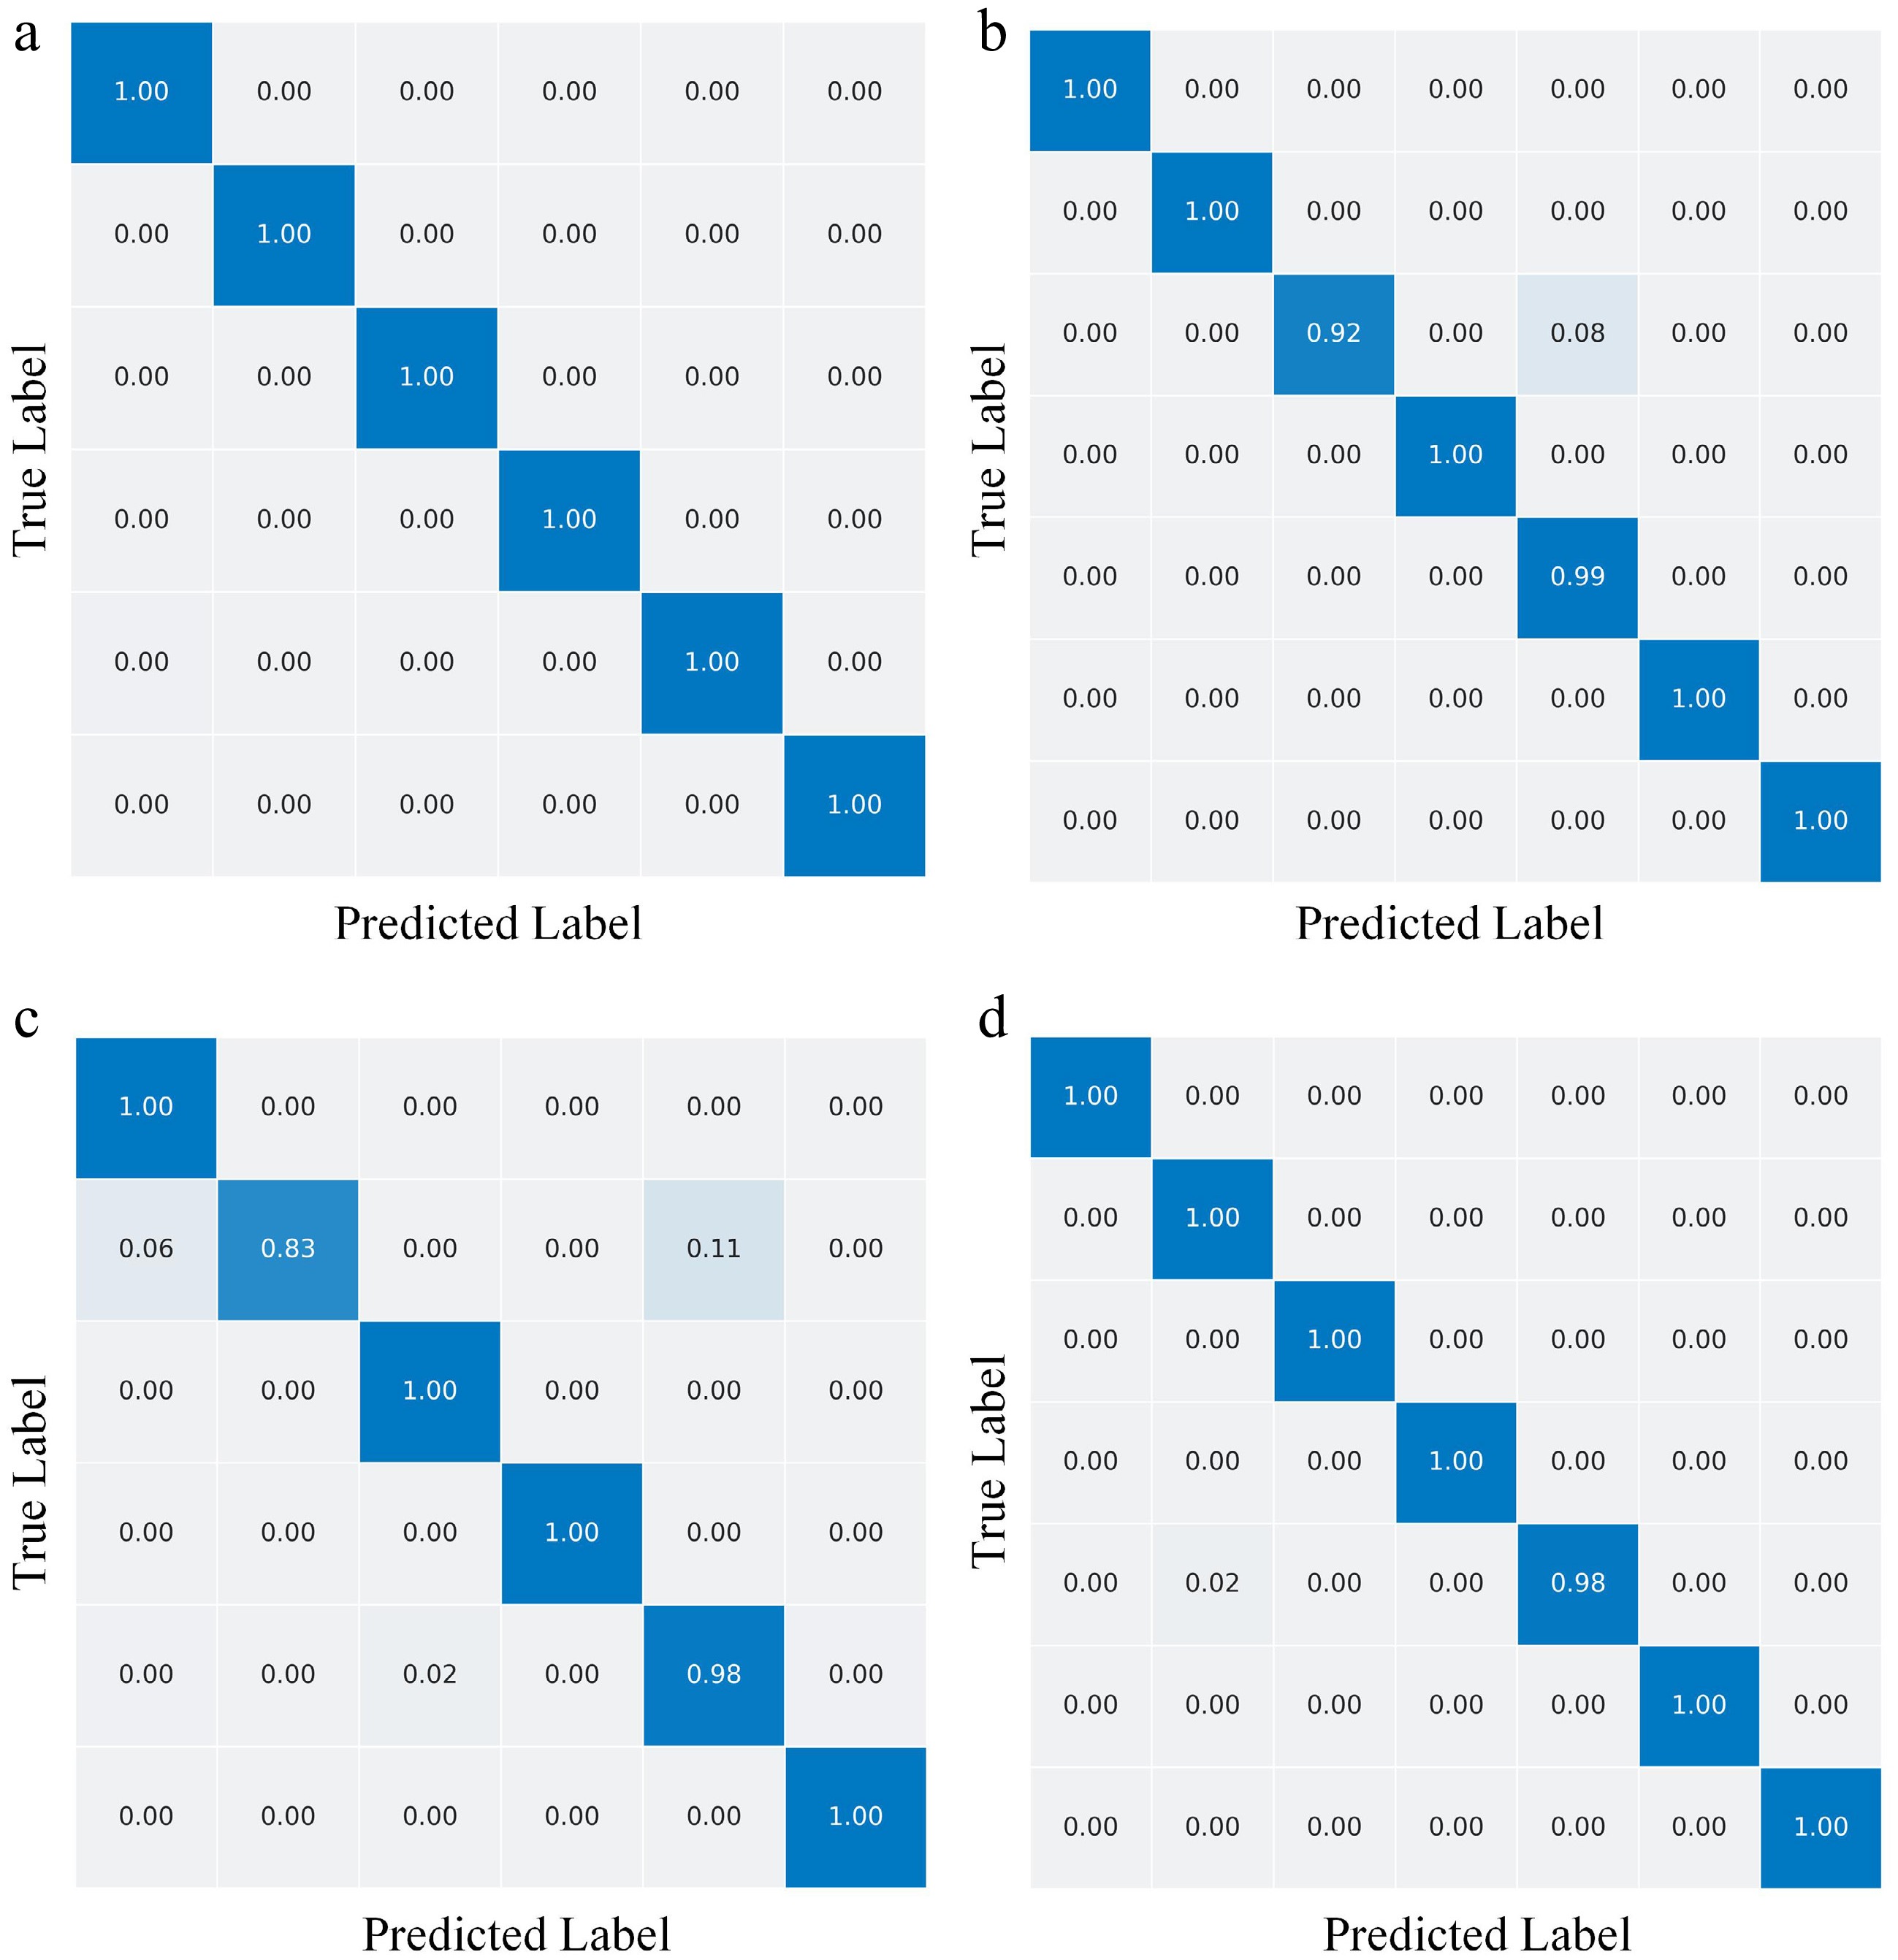
Figure 5.
Confusion matrix for datasets D1–D4.
-
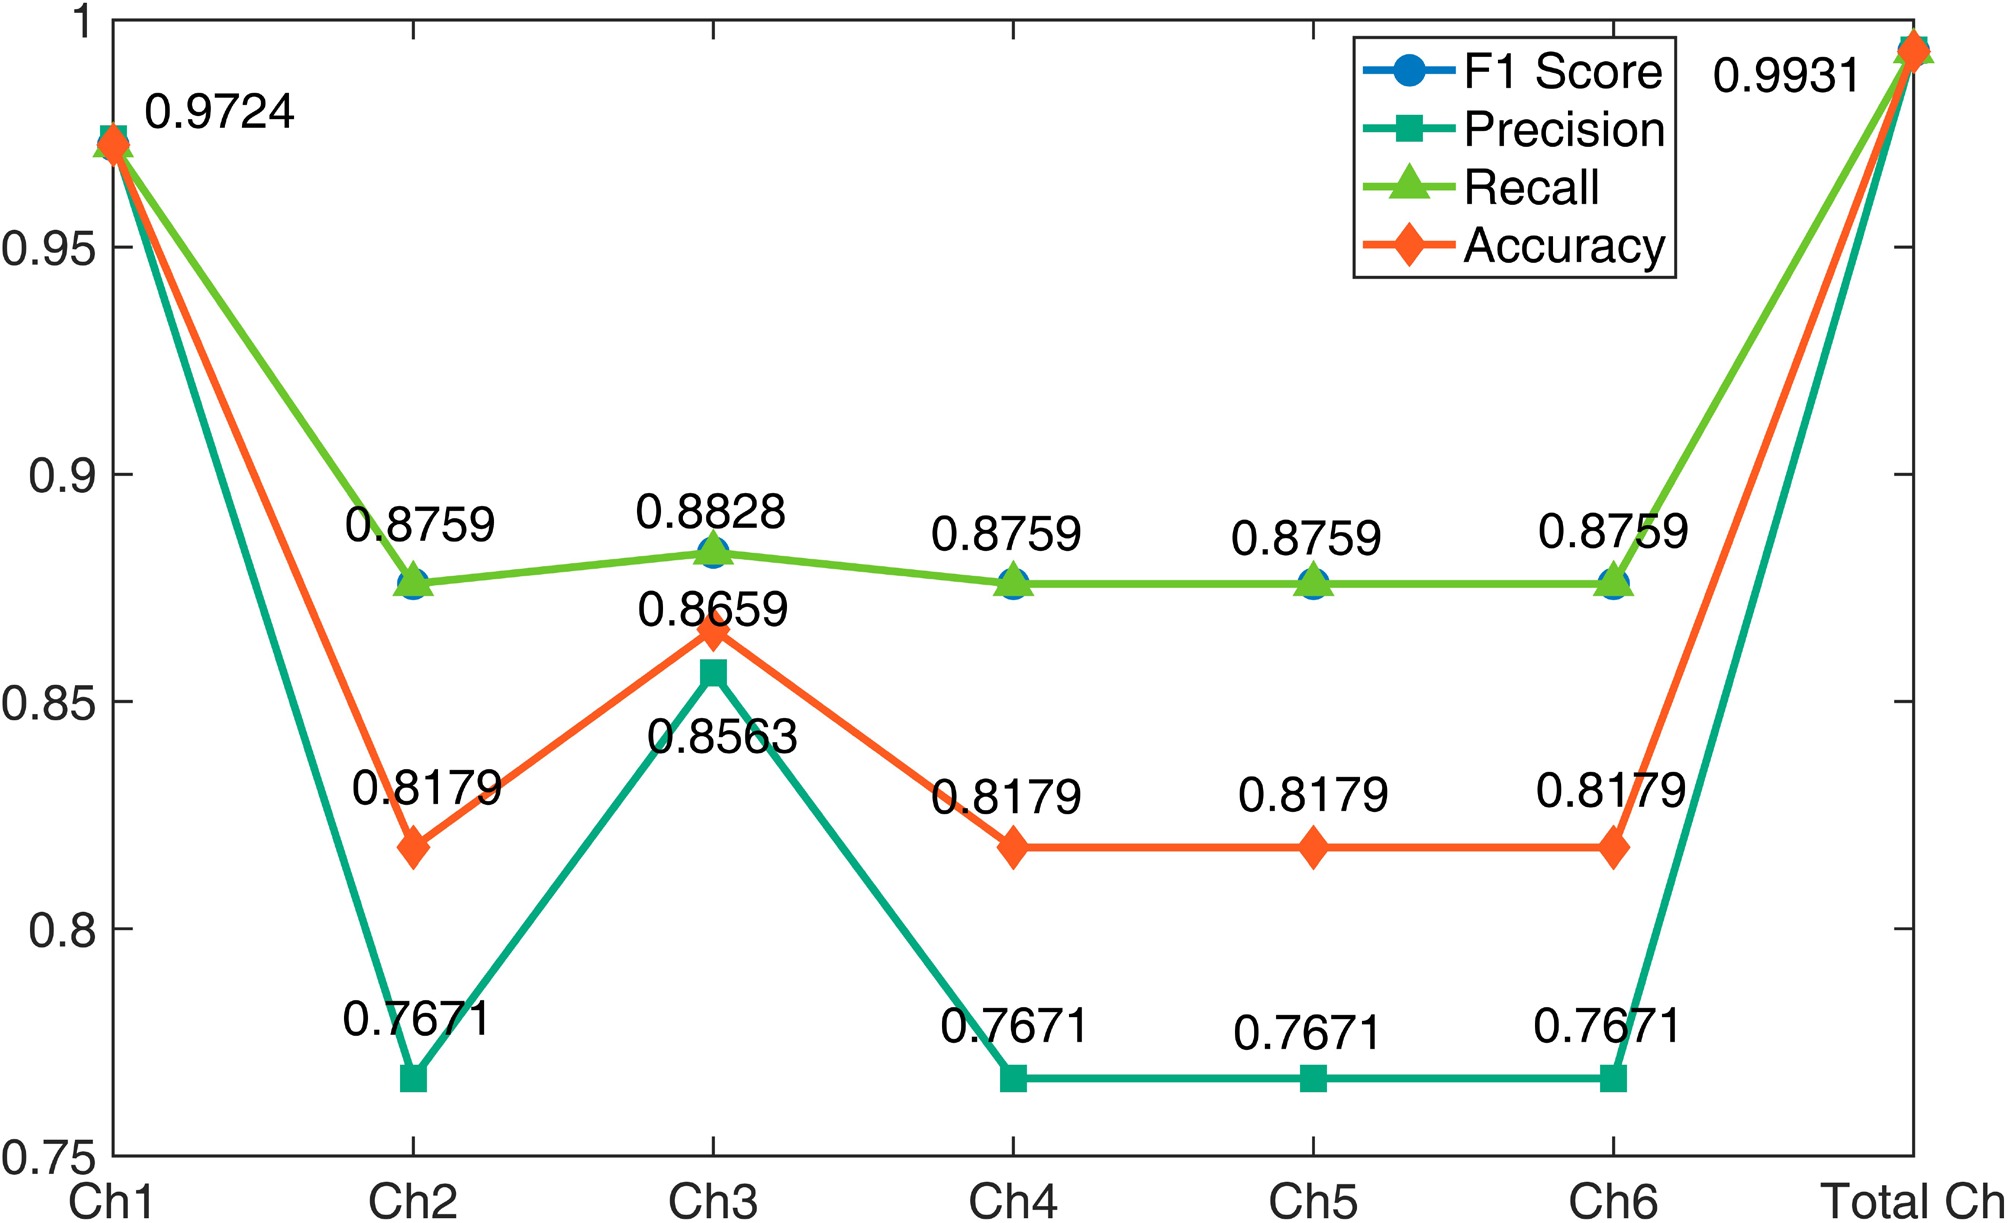
Figure 6.
Comparison of the classification performances of PIEDRN across different channels.
-
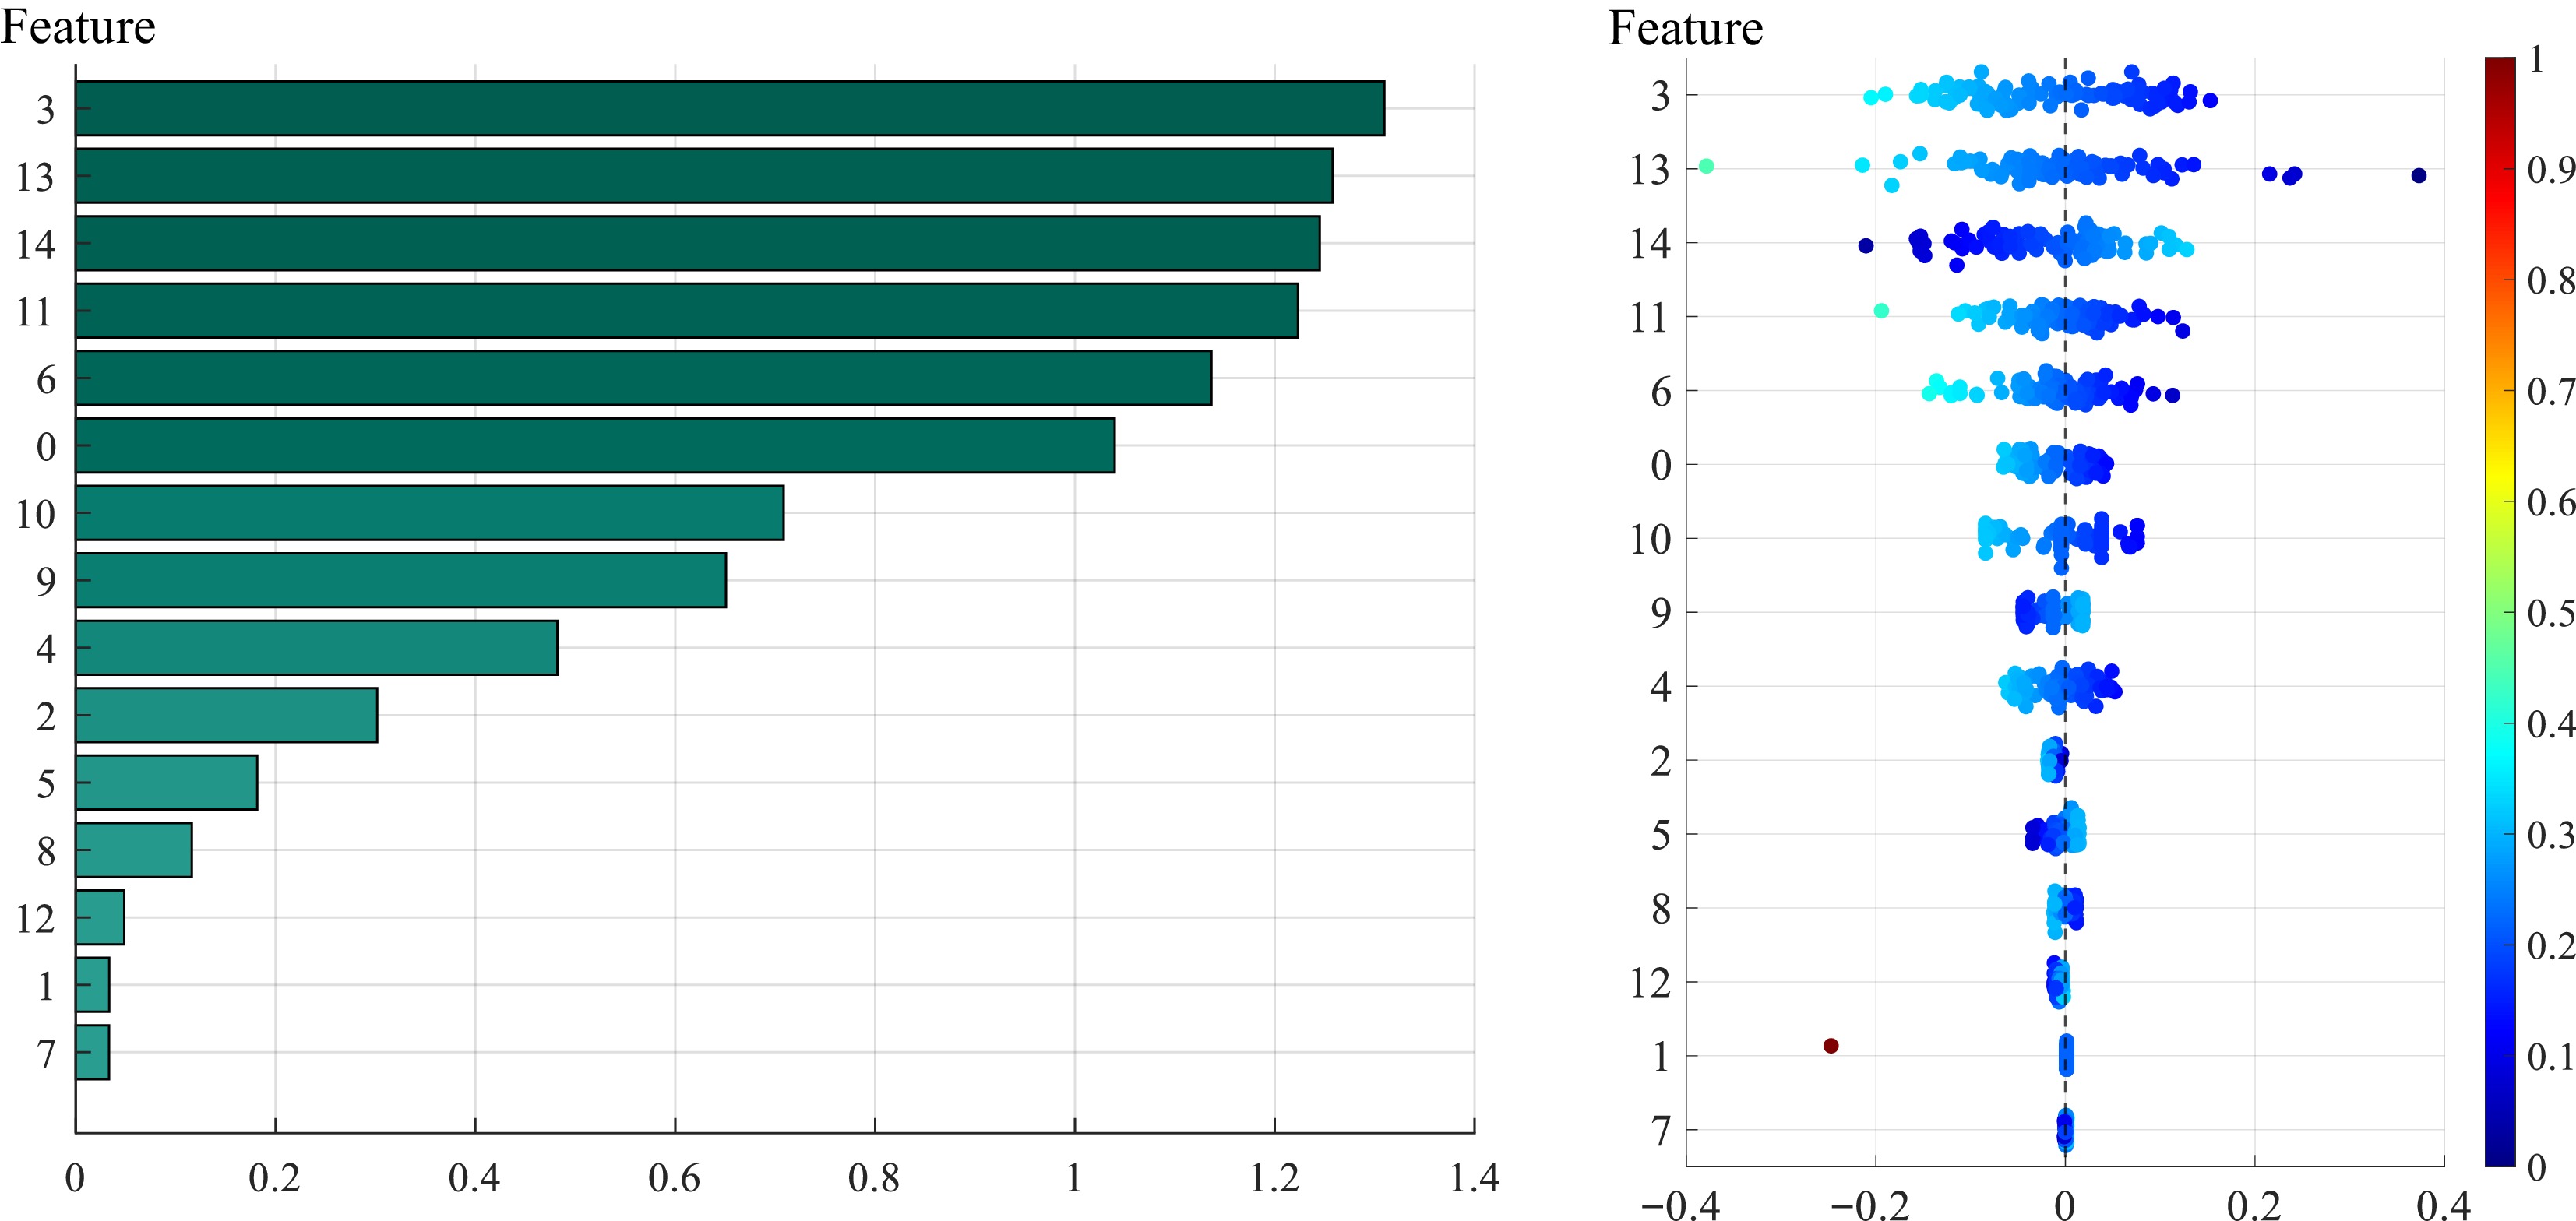
Figure 7.
SHAP visualization graph. (a) Mean values of various feature weights, and (b) a scatter plot produced with various feature weights.
-
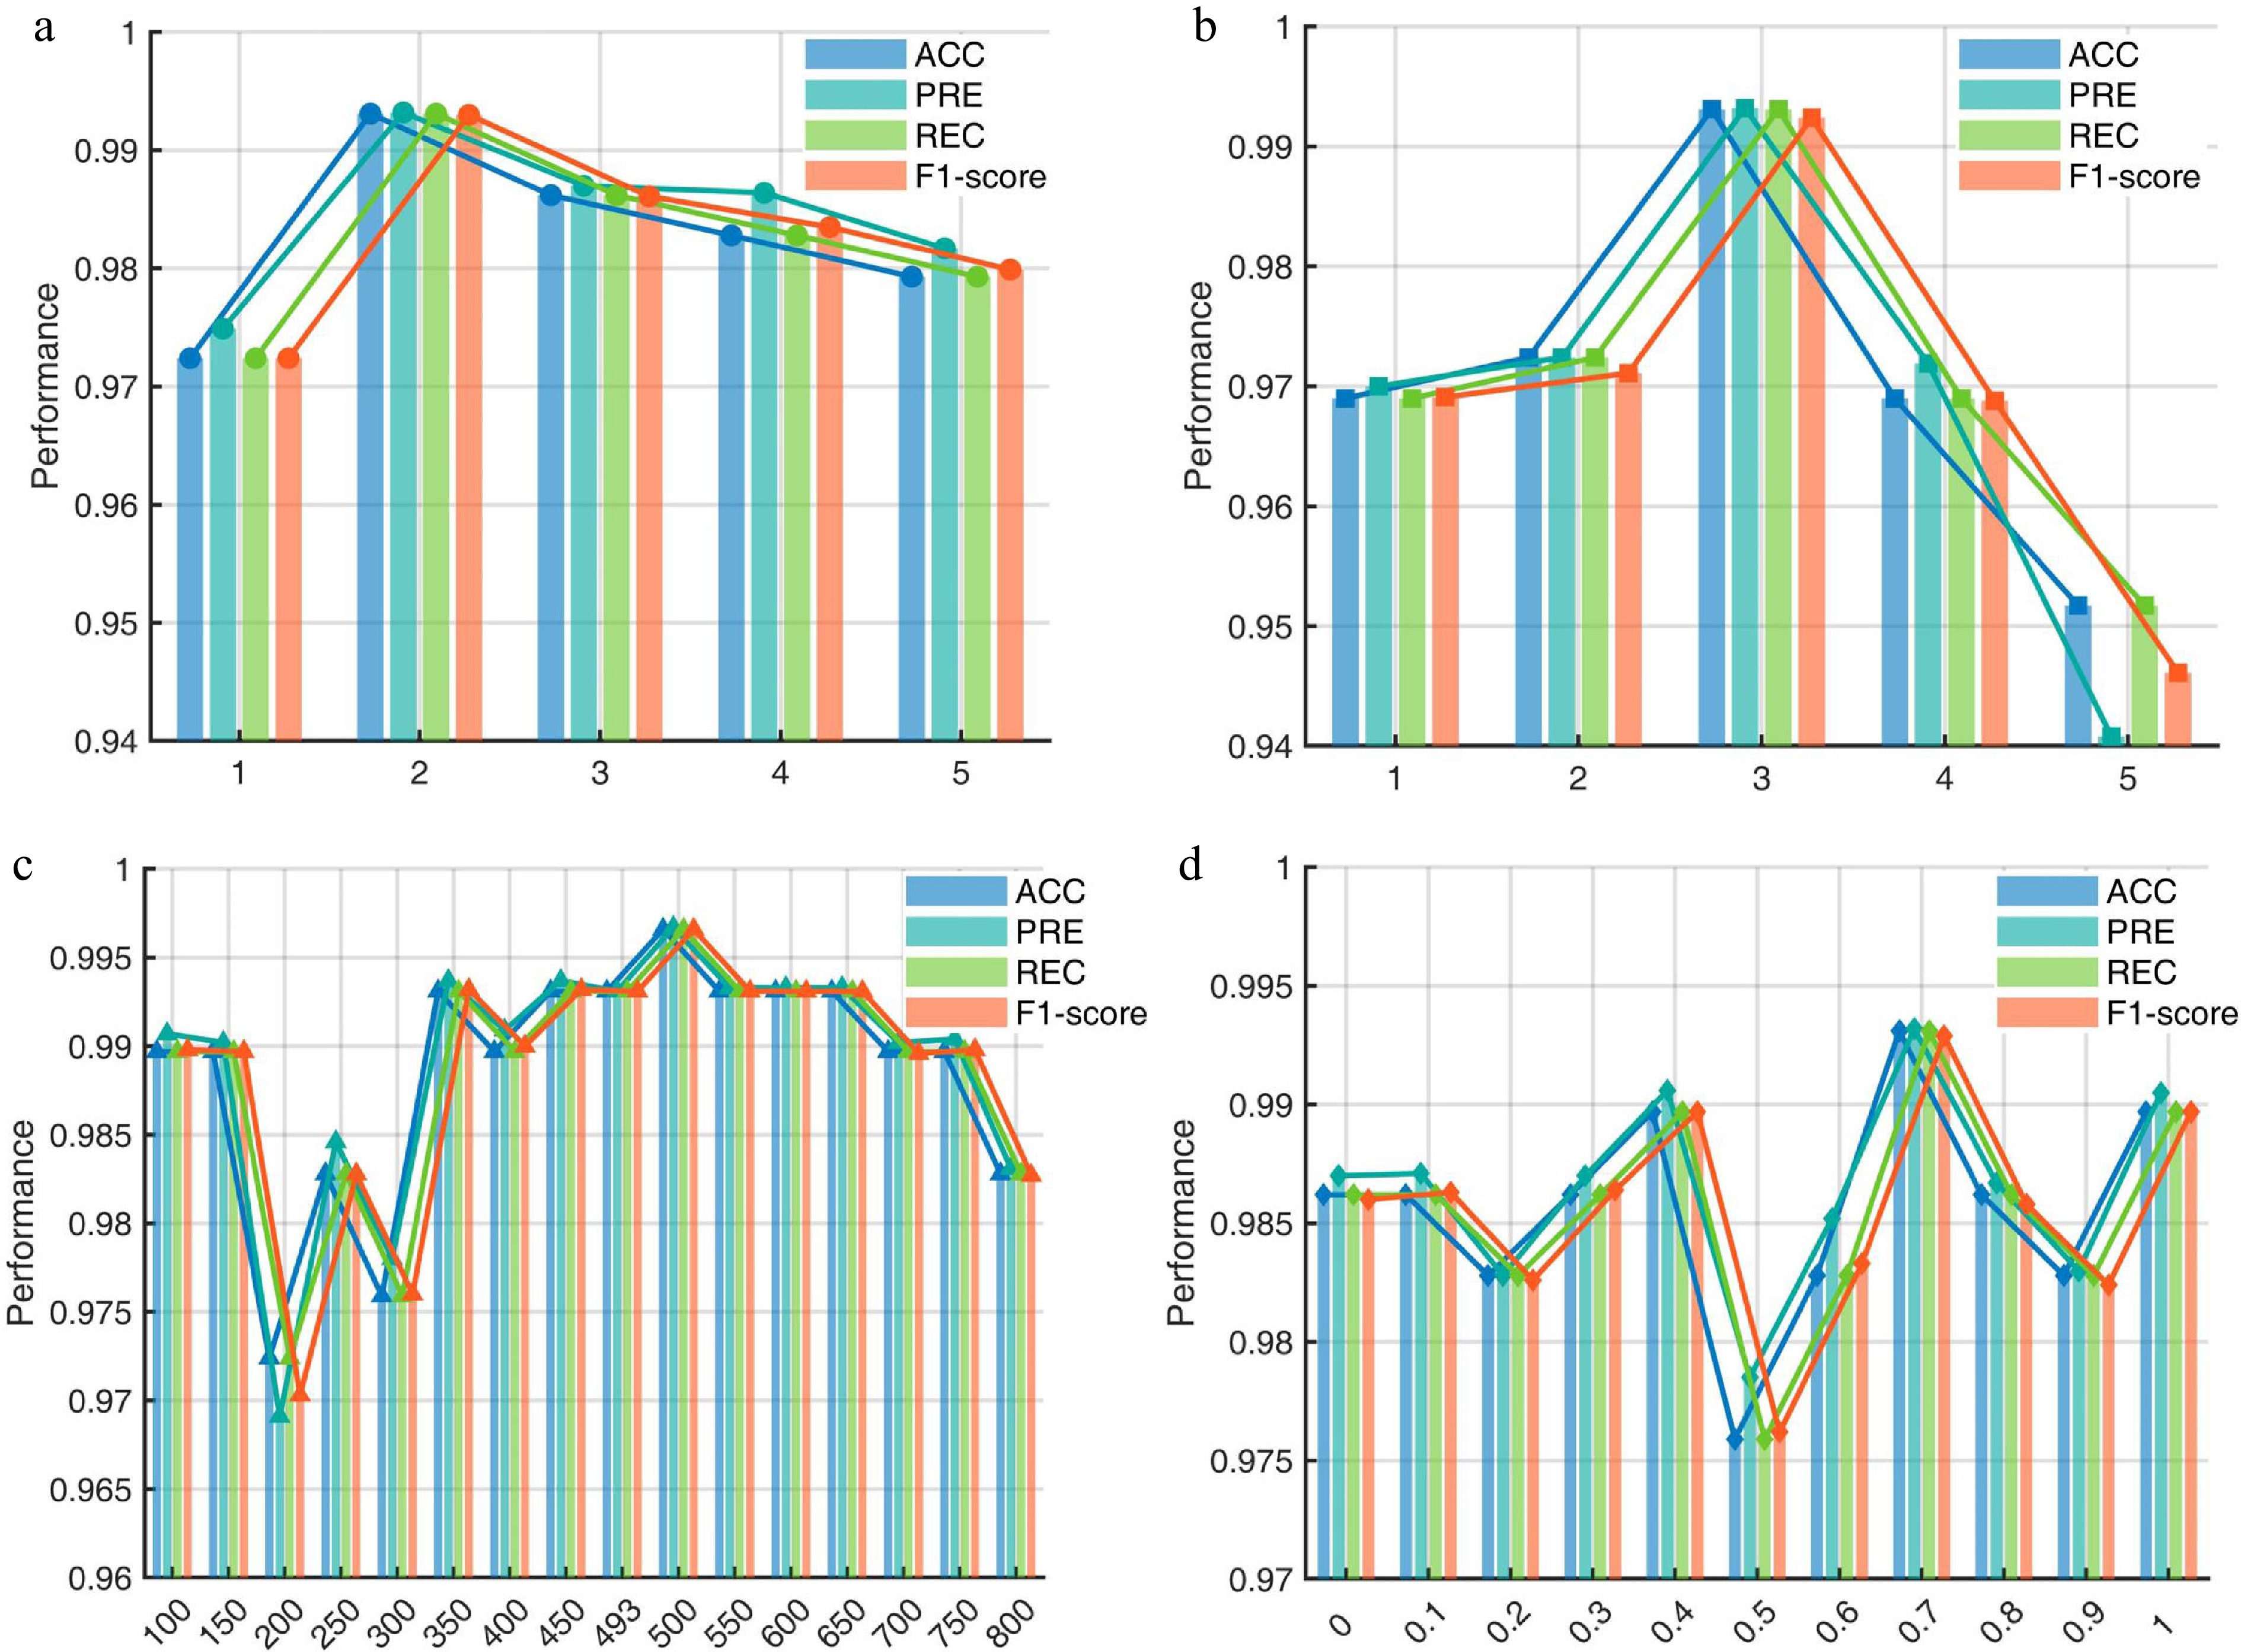
Figure 8.
Hyperparameter sensitivity change graph: (a) represents the number of stacked layers; (b) is the number of heads contained in PIEDRN; (c) is the number of hidden layers contained in the DRN; and (d) is the size of the weights.
-
Require: Dataset $ D $ $ \alpha $ $ E_1, E_2 $ $ B $ Ensure: Best DRN model $ M_{\text{best}} $ $ T_{\text{best}} $ $ Met $ 1: Step 1: Data Preparation 2: $ D_{tr}, D_{v}, D_{te} \gets \text{Split}(D) $ 3: $ \text{Loader}_{tr} \gets \text{DataLoader}(D_{tr}, B) $ 4: Step 2: DRN Pre-training (Residual Generation) 5: $ M_{\text{best}} \gets \text{PreTrain}\_\text{DRN}(D_{tr}, D_{v}, \alpha, E_1) $ 6: Step 3: Joint Transformer Training 7: $ T \gets \text{Init}\_\text{Transformer}(15) $ 8: $ \text{opt}_T \gets \text{Optimizer}(T) $ 9: $ \text{max}\_\text{acc} \gets 0 $ 10: for $ e \gets 1 $ $ E_2 $ 11: for each $ \text{batch} $ $ \text{Loader}_{tr} $ 12: $ r \gets M_{\text{best}}[x_{\text{DRN}}] - [y_{\text{DRN}}] $ 13: $ x_{\text{fus}} \gets \text{Concat}([x_{\text{raw}}], r) $ 14: $ \text{loss} \gets \text{Loss}\_\text{CE}(T(x_{\text{fus}}), [\text{label}]) $ 15: $ \text{Clip}\_\text{Grad}(T) $ 16: end for 17: $ T_{\text{best}} \gets T $ 18: end for 19: Step 4: Evaluation 20: $ Met \gets \text{Calc}\_\text{Metrics}(T_{\text{best}}, D_{te}) $ 21: return $ M_{\text{best}}, T_{\text{best}}, Met $ Table 1.
PIEDRN core algorithm framework.
-
Dataset DRN PIEDRN HD DP LR AH HD LY DP LR A1 462 0.2555 0.0007 8 512 2 0.3879 0.0002 A2 482 0.1265 0.0003 2 512 2 0.1843 0.0001 A3 272 0.3852 0.0008 8 512 3 0.3124 0.00001 A4 272 0.3852 0.0008 8 512 3 0.3124 0.00001 U1 465 / 0.0001 2 465 2 0.2241 0.0016 U2 220 / 0.0001 10 492 2 0.1081 0.0034 Table 1.
Model parameter configuration.
-
Dataset Metrics PIEDRN MTCL-UAV DCdetector Anomaly transformer TimesNet PatchTST CGAD D1 ACC 0.9931 0.9384 0.9343 0.9470 0.9070 0.9151 0.8862 Precision 0.9933 0.9244 0.8717 0.8788 0.8915 0.9057 0.7753 Recall 0.9931 0.8417 0.8872 0.8410 0.7460 0.7648 0.8225 F1-score 0.9930 0.8811 0.8794 0.8595 0.8123 0.8293 0.7982 D2 ACC 0.9724 0.9470 0.9135 0.9409 0.9266 0.9512 0.9078 Precision 0.9727 0.7481 0.6799 0.7189 0.7385 0.7430 0.6310 Recall 0.9724 0.9152 0.6950 0.9017 0.7177 0.8521 0.8653 F1-score 0.9714 0.8233 0.6874 0.8000 0.7279 0.7938 0.7298 D3 ACC 0.9724 0.9299 0.9148 0.9263 0.9072 0.9129 0.8247 Precision 0.9741 0.8047 0.7310 0.7358 0.7482 0.7752 0.4870 Recall 0.9724 0.7136 0.7370 0.8619 0.6296 0.6386 1.000 F1-score 0.9728 0.7564 0.7340 0.7939 0.6838 0.7003 0.6550 D4 ACC 0.9690 0.9256 0.9261 0.8981 0.8991 0.9076 0.8755 Precision 0.9747 0.8404 0.8213 0.7882 0.8216 0.8260 0.7214 Recall 0.9690 0.7965 0.7938 0.7137 0.6732 0.7181 0.7004 F1-score 0.9698 0.8178 0.8073 0.7491 0.7400 0.7683 0.7107 Avg F1 0.9768 0.8197 0.7770 0.8006 0.7410 0.7729 0.7234 Table 2.
Diagnosis and detection results on the ALFA dataset.
-
Metrics Dataset U1 Dataset U2 Average F1 ACC PRE REC F1 score ACC PRE REC F1 score OCSVM 0.9754 0.9795 0.9945 0.9715 0.8879 0.7270 1.0000 0.8419 0.9067 IForest 0.9823 0.9630 0.9931 0.9778 0.8934 0.7368 1.0000 0.8485 0.9132 XGBoost 0.9190 0.8509 1.0000 0.9194 0.9761 0.9254 0.9253 0.9206 0.9200 AutoEncoder 0.9875 0.9737 0.9831 0.9784 0.9399 0.8323 1.0000 0.9085 0.9435 CGAD 0.9986 0.9733 0.9826 0.9779 0.9540 0.9124 0.9358 0.9240 0.9419 Autoformer 0.9709 0.9804 0.9562 0.9682 0.9429 0.8928 0.9192 0.9058 0.937 FEDformer 0.9793 0.9823 0.9728 0.9775 0.9432 0.8956 0.9168 0.9061 0.9418 PatchTST 0.9699 0.9643 0.9708 0.9675 0.9474 0.8668 0.9735 0.9171 0.9423 TimesNet 0.9555 0.9253 0.9833 0.9534 0.9296 0.8233 0.9733 0.8920 0.9227 Anomaly 0.9714 0.9418 1.0000 0.9700 0.9739 0.9196 0.9463 0.9328 0.9514 DCdectector 0.9662 0.9437 0.9858 0.9643 0.9546 0.8906 0.9669 0.9272 0.9458 MTCL-UAV 0.9807 0.9641 0.9954 0.9795 0.9583 0.8859 0.9878 0.9341 0.9568 PIEDRN 0.9474 0.9462 0.9474 0.9474 0.9808 0.9808 0.9808 0.9807 0.9636 Table 3.
The fault diagnosis results obtained on the FW-UAV dataset.
-
Noise type Method Evaluation metrics ACC PRE REC F1 score Normal data SAE[34] 0.9455 0.9434 0.7116 0.7981 LSTM-AE[35] 0.9496 0.8866 0.8021 0.8301 LSTM-SAE[36] 0.9432 0.8483 0.7949 0.8286 Stacked-LSTM[37] 0.8719 0.7091 0.3188 0.4119 Itransformer[38] 0.9236 0.9660 0.5520 0.6917 TMSxier[39] 0.9643 0.9860 0.7977 0.8734 RSTAE[40] 0.9695 0.9592 0.8426 0.8934 PIEDRN 0.9931 0.9933 0.9931 0.9930 20 dB SNR SAE 0.9431 0.9870 0.6521 0.7754 LSTM-AE 0.9479 0.9368 0.7203 0.8063 LSTM-SAE 0.9373 0.8738 0.7314 0.7790 Stacked-LSTM 0.8655 0.6707 0.2872 0.3770 Itransformer 0.8733 0.3112 0.7406 0.4138 TMSxier 0.9231 0.8743 0.5992 0.6886 RSTAE 0.9521 0.9360 0.7599 0.8319 PIEDRN 0.9897 0.9897 0.9897 0.9895 14 dB SNR SAE 0.9365 0.9955 0.6101 0.7489 LSTM-AE 0.9380 0.9031 0.7101 0.7794 LSTM-SAE 0.9331 0.8536 0.7308 0.7691 Stacked-LSTM 0.8597 0.6835 0.1285 0.2000 Itransformer 0.8380 0.3562 0.1415 0.1859 TMSxier 0.9104 0.8930 0.4672 0.6031 RSTAE 0.9436 0.9498 0.4672 0.7939 PIEDRN 0.9862 0.9888 0.9862 0.9865 Table 4.
Comparison among the impacts of noise on the performance of different models.
-
State ACC PRE REC F1 score PIEDRN 0.9931 0.9933 0.9931 0.9930 Without DRN 0.9621 0.9658 0.9621 0.9625 Without $ \lambda $ 0.9897 0.9863 0.9897 0.9877 Table 5.
Results of ablation experiments conducted on the ALFA dataset.
Figures
(8)
Tables
(6)