-
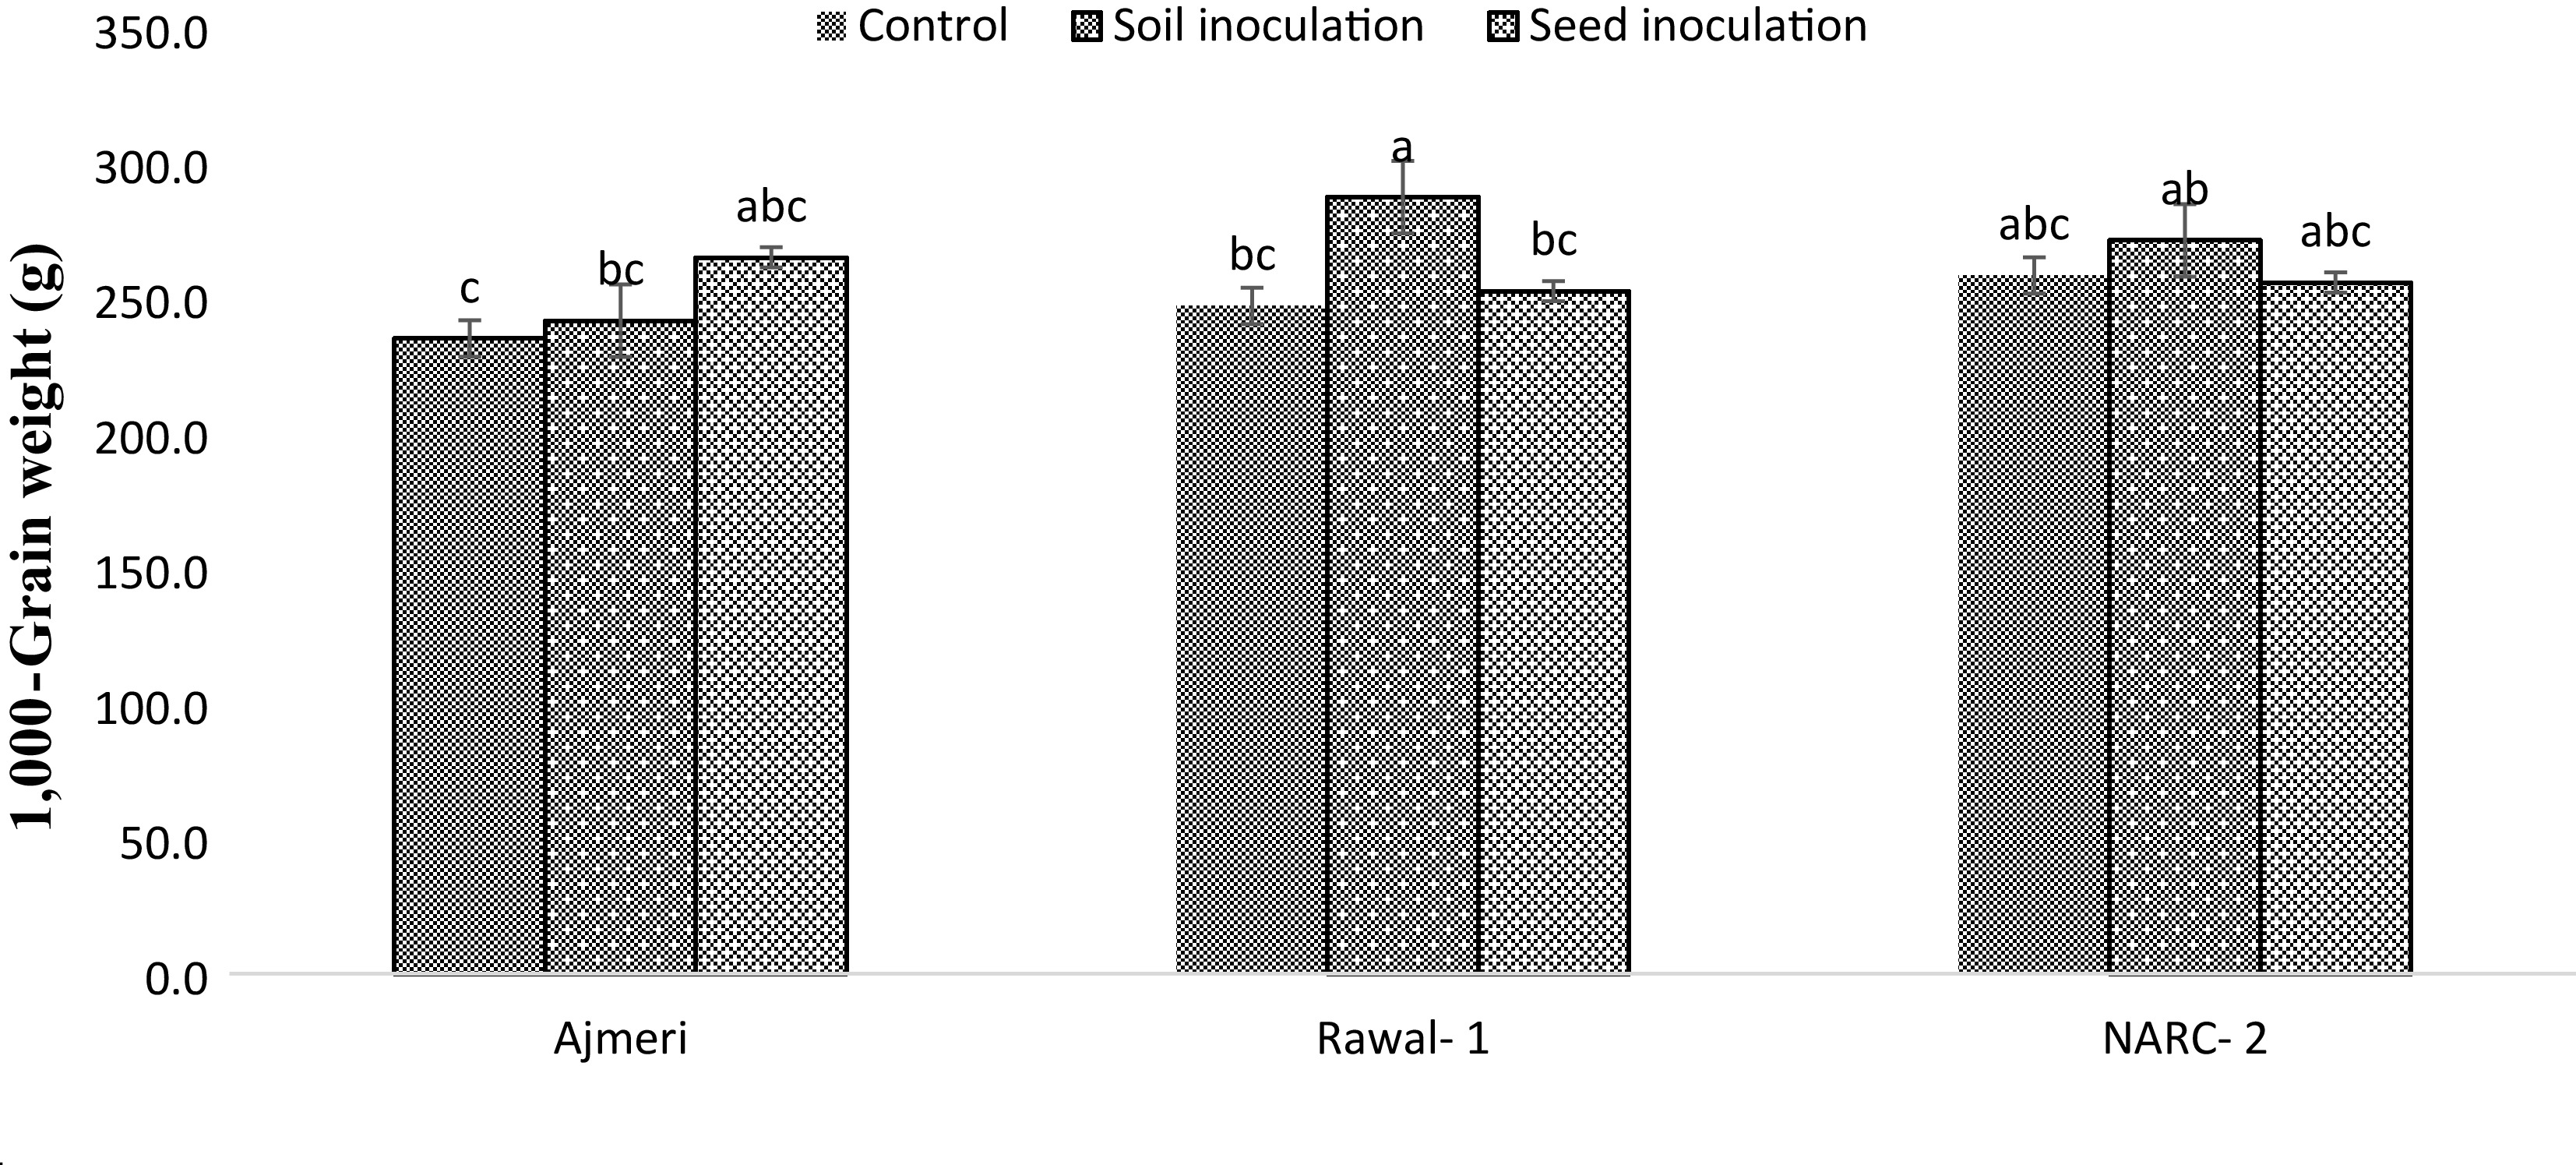
Figure 1.
Interactive effect of soybean varieties and inoculation techniques on 1,000-grain weight (g) of spring maize. The different lowercase letters indicate statistically significant differences among the treatments, as determined by Tukey's HSD test at p < 0.05. Means sharing the same lowercase letter are not significantly different.
-
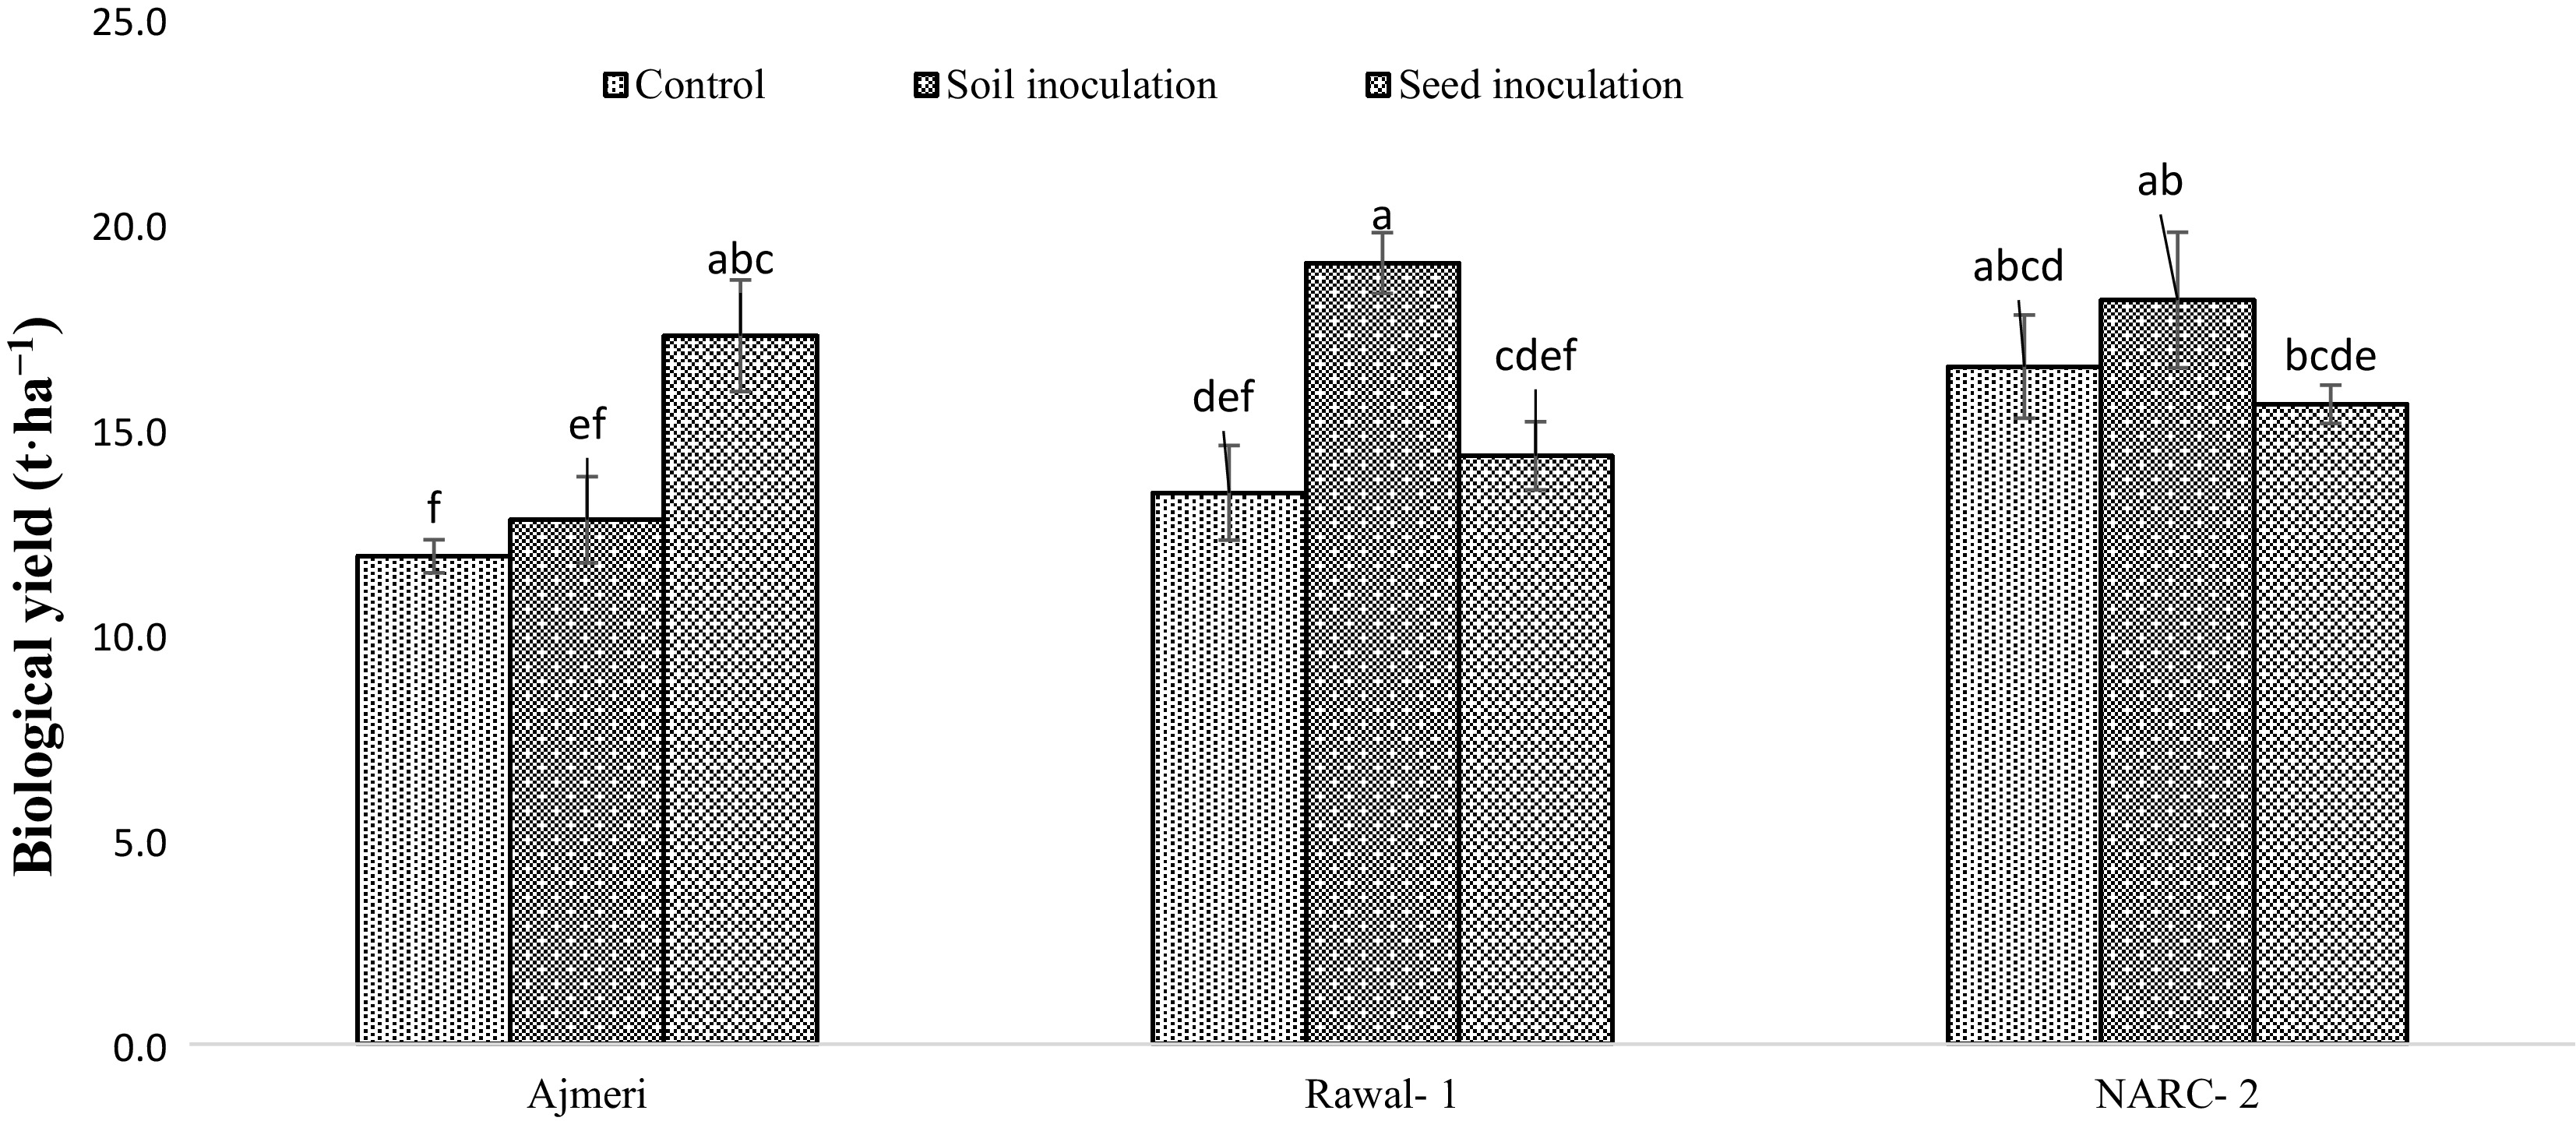
Figure 2.
Interactive effect of soybean varieties and inoculation techniques on biological yield (t·ha−1) of maize. The different lowercase letters indicate statistically significant differences among the treatments, as determined by Tukey's HSD test at p < 0.05. Means sharing the same lowercase letter are not significantly different.
-
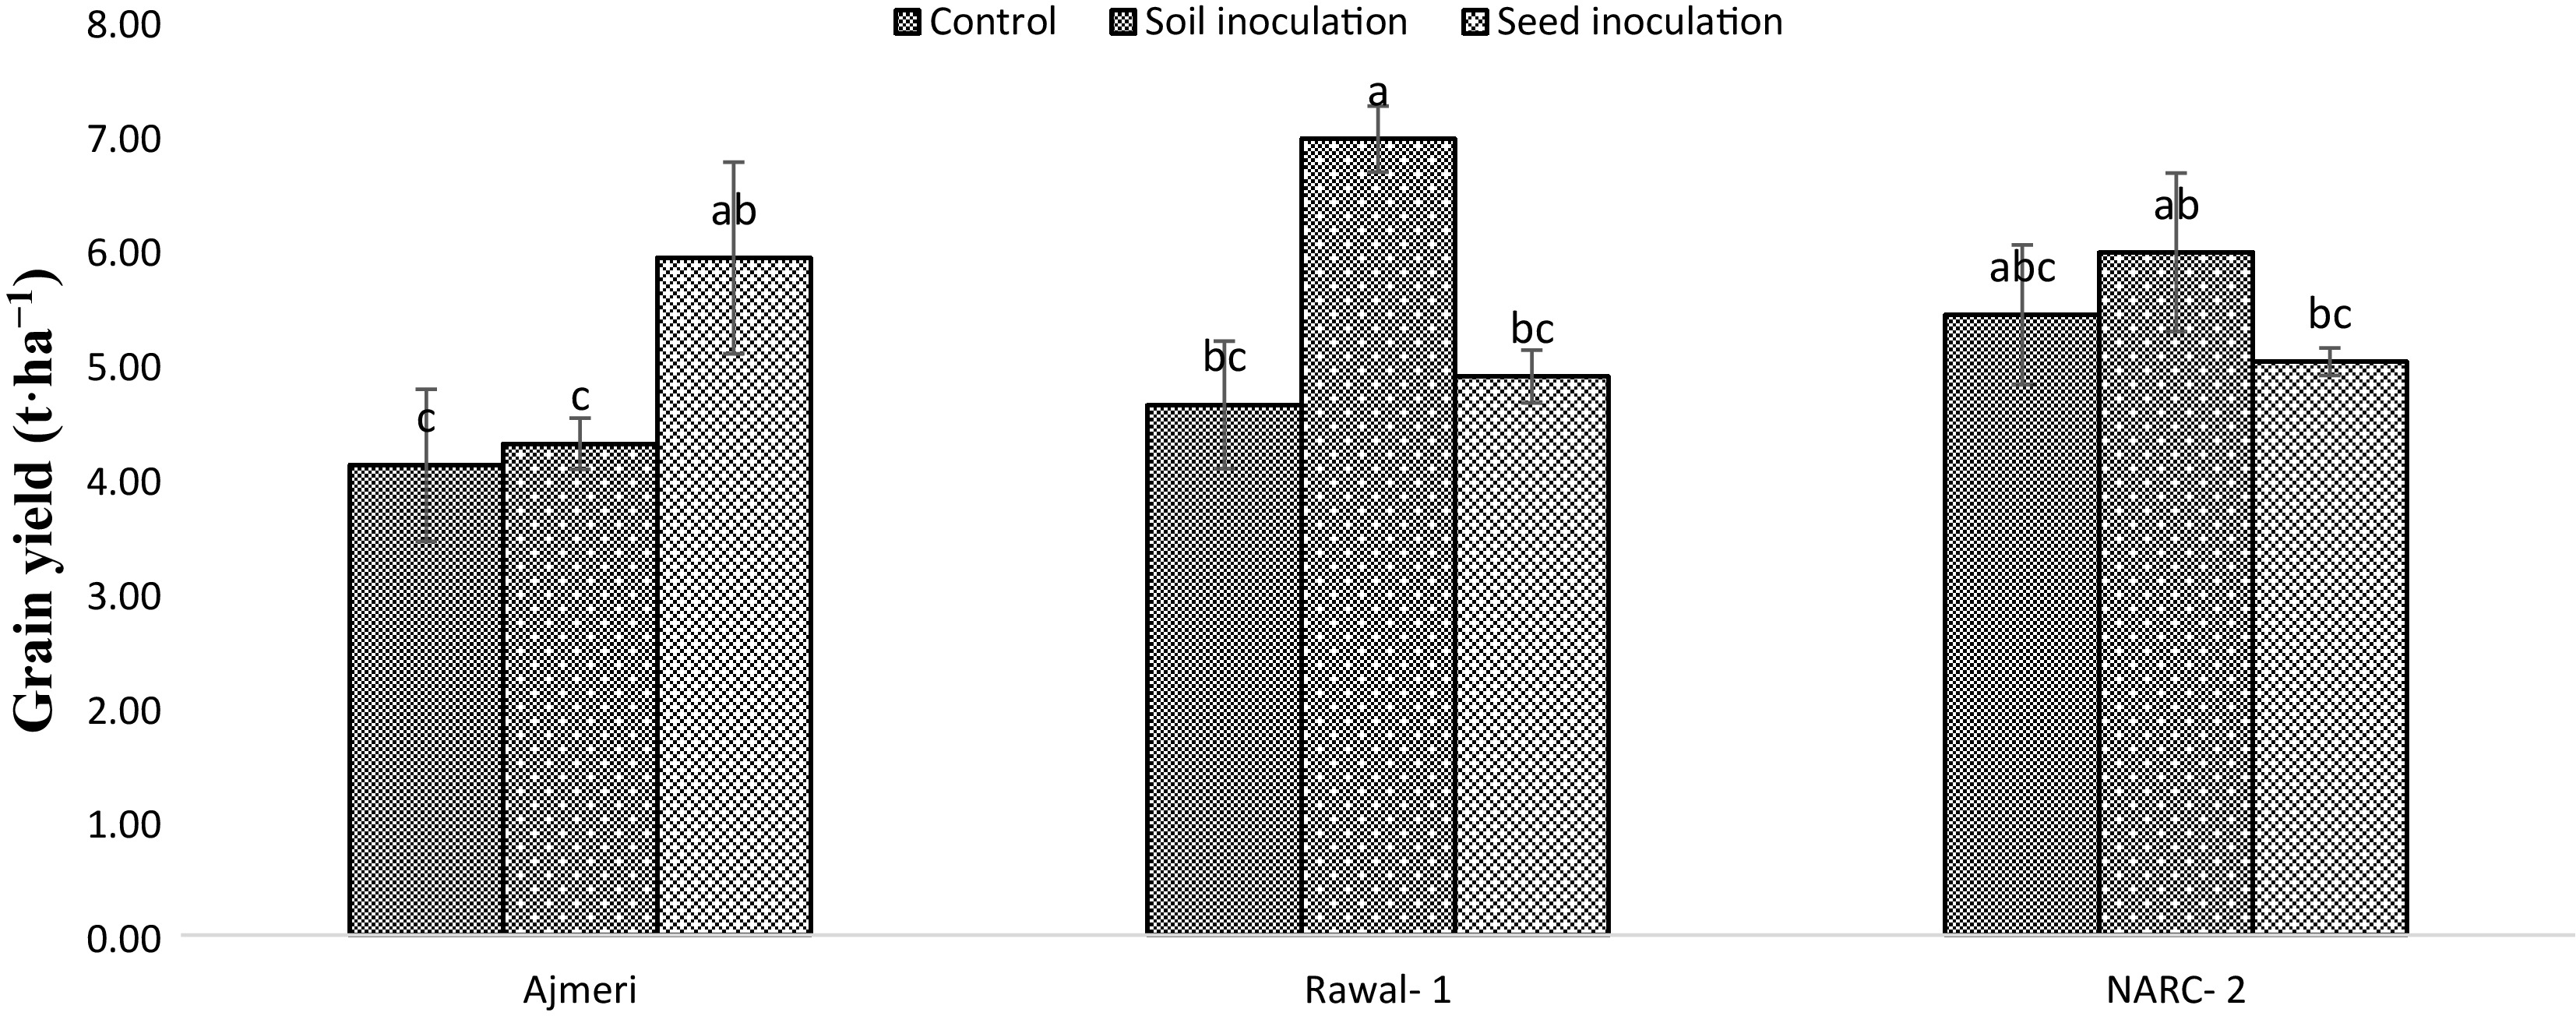
Figure 3.
Interactive effect of soybean varieties and inoculation techniques on grain yield (t ha−1) of maize. The different lowercase letters indicate statistically significant differences among the treatments, as determined by Tukey's HSD test at p < 0.05. Means sharing the same lowercase letter are not significantly different.
-
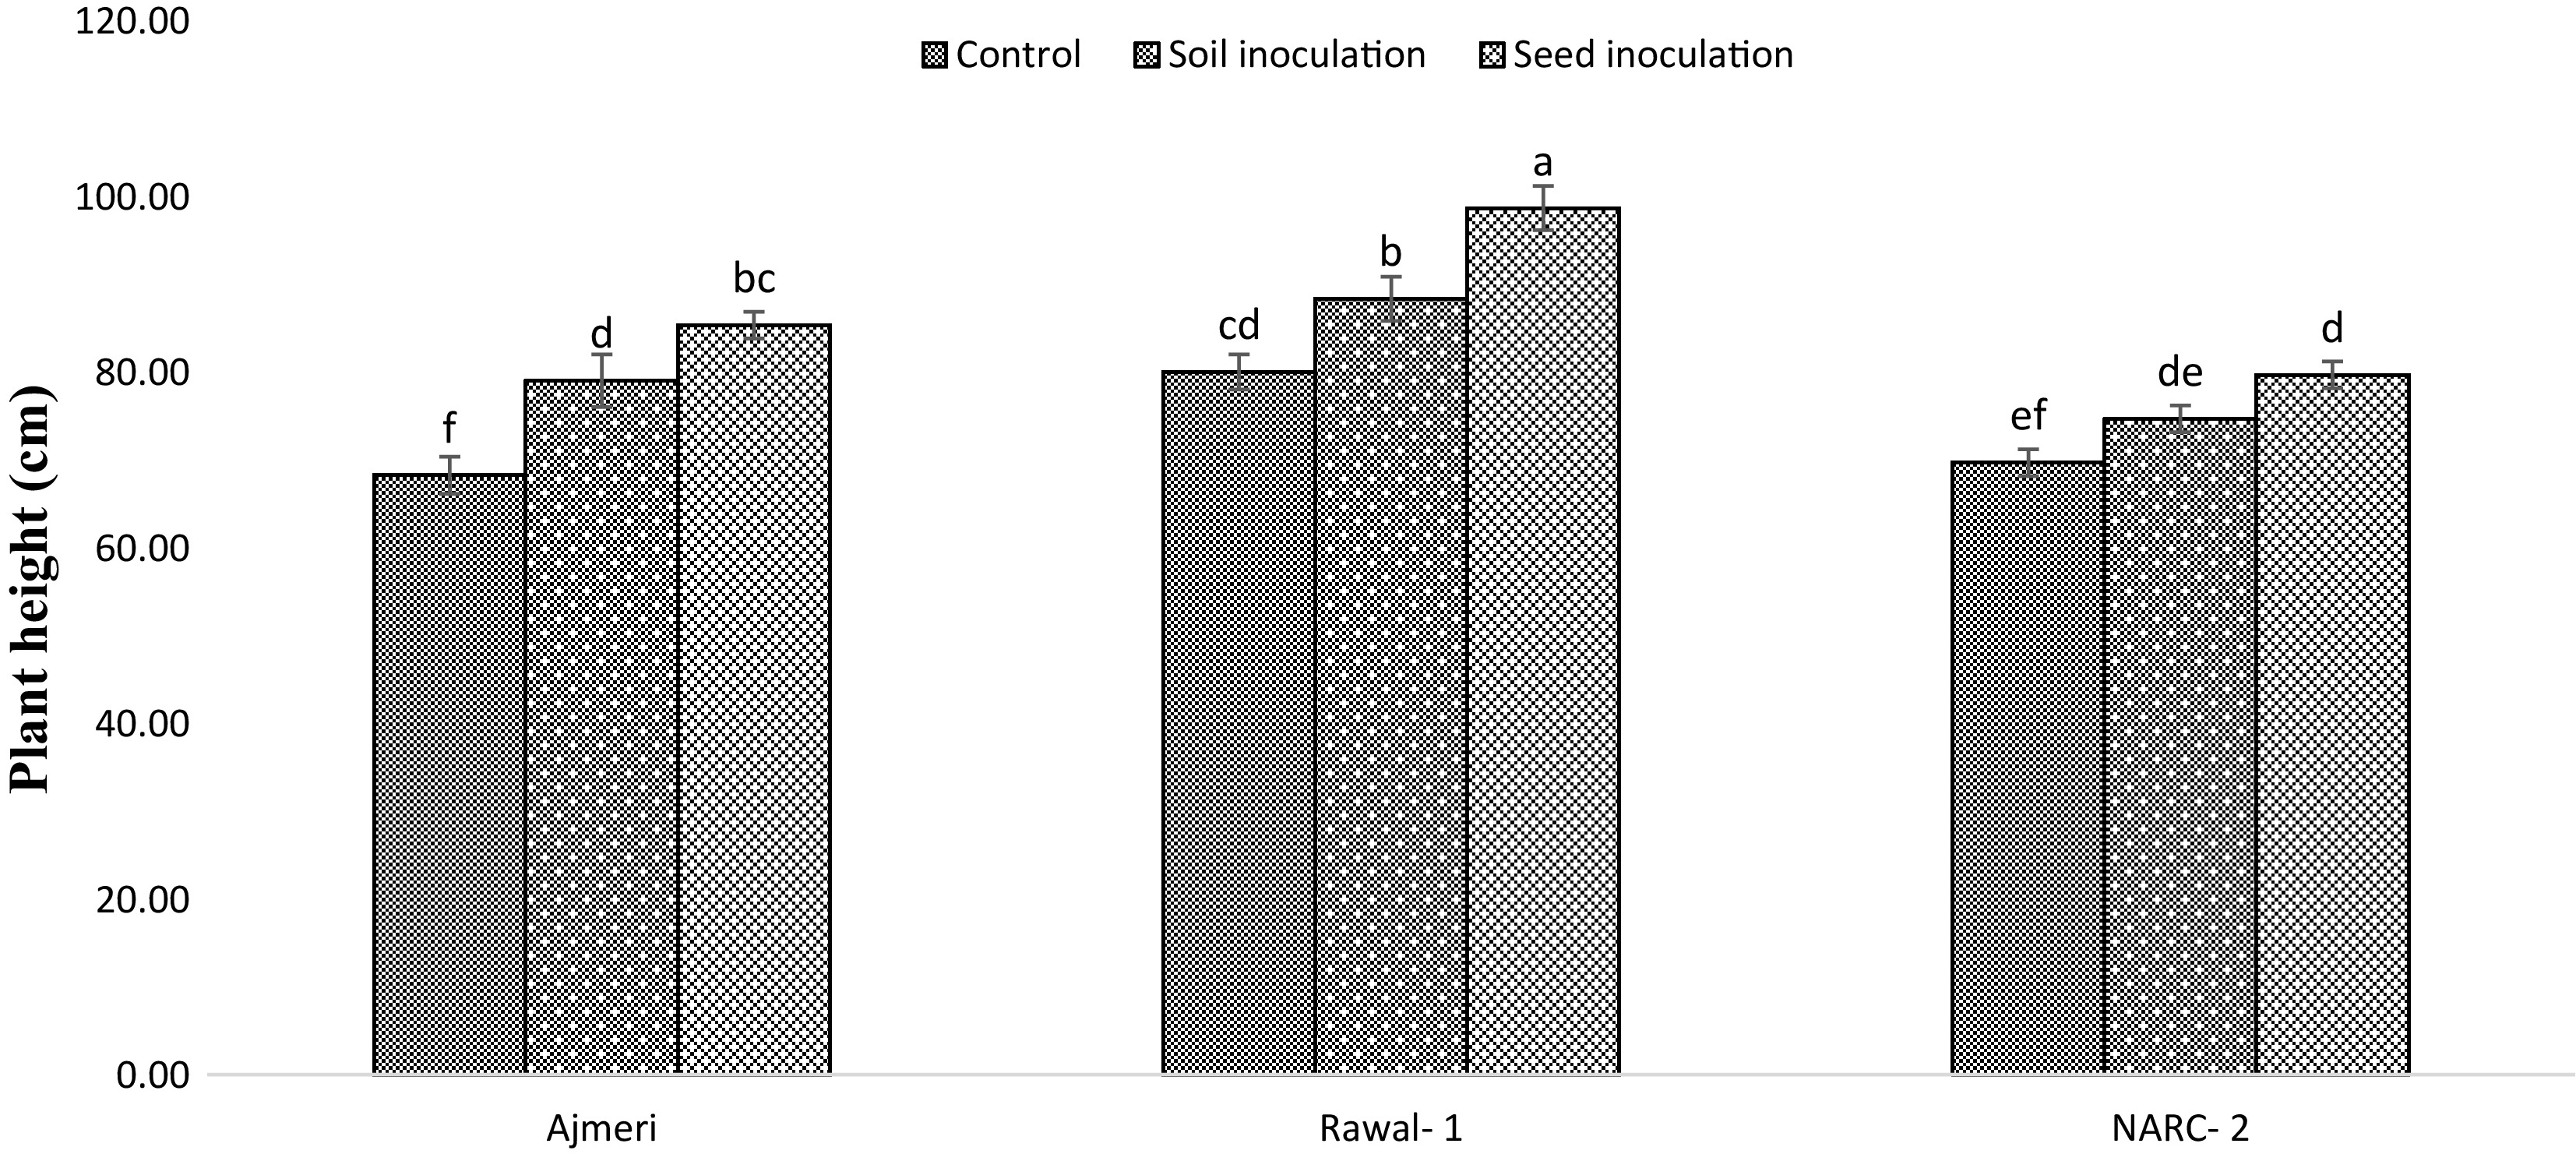
Figure 4.
Interactive effect of soybean varieties and inoculation techniques on plant height (cm) of soybean. The different lowercase letters indicate statistically significant differences among the treatments, as determined by Tukey's HSD test at p < 0.05. Means sharing the same lowercase letter are not significantly different.
-
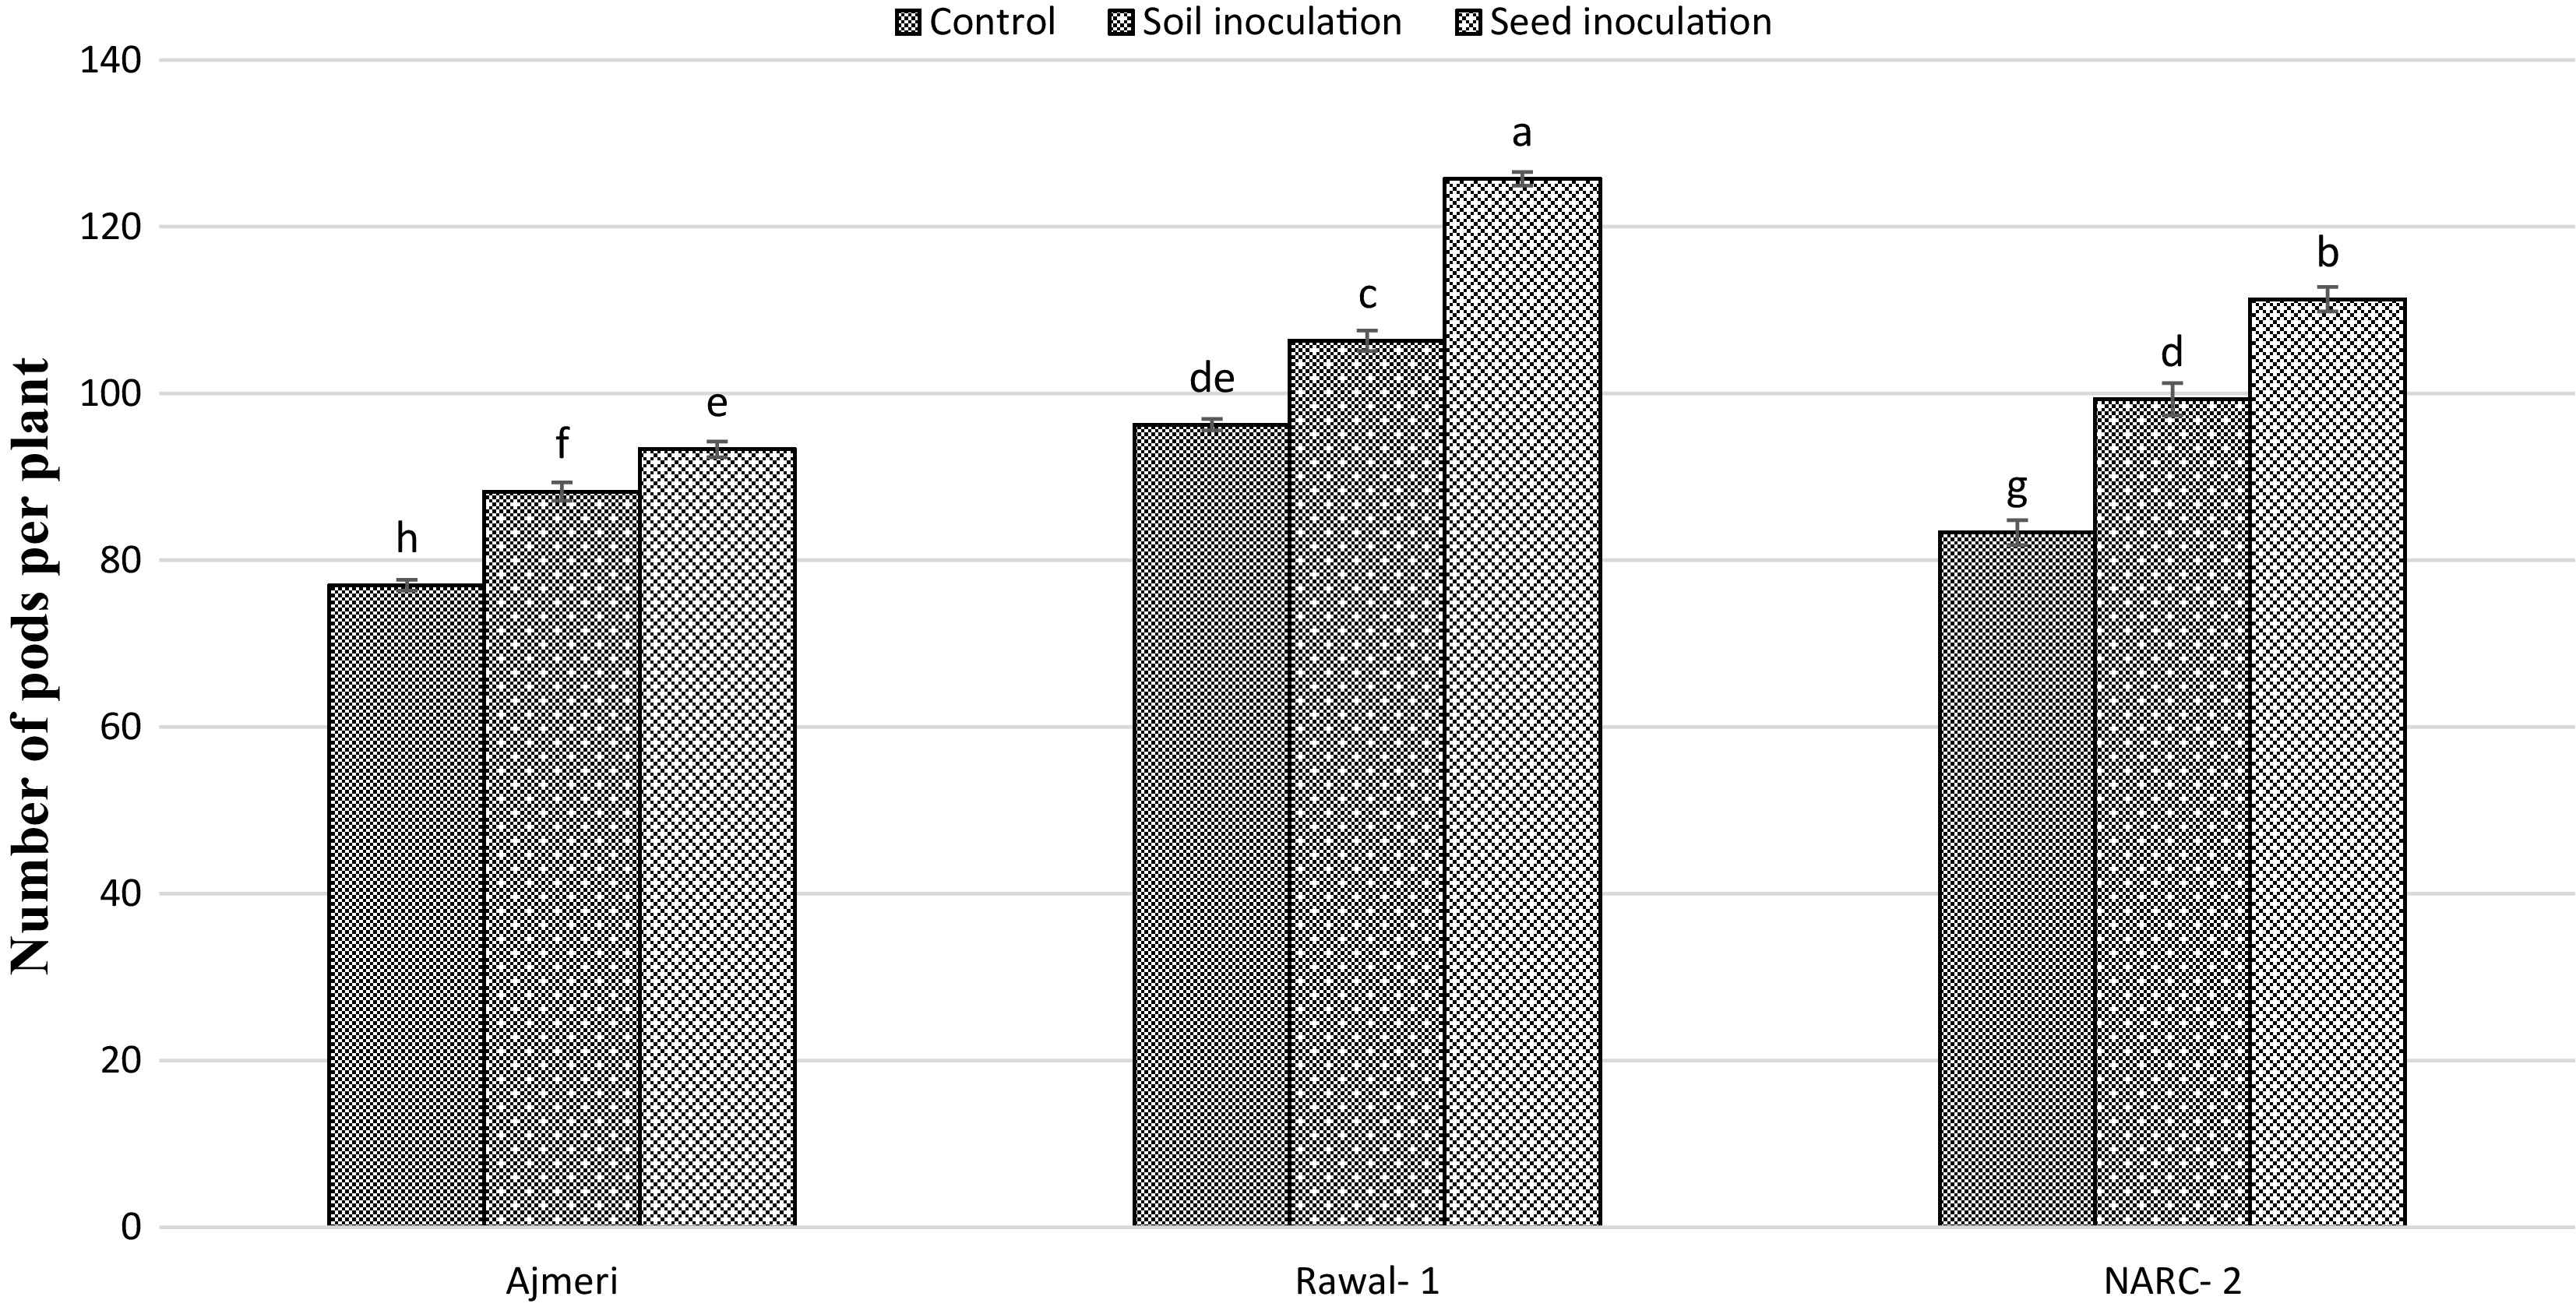
Figure 5.
Interactive effect of soybean varieties and inoculation techniques on number of pods per plant of soybean. The different lowercase letters indicate statistically significant differences among the treatments, as determined by Tukey's HSD test at p < 0.05. Means sharing the same lowercase letter are not significantly different.
-
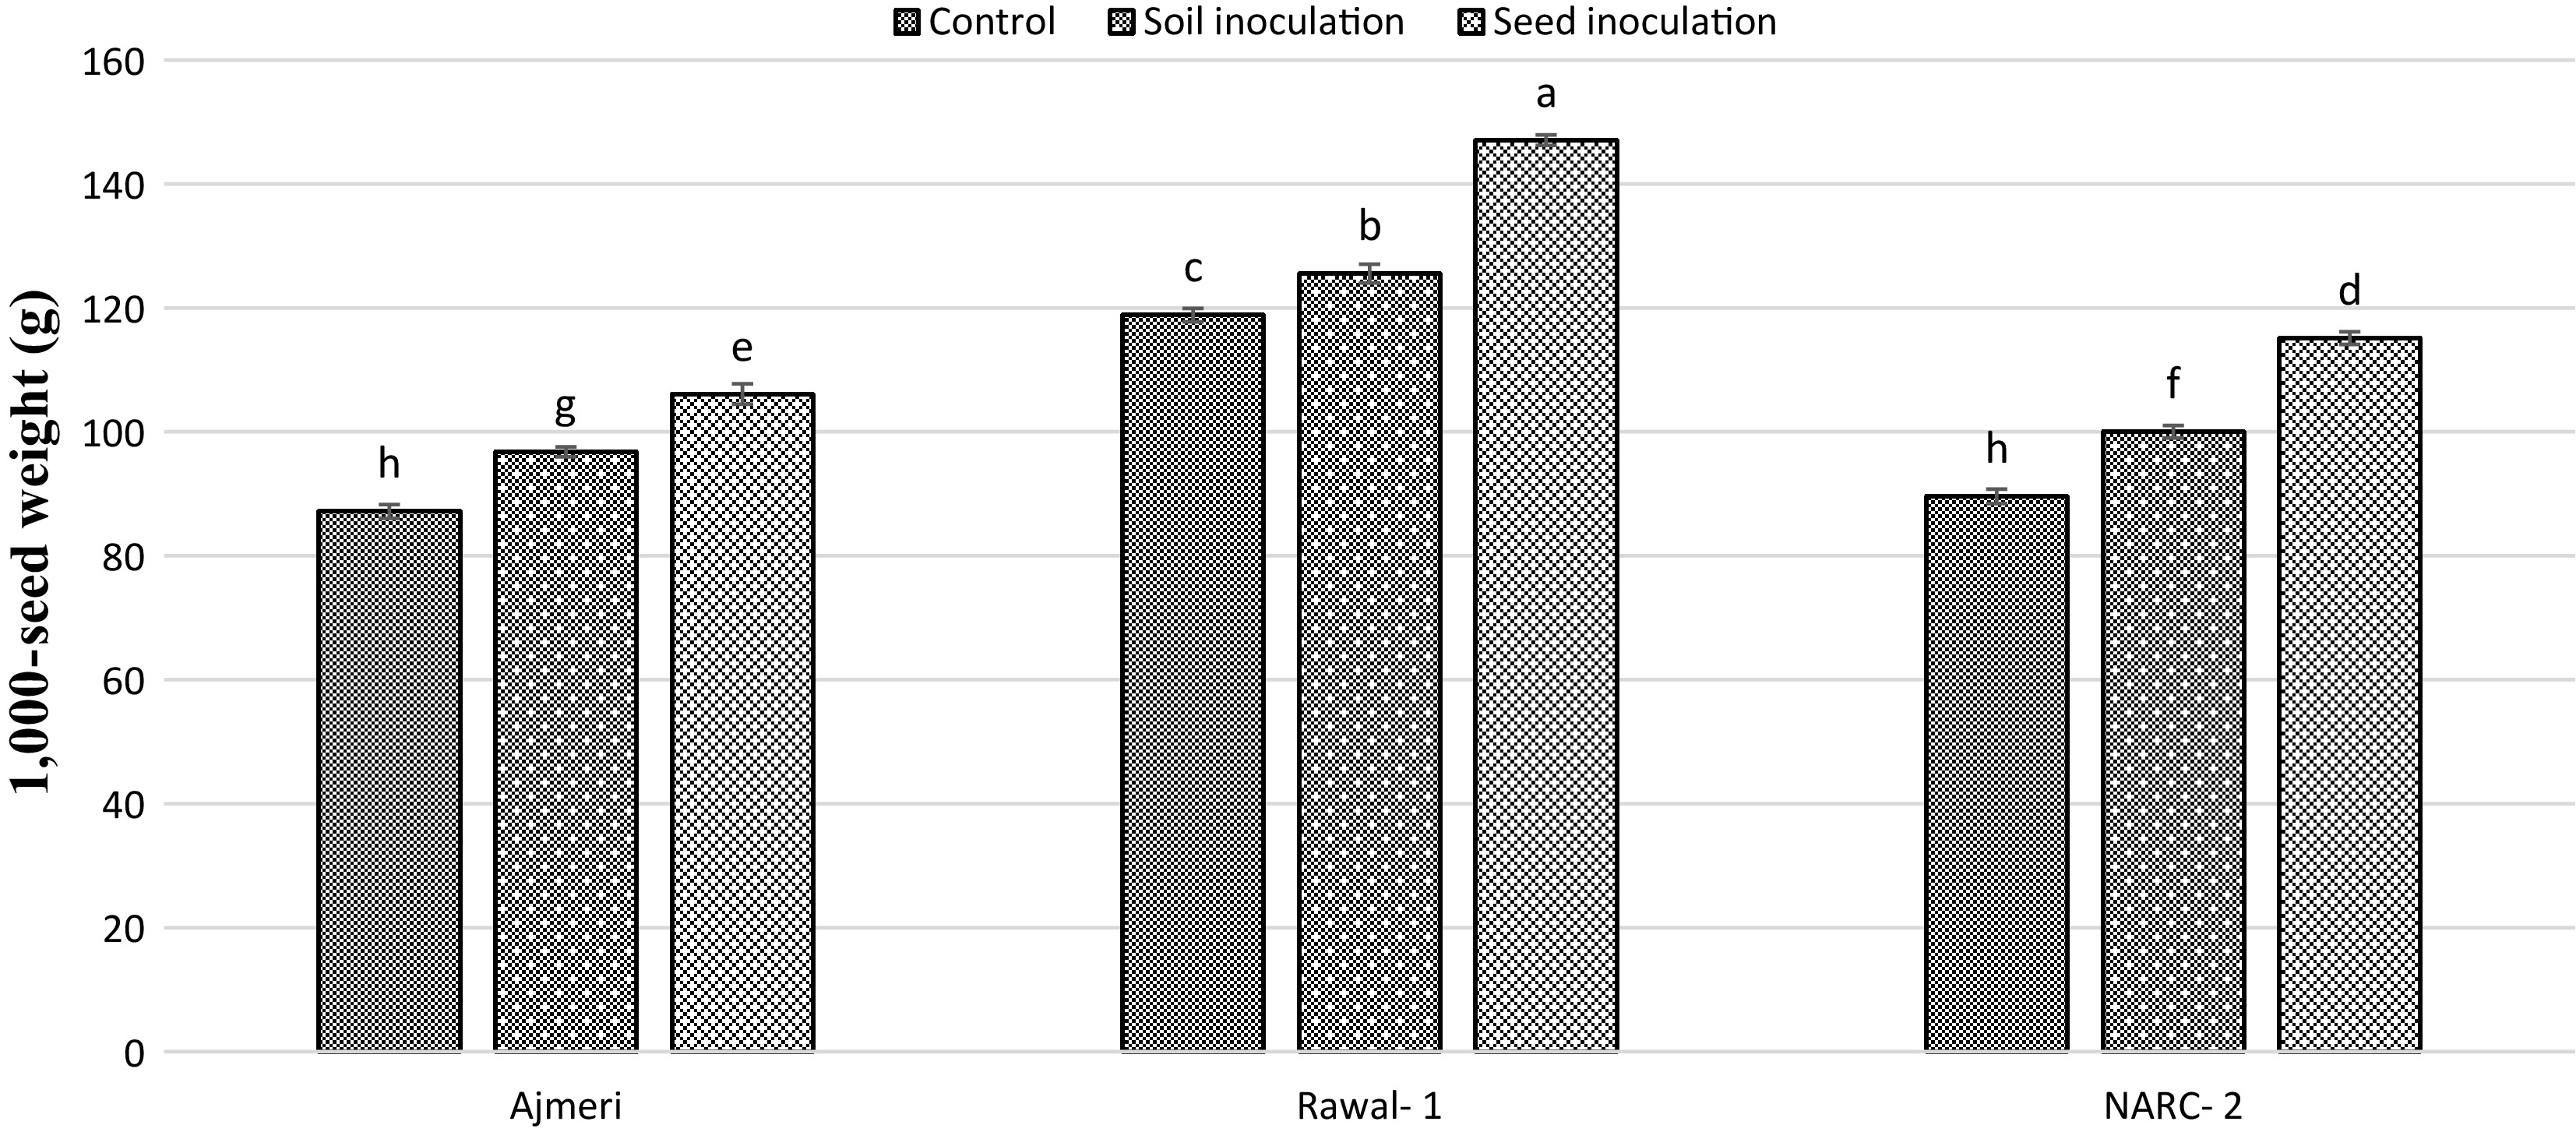
Figure 6.
Interactive effect of soybean varieties and inoculation techniques on 1,000-grain weight (g) of soybean. The different lowercase letters indicate statistically significant differences among the treatments, as determined by Tukey's HSD test at p < 0.05. Means sharing the same lowercase letter are not significantly different.
-
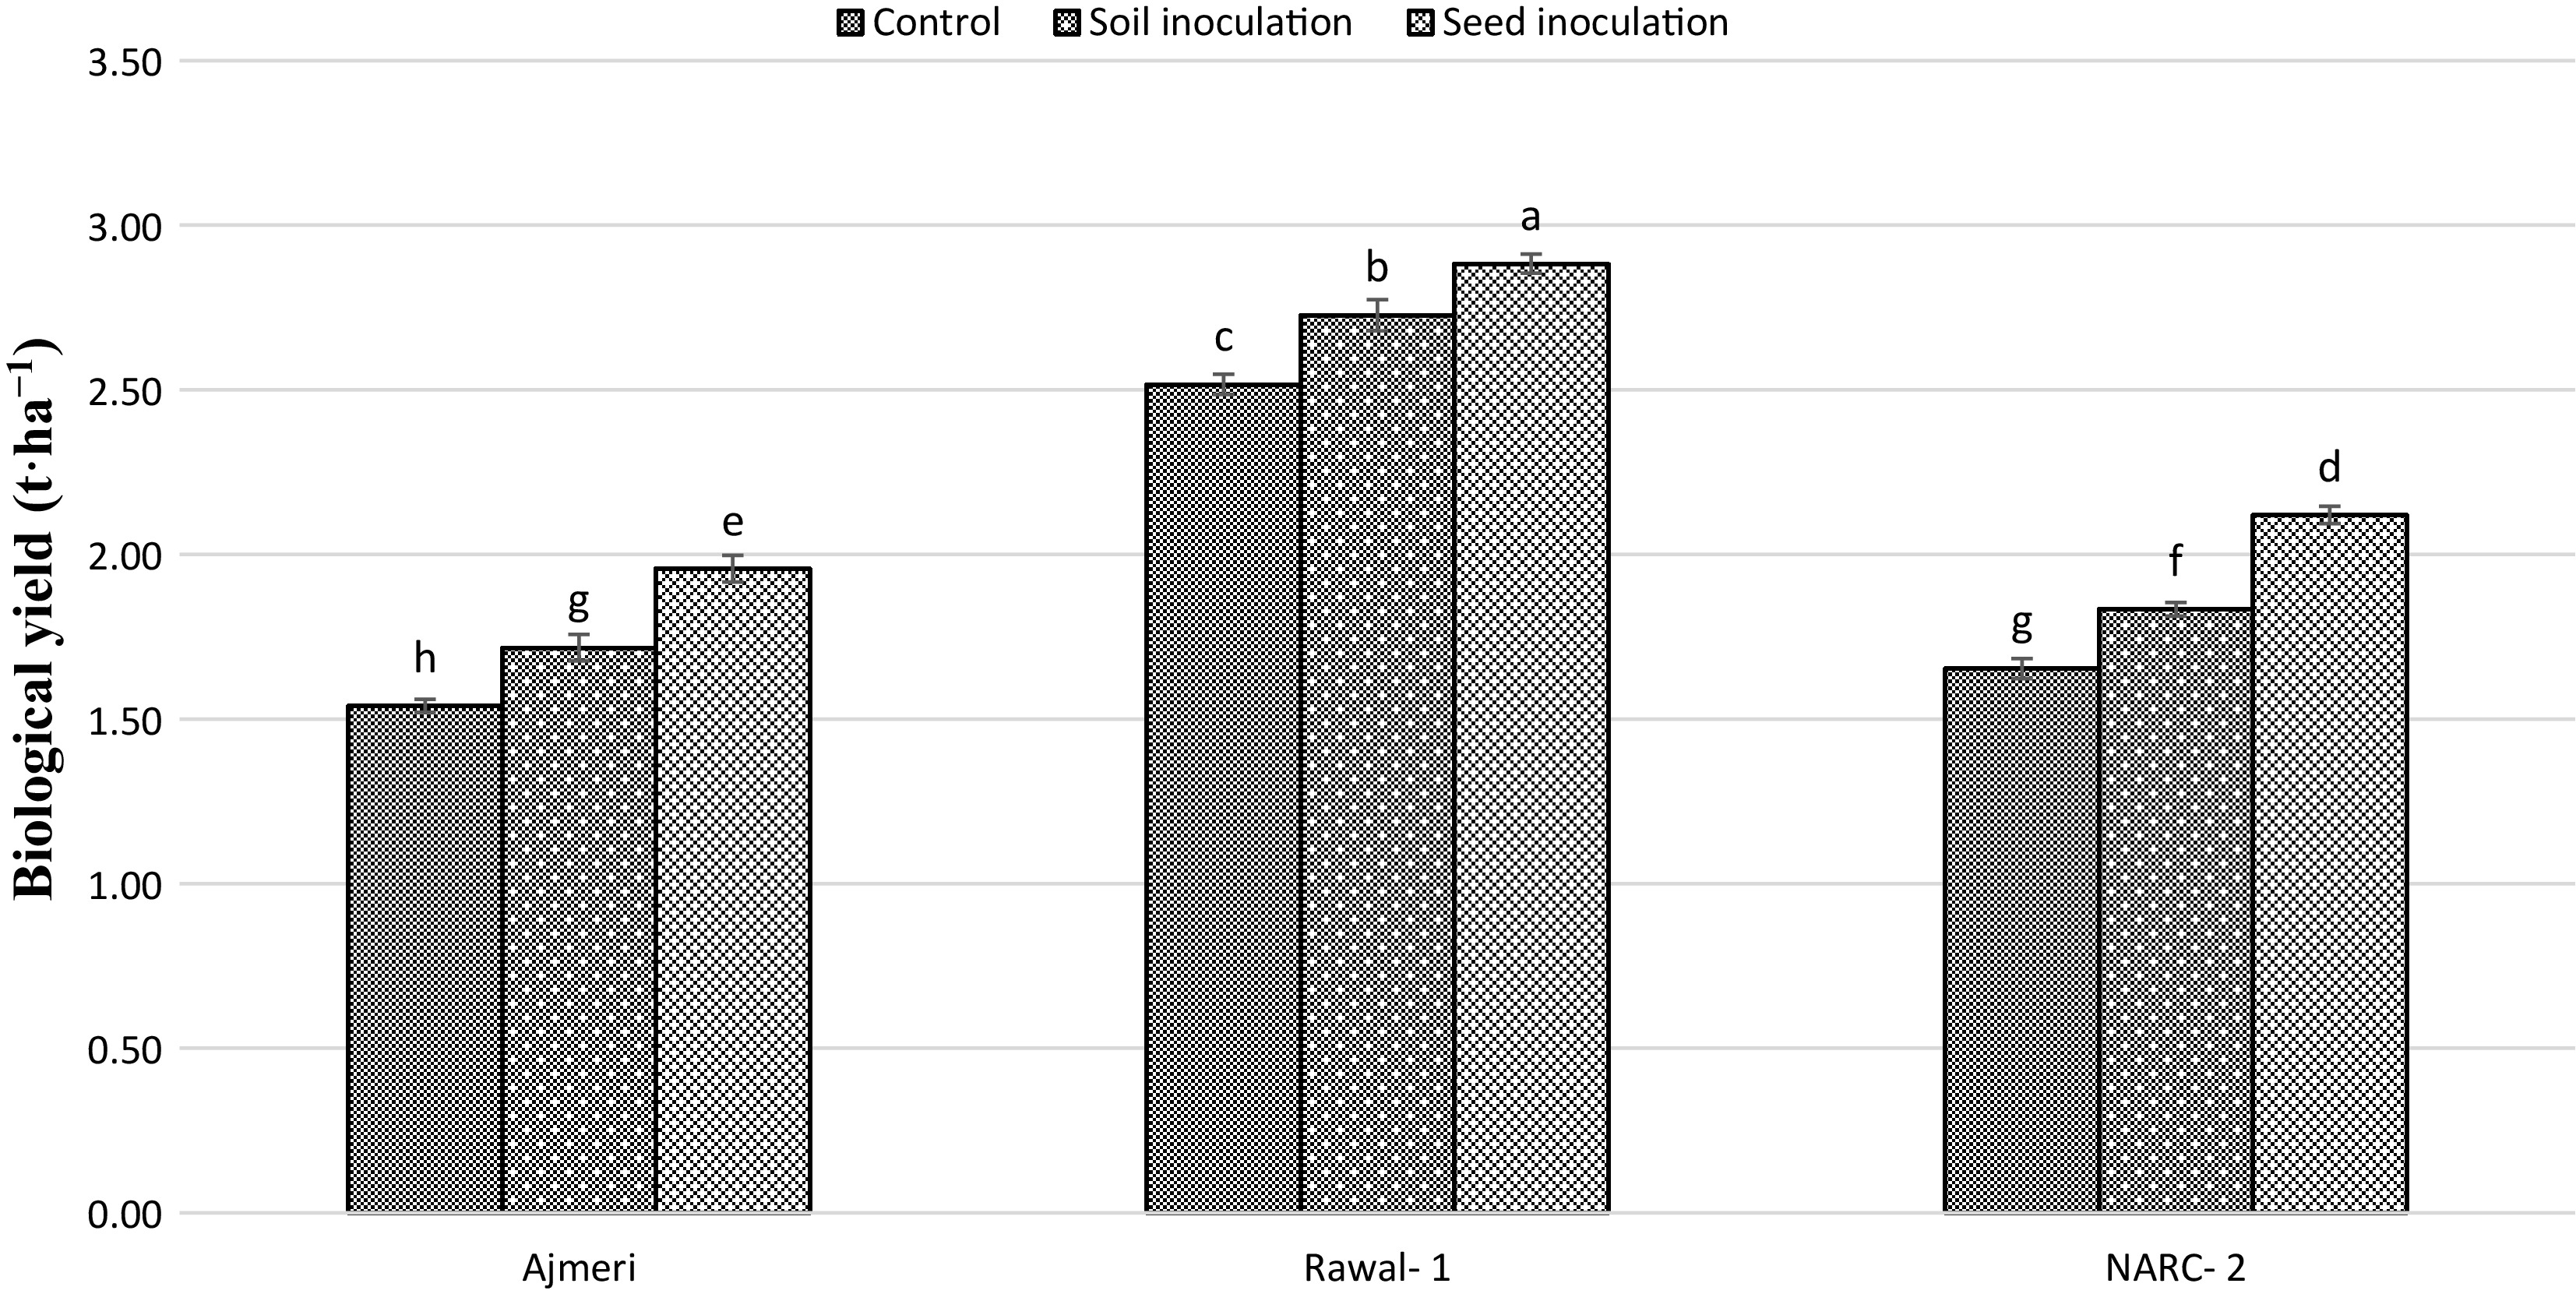
Figure 7.
Interactive effect of soybean varieties and inoculation techniques on biological yield (t·ha−1) of soybean. The different lowercase letters indicate statistically significant differences among the treatments, as determined by Tukey's HSD test at p < 0.05. Means sharing the same lowercase letter are not significantly different.
-
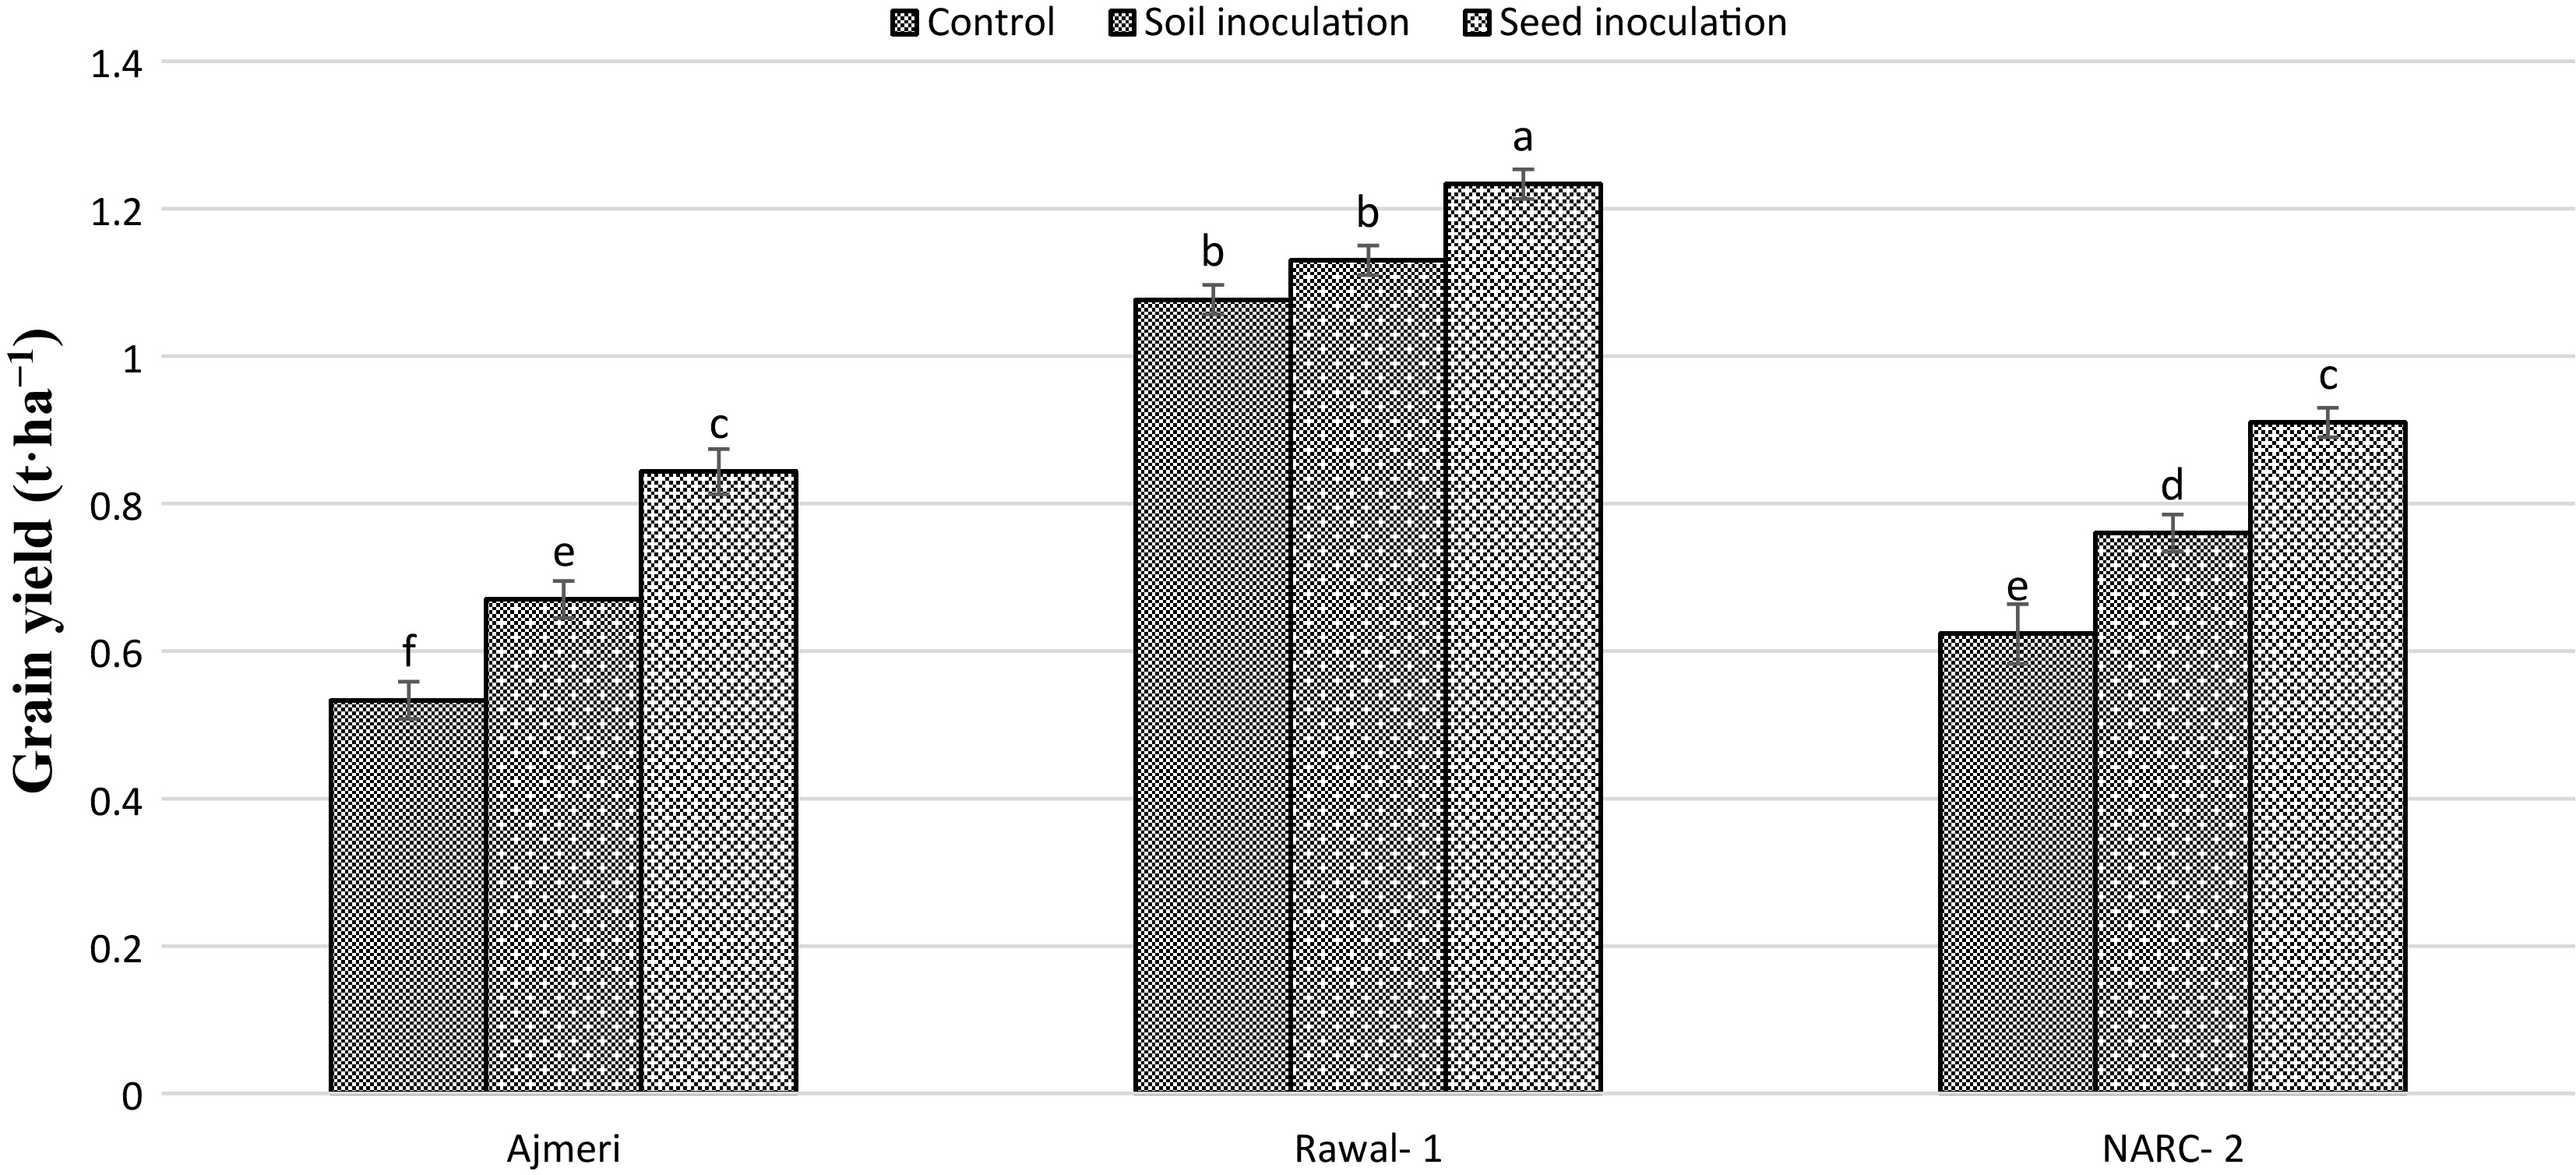
Figure 8.
Interactive effect of soybean varieties and inoculation techniques on grain yield (t·ha−1) of soybean. The different lowercase letters indicate statistically significant differences among the treatments, as determined by Tukey's HSD test at p < 0.05. Means sharing the same lowercase letter are not significantly different.
-
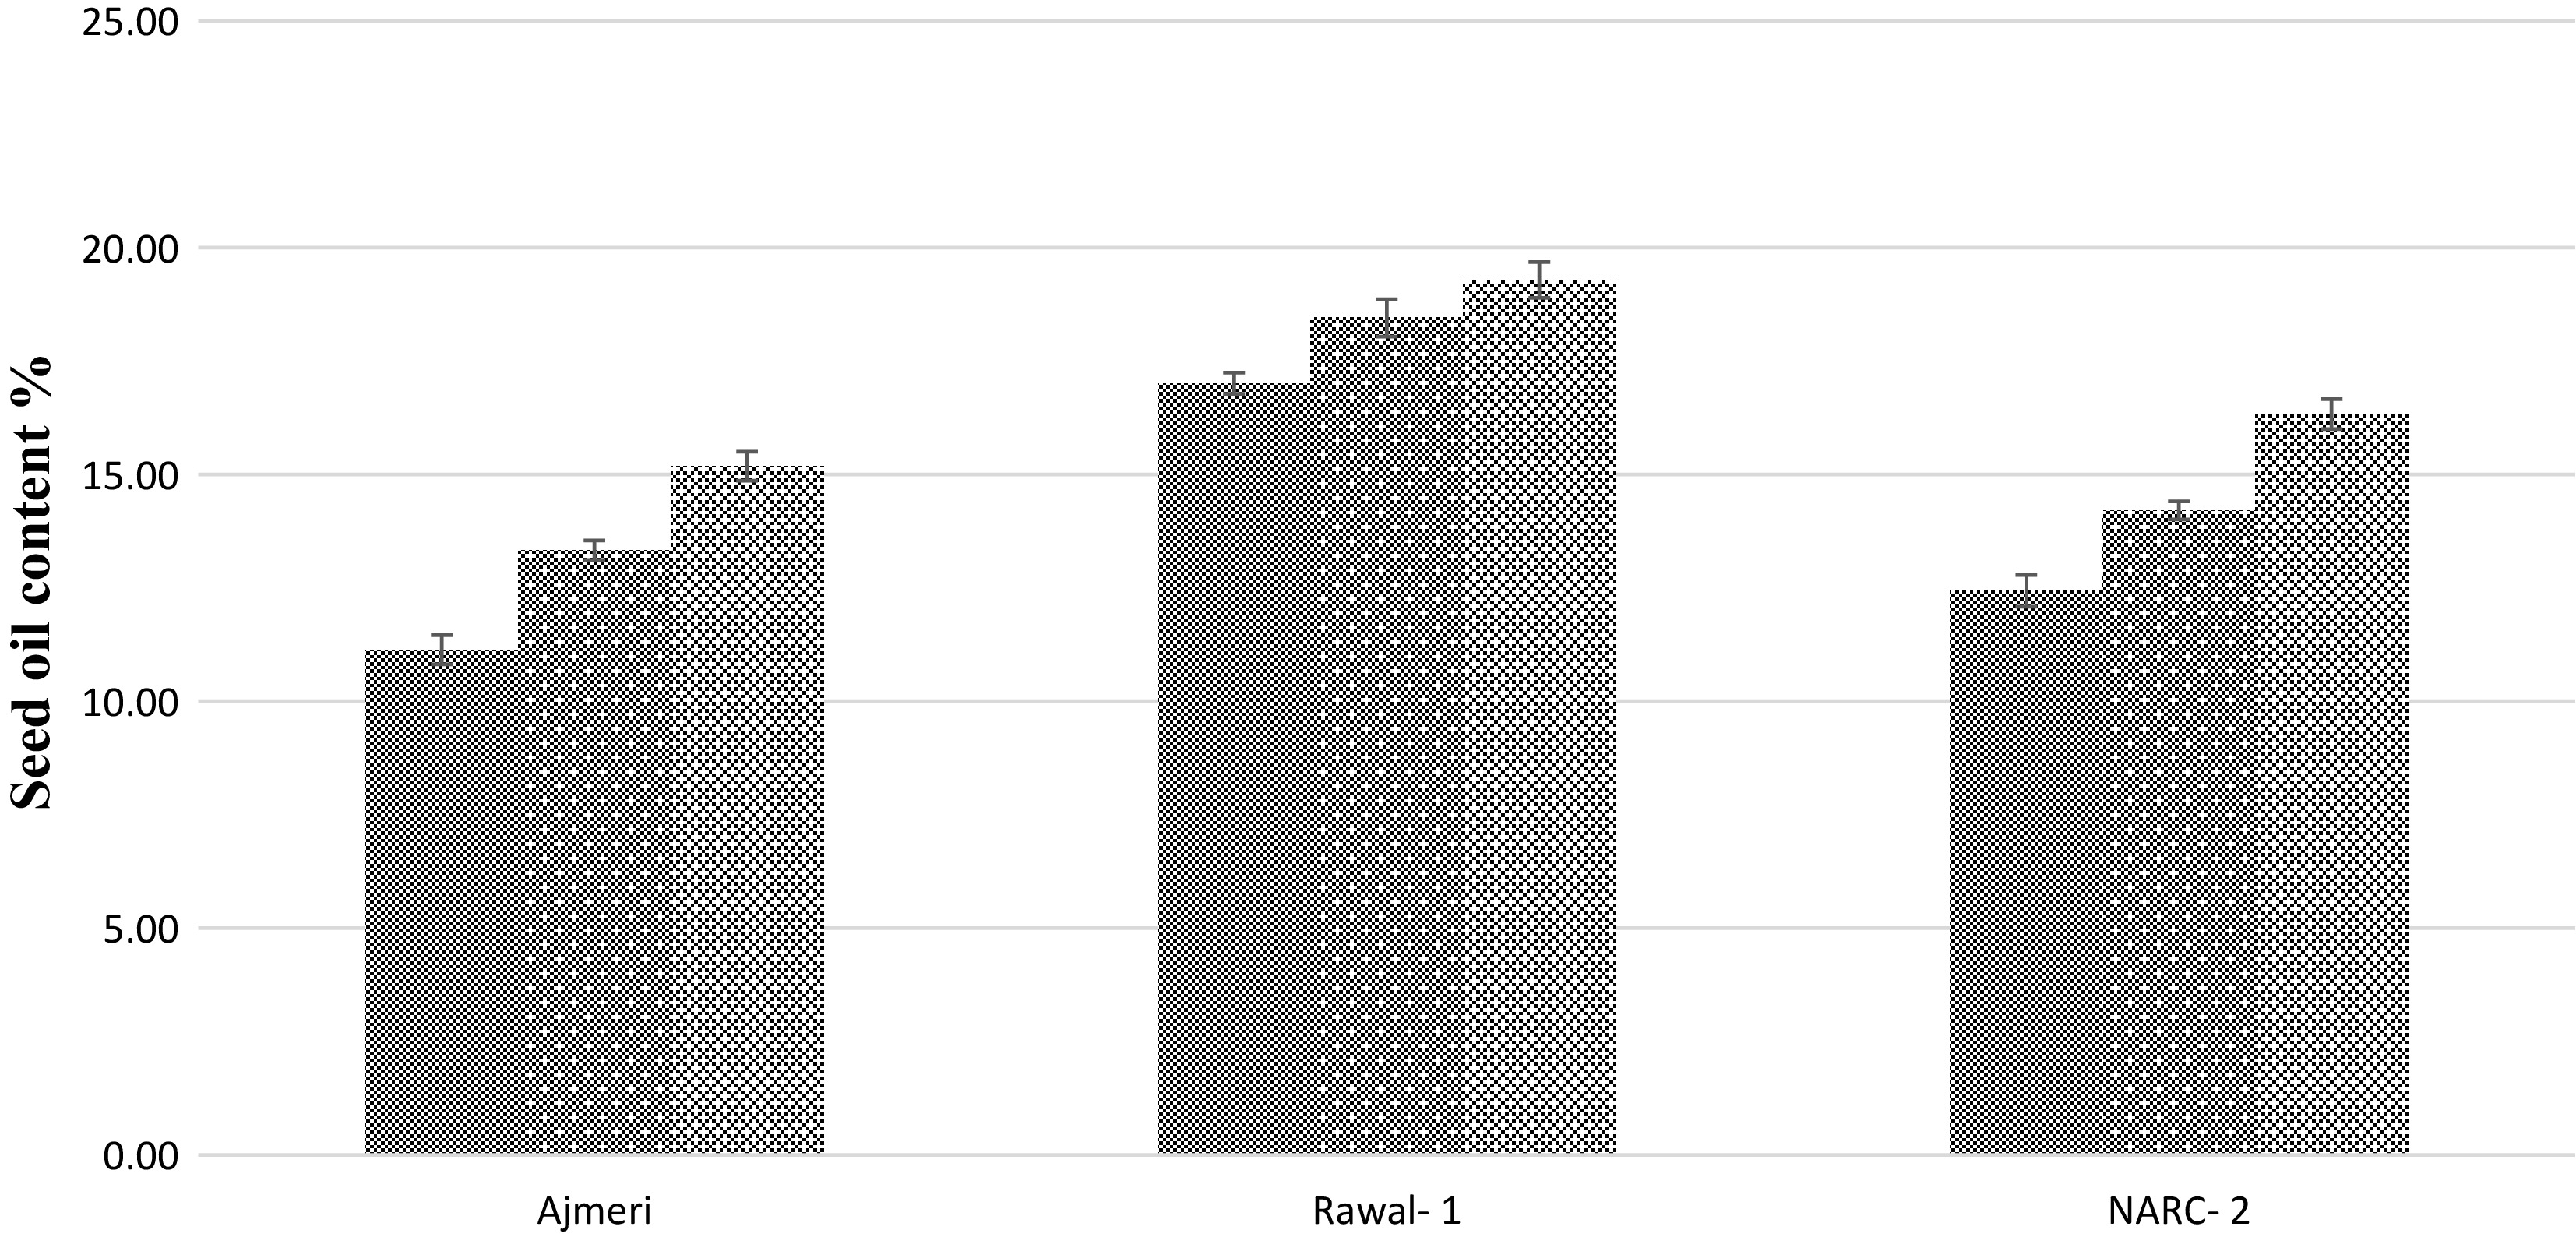
Figure 9.
Interactive effect of soybean varieties and inoculation techniques on seed oil content (%) of soybean. The different lowercase letters indicate statistically significant differences among the treatments, as determined by Tukey's HSD test at p < 0.05. Means sharing the same lowercase letter are not significantly different.
-
Plant height (cm) 1,000-grain weight (g) Number of grains per cob Biological yield (t·ha−1) Grain yield (t·ha−1) Soybean varieties (V) Ajmeri 184.11 247.20 250.22 B 14.18 4.77 Rawal-1 186.78 262.31 284 A 16.03 5.49 NARC-2 188.29 261.80 265.22 AB 15.91 5.46 HSD (p ≤ 0.05) NS 13.47 21.07 1.45 0.66 Inoculation techniques (I) No inoculation 183.65 B 246.80 239 C 12.50 4.72 Soil inoculation 194.08 A 266.75 297 A 17.58 5.74 Seed inoculation 181.44 B 257.75 263.22 B 16.03 5.27 HSD (p ≤ 0.05) 5.51 13.47 21.07 1.45 0.66 Interaction (V × I) NS Fig. 1 * NS Fig. 2 * Fig. 3 * HSD (p ≤ 0.05) 32.19 3.46 1.57 Means not sharing a letter in common within a row differ significantly at the 5% probability level.The different uppercase letters indicate statistically significant differences among the treatments, as determined by Tukey's HSD test at p < 0.05. An asterisk (*) indicates statistical significance at p < 0.05. Table 1.
Influence of inoculation techniques and different soybean varieties on yield and yield related traits of spring maize.
-
Plant height
(cm)Number of
pods per plant1,000-grain weight
(g)Biological yield
(t·ha−1)Grain yield
(t·ha−1)Seed oil content (%) Soybean varieties (V) Ajmeri 77.52 B 86.44 C 96.68 C 1.73 C 0.68 C 13.21 C Rawal-1 89 A 109.14 A 130.48 A 2.70 A 1.14 A 18.24 A NARC-2 74.66 C 97.11 B 101.58 B 1.86 B 0.76 B 14.32 B HSD (p ≤ 0.05) 2.37 1.39 1.28 0.04 0.03 0.39 Inoculation techniques (I) No inoculation 72.63 C 85.52 C 98.53 C 1.90 C 0.74 C 13.52 C Soil inoculation 80.66 B 97.95 B 107.44 B 2.09 B 0.85 B 15.32 B Seed inoculation 87.88 A 110.11 A 122.77 A 2.32 A 0.99 A 16.93 A HSD (p ≤ 0.05) 2.37 1.39 1.28 0.04 0.03 0.39 Interaction (V × I) Fig. 4 * Fig. 5 * Fig. 6 * Fig. 7 * Fig. 8 * Fig. 9 * HSD (p ≤ 0.05) 5.66 3.32 3.08 0.09 0.07 0.93 Means not sharing a letter in common within a row differ significantly at the 5% probability level. The different uppercase letters indicate statistically significant differences among the treatments, as determined by Tukey's HSD test at p < 0.05. An asterisk (*) indicates statistical significance at p < 0.05. Table 2.
Influence of inoculation techniques and different soybean varieties on yield and yield related traits of soybean.
Figures
(9)
Tables
(2)