-
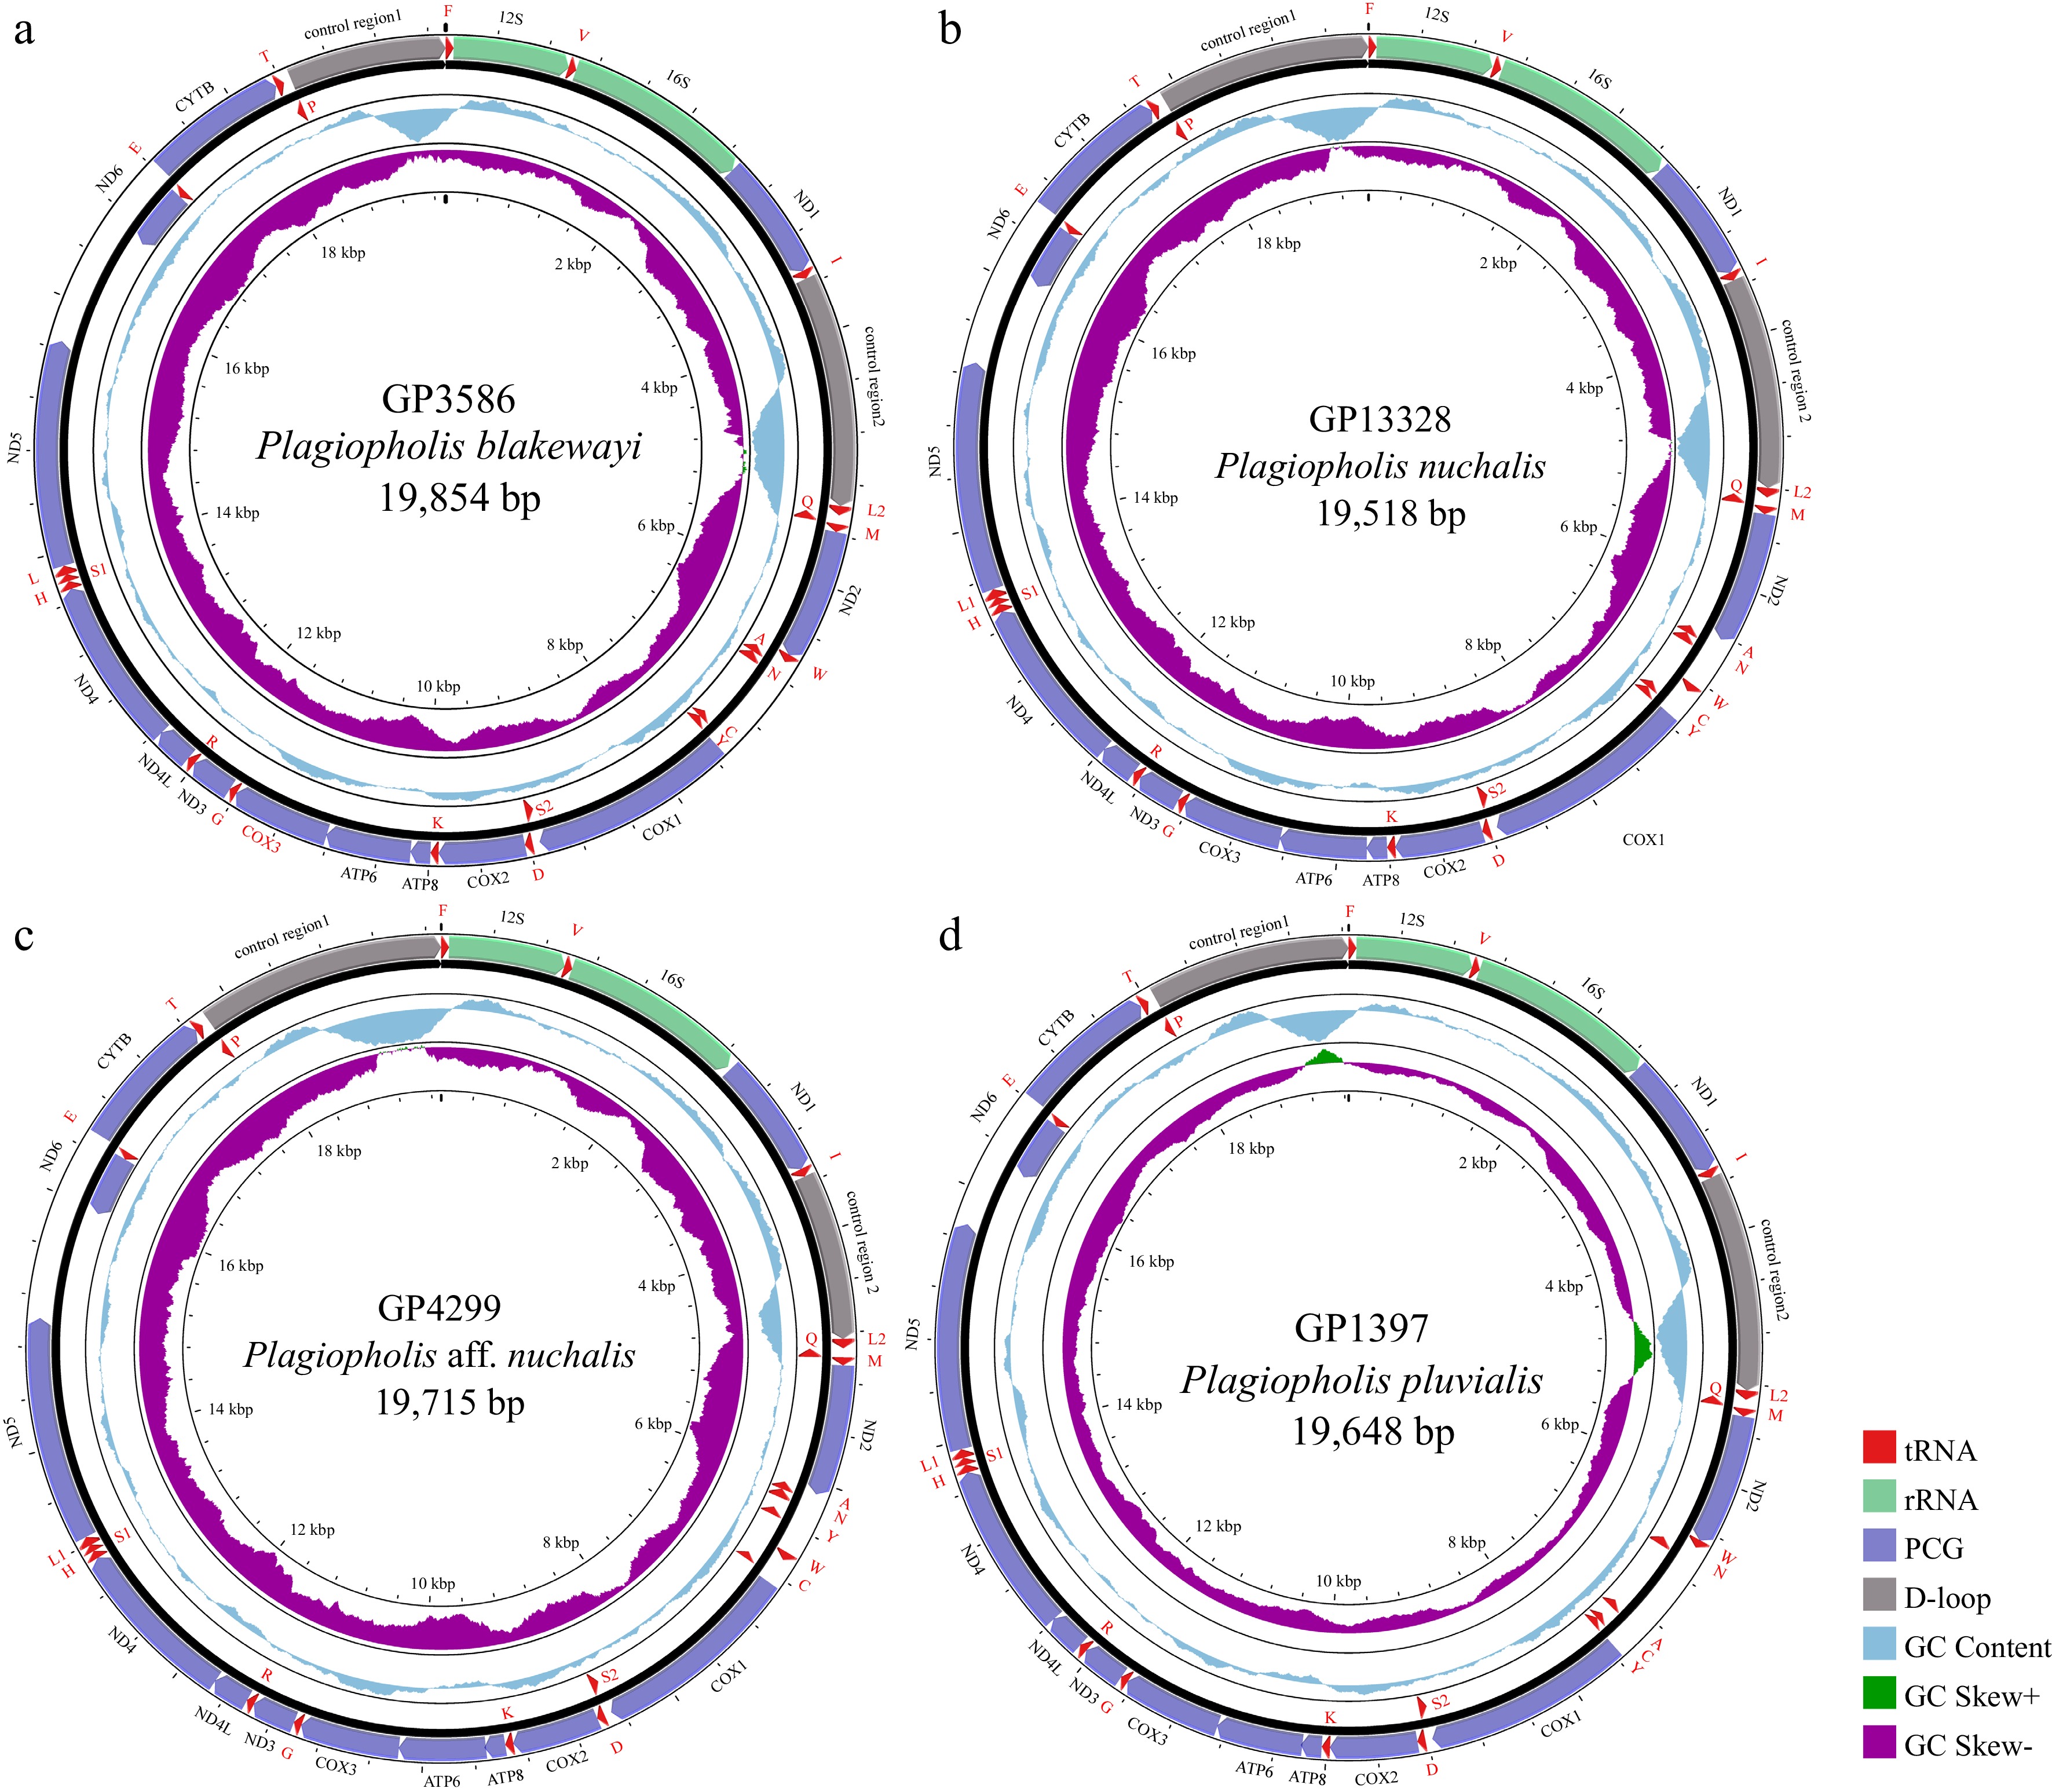
Figure 1.
Circular mitogenome maps of the representative individuals for (a) P. blakewayi, (b) P. nuchalis, (c) P. aff. nuchalis, and (d) P. pluvialis.
-
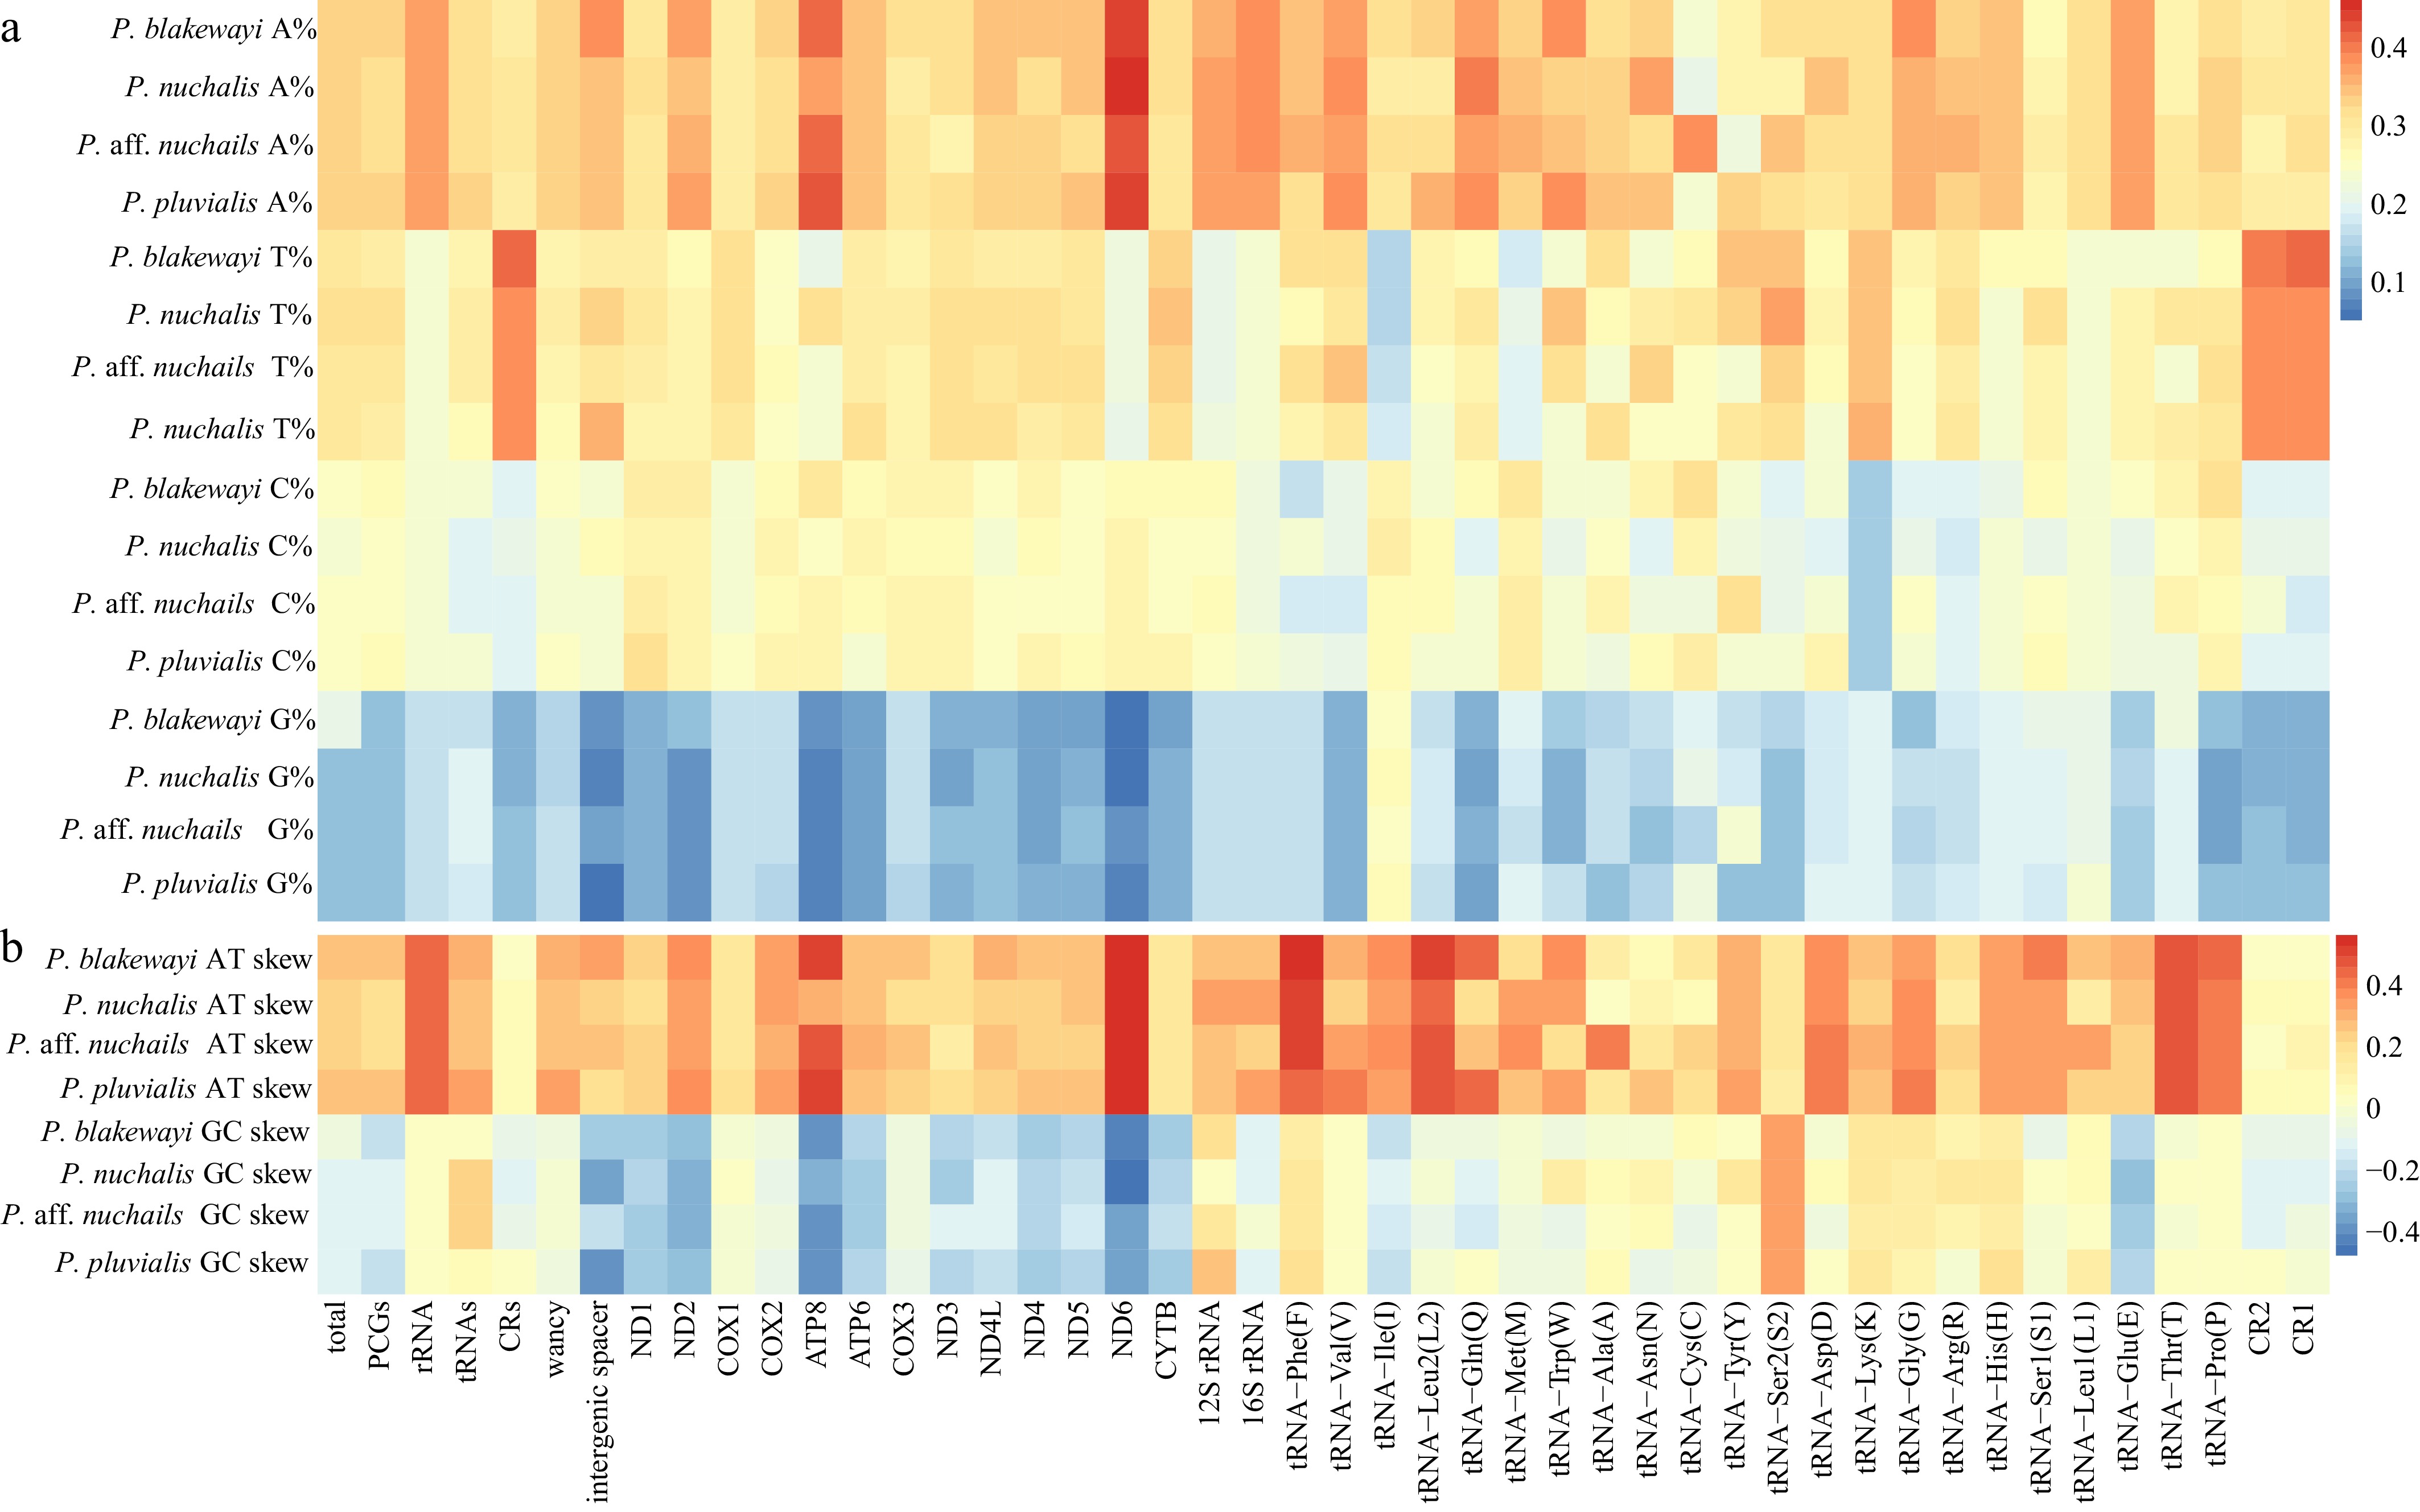
Figure 2.
Heatmap of (a) average mitochondrial nucleotide content and (b) skew for P. blakewayi, P. nuchalis, P. aff. nuchalis, and P. pluvialis. Left labels indicate nucleotide content and skew values for each species. X-axis labels indicate the genes and gene regions.
-
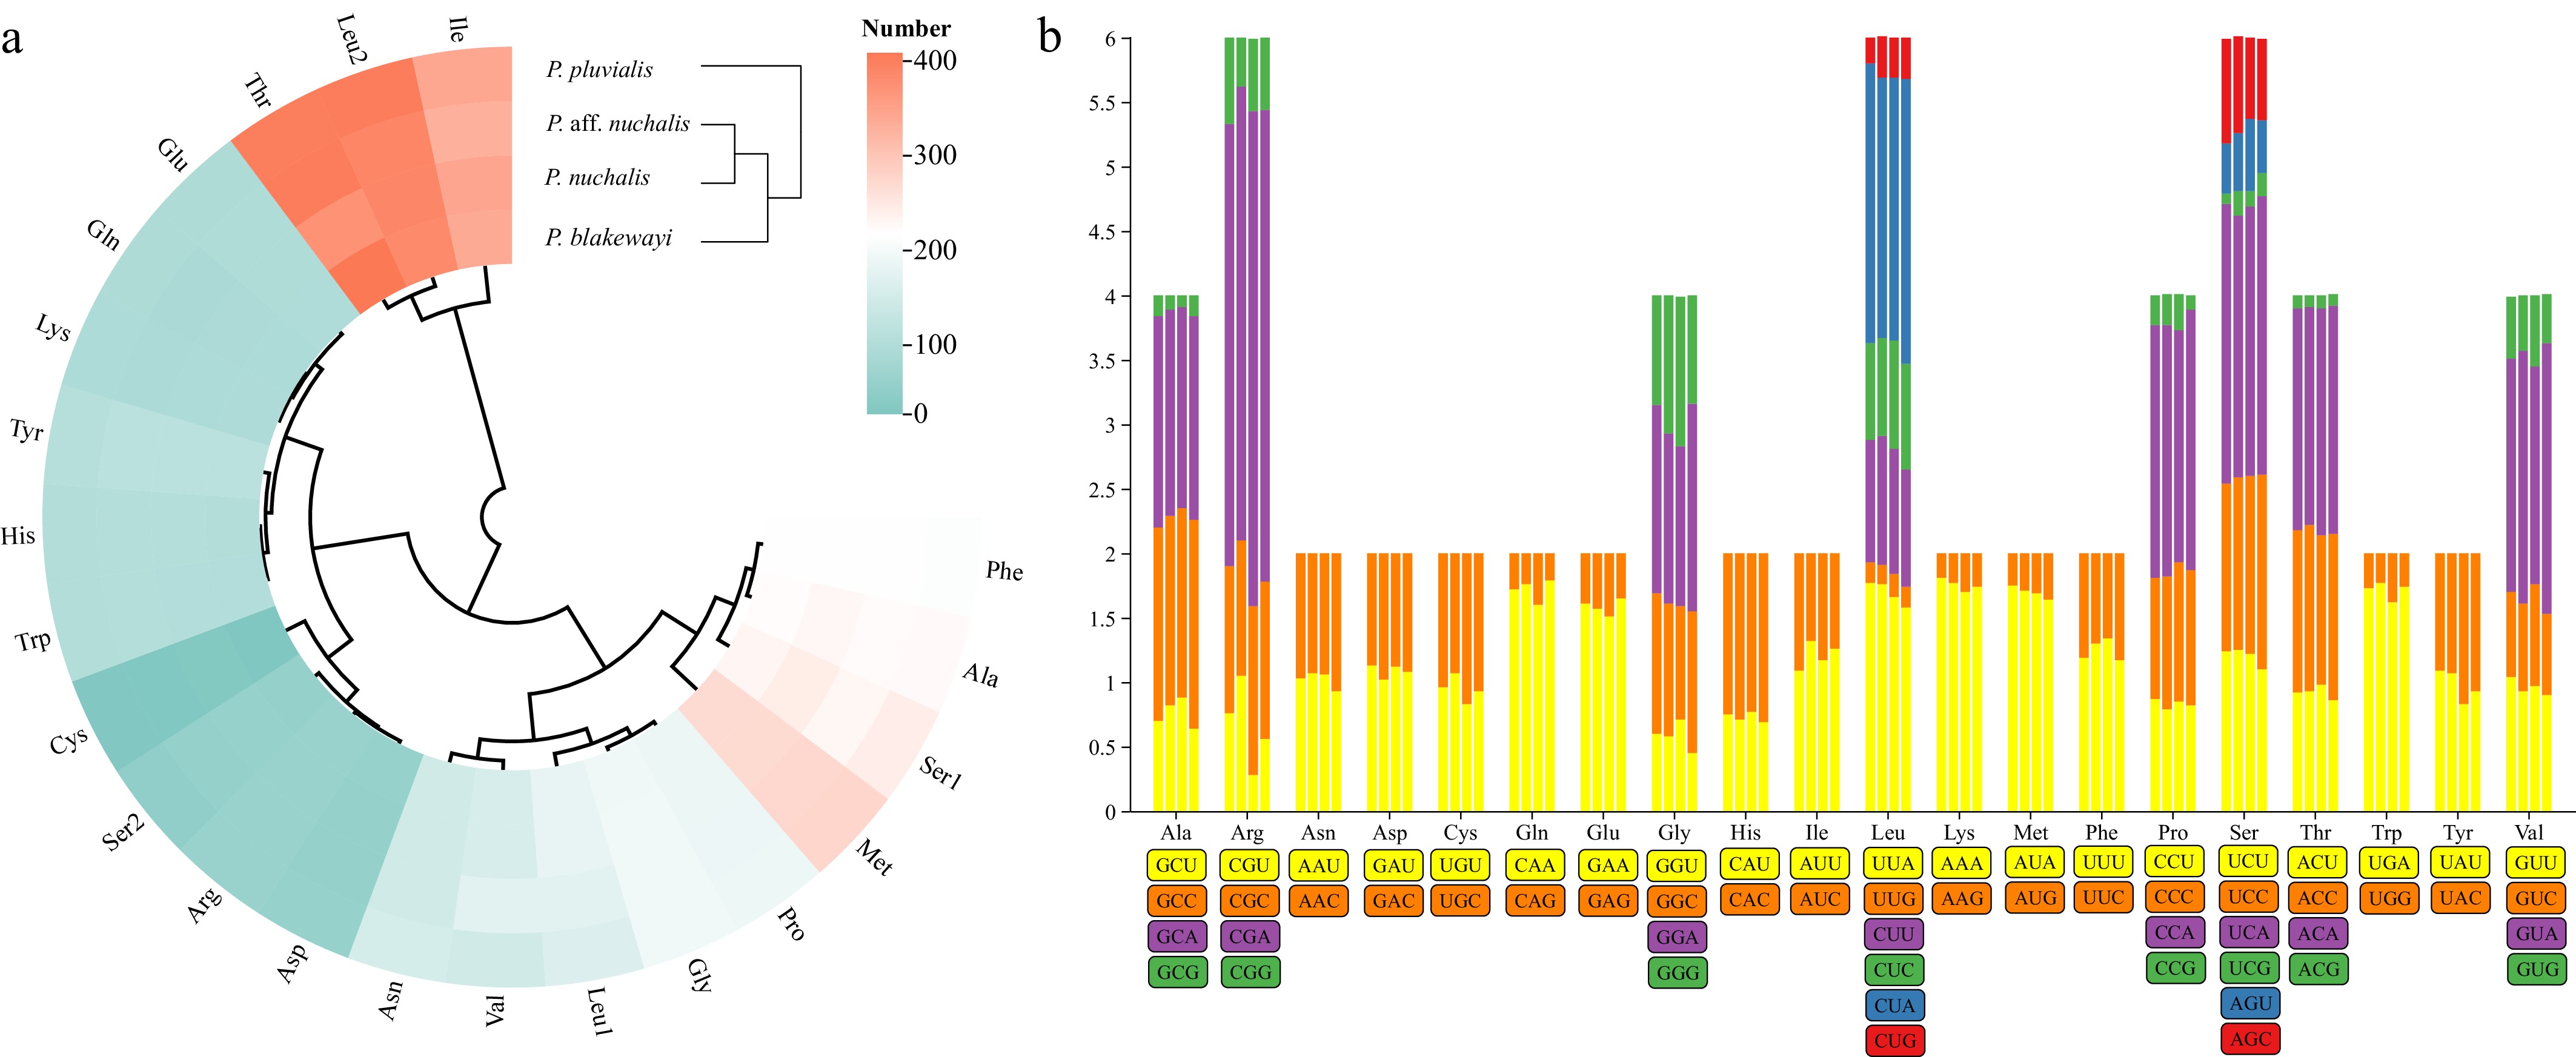
Figure 3.
(a) Cluster heatmap showing the amino acid usage preferences of PCGs; (b) RSCU features of PCGs for P. blakewayi, P. nuchalis, P. aff. nuchalis, and P. pluvialis. The RSCU values are plotted on the y-axis, with codon families shown on the x-axis.
-
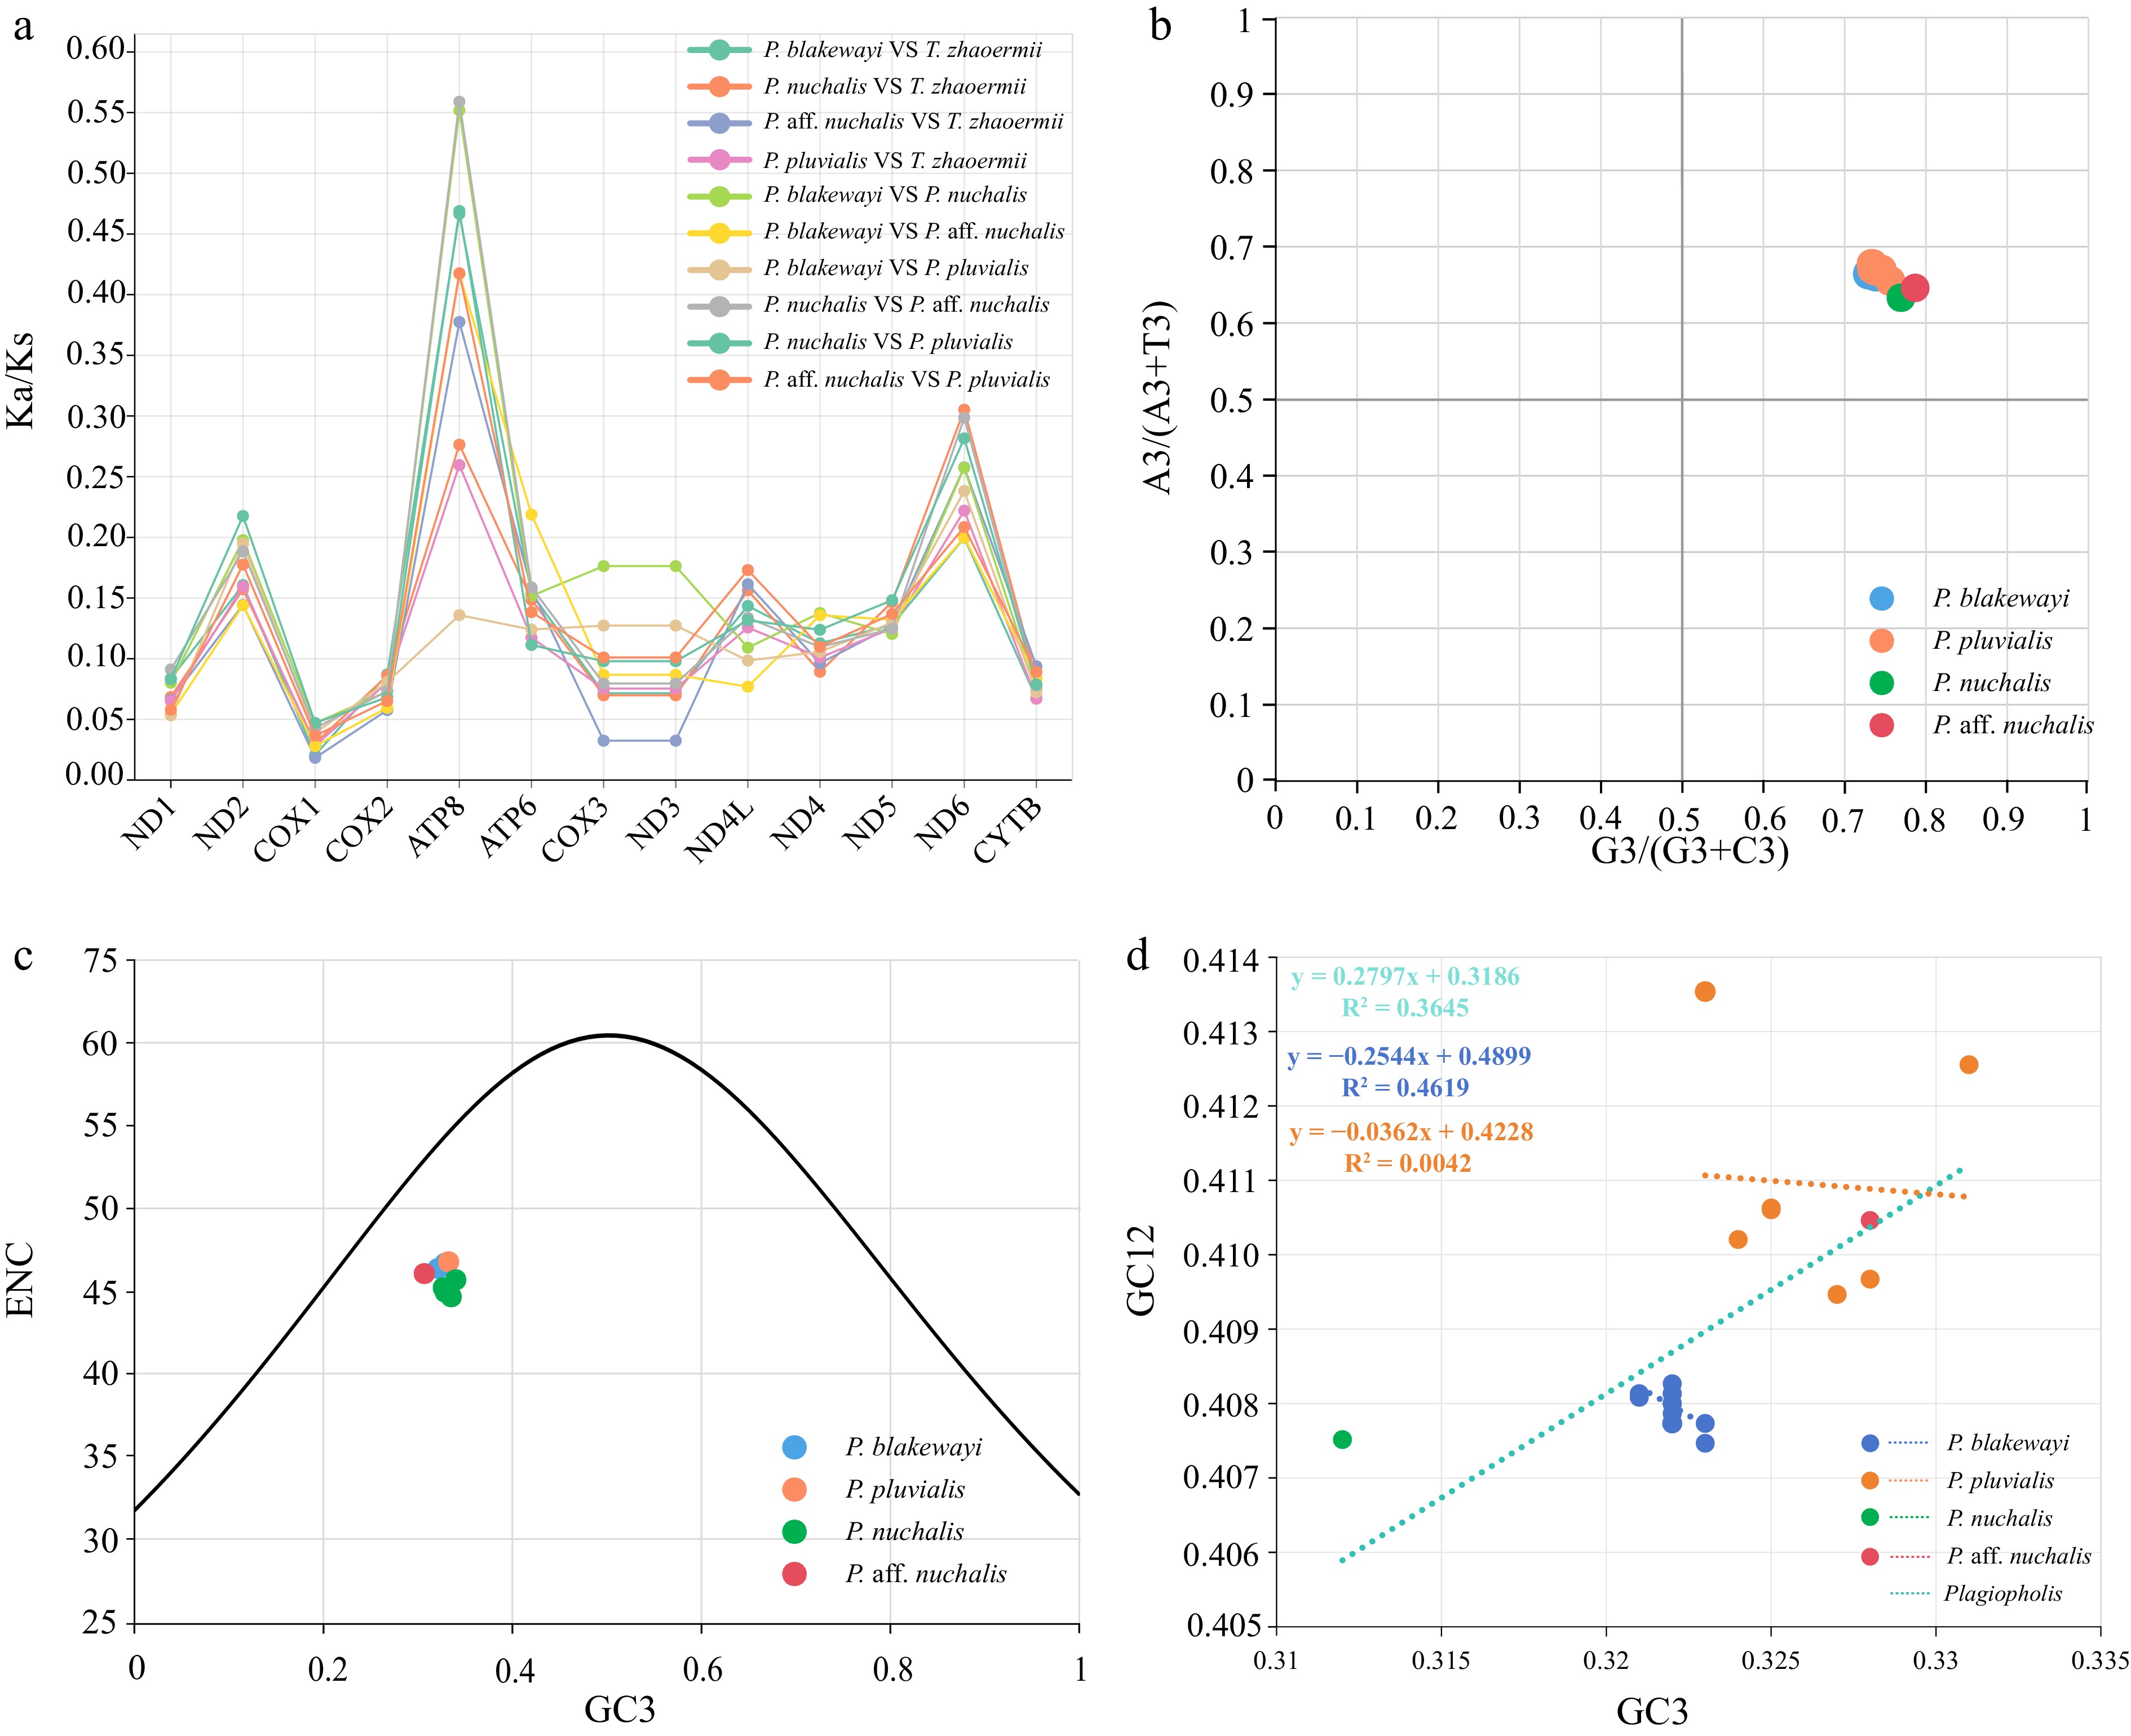
Figure 4.
(a) Ka/Ks ratios of Plagiopholis species and Thermophis zhaoermii. (b) PR2 plot based on the nucleotide composition of total PCGs. The center of the plot (A = U and G = C) indicates no deviation between mutation pressure and natural selection in codon usage. (c) ENC-GC3 plots based on the nucleotide composition of total PCGs. ENC values that fit the standard curve indicate mutation-driven codon usage; deviations reflect dominant selection pressure. (d) Neutrality plot of GC12 and GC3 content values within Plagiopholis species. The slope near 1 denotes dominant mutational pressure on CUB, while a slope close to 0 indicates predominant natural selection.
-
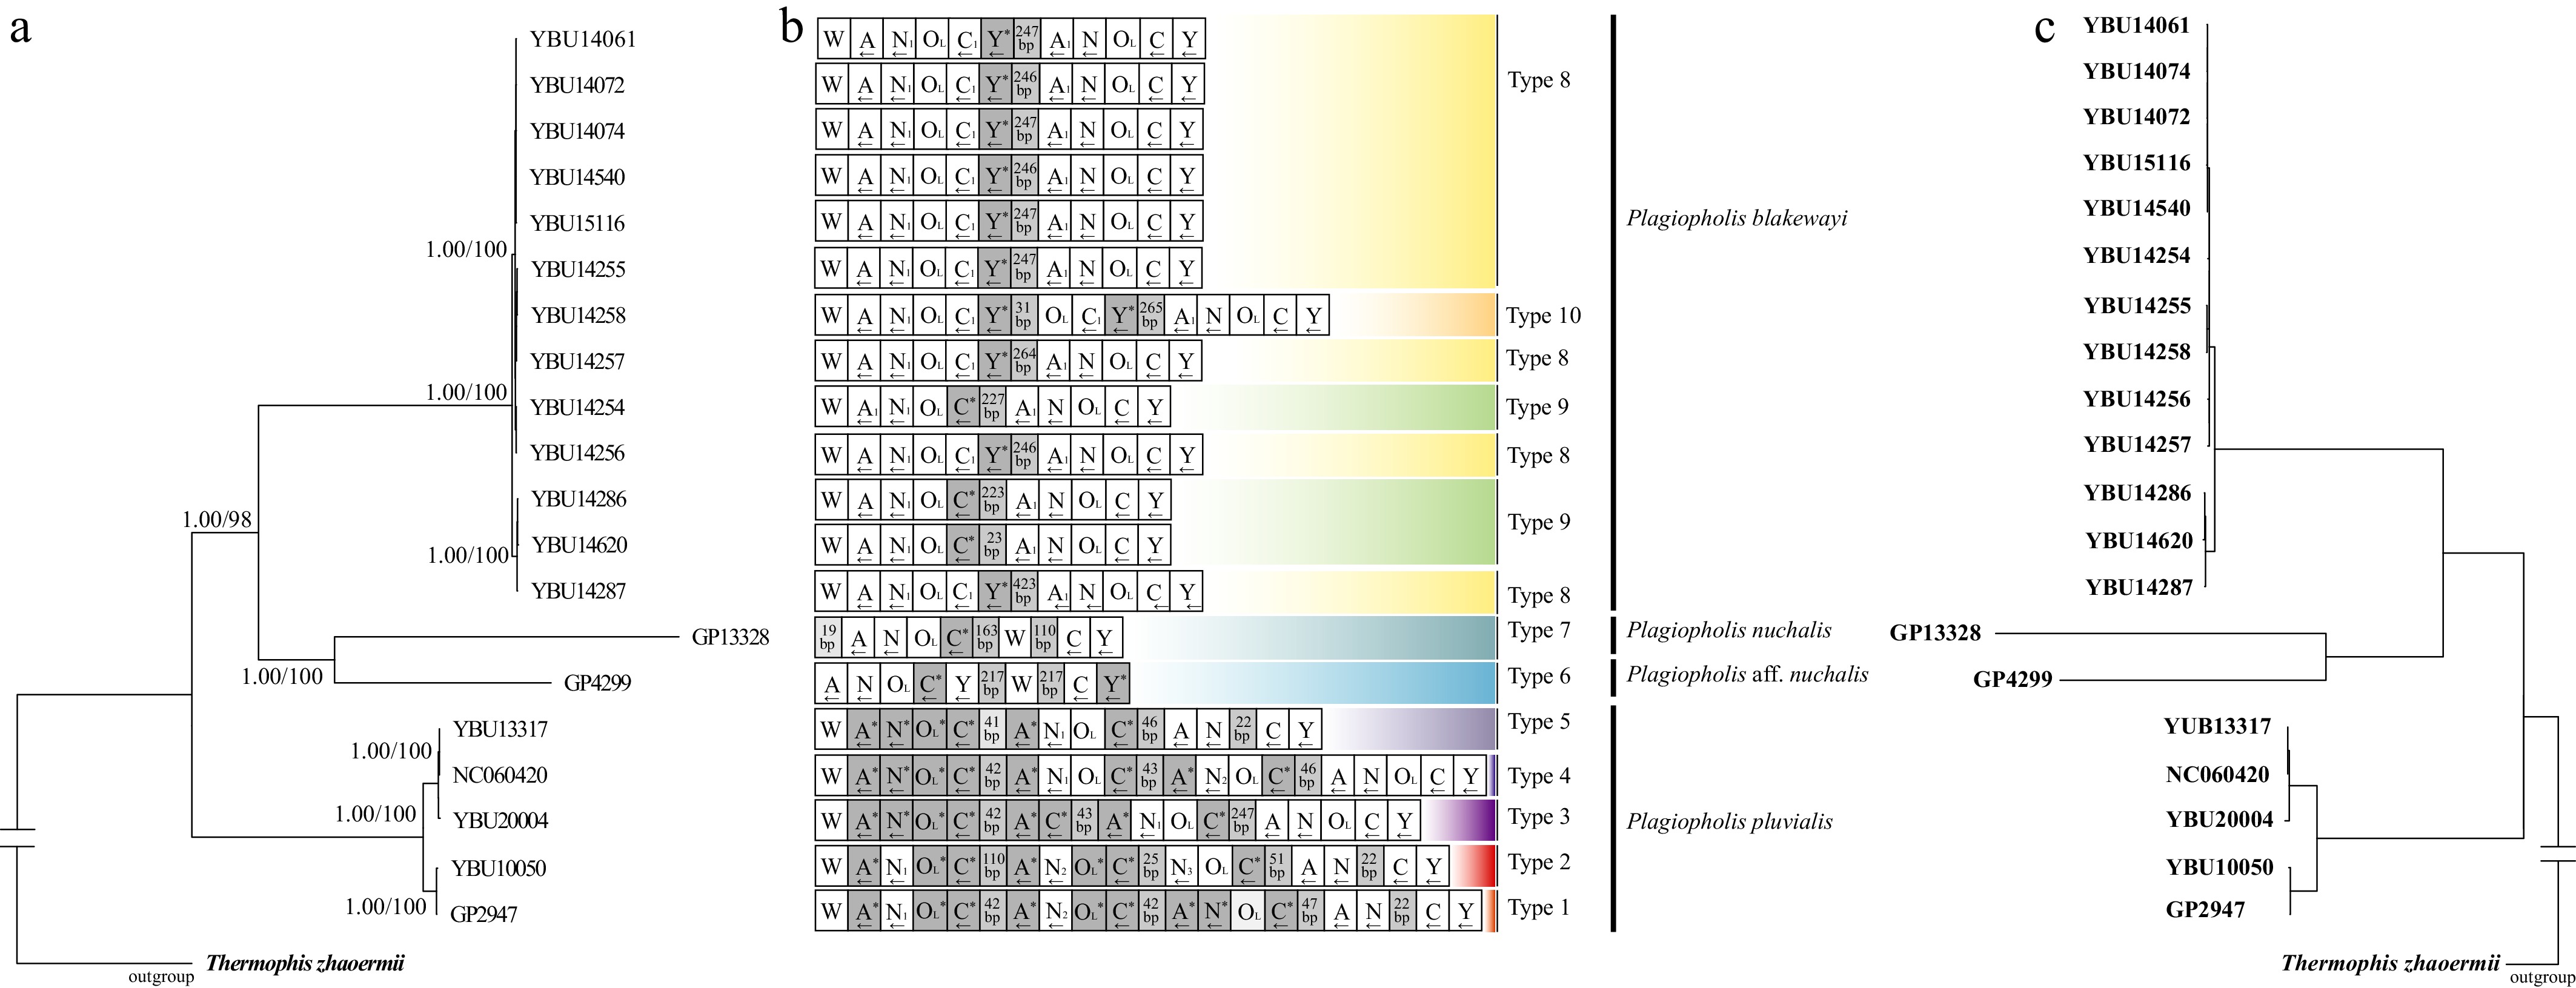
Figure 5.
(a) ML and BI phylogenetic tree inferred from static alignments of PCGs and rRNAs, with PP and BS values shown on each major node. (b) WANCY region arrangement types for each individual. Dark gray represents pseudo-tRNA genes and pseudo-OL, while light gray represents the number of intervening bases. (c) Parsimonious tree under dynamic homology from the PCG and rRNA datasets.
-
Sample Voucher Species Locality Accession Ref. YBU14061 GP3307 P. blakewayi Kaiyuan, Yunnan, China PX933003 This study YBU14072 GP3318 P. blakewayi Kaiyuan, Yunnan, China PX933002 This study YBU14074 GP3320 P. blakewayi Kaiyuan, Yunnan, China PX933001 This study YBU14540 GP3938 P. blakewayi Kaiyuan, Yunnan, China PX932993 This study YBU15116 GP4125 P. blakewayi Kaiyuan, Yunnan, China PX932991 This study YBU14255 GP3555 P. blakewayi Mengzi, Yunnan, China PX932999 This study YBU14258 GP3558 P. blakewayi Mengzi, Yunnan, China PX932996 This study YBU14257 GP3557 P. blakewayi Mengzi, Yunnan, China PX932997 This study YBU14254 GP3554 P. blakewayi Mengzi, Yunnan, China PX933000 This study YBU14256 GP3556 P. blakewayi Mengzi, Yunnan, China PX932998 This study YBU14286 GP3586 P. blakewayi Mengzi, Yunnan, China PX932995 This study YBU14620 GP3987 P. blakewayi Mengzi, Yunnan, China PX932992 This study YBU14287 GP3587 P. blakewayi Mengzi, Yunnan, China PX932994 This study / GP13328 P. nuchalis Thailand PX932988 This study / GP4299 P. aff. nuchalis Tengchong, Yunnan, China PX932990 This study YBU10050 GP1397 P. pluvialis Fanjing Mt., Guizhou, China PX933006 This study / GP2947 P. pluvialis Fanjing Mt., Guizhou, China PX933005 This study YUB13317 GP3009 P. pluvialis Emei Mt., Sichuan, China PX933004 This study YBU20004 GP6451 P. pluvialis Junlian Mt., Sichuan, China PX932989 This study / / P. pluvialis Emei Mt., Sichuan, China NC_060420 [65] / / Thermophis zhaoermii Litang, Sichuan, China NC_012816 [66] Table 1.
Specimens and genetic information used in this study.
Figures
(5)
Tables
(1)