-
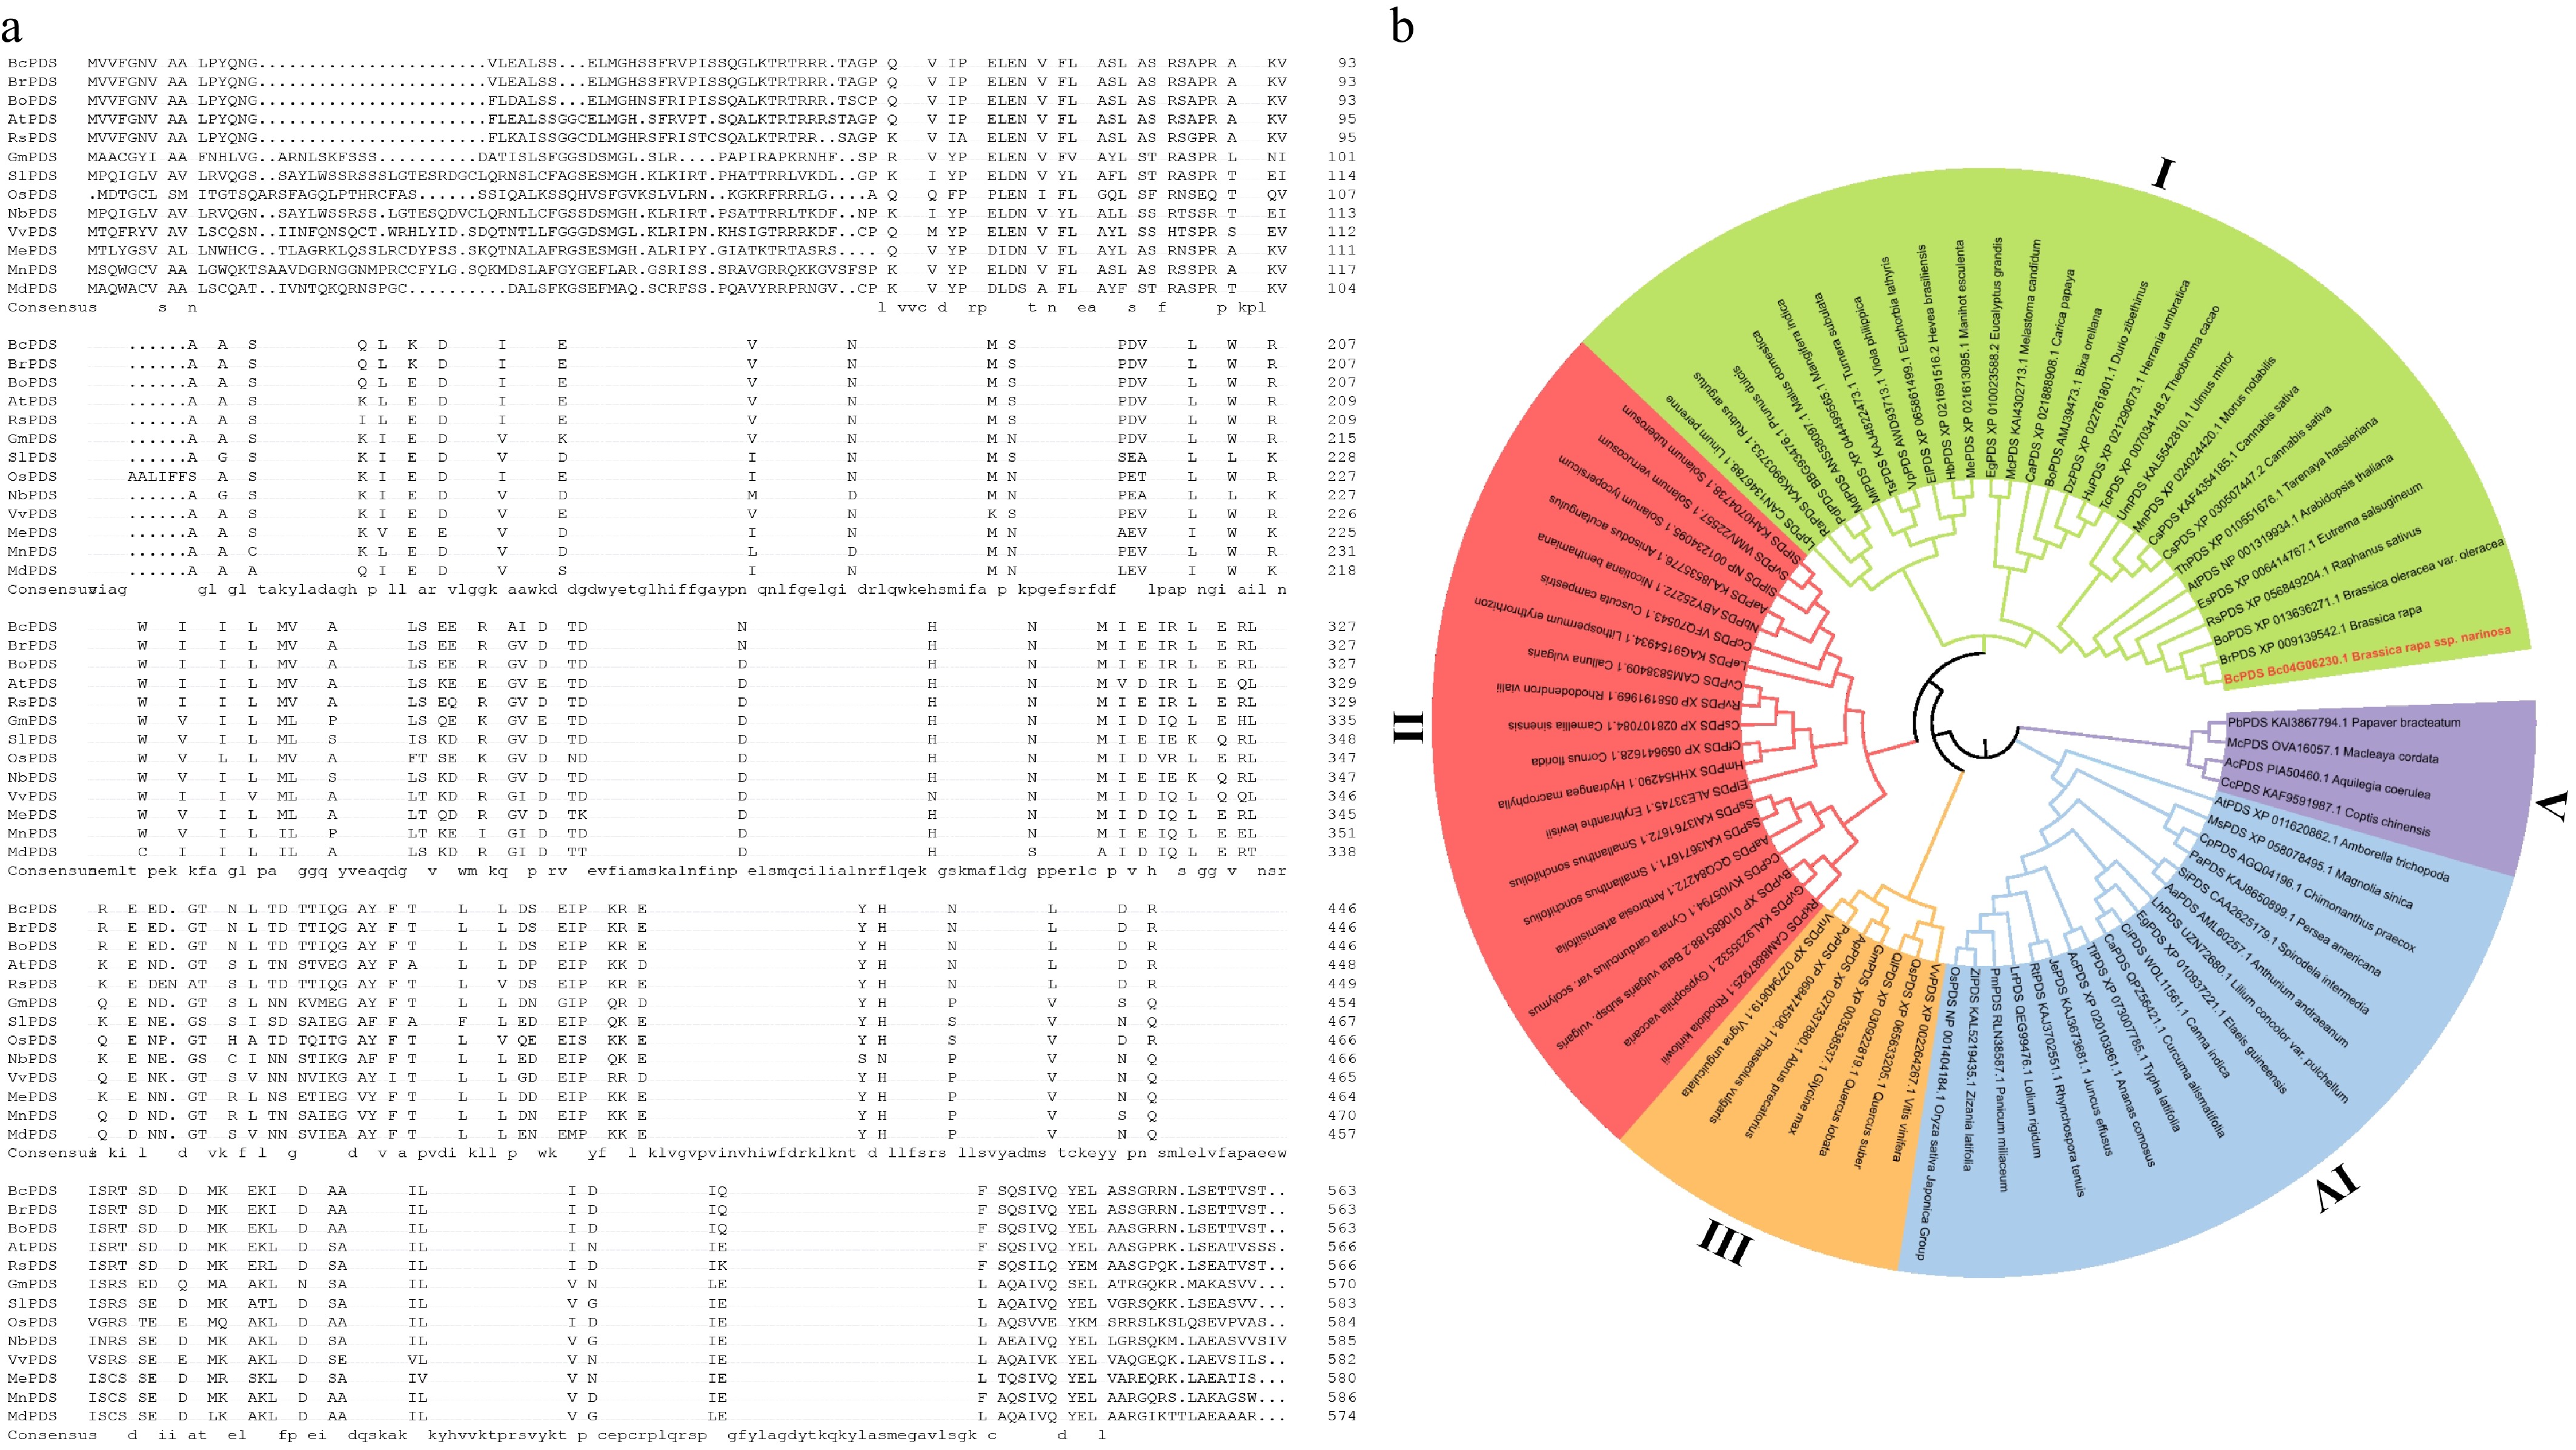
Figure 1.
Multiple sequence alignments and phylogenetic relationship of BcPDS and its orthologs. (a) Multiple sequence alignments of BcPDS and its orthologs from Chinese cabbage, Brassica oleracea, Arabidopsis, Radish, Soybean, Tomato, Rice, Tobacco, Grapevine, Cassava, Black mulberry, and Apple. The alignments were performed using full-length amino acid sequences of PDS. (b) Phylogenetic analysis of PDS proteins from 75 species. The unrooted phylogenetic tree was generated by the neighbour-joining method using the MEGA6 program with 1,000 bootstrap trials.
-
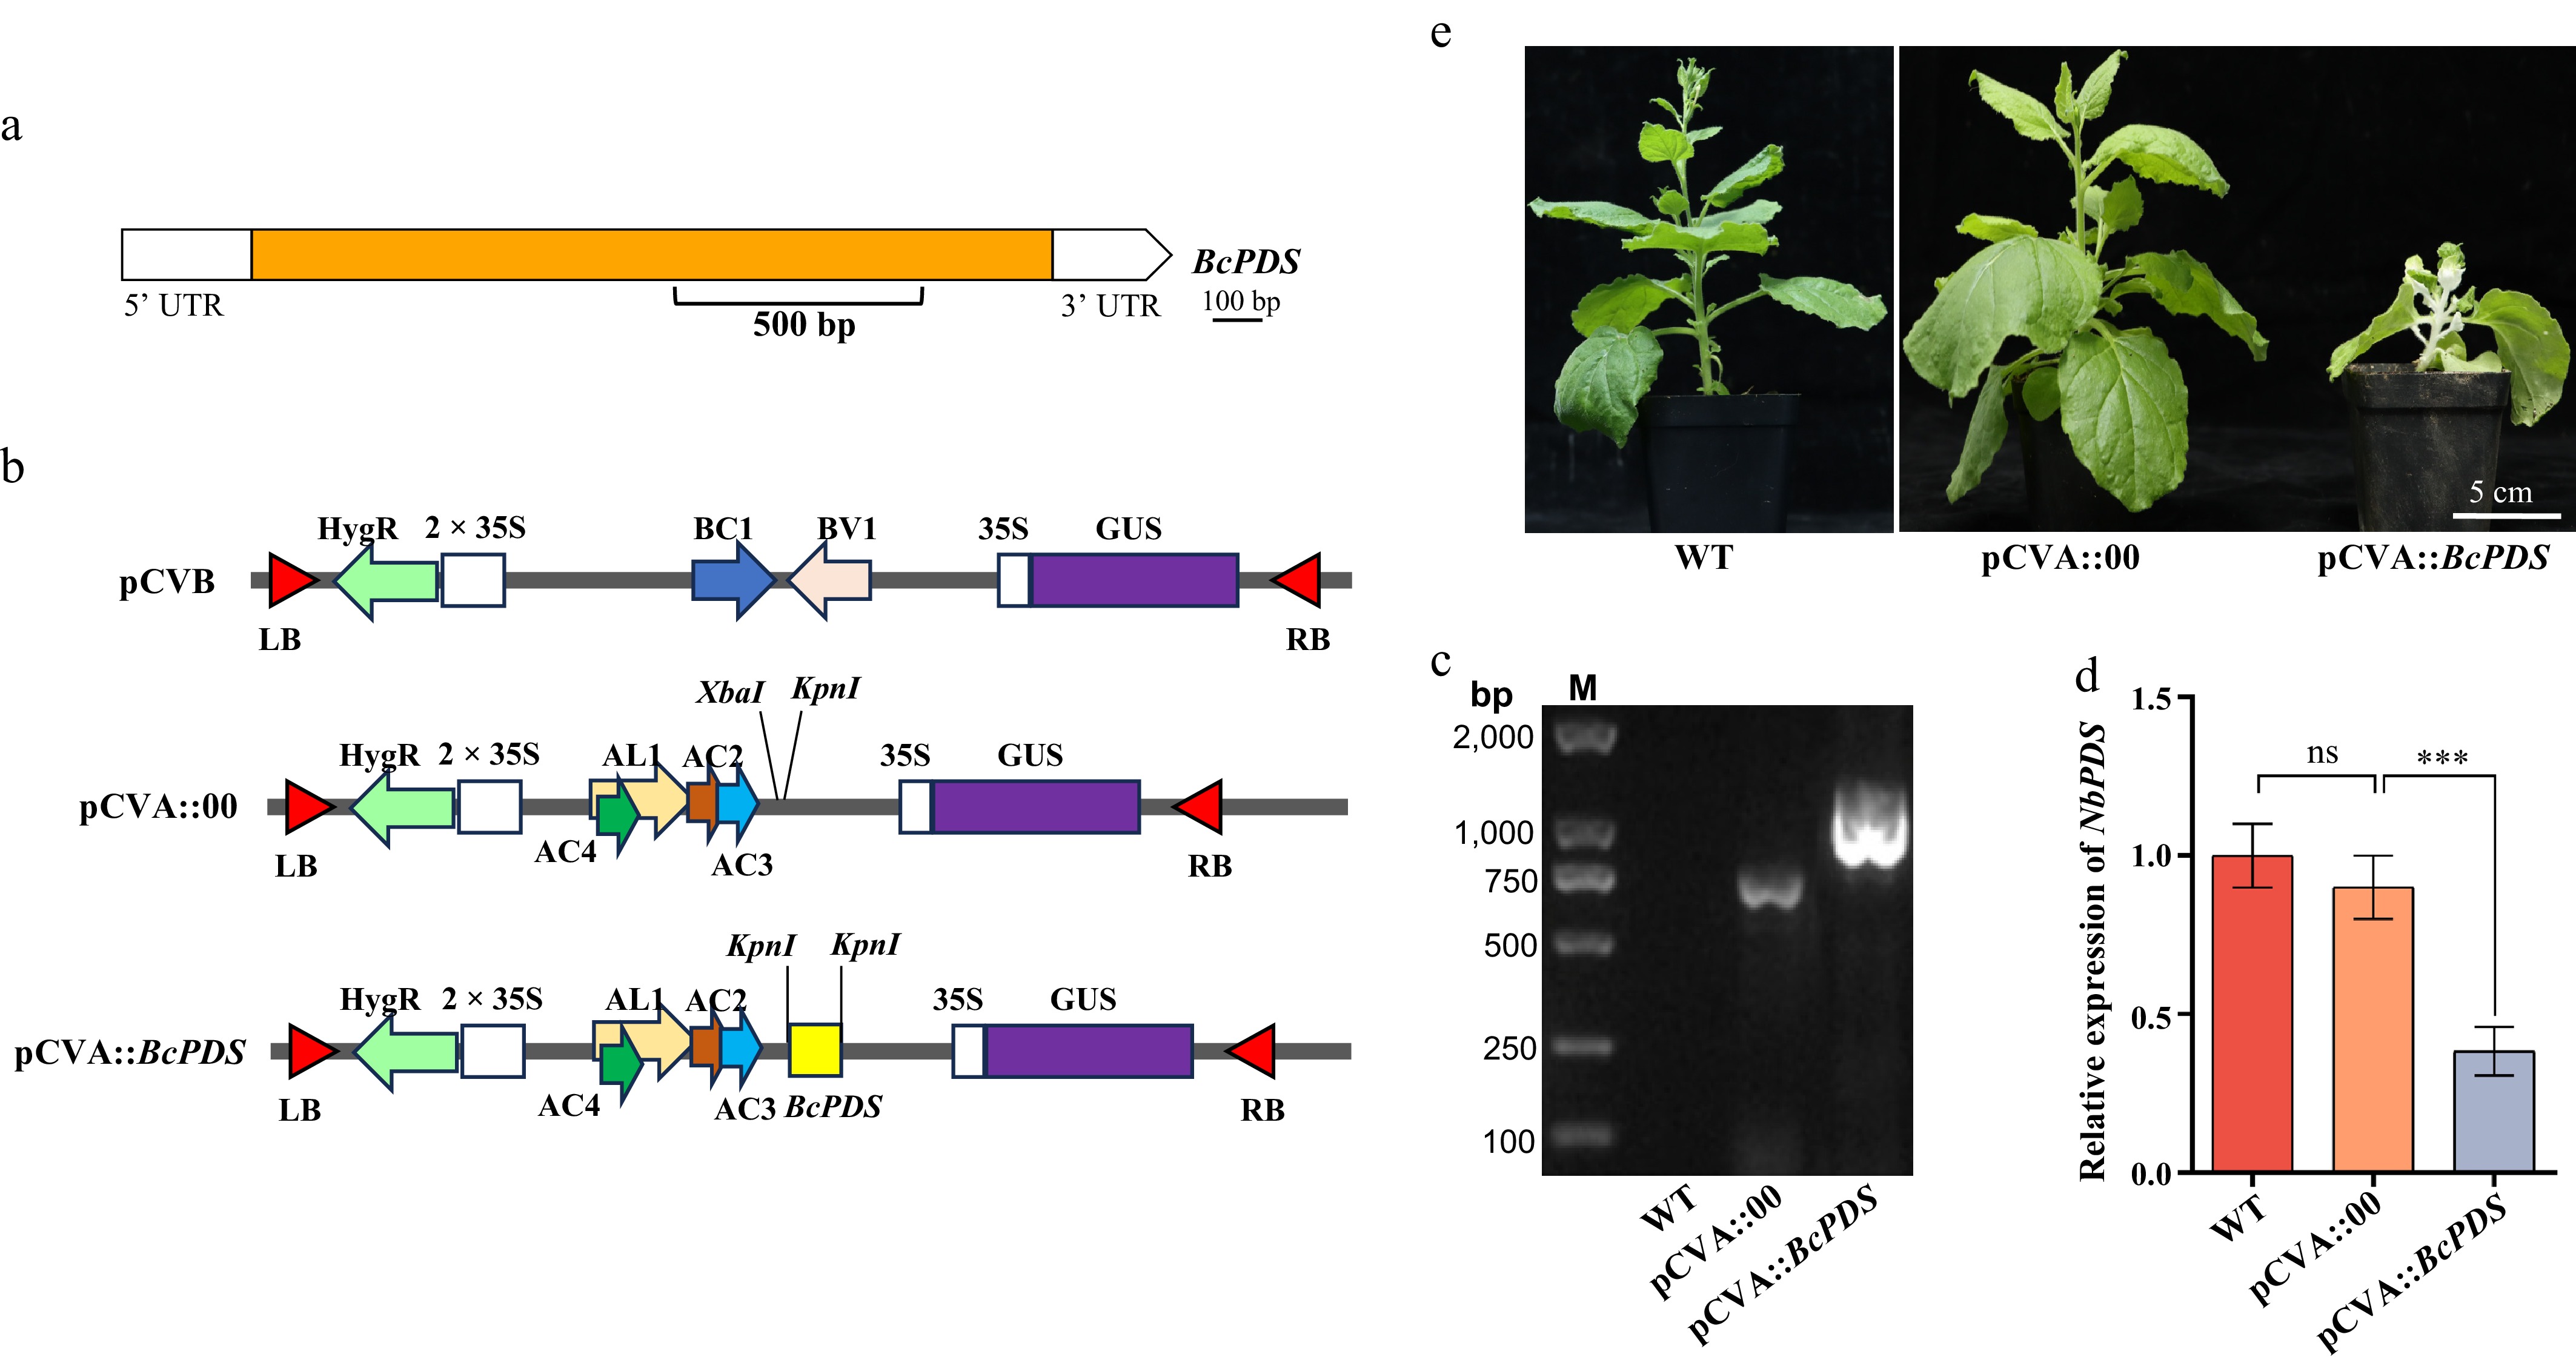
Figure 2.
Construction of the pCVA::BcPDS vector and silencing of PDS in N. benthamiana. (a) Structure of the BcPDS gene body; the fragment inserted in pCVA is indicated with a black underline. (b) Map of pCVB, pCVA::00, and pCVA::BcPDS vectors. LB, left border; RB, right border; HygR, hygromycin resistance gene; 2 × 35S, two consecutive 35S promoters; BC1, movement protein; BV1, nuclear shuttle movement protein; GUS, β-glucuronidase; AL1, replicase-associated protein; AC2, transactivator protein; AC3, replicase-associated protein; and AC4, putative pathogenesis-related protein. (c) CaLCuV-mediated VIGS phenotypes of N. benthamiana inoculated with empty pCVA vector (pCVA::00) and pCVA::BcPDS. Photos were captured after 30 d of infiltration, and the no-infiltration plant was also included as a control. The whole plants were shown in the upper panel, and the representative leaves were shown in the bottom panel. Silencing phenotype of BcPDS in tobacco. (d) Detection of CaLCuV fragments after VIGS treatments. Lane M shows DNA size markers. (e) Expression analysis of BcPDS in photobleached tissues by RT-qPCR of tobacco after infection. Data are presented as mean ± SD (n = 3). Statistical significance was assessed by one-way ANOVA followed by Tukey's HSD post hoc test (ns = not significant, *** p < 0.001).
-
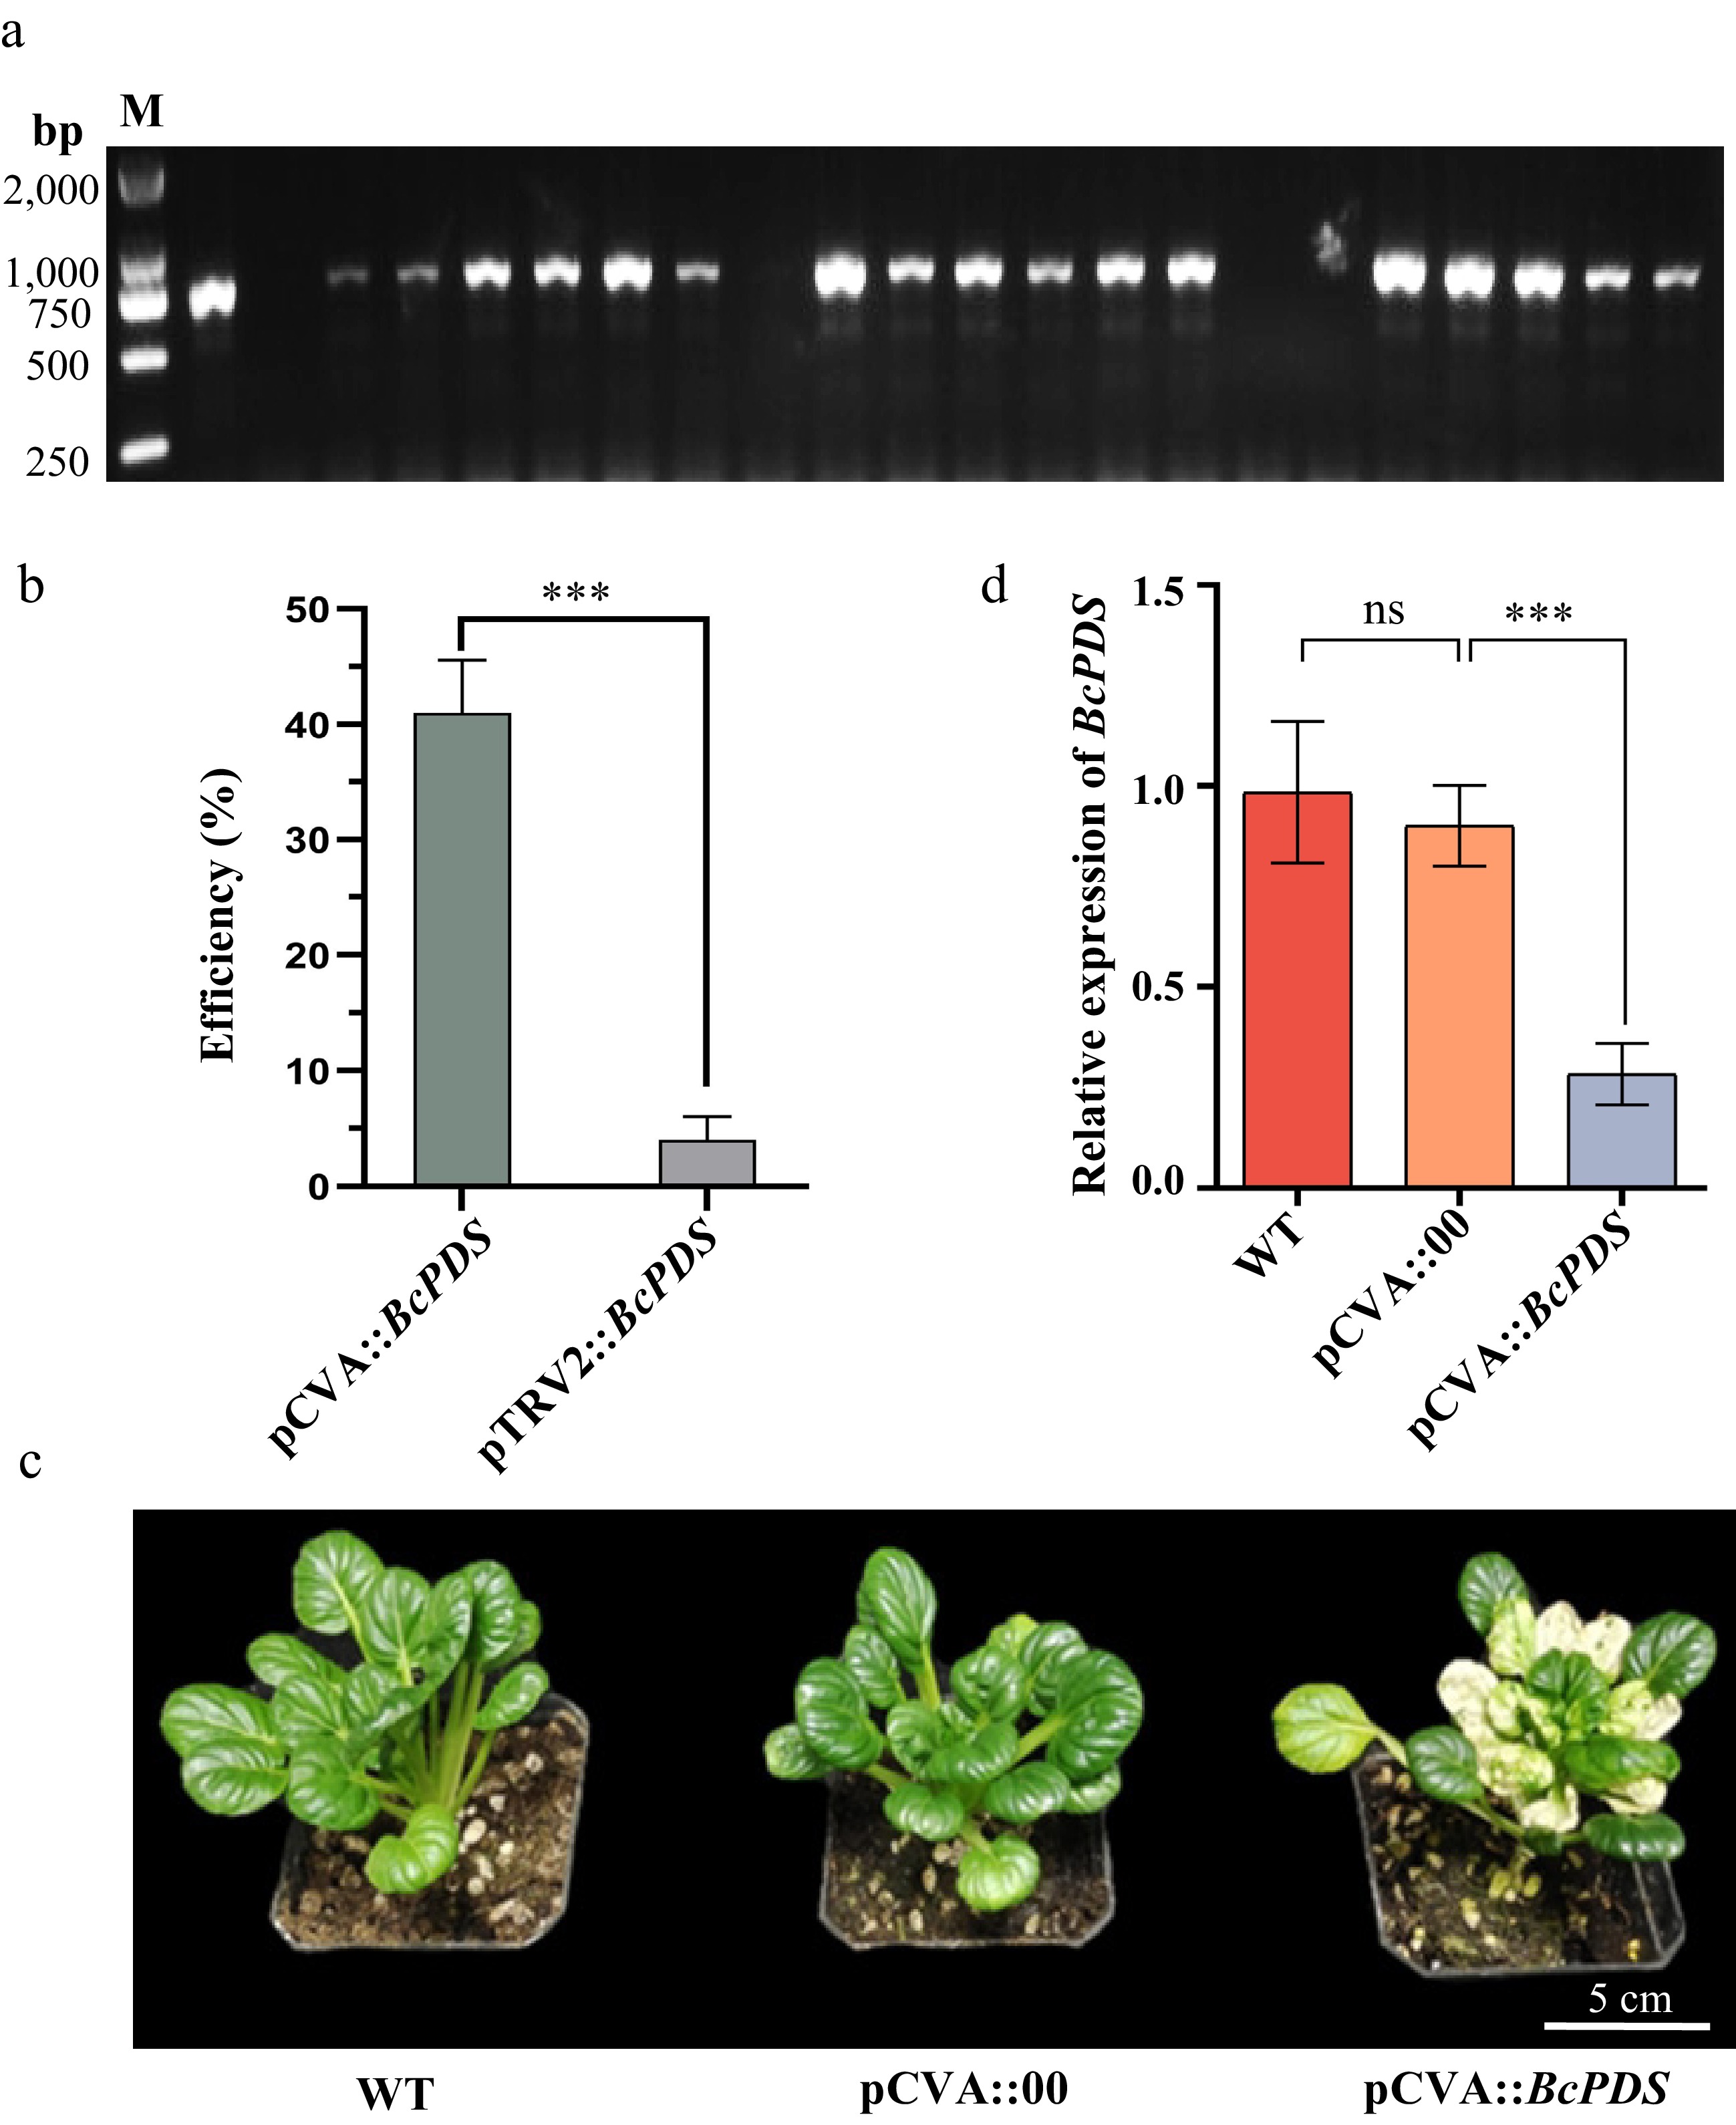
Figure 3.
Application of CaLCuV-VIGS to Xiaobaye using TRV-VIGS as a control targeting the same BcPDS sequence. (a) PCR detection of CaLCuV fragment accumulation in infiltrated plants at 14 dpi. (b) Infection efficiency of the CaLCuV-VIGS and TRV-VIGS system in Xiaobaye. Data are presented as mean ± SD (n = 3). Statistical significance was determined by Student's t-test (*** p < 0.001). (c) Silencing phenotype of BcPDS in Xiaobaye at 21 dpi. (d) Expression analysis of BcPDS in photobleached tissues by RT-qPCR of Xiaobaye after infection. Data are presented as mean ± SD (n = 3). Statistical significance was assessed by one-way ANOVA followed by Tukey's HSD post hoc test (ns = not significant, *** p < 0.001).
-
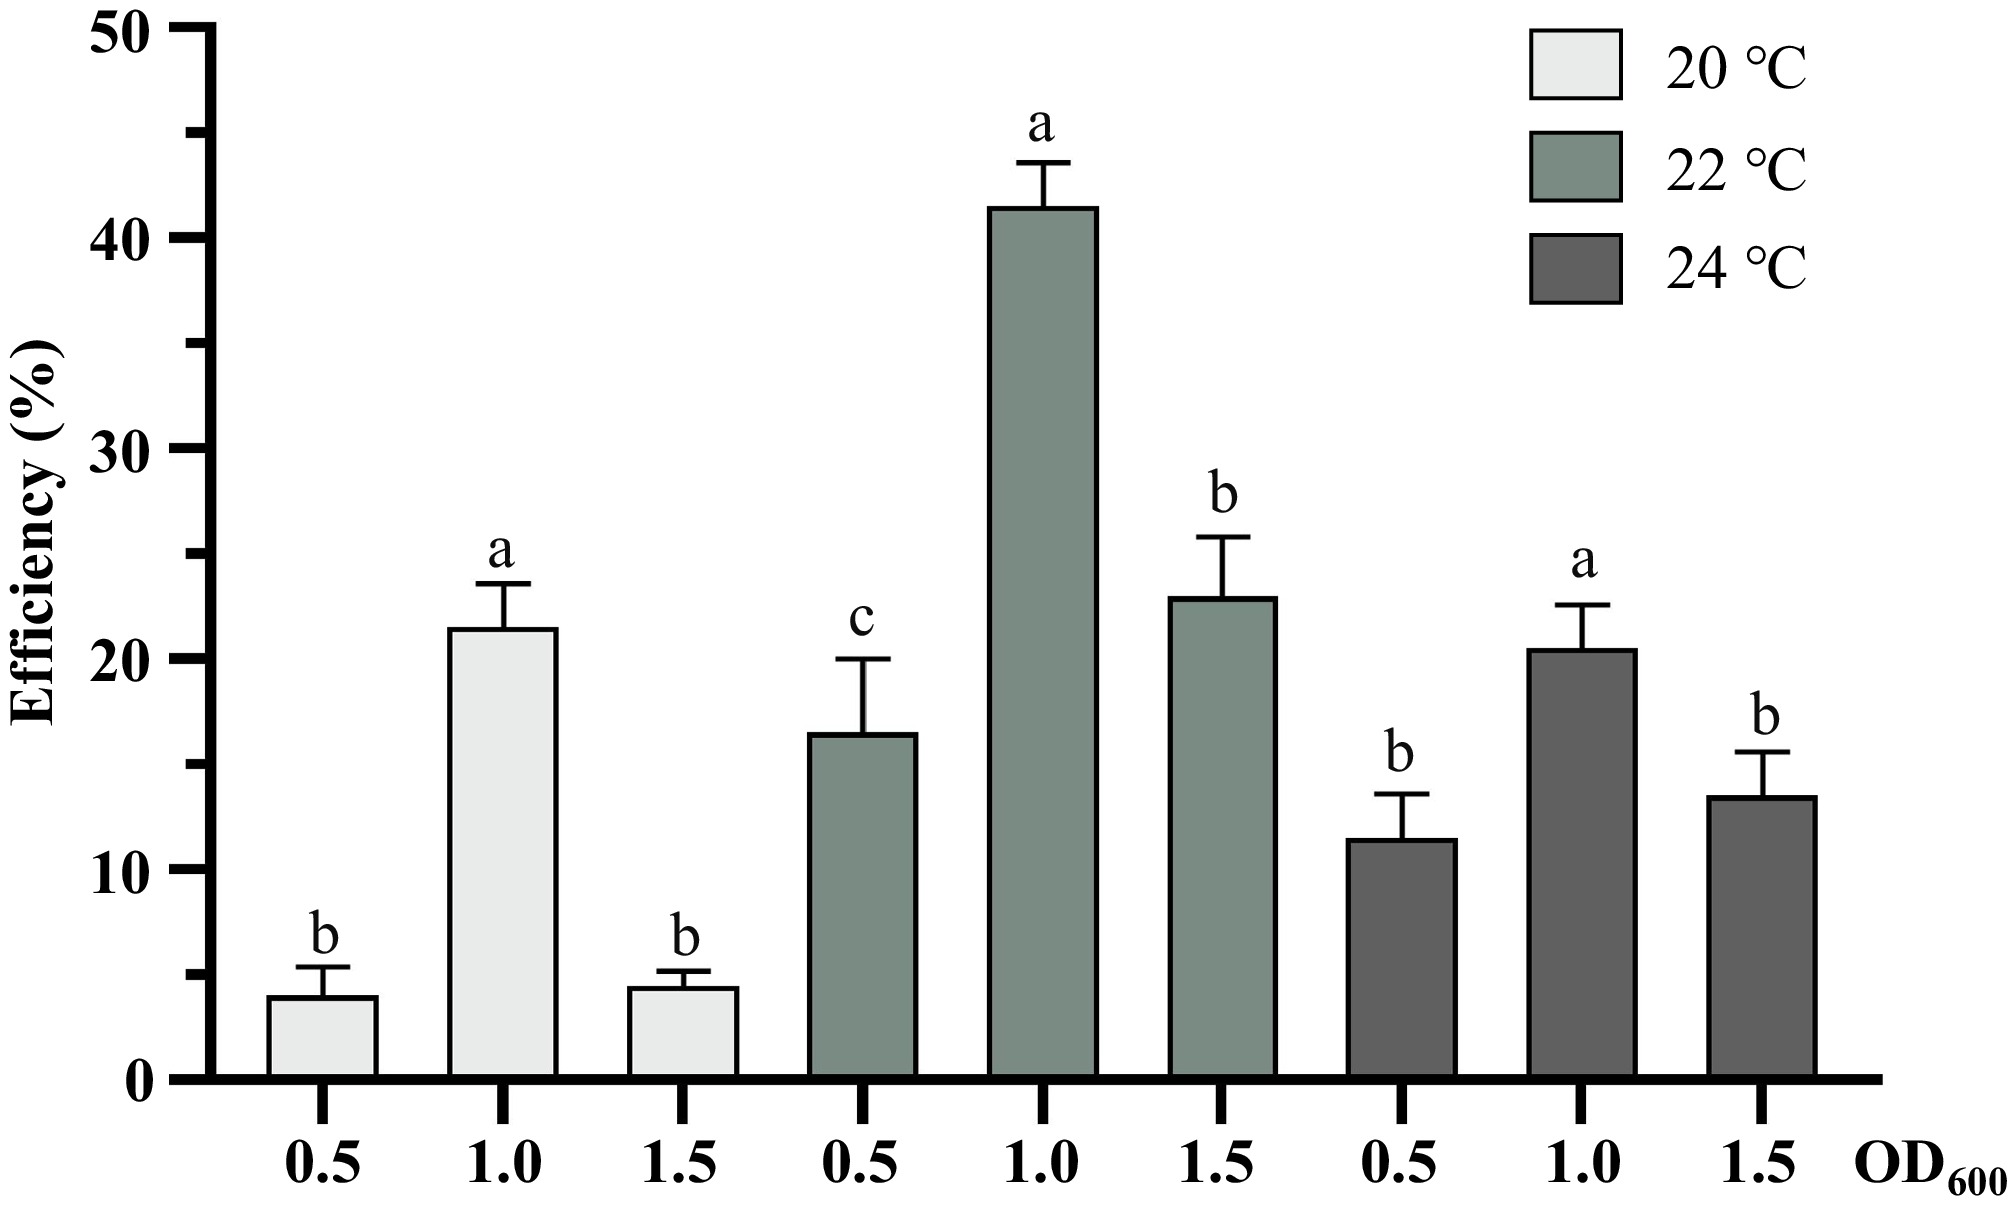
Figure 4.
Effects of Agrobacterium concentration (OD600 = 0.5, 1.0, 1.5) and growth temperature (20, 22, 24 °C) on CaLCuV-VIGS infection efficiency in Xiaobaye. Data are presented as mean ± SD (n = 3 biological replicates, each comprising 20 plants) (one-way ANOVA, Tukey's HSD test). Different lowercase letters indicate statistically significant differences at p < 0.05.
-
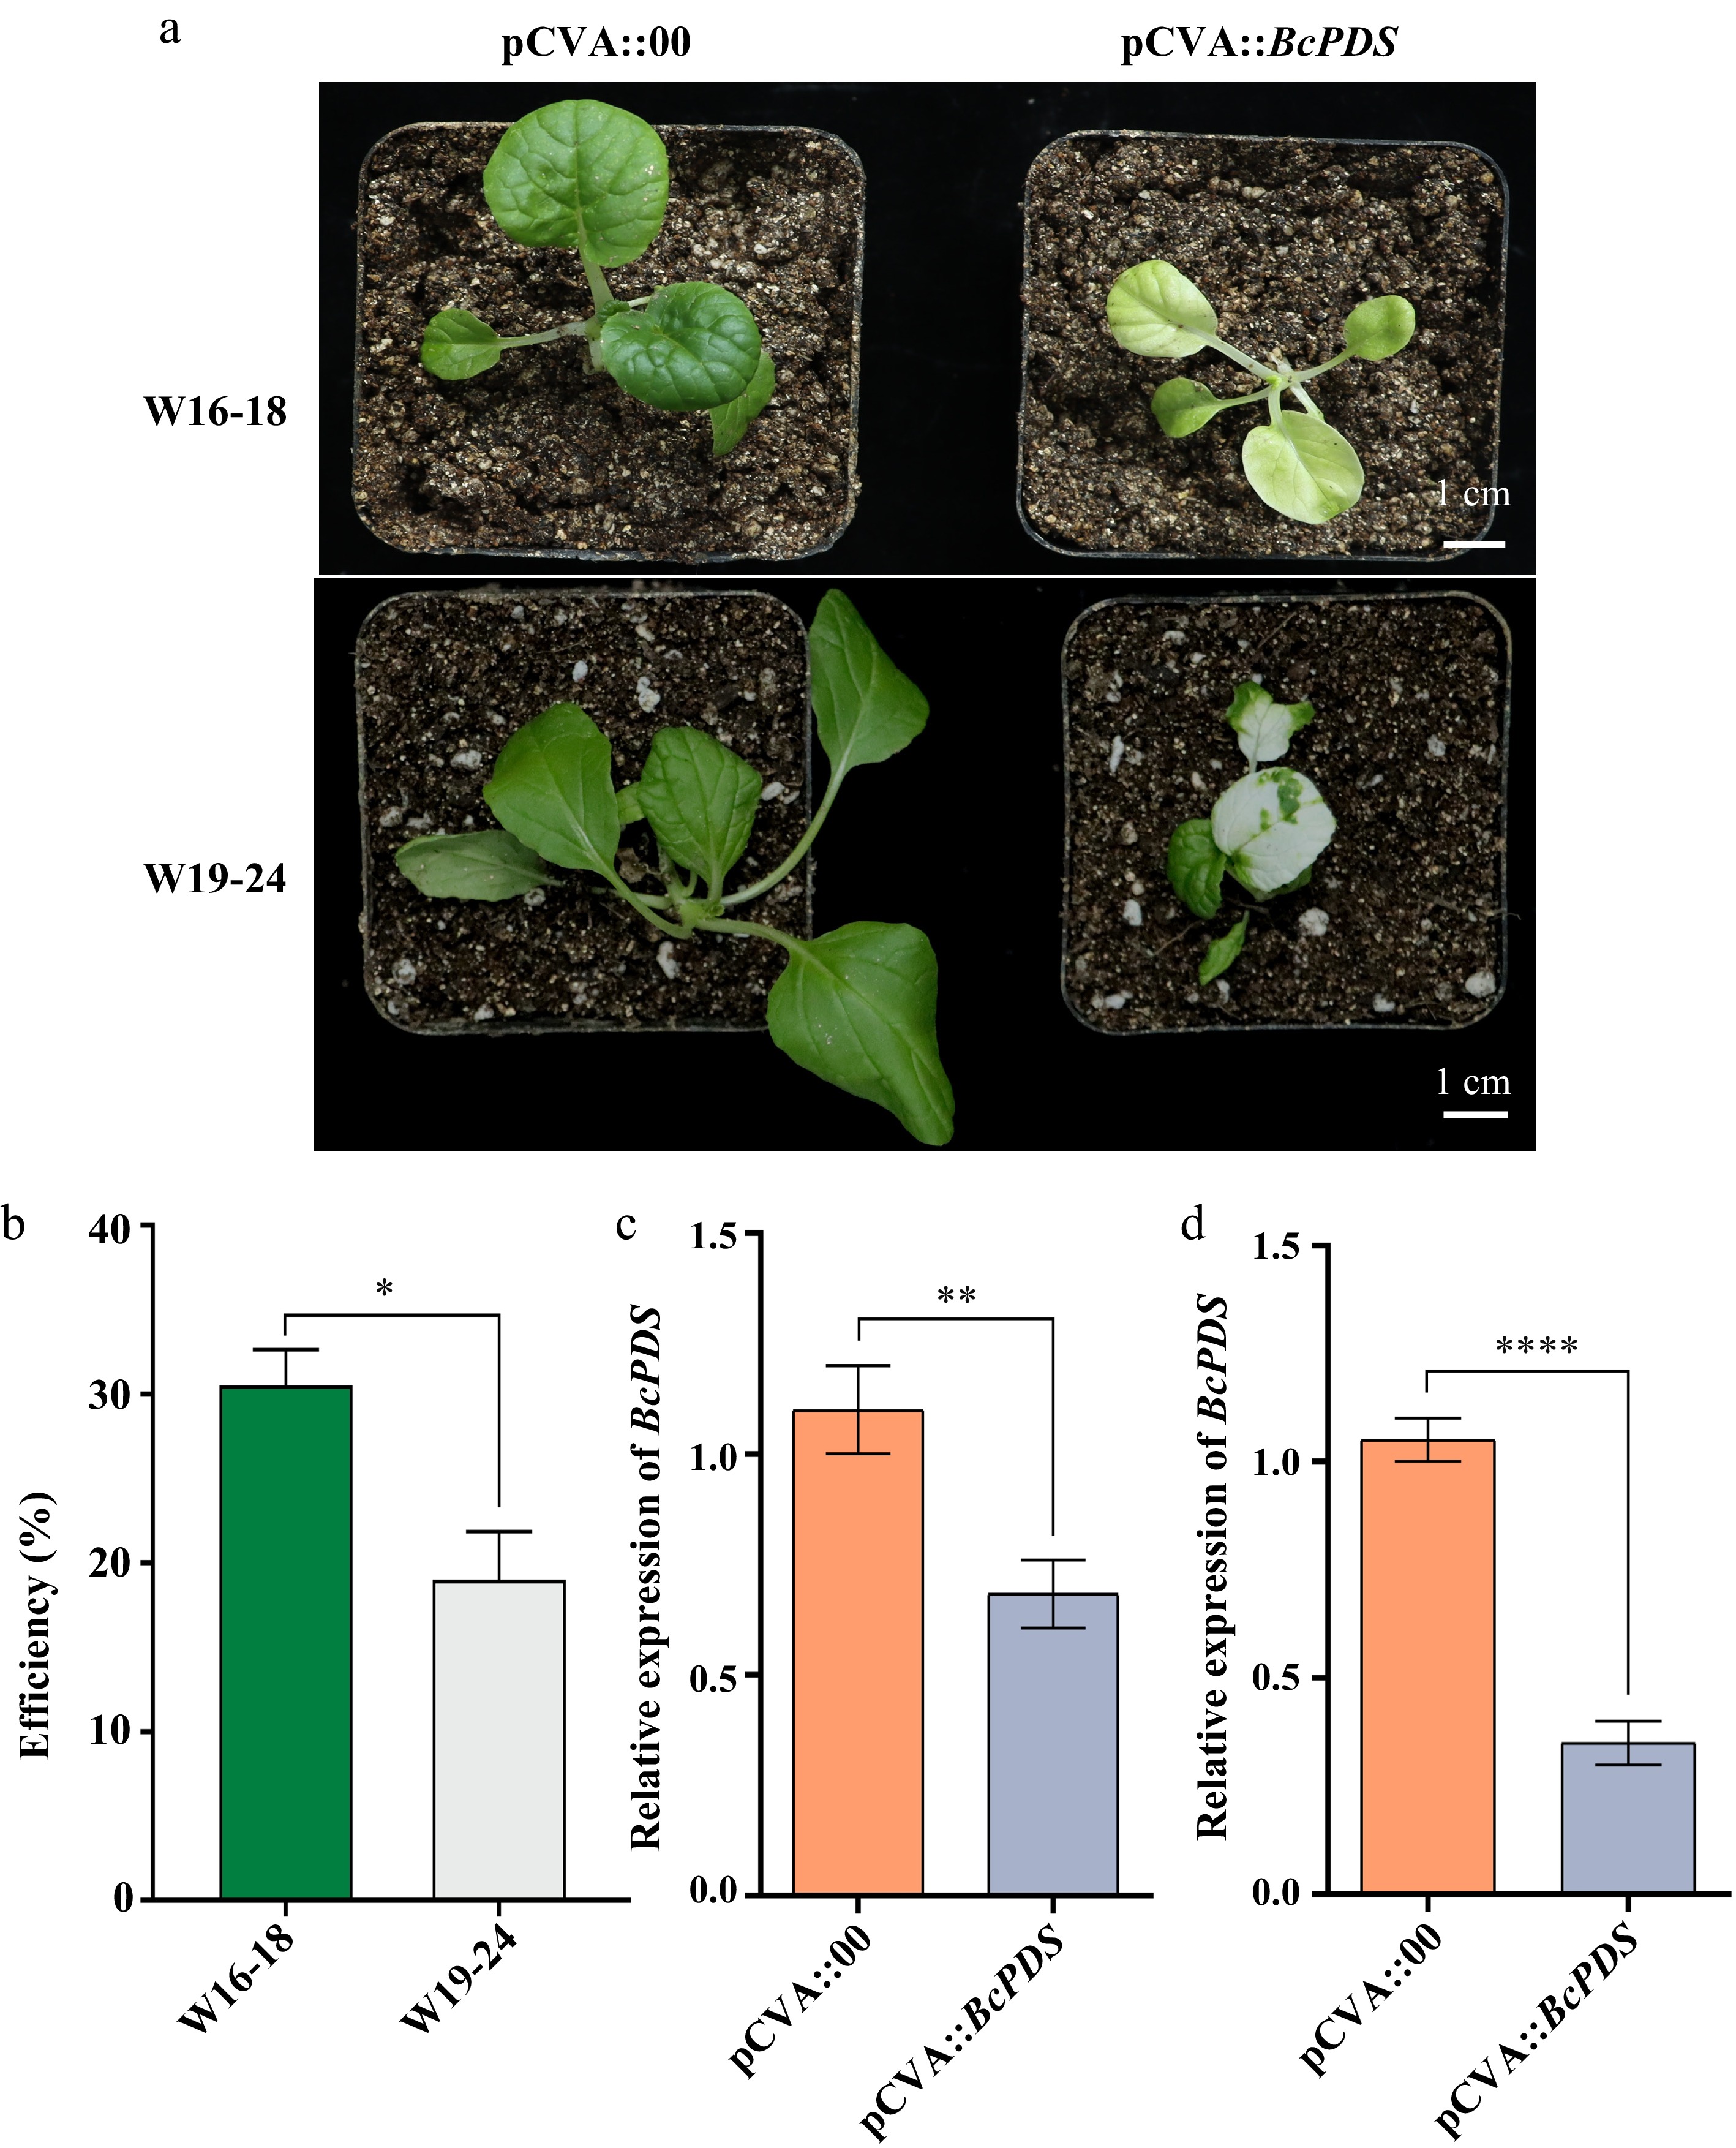
Figure 5.
Application of the CaLCuV-VIGS system targeting BcPDS in two representative wutacai core germplasms. (a) Photobleaching phenotypes were observed at 30 dpi in the tested germplasms (W16-18 and W19-24). All lines developed photobleaching by 30 dpi, albeit with variation in the onset timing of the phenotype. (b) Infection efficiency of W16-18 and W19-24 at optimized conditions (OD600 = 1.0, 22 °C). The plants showing a photobleached phenotype were counted. (c), (d) Expression analysis of BcPDS in photobleached tissues collected from (a) by RT-qPCR. (c) W16-18 plants. (d) W19-24 plants. Data are presented as mean ± SD (n = 3). Statistical significance was determined by Student's t-test (* p < 0.05, ** p < 0.01, *** p < 0.001).
-
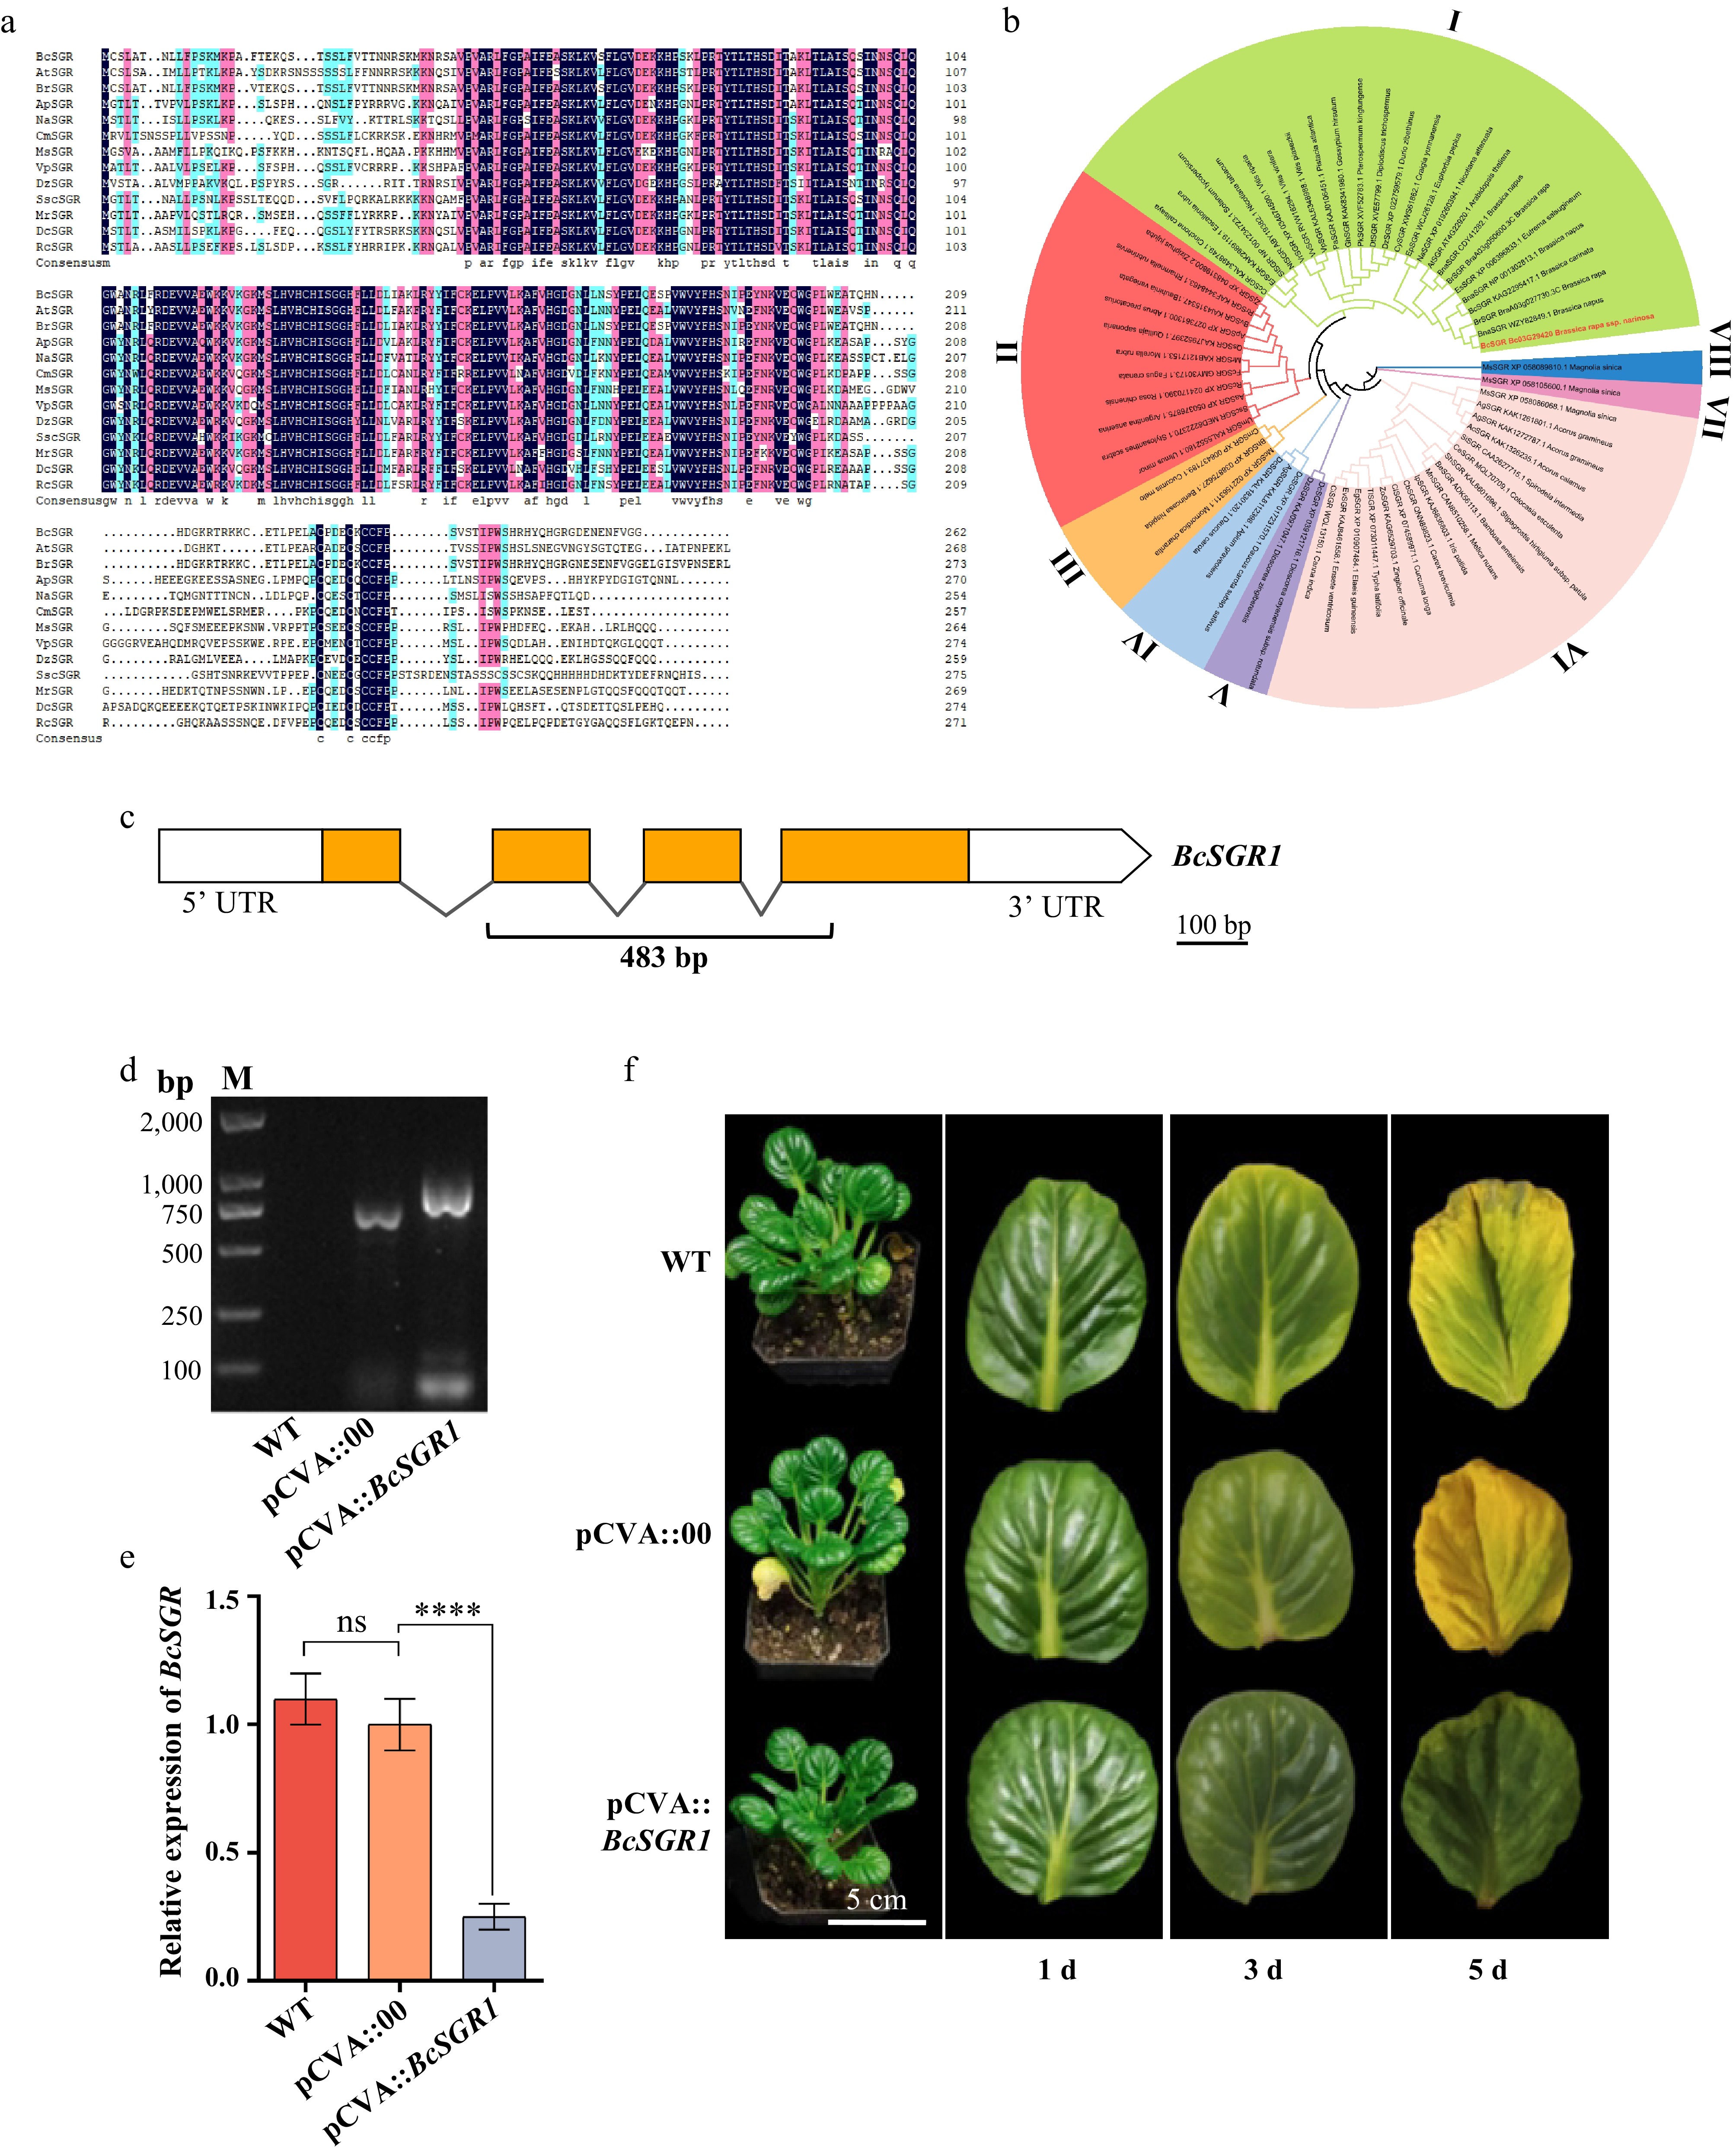
Figure 6.
Multiple sequence alignments and phylogenetic relationship of BcSGR1 and its orthologs, along with the construction of the pCVA::BcSGR1 vector and silencing of SGR in wutacai. (a) Multiple sequence alignments of BcSGR1 and its orthologs from Arabidopsis, Chinese cabbage, Rosary pea, Tobacco, Melon, Magnolia sinica, Grape, Ginger yam, Shrubby stylo, Chinese bayberry, Carrot, and China rose. The alignments were performed using full-length amino acid sequences of SGR. (b) Phylogenetic analysis of SGR proteins from 56 species. The unrooted phylogenetic tree was generated by the neighbour-joining method using the MEGA6 program with 1,000 bootstrap trials. (c) Structure of the BcSGR1 gene body; the fragment inserted in pCVA is indicated with a black underline. (d) Detection of CaLCuV fragments after VIGS treatments. Lane M shows DNA size markers. (e) Expression analysis of BcSGR1 by RT-qPCR after infection. Data are presented as mean ± SD (n = 3). Statistical significance was assessed by one-way ANOVA followed by Tukey's HSD post hoc test (ns = not significant, **** p < 0.0001). (f) Silencing phenotype of BcSGR1 in wutacai at 30 dpi.
-
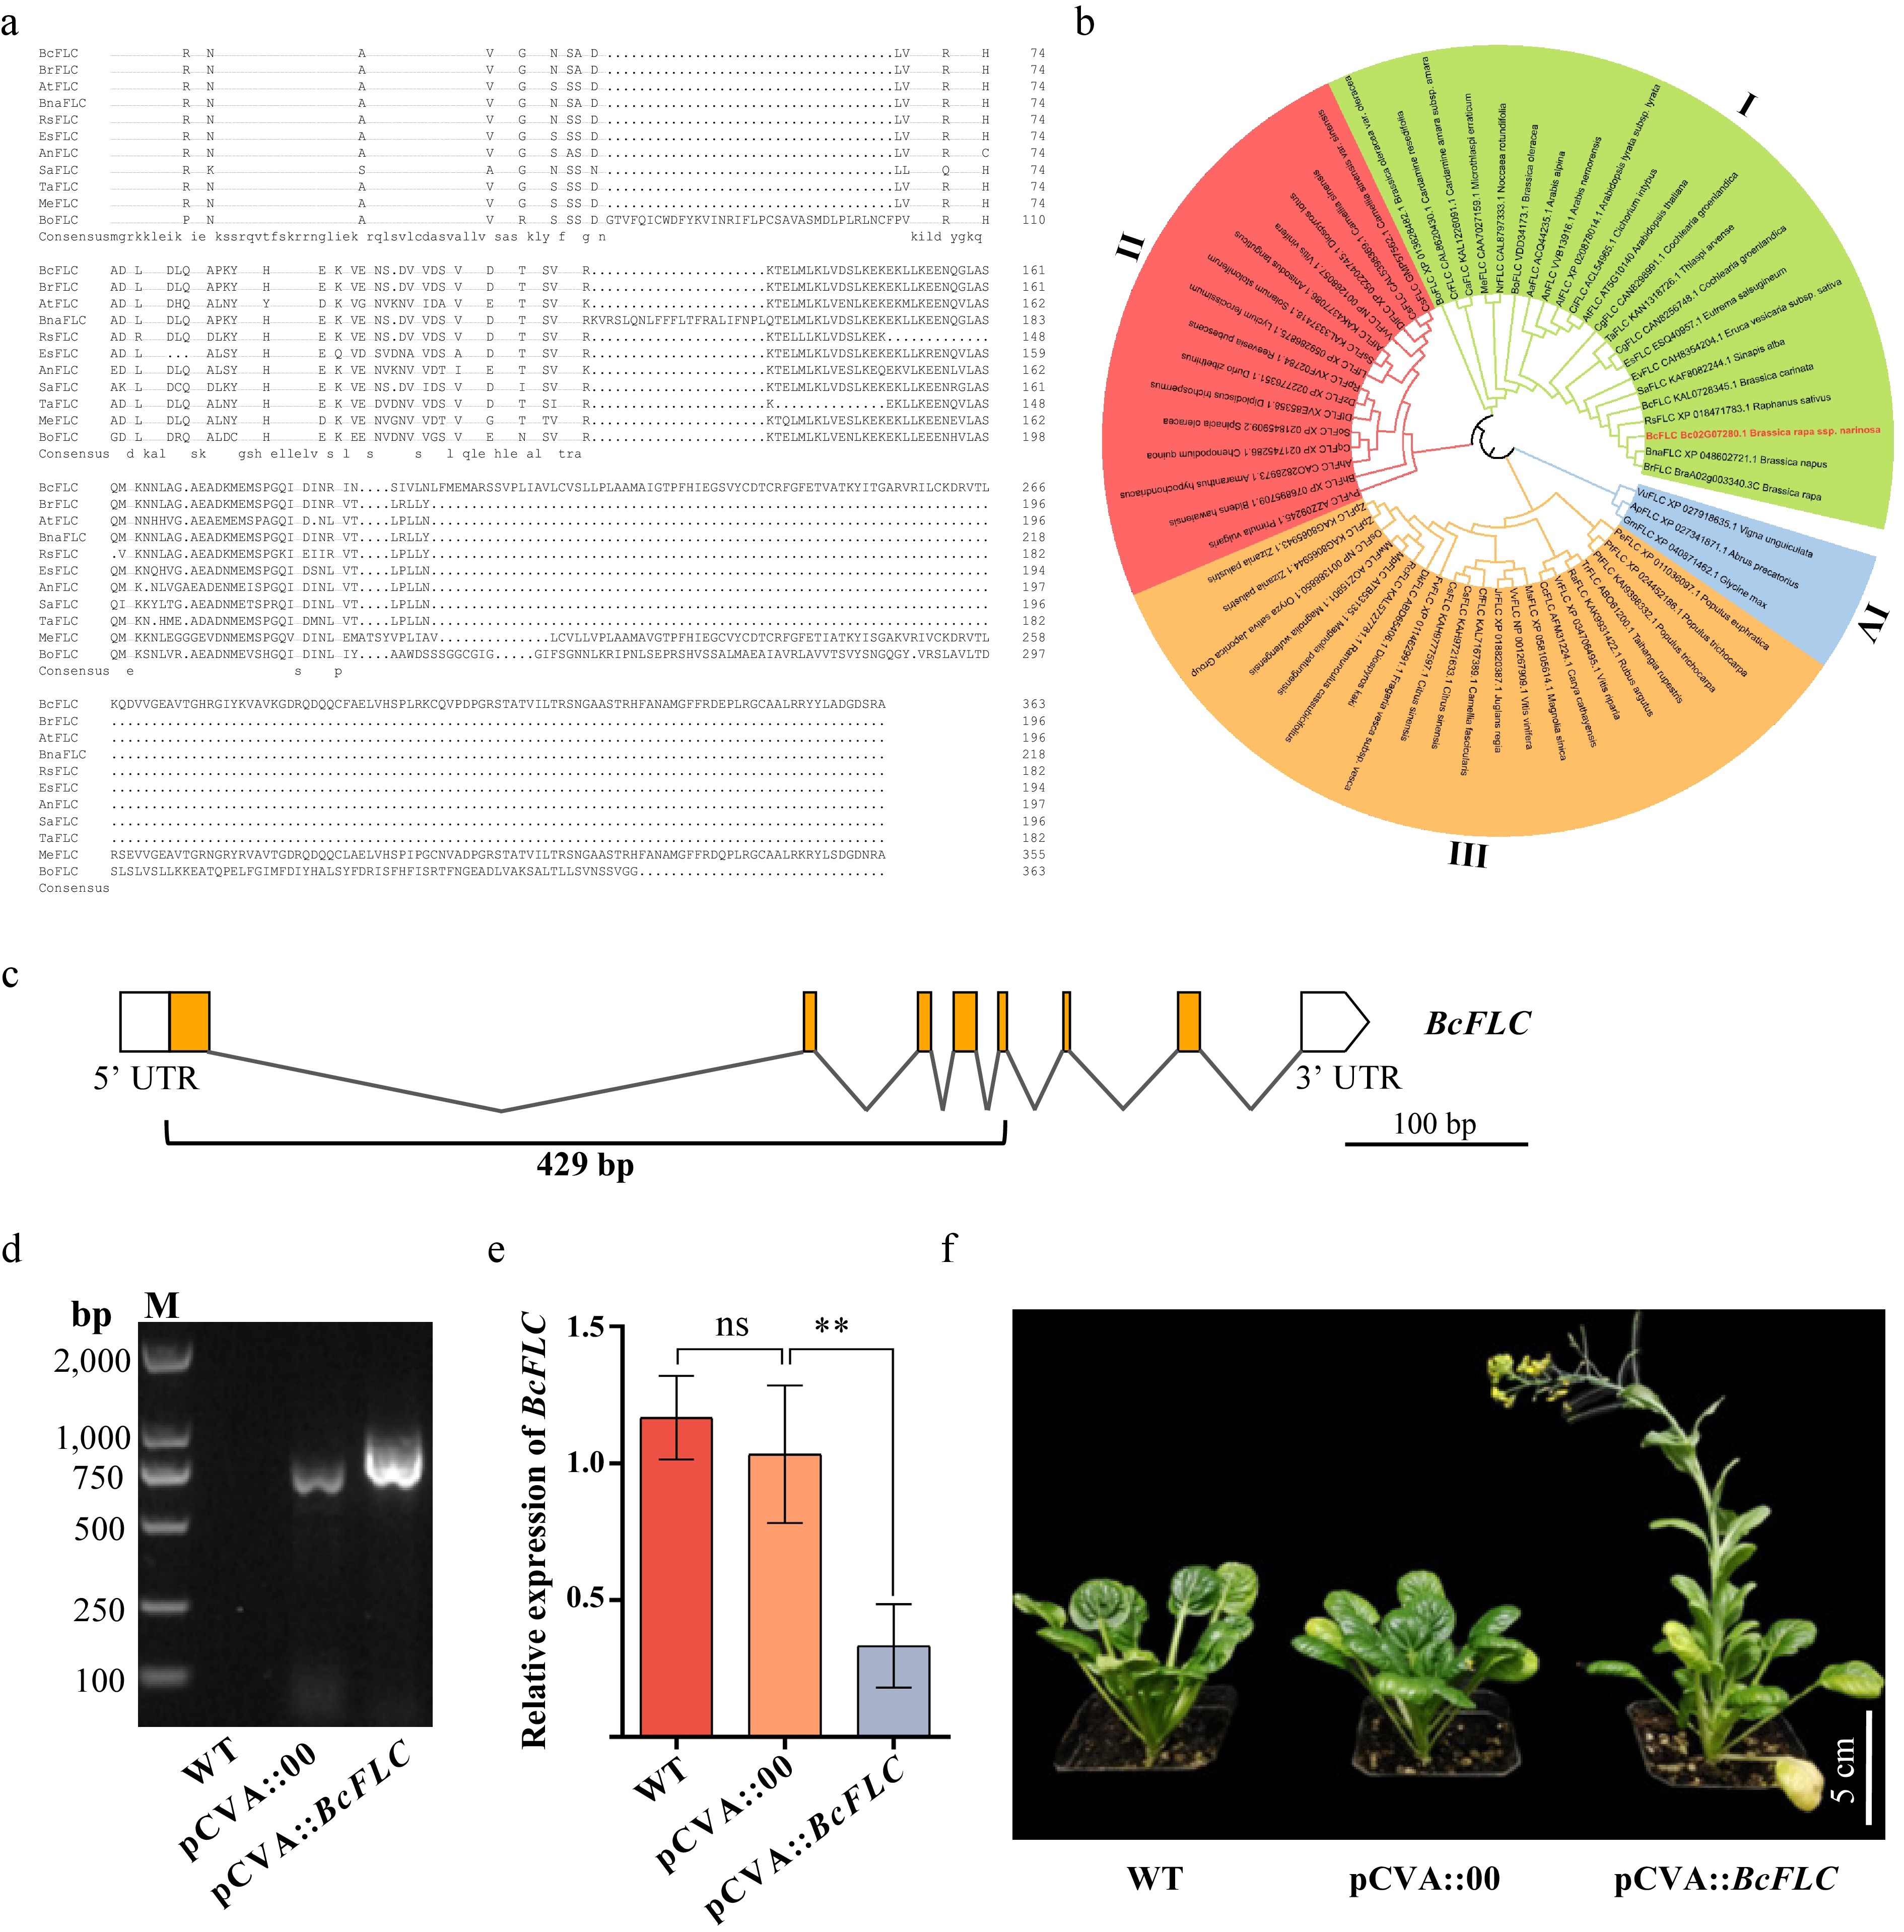
Figure 7.
Multiple sequence alignments and phylogenetic relationship of BcFLC and its orthologs, along with the construction of the pCVA::BcFLC vector and silencing of FLC in wutacai. (a) Multiple sequence alignments of BcFLC and its orthologs from Arabidopsis, Chinese cabbage, Rapeseed, Radish, Salt cress, Lyrate rockcress, White mustard, Field pennycress, Barrel medic, and Broccoli. The alignments were performed using full-length amino acid sequences of FLC. (b) Phylogenetic analysis of FLC proteins from 56 species. The unrooted phylogenetic tree was generated by the neighbour-joining method using the MEGA6 program with 1,000 bootstrap trials. (c) Structure of the BcFLC gene body; the fragment inserted in pCVA is indicated with a black underline. (d) Detection of CaLCuV fragments after VIGS treatments. Lane M shows DNA size markers. (e) Expression analysis of BcFLC by RT-qPCR after infection. Data are presented as mean ± SD (n = 3). Statistical significance was assessed by one-way ANOVA followed by Tukey's HSD post hoc test (ns = not significant, ** p < 0.01). (f) Silencing phenotype of BcFLC in wutacai at 30 dpi. Leaf color was recorded at 1, 3, and 5 d after detachment.
Figures
(7)
Tables
(0)