-
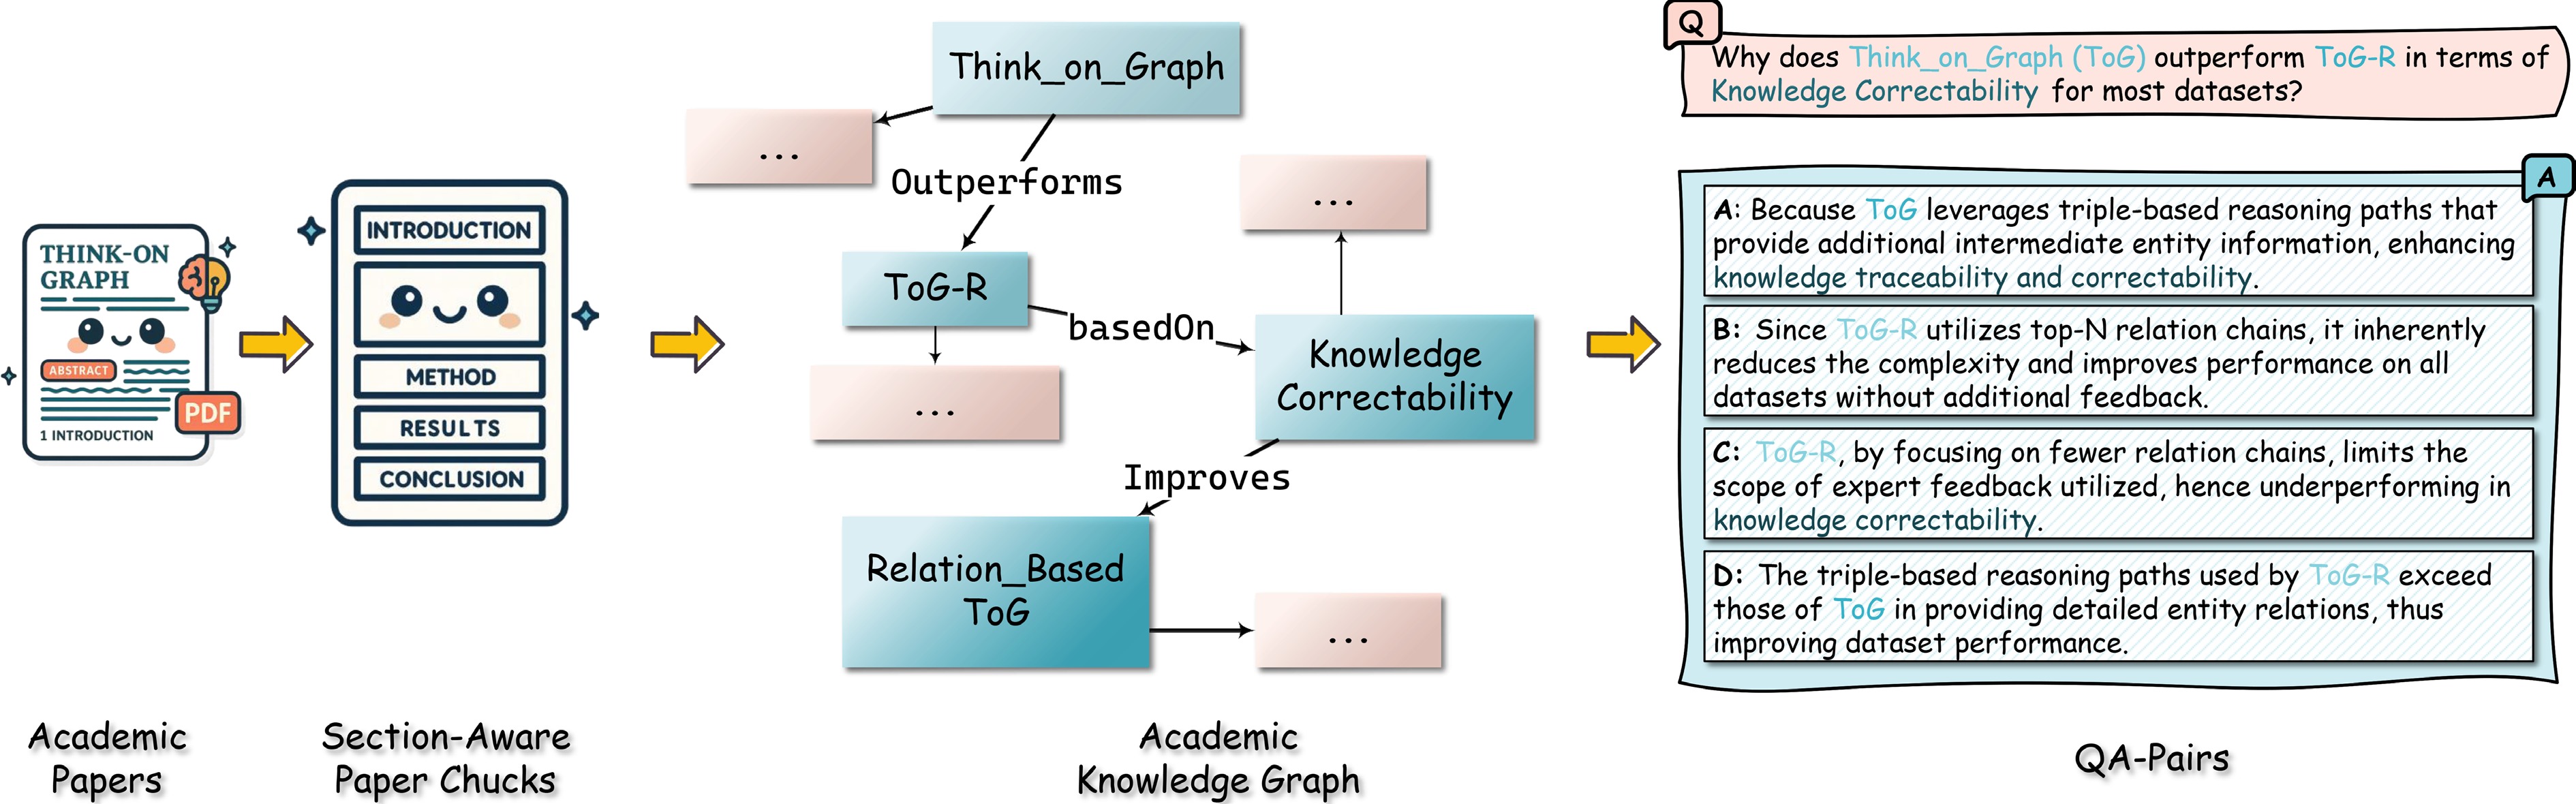
Figure 1.
An illustrative overview of our pipeline. The process begins with an academic paper, which is segmented into section-aware chunks and transformed into a structured knowledge graph capturing the paper's core entities and relations. From this graph, we derive evidence-traceable QA pairs by linking each question and answer directly to its underlying reasoning path and supporting text.
-
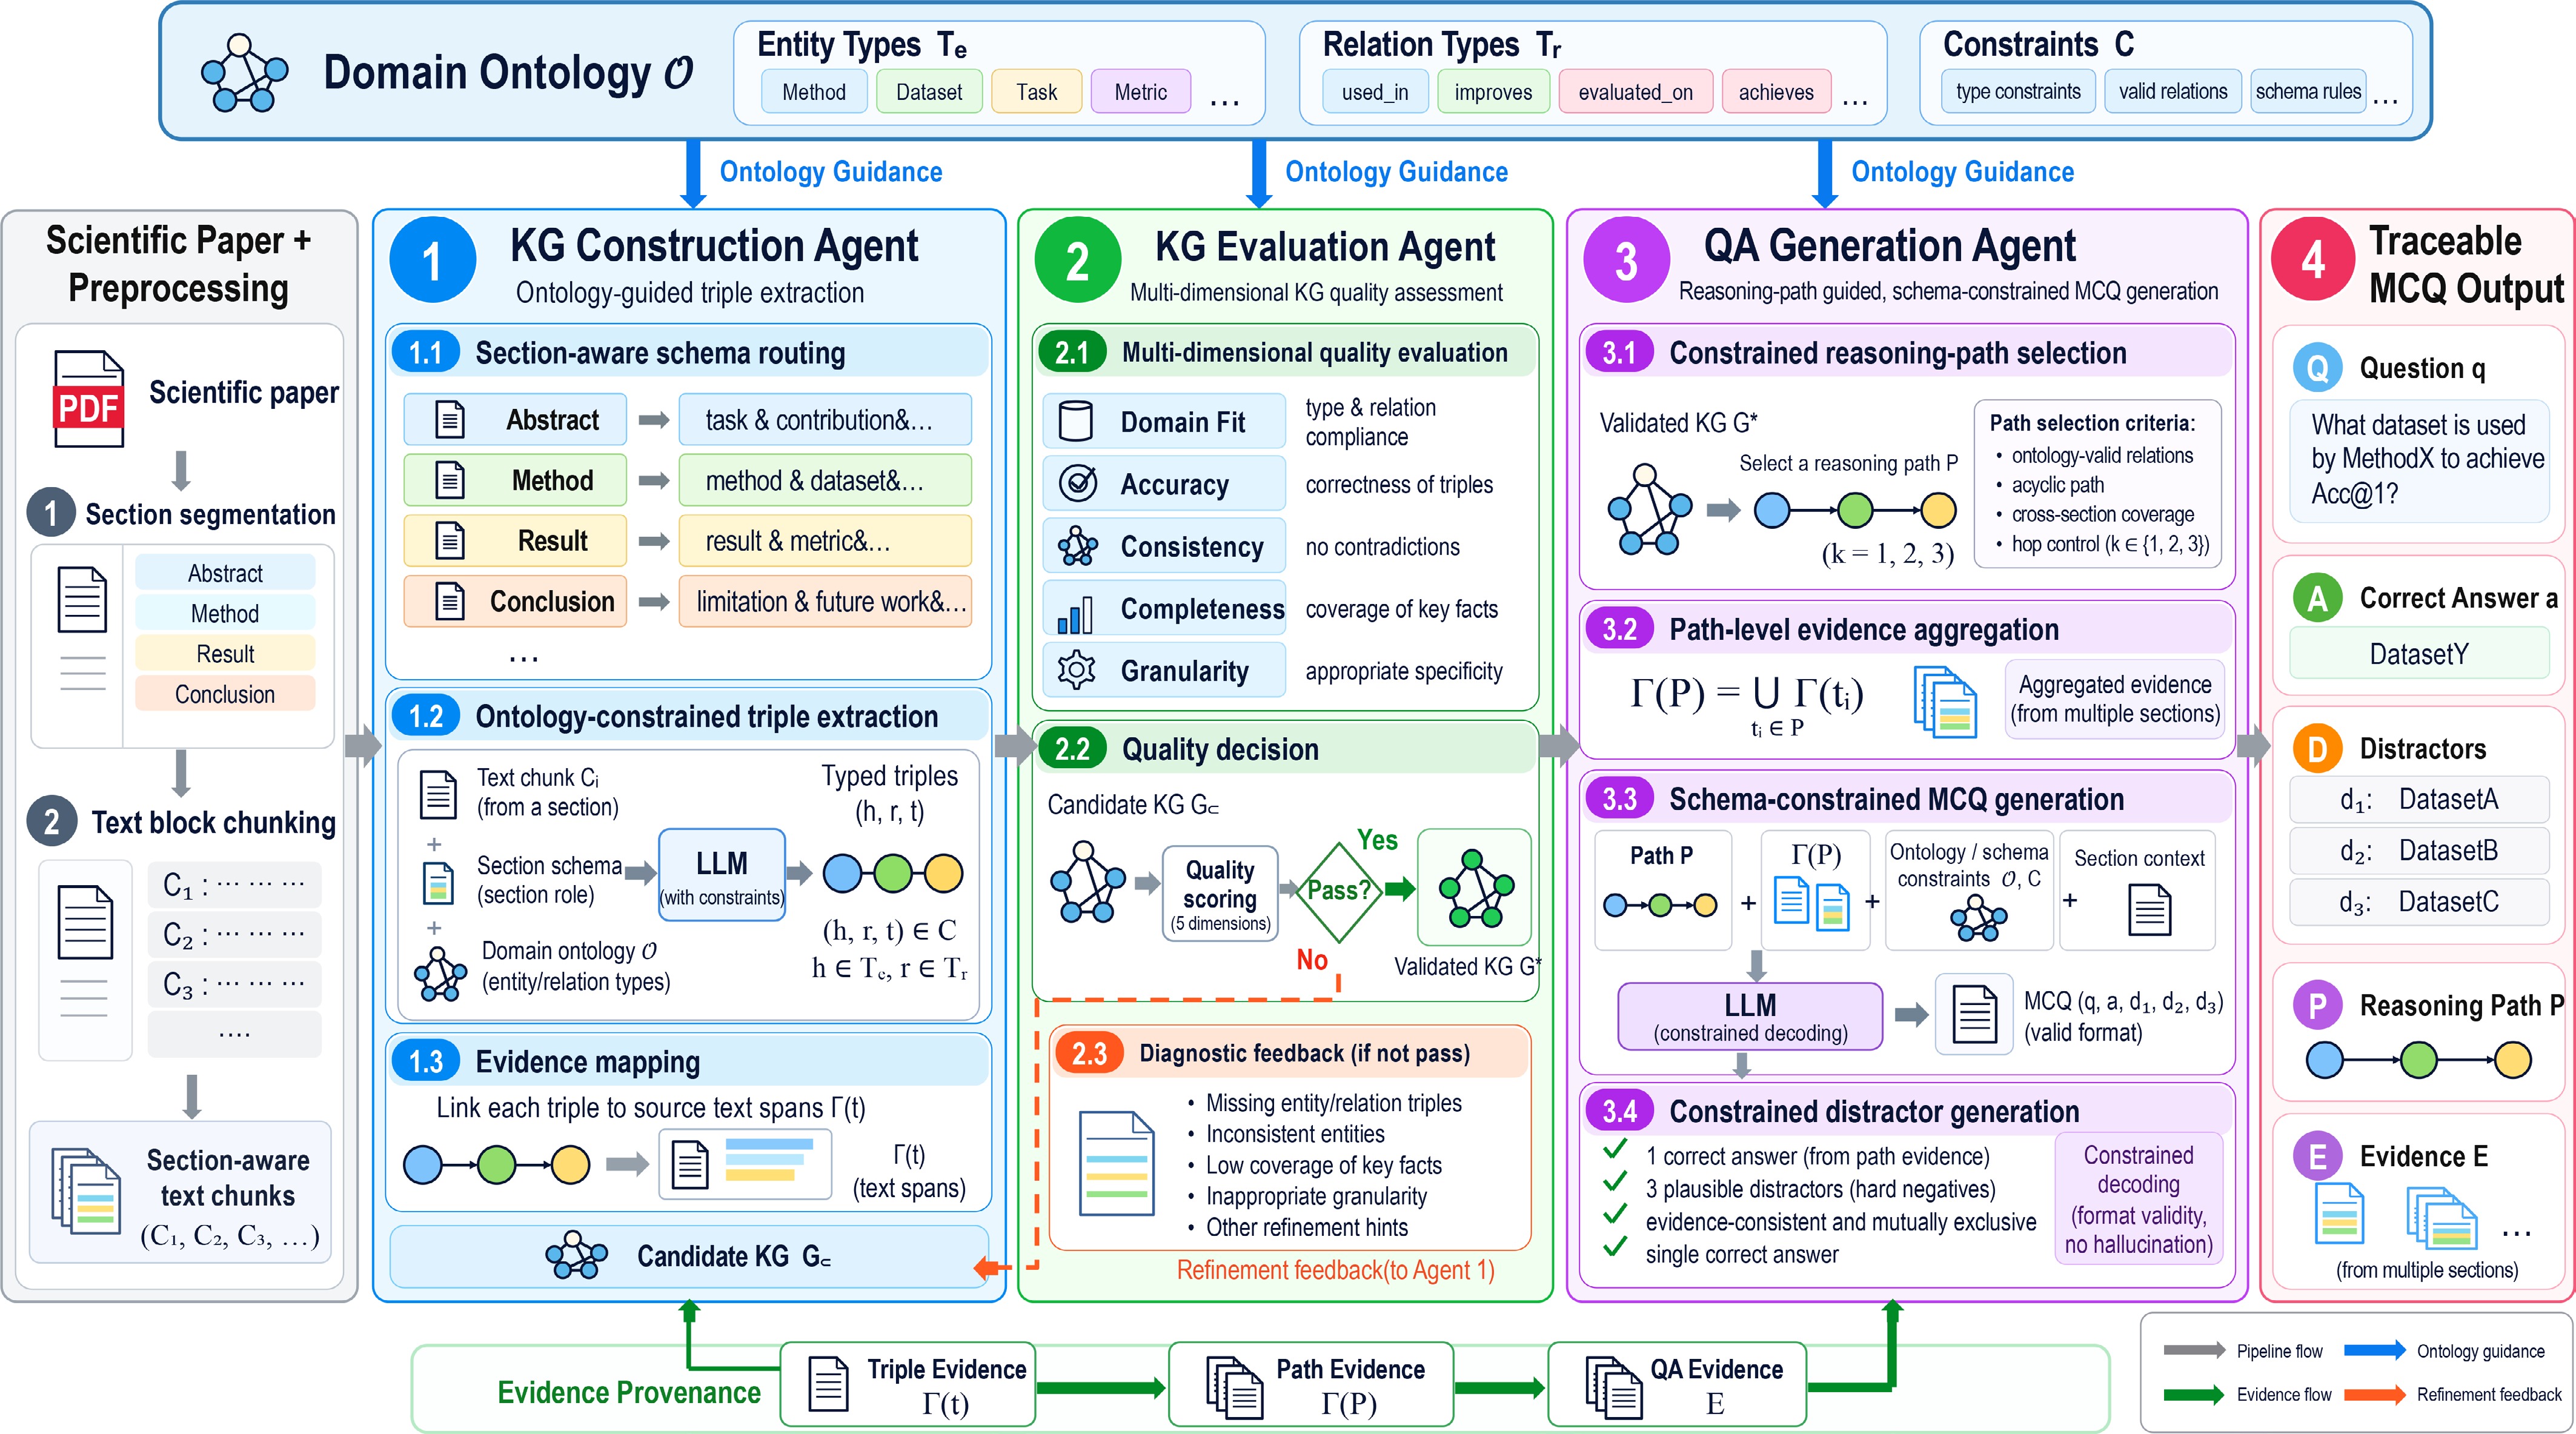
Figure 2.
Overview of the AutoQG framework. AutoQG follows a construct–evaluate–generate pipeline: section-aware scientific papers are transformed into ontology-constrained candidate KGs, audited and refined by a KG Evaluation Agent, and then converted into traceable QA pairs through schema-constrained reasoning paths. Blue arrows indicate ontology constraints, green arrows indicate evidence provenance, and orange dashed arrows indicate diagnostic refinement feedback.
-
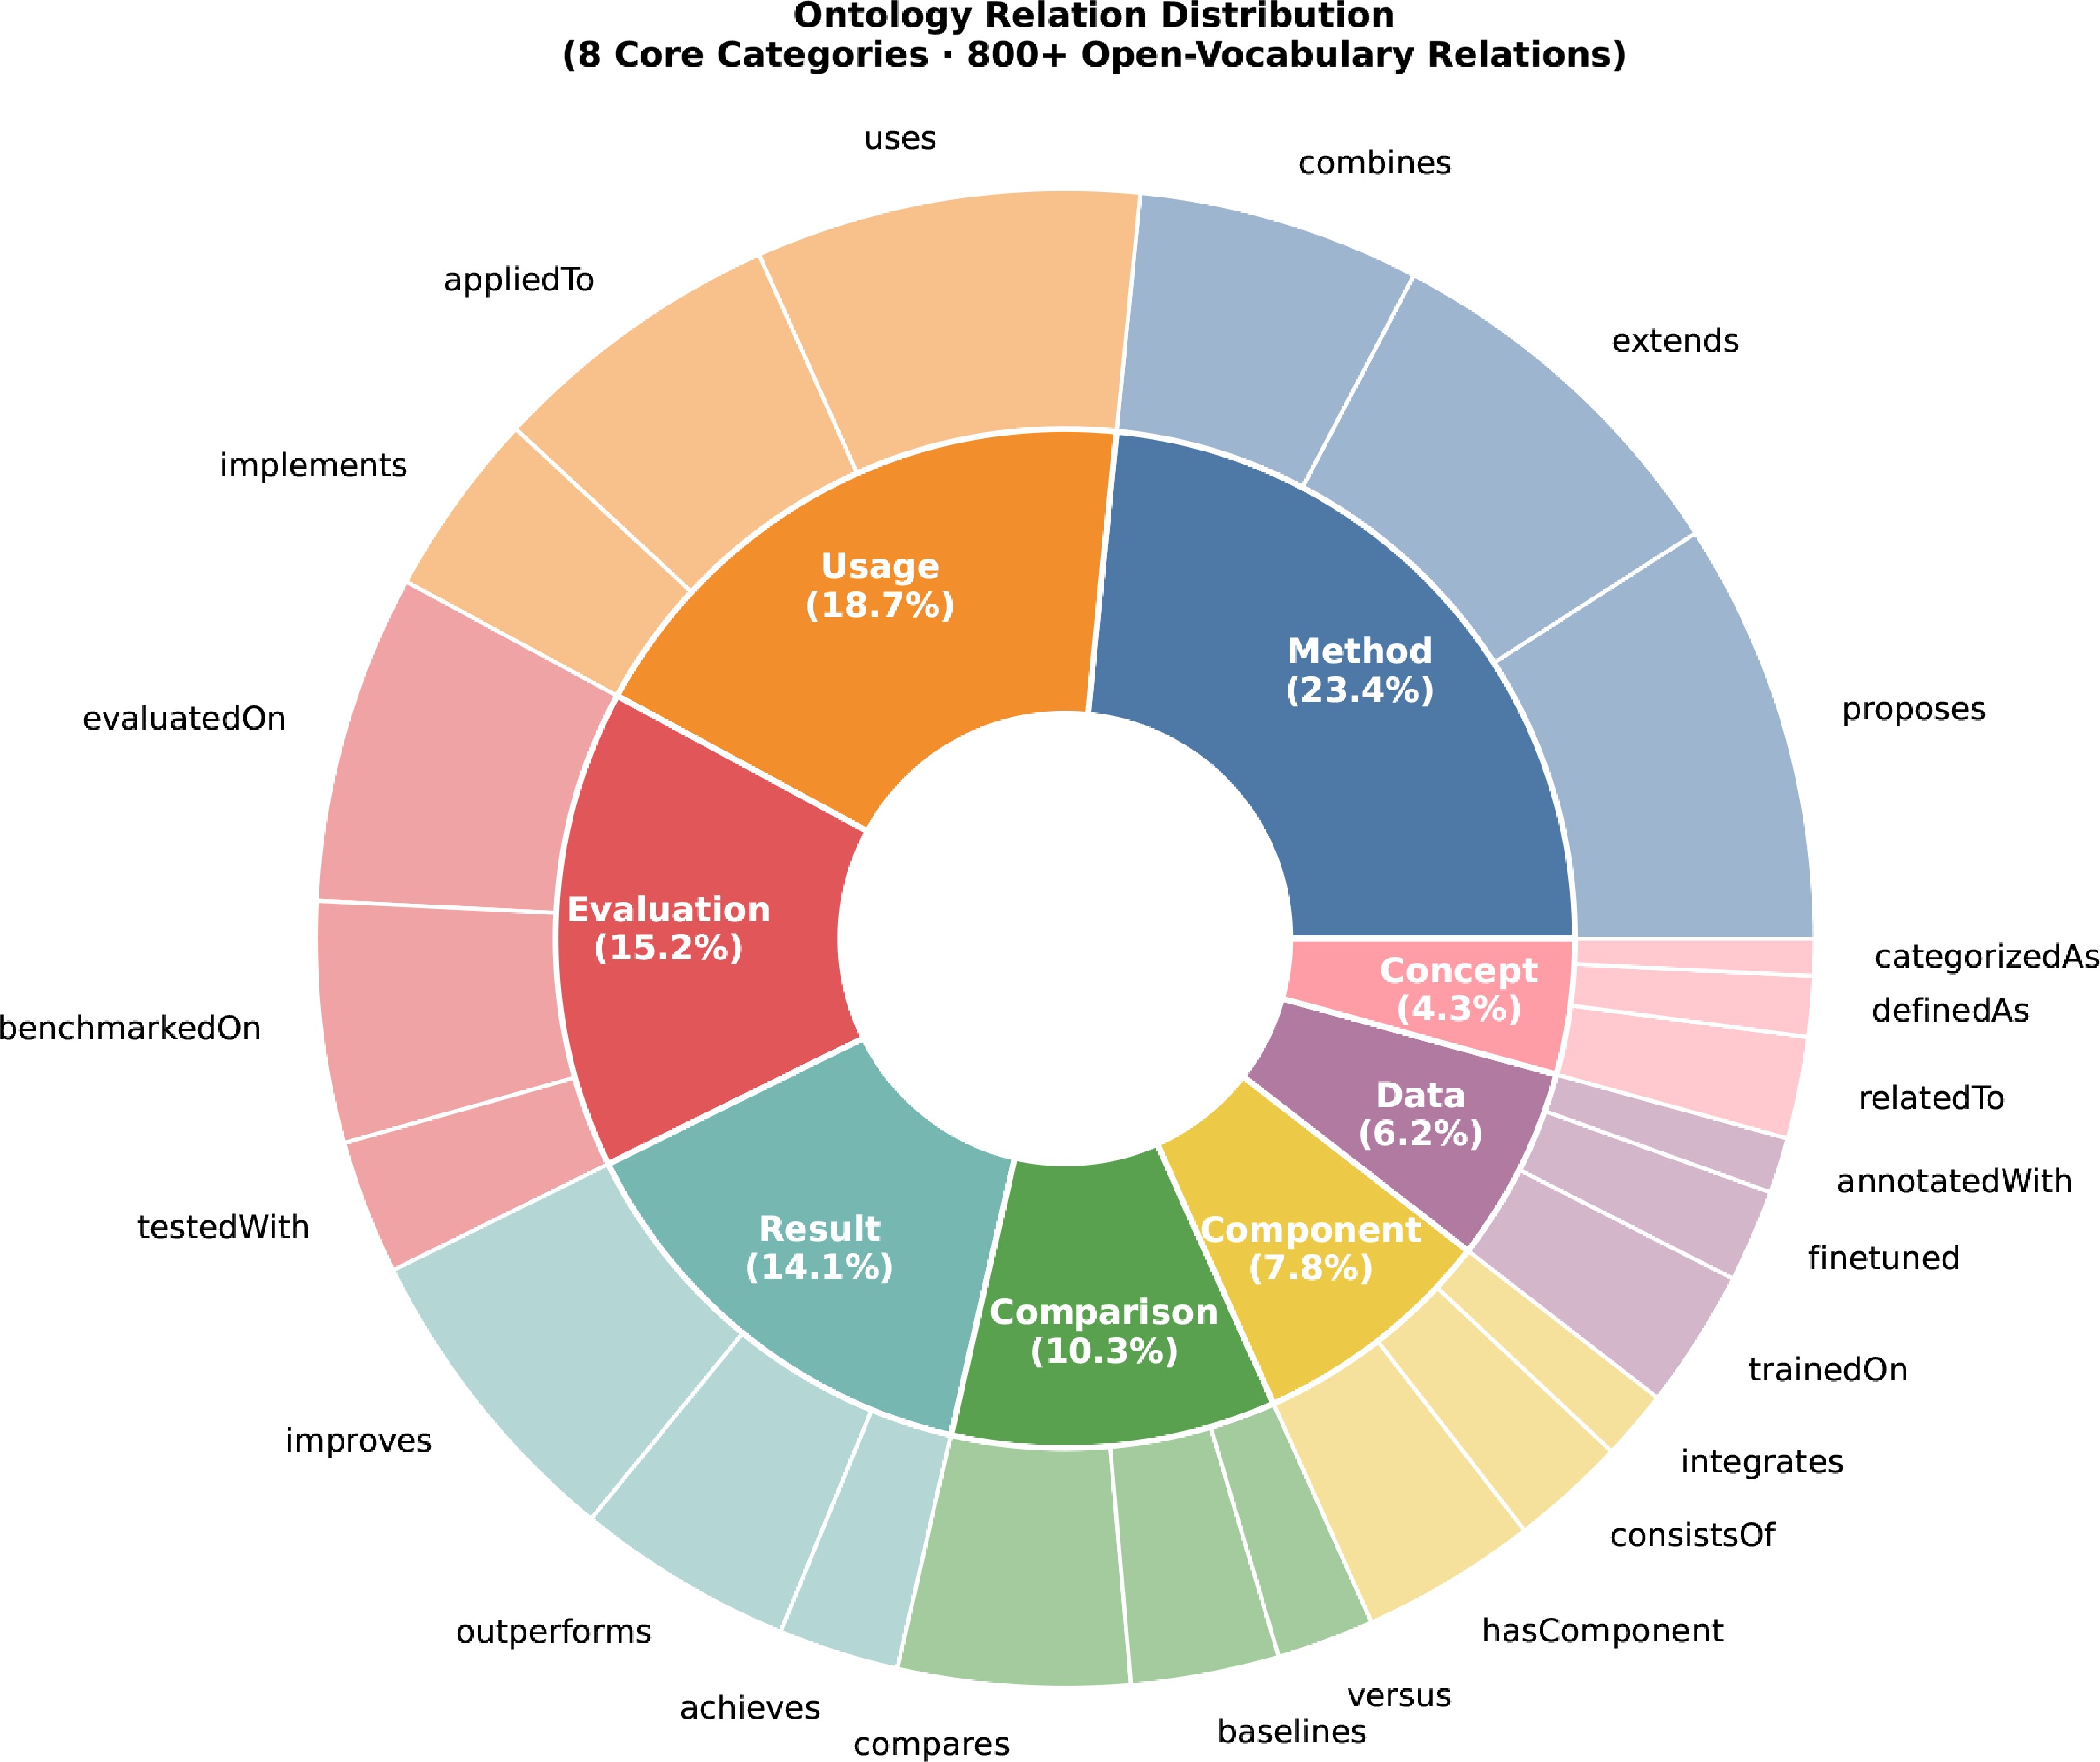
Figure 3.
Sunburst visualization of the AutoQG ontology. Inner ring: eight core discourse categories; outer ring: representative fine-grained relations. Sector size
$ \propto $ -
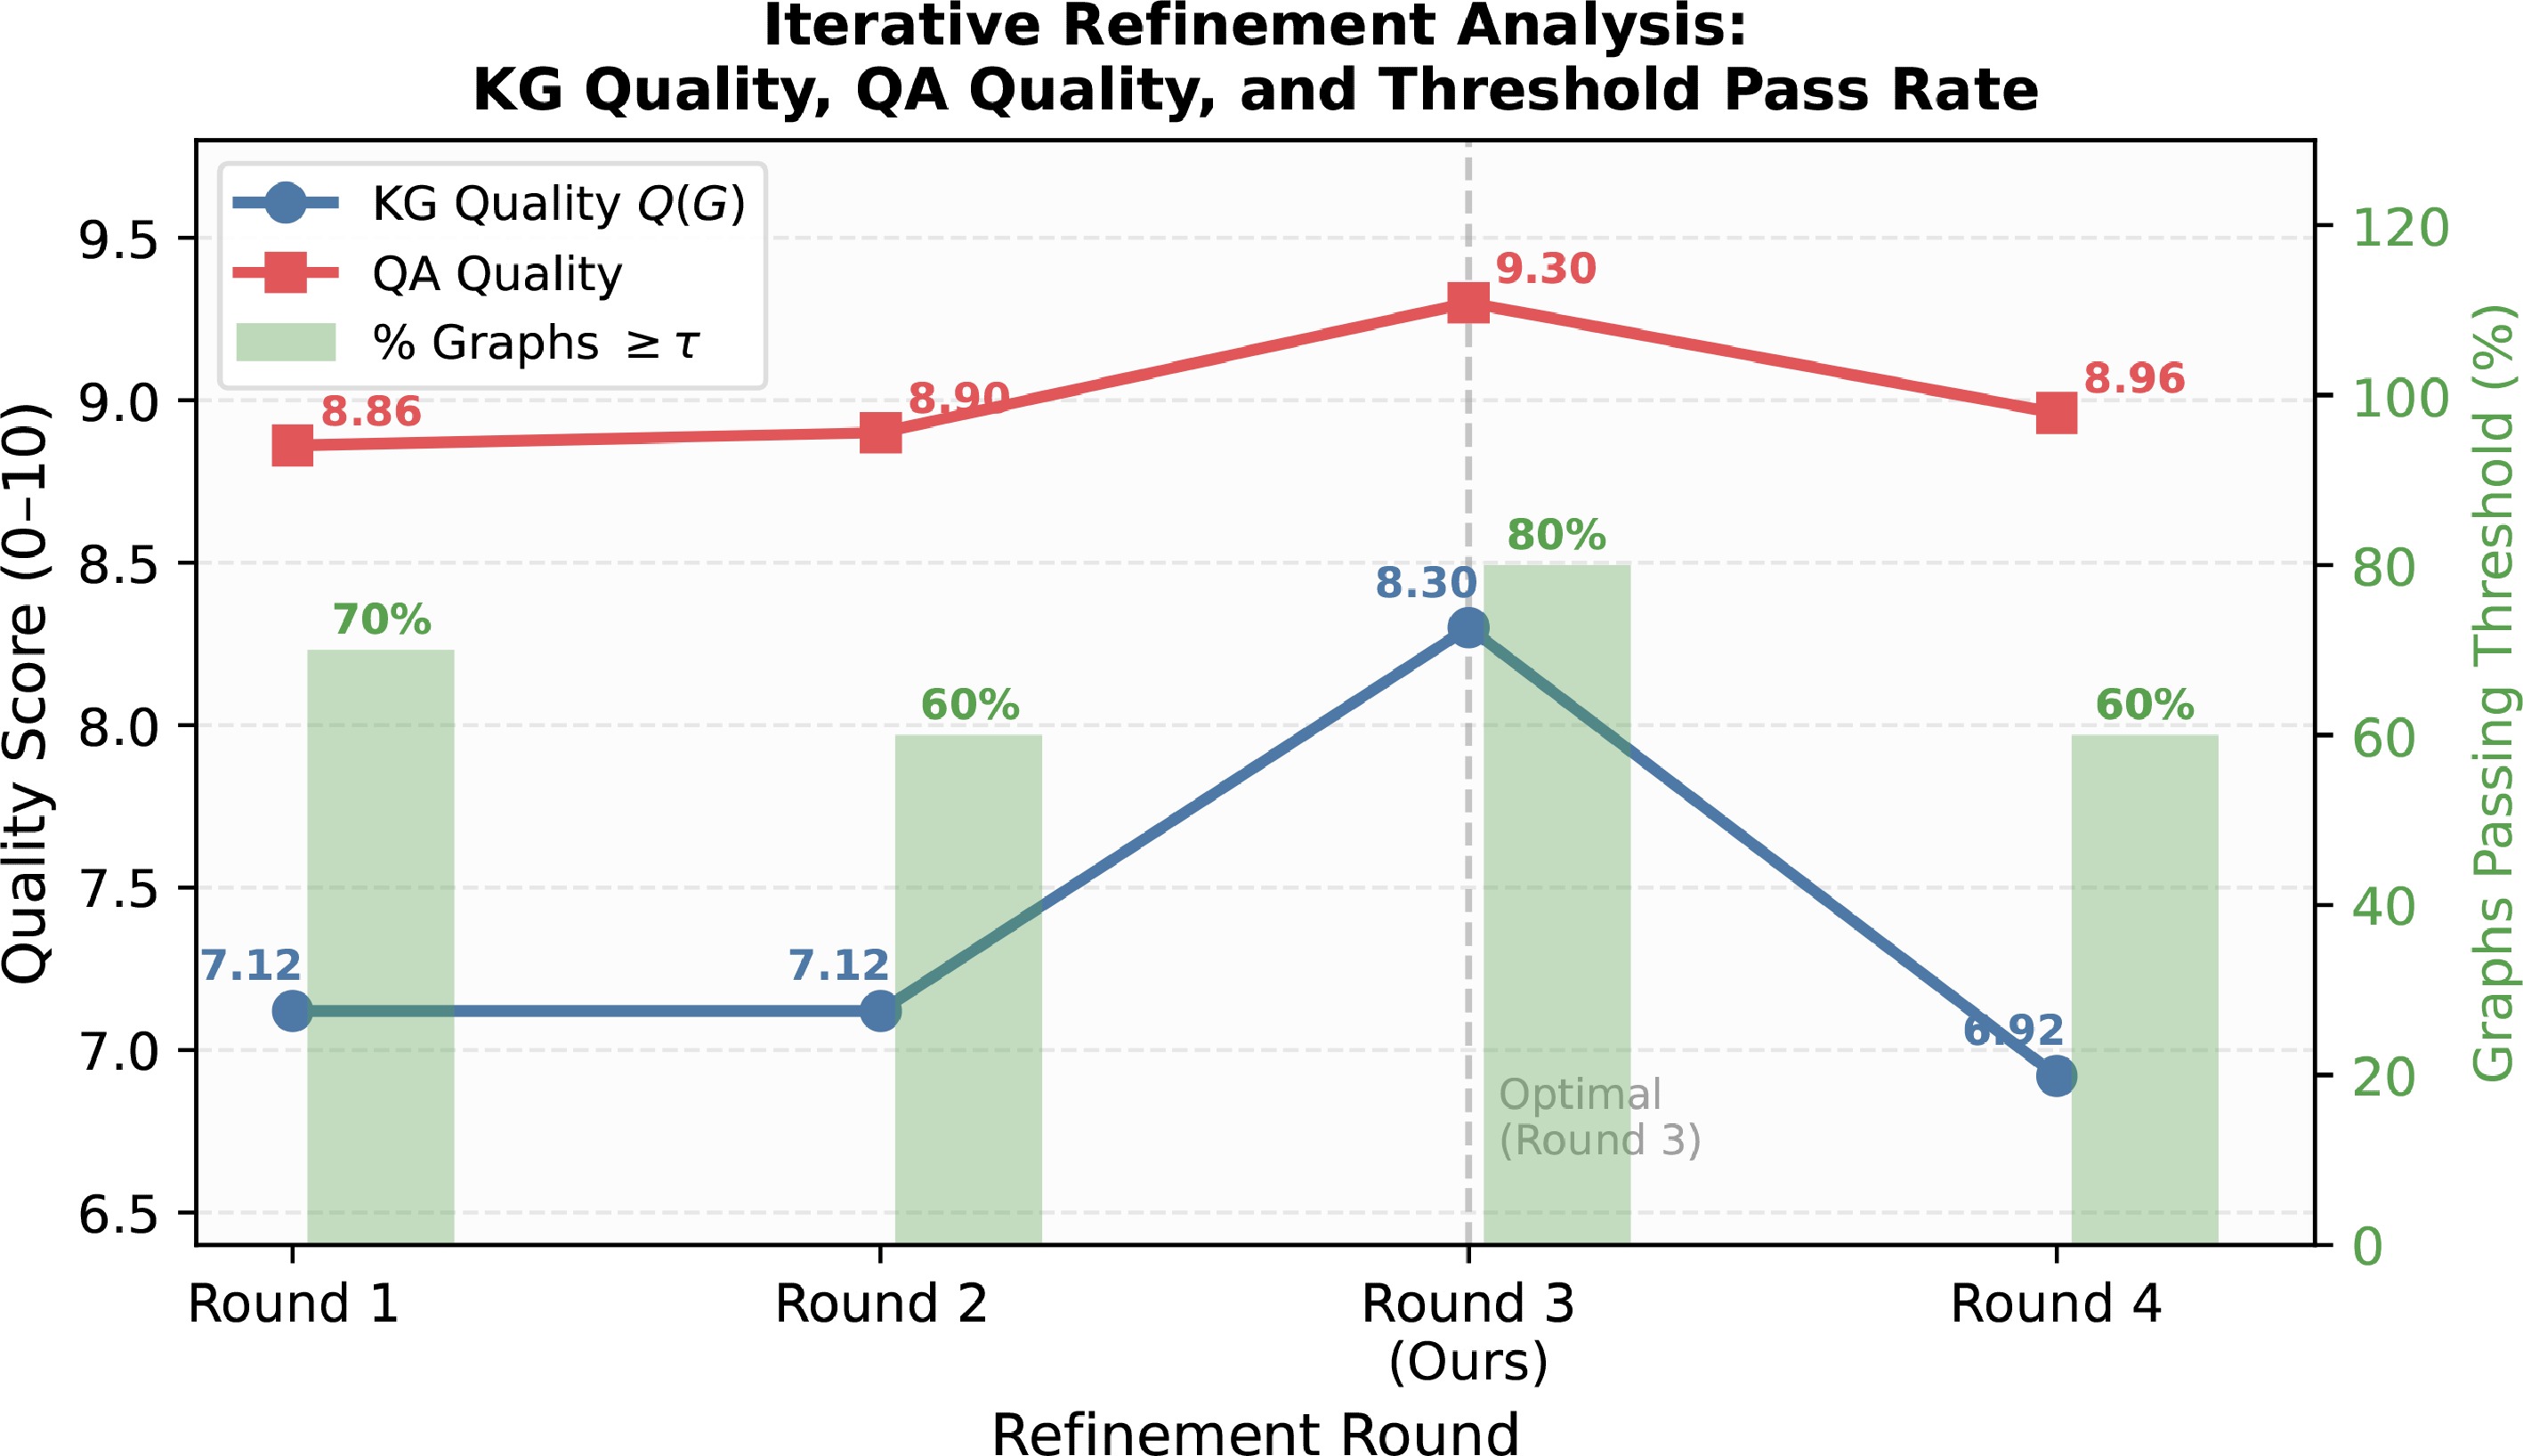
Figure 4.
Dual-axis trend chart of iterative refinement. Blue line (left axis): KG quality
$ Q(G) $ $ \tau\geq8.0 $ -
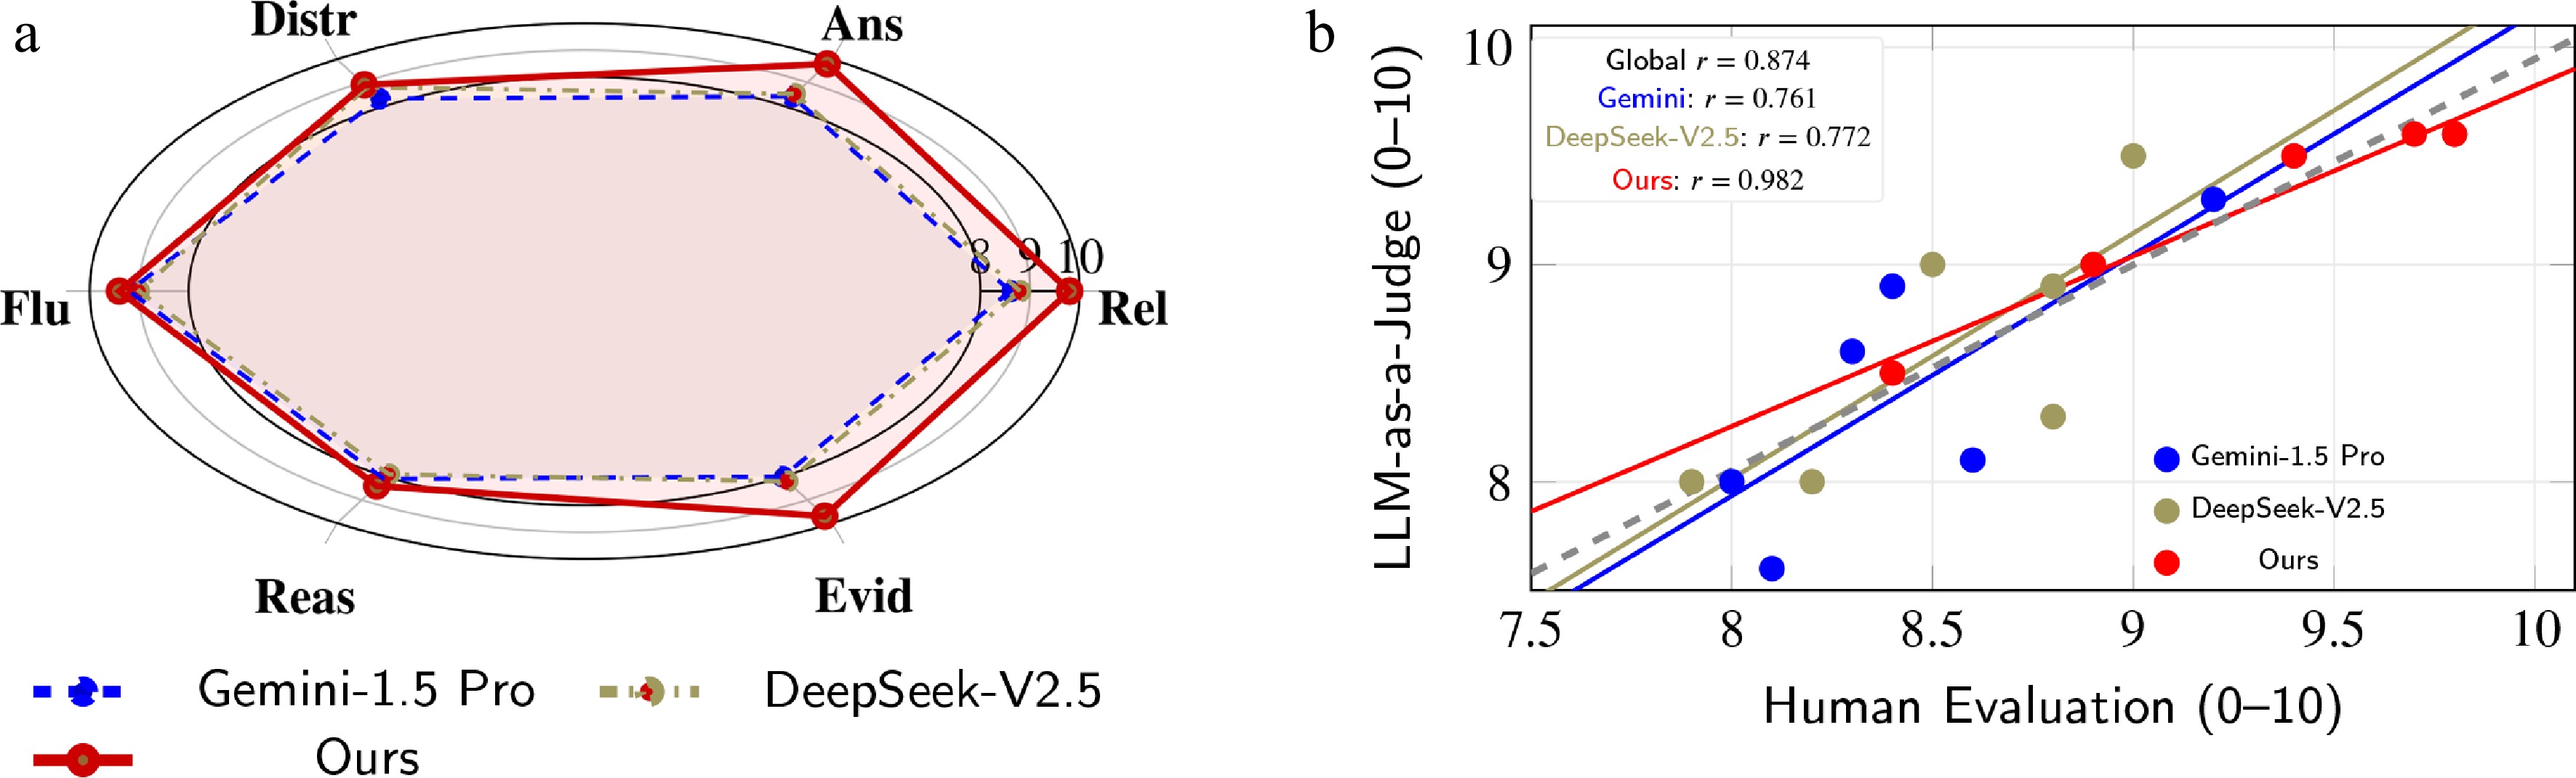
Figure 5.
Comparison of human and LLM-as-a-judge evaluations. (a) Radar chart across six dimensions. (b) Scatter plot with individual regression lines for each model and an overall (dashed) global regression.
-
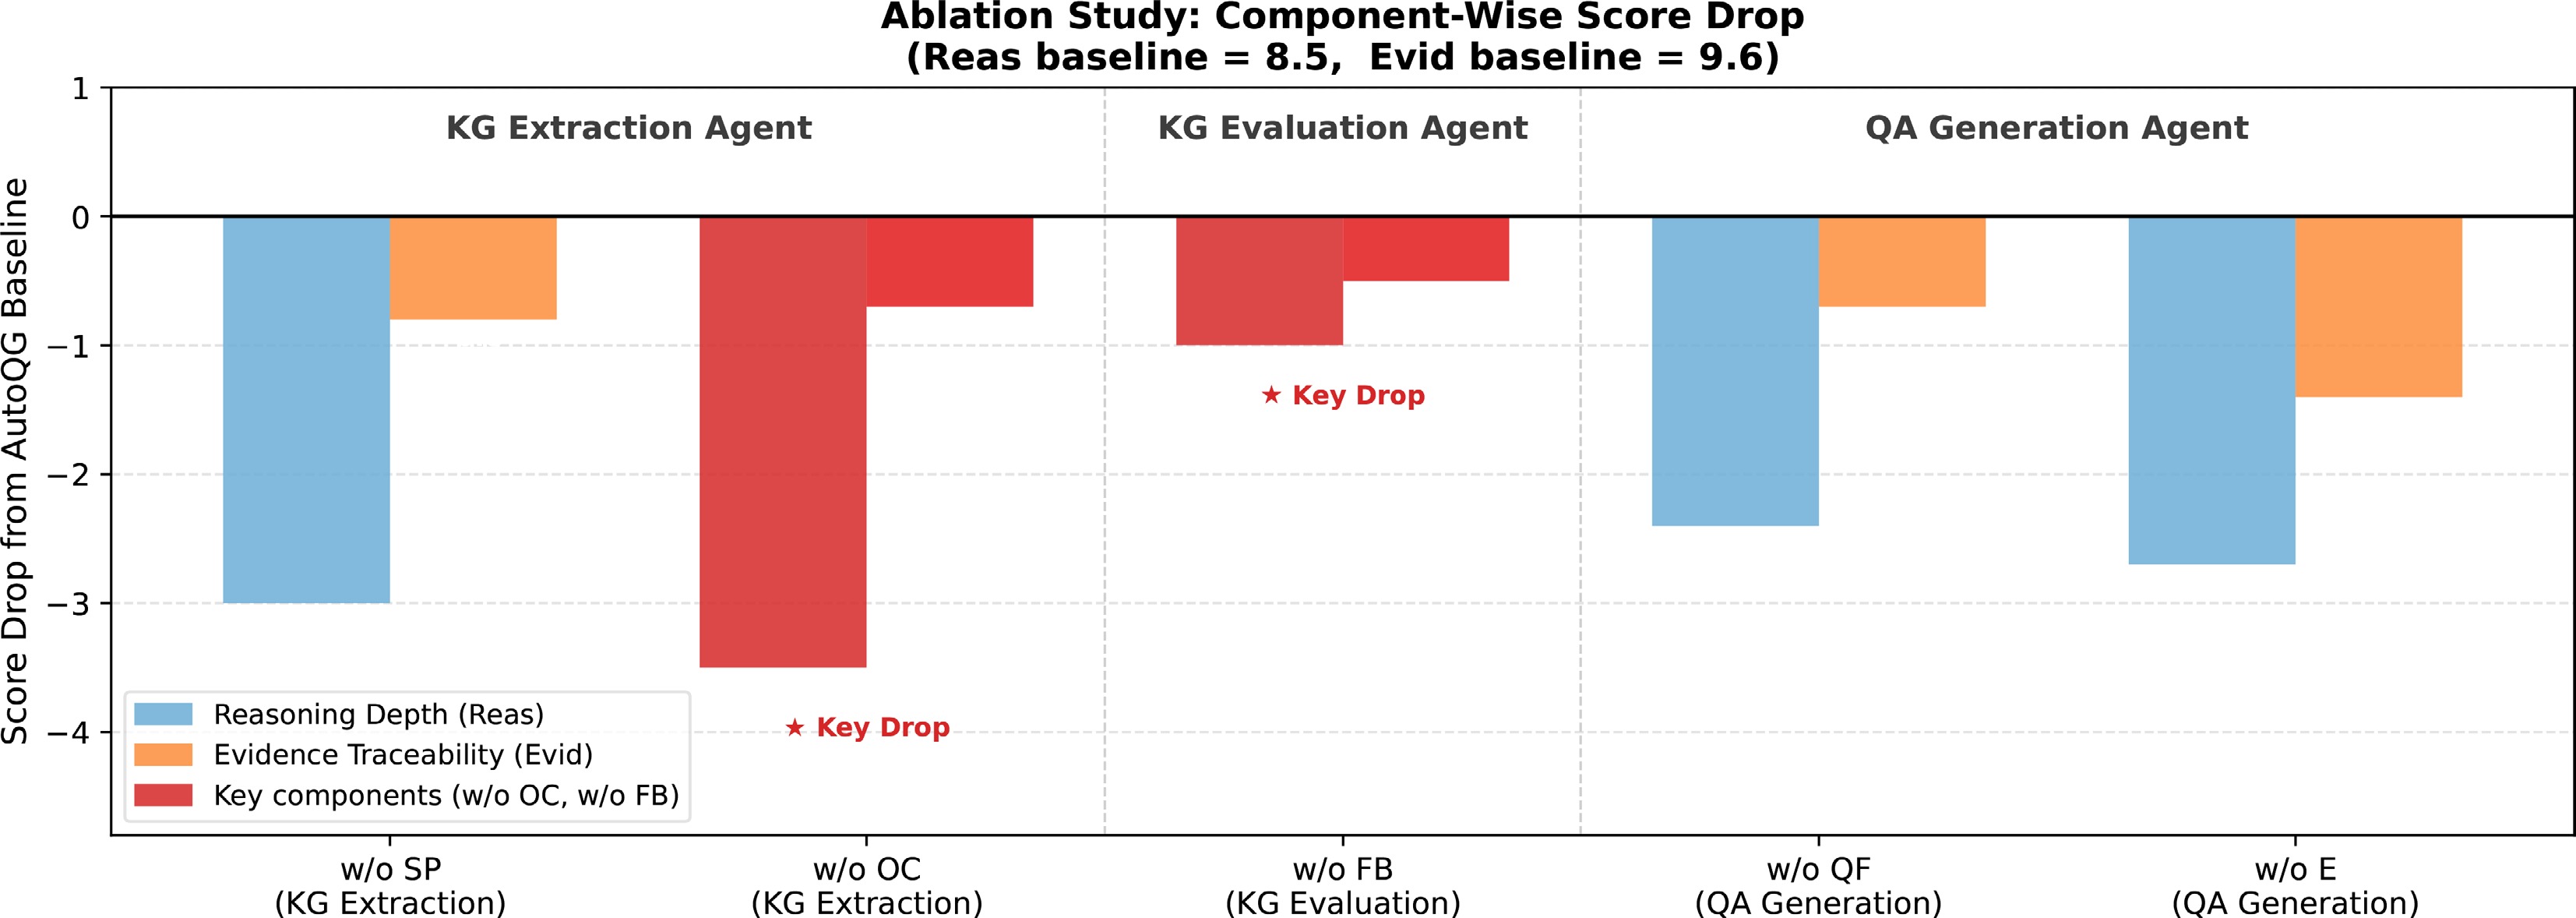
Figure 6.
Component-wise score drop from the full AutoQG baseline (Reas = 8.5, Evid = 9.6). Each bar shows how much Reasoning Depth (Reas, blue) and Evidence Traceability (Evid, orange) decrease when a single component is removed from the pipeline. Bars highlighted in red correspond to the two most critical ablations: removing Ontology Constraints (w/o OC) from the KG Extraction Agent causes the largest Reas drop (
$ -3.5 $ $ -1.0 $ -
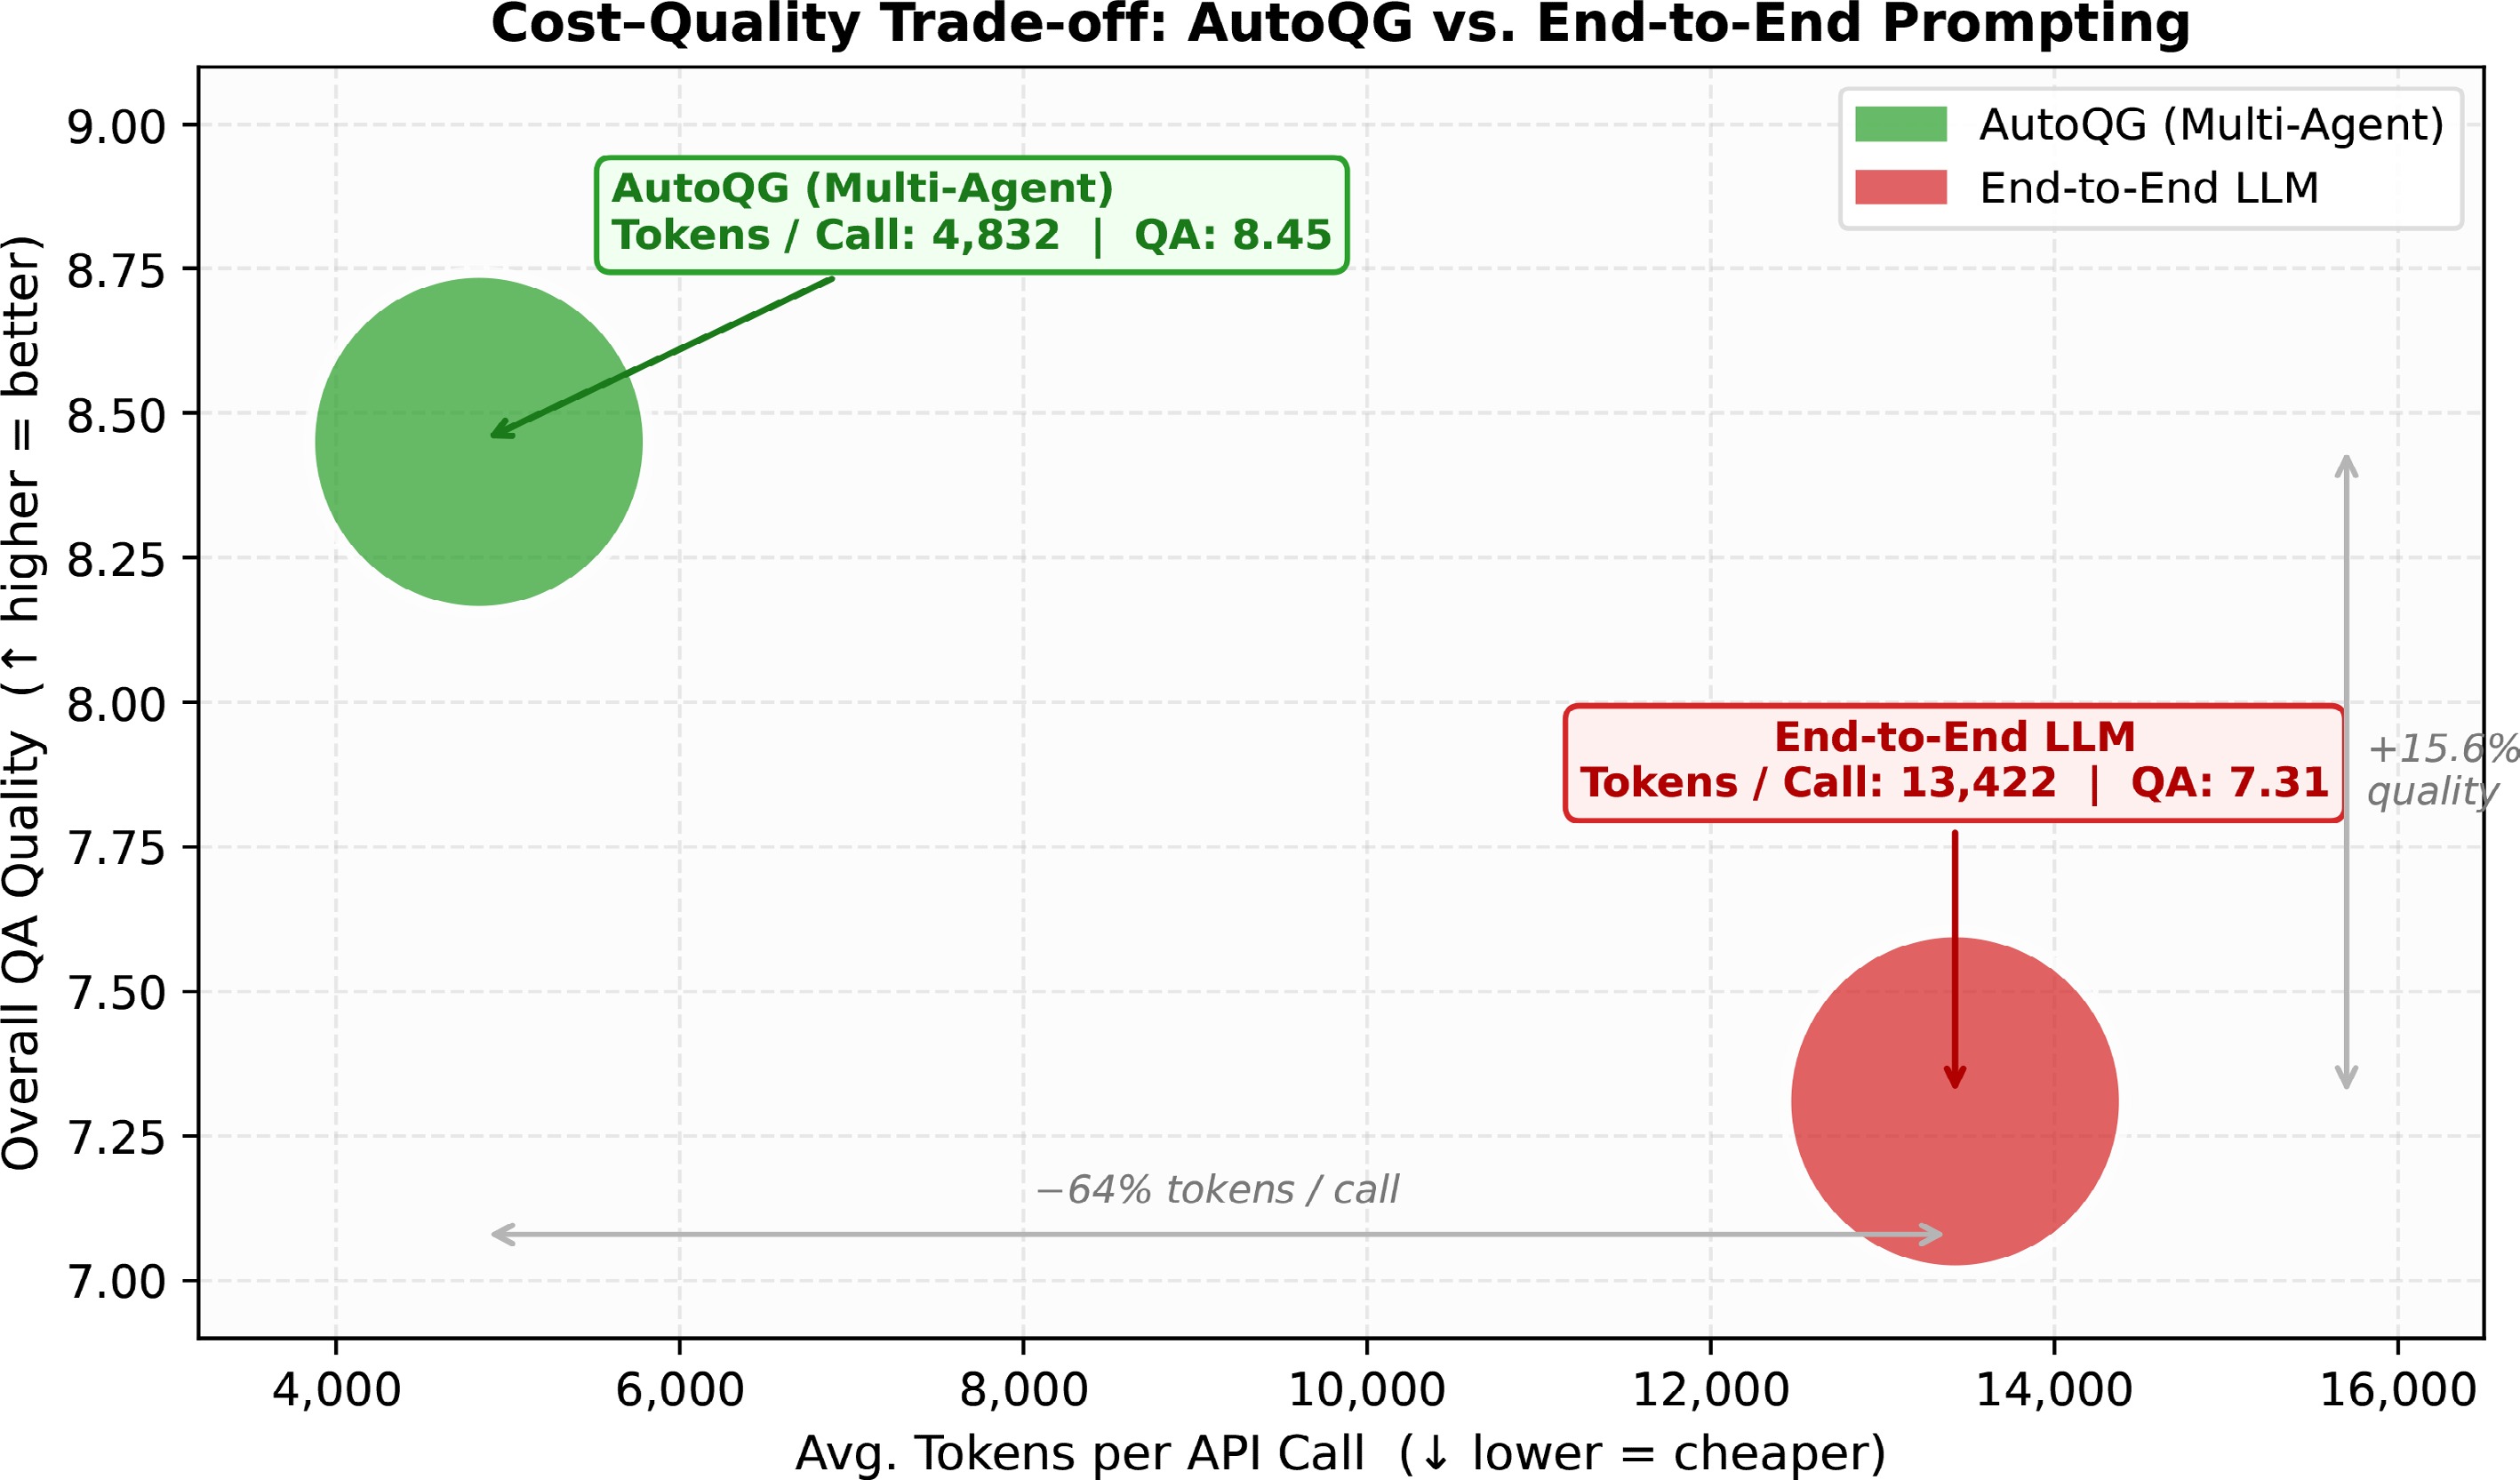
Figure 7.
Cost–quality scatter: AutoQG achieves substantially lower average tokens per call and higher QA quality than end-to-end prompting.
-
Metric AutoQG20k AutoQG7k Papers 4,435 4,435 Triples 243,214 243,214 QA pairs 20,424 7,921 Table 1.
Dataset statistics of AutoQG20k and AutoQG7k.
-
Category Method Gold-set evaluation LLM-as-a-Judge evaluation Prec. Rec. F1 Dom Acc Con Com Gra Final Zero-shot extraction methods Self-prompting 35.7 35.7 35.7 4.9 5.0 5.2 5.1 5.6 5.2 QA4RE 32.3 30.4 31.3 5.8 5.1 5.0 5.5 5.3 5.3 ChatIE 16.5 34.1 21.4 5.9 5.3 5.2 5.6 5.3 5.3 LLM-based extraction methods Gemini-1.5-pro 23.4 17.5 20.0 8.9 6.9 7.1 6.2 7.1 7.3 DeepSeek-V2.5 37.0 34.0 37.0 8.1 7.3 7.7 6.5 7.4 7.4 Claude-3.5 Opus 30.0 28.6 29.3 9.1 7.0 7.4 6.7 7.2 7.5 O3 35.0 26.4 30.1 8.1 7.3 7.5 7.3 7.4 7.5 O1 53.8 26.4 35.4 9.3 8.1 8.8 6.8 7.7 8.1 Ours 73.6 71.2 72.3 9.3 8.5 8.9 7.5 7.5 8.3 Agentic baselines LangExtract 16.7 26.5 30.2 8.8 8.7 8.5 7.4 7.3 8.2 EPT-LLM 30.5 29.1 30.1 8.7 8.9 8.4 7.5 7.4 8.3 The table reports gold-set Precision/Recall/F1, and LLM-as-a-judge scores. Bold numbers denote the best results. Table 2.
Evaluation of knowledge graph extraction quality on the manually annotated gold set.
-
Round KG dimensions $ Q(G) $ $ \Delta Q(G) $ % $ \geq\tau $ QA dimensions QA $ \Delta $ Dom Acc Con Com Gra Rel Ans Distr Flu Reas Evid 1 8.8 6.9 6.7 6.2 7.0 7.12 — 70% 9.1 9.0 8.4 9.3 8.3 9.1 8.86 — 2 8.8 7.2 6.5 6.3 6.8 7.12 +0.00 60% 9.2 8.9 8.5 9.4 8.4 9.0 8.90 +0.04 3 (Ours) 9.3 8.5 8.9 7.5 7.5 8.30 +1.18 80% 9.6 9.6 9.0 9.5 8.5 9.6 9.30 +0.40 4 8.9 6.7 6.4 6.0 6.6 6.92 −1.38 60% 9.4 9.1 8.5 9.4 8.3 9.1 8.96 −0.34 The table reports both per-dimension scores and composite scores for each refinement round. Round 3 is selected as the default configuration because it achieves the best balance between KG quality, QA quality, and threshold pass rate before over-refinement begins. Round 3 represents the optimal configuration with the highest overall scores and threshold pass rate. Bold numbers denote the best results. Table 3.
Iterative refinement results across KG and QA quality dimensions.
-
Method Human evaluation (0–10) LLM-as-a-judge (0–10) Rel Ans Distr Flu Reas Evid Rel Ans Distr Flu Reas Evid GPT-5.1 8.9 9.4 8.8 9.2 8.3 8.6 9.4 9.0 9.2 9.4 8.6 8.4 Claude Sonnet 4 8.4 8.4 8.3 9.2 8.2 8.2 8.4 7.9 8.7 9.3 7.6 7.6 Baichuan4 8.9 8.4 8.6 9.2 8.1 8.3 8.9 8.6 9.0 9.4 8.0 7.9 Qwen3-32B 8.9 8.2 8.3 9.1 8.1 8.1 8.2 8.0 8.0 8.9 7.4 7.5 GLM-4 7.6 7.4 7.3 9.2 8.1 7.9 7.6 7.4 7.5 8.6 7.0 7.0 Gemini-1.5 Pro 8.6 8.4 8.3 9.2 8.1 8.0 8.1 8.9 8.6 9.3 7.6 8.0 DeepSeek-V2.5 8.8 8.5 8.8 9.0 7.9 8.2 8.9 9.0 8.3 9.5 8.0 8.0 Ours 9.8 9.8 8.9 9.4 8.4 9.7 9.6 9.6 9.0 9.5 8.5 9.6 All LLM-as-a-judge scores are averaged across three independent judges. Scores are averaged across QA pairs and reported on a 0–10 scale. Bold numbers denote the best results and underlined numbers denote the second best results. Table 4.
Human evaluation and LLM-as-a-judge evaluation results.
-
Category Model AutoQG-20k AutoQG-7k 1-hop 2-hop 3-hop Acc
(w/Ev.)QA-Pair Base models GPT-4o 95.2 91.0 72.5 96.1 43.3 Mistral Large 2 94.2 91.0 76.4 95.2 55.3 WizardLM-2 70B 89.6 72.4 64.6 92.6 35.9 Qwen-2.5 14B 86.0 81.3 67.3 99.7 30.6 DeepSeek-V2.5 86.9 82.7 64.7 98.6 33.7 Gemini-1.5-flash 87.5 77.3 65.8 98.7 29.0 GLM-4 83.1 75.0 65.6 98.7 29.0 Claude-haiku 82.9 79.7 60.2 99.7 31.4 Mistral-7B (Base) 85.7 82.0 62.2 99.2 28.0 DBRX 83.4 79.2 56.2 90.8 30.7 Reasoning models Claude-3.5 Sonnet 86.0 84.0 75.8 95.9 52.9 Grok-2 94.0 88.0 69.6 92.9 41.9 Mistral-7B 76.5 69.2 60.7 90.9 27.6 Results are strict accuracy (%) on QA pairs, difficulty-controlled hops, and accuracy with/without evidence. Table 5.
Extended evaluation of the generated QA benchmark under two settings: AutoQG-20k (left) and AutoQG-7k (right).
-
Strategy Rel Ans Distr Flu Reas Evid S1 (KG + sent) – ours 9.6 9.6 9.0 9.5 8.5 9.6 S2 (sent-only) 9.4 9.5 8.5 9.4 8.0 9.1 S3 (KG-only) 9.4 9.5 8.3 9.45 8.3 9.4 S4 (random-sent) 8.0 8.2 7.8 9.4 7.5 8.5 Bold numbers denote the best results. Table 6.
Ablation on input modalities.
-
Item/check Value Train unique paper fingerprints 1,794 Eval. unique paper fingerprints 200 Train QA items 6,303 Eval QA items 697 Sample ID overlap 0 Source-paper ID overlap 0 Full paper SHA1 overlap 0 Exact question overlap 0 Exact QA-pair overlap 0 Exact reasoning-path overlap 0 Table 7.
Paper-level SFT split and leakage diagnostics for AutoQG-7k.
-
Model KG Evaluation Performance QA Generation Performance Dom Acc Con Com Gra Overall KG Rel Ans Distr Flu Reas Evid AutoQG (Qwen-7B-Instruct) 7.0 7.7 7.0 6.0 6.3 7.0 8.6 8.3 7.7 9.0 7.4 8.3 AutoQG (DeepSeek-V2.5) 9.0 8.3 8.3 7.0 7.3 8.0 9.4 9.1 8.5 9.5 8.4 9.2 Table 8.
Performance reproducibility using open-source models within the AutoQG framework for Knowledge Graph (KG) evaluation and QA generation.
-
Domain (method) Rel Ans Distr Flu Reas Evid PubMed (AutoQG) 9.2 8.9 8.4 9.5 8.5 9.0 PubMed (GPT-5) 7.6 7.5 7.2 8.5 6.8 7.0 Physics (AutoQG) 9.4 9.1 8.5 9.6 8.8 9.3 Physics (GPT-5) 7.6 7.5 6.2 8.6 7.0 6.9 CS (AutoQG - ours) 9.6 9.6 9.0 9.5 8.5 9.6 AutoQG maintains stable performance across PubMed (biomedical) and Physics domains, while direct GPT-based prompting shows significant degradation. CS results are included for reference. Table 9.
Cross-domain generalization results.
Figures
(7)
Tables
(9)