-
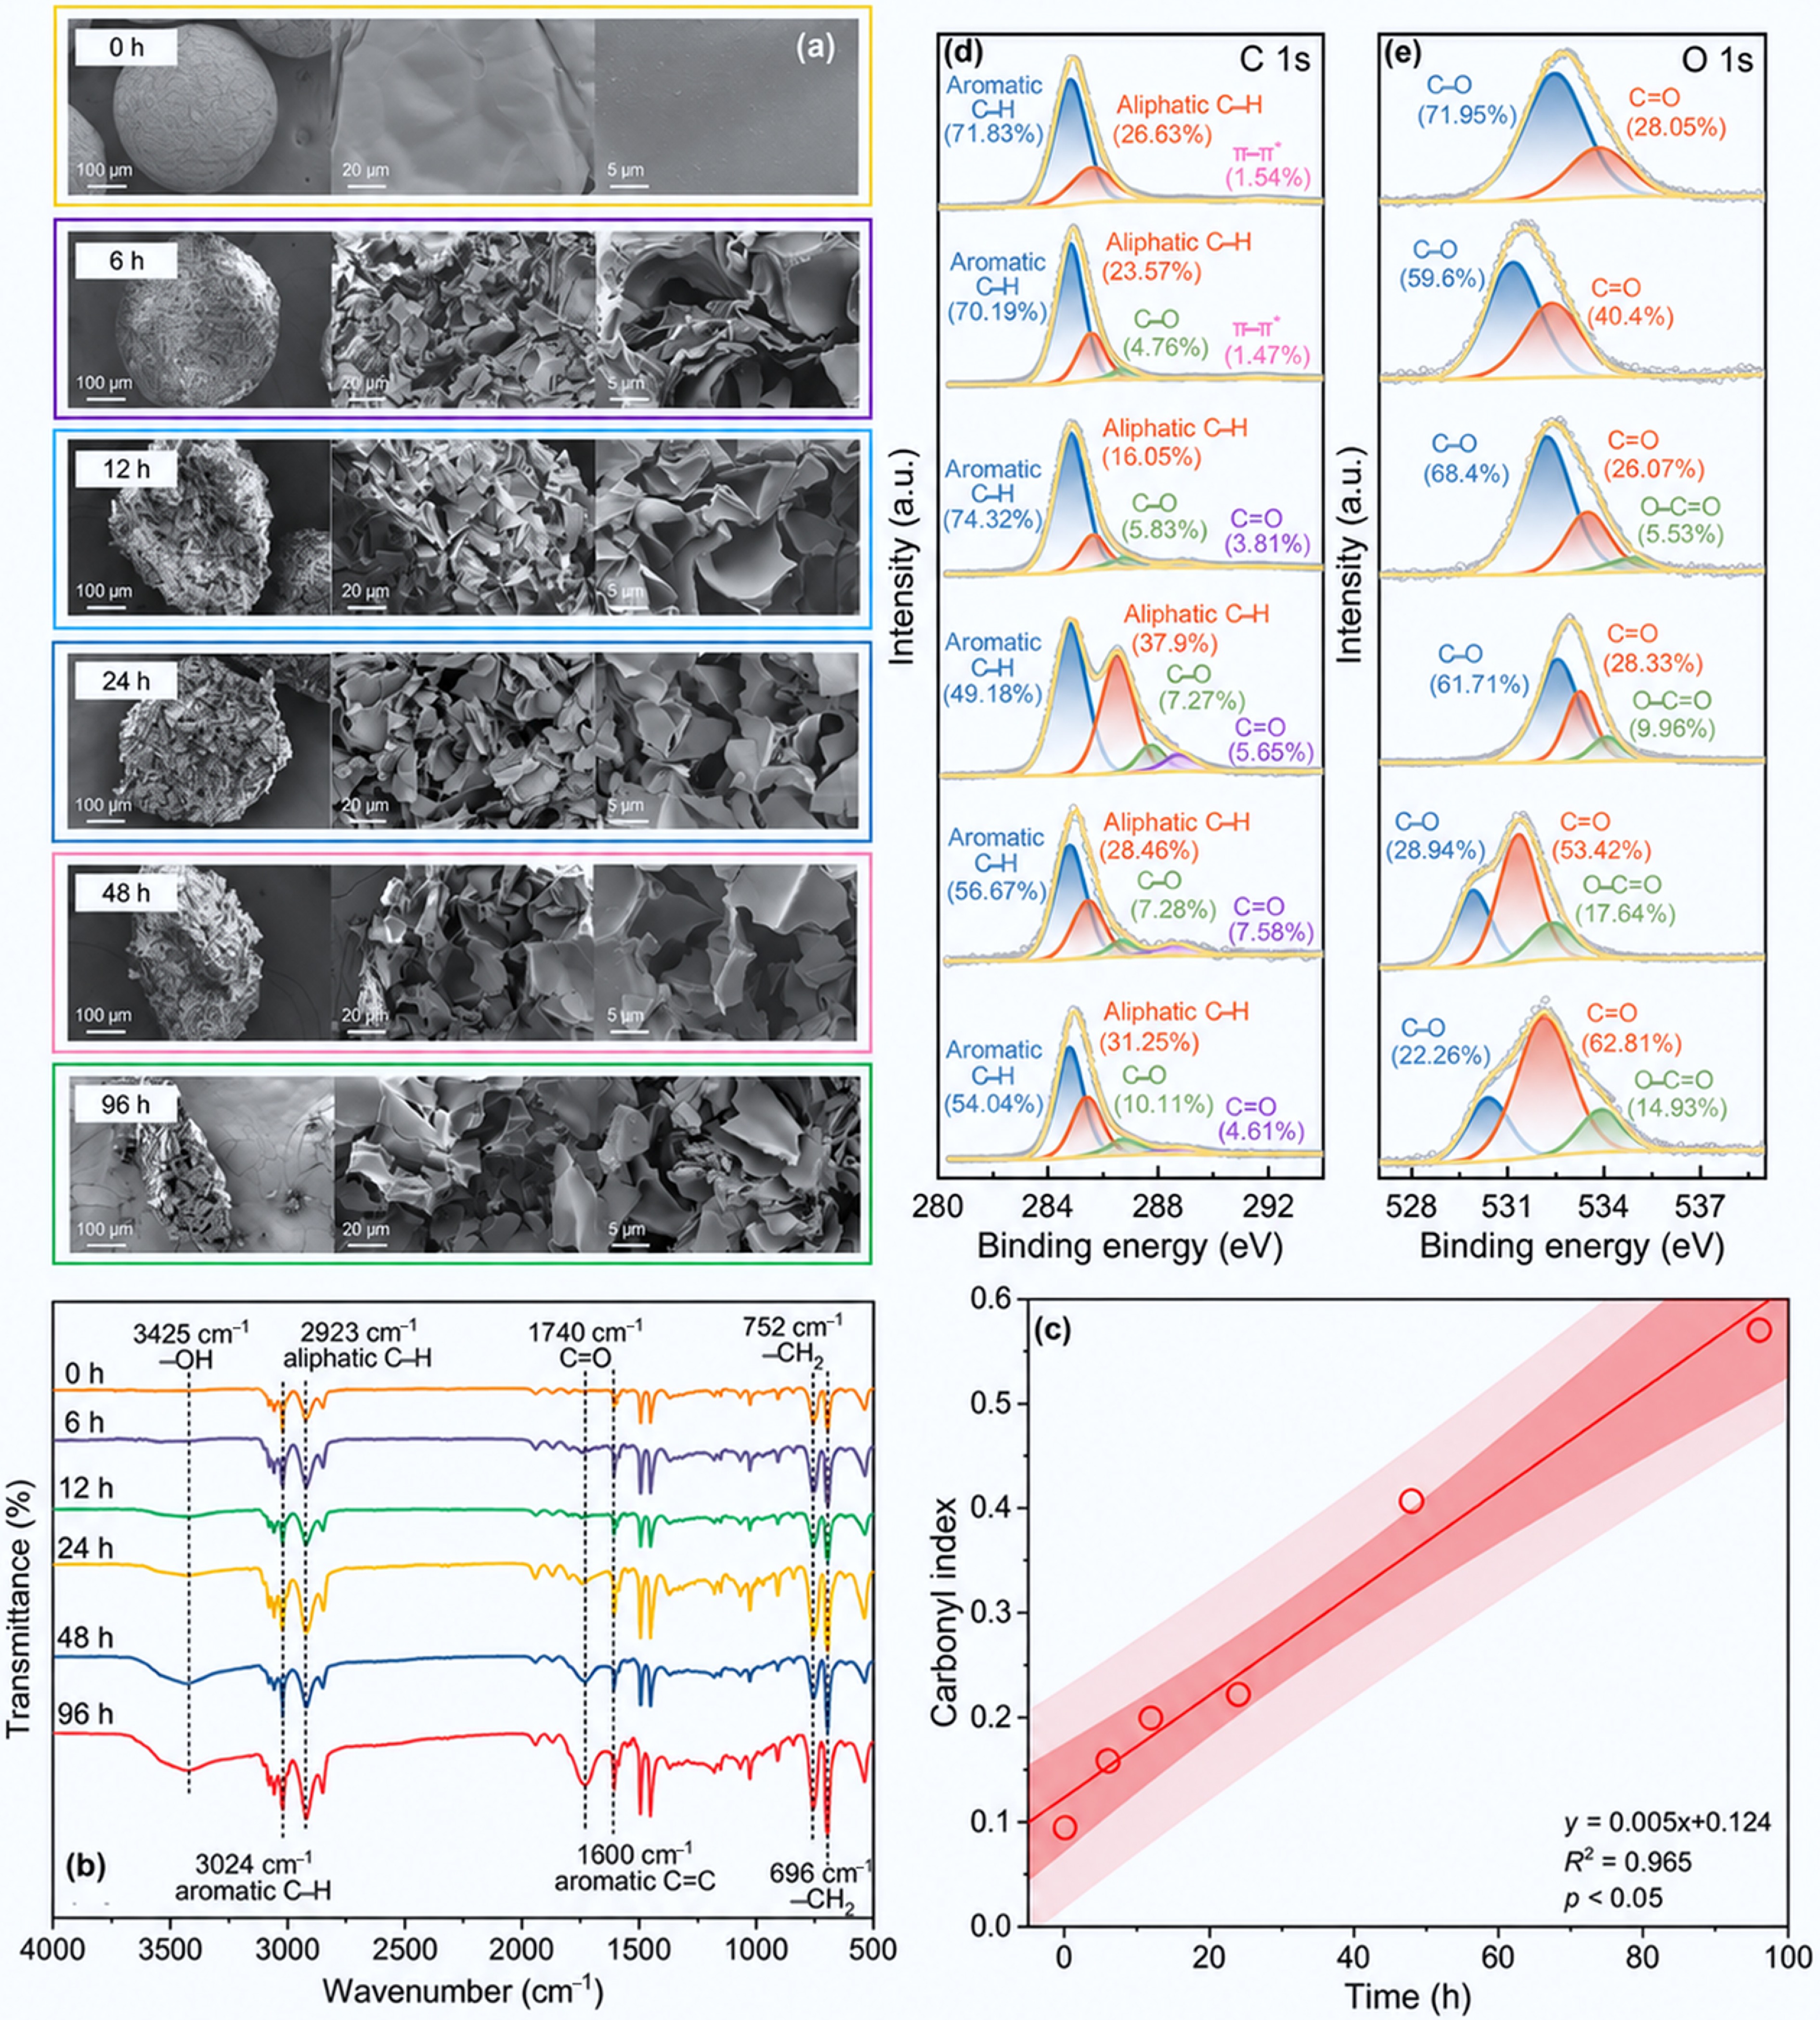
Figure 1.
SEM images of PS-MPs under different photoaging times; (a) FT-IR spectra of PS-MPs under different photoaging times; (b) linear fitting of carbonyl index vs photoaging time; (c) high-resolution XPS spectra of (d) C 1s and (e) O 1s for PS-MPs under different photoaging times.
-
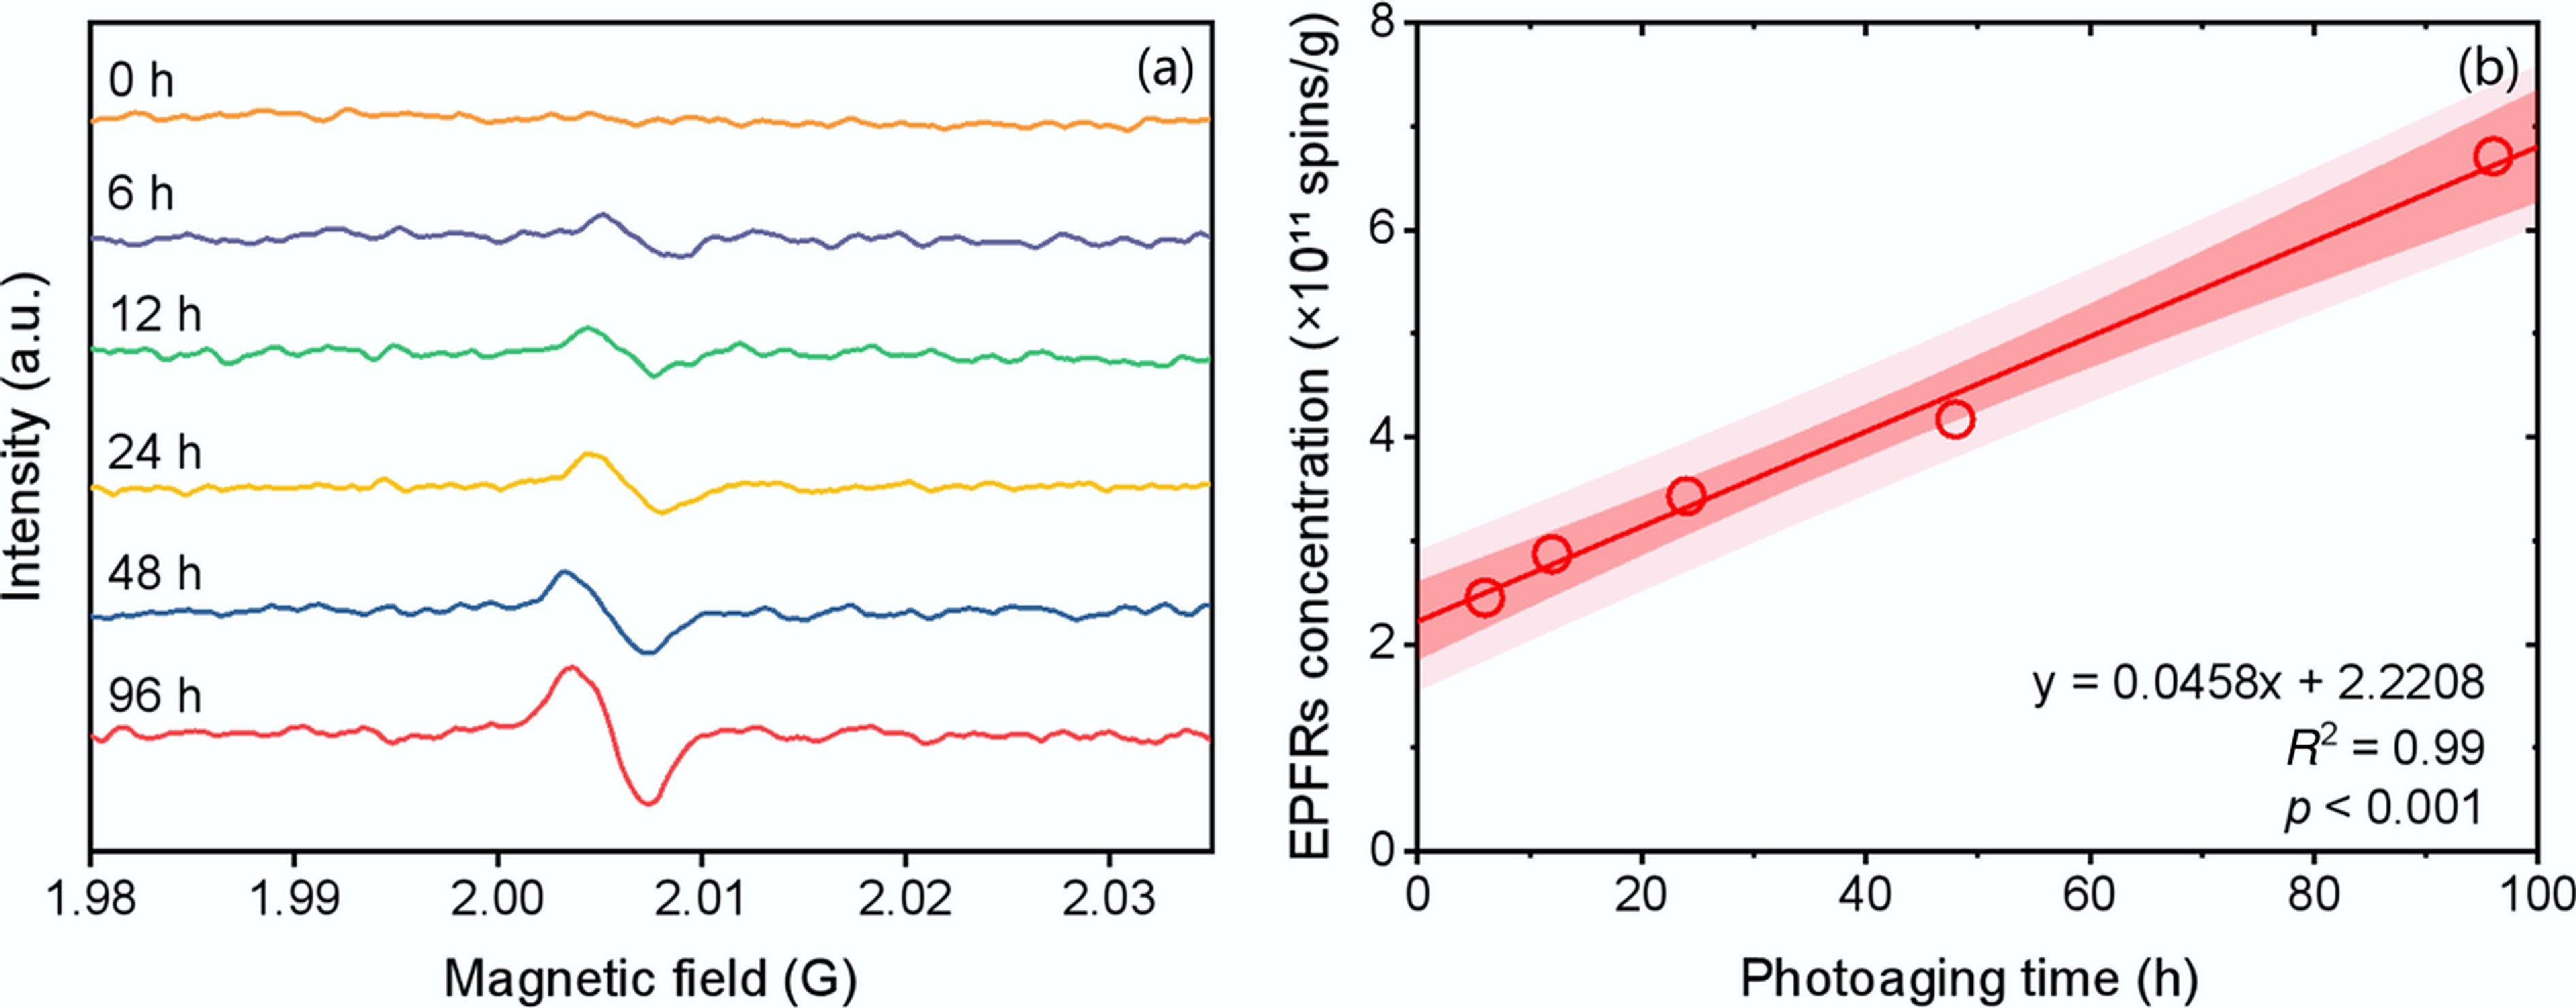
Figure 2.
(a) EPR spectra of PS-MPs with different photoaging times; (b) linear fitting of EPFRs concentration and photoaging time.
-
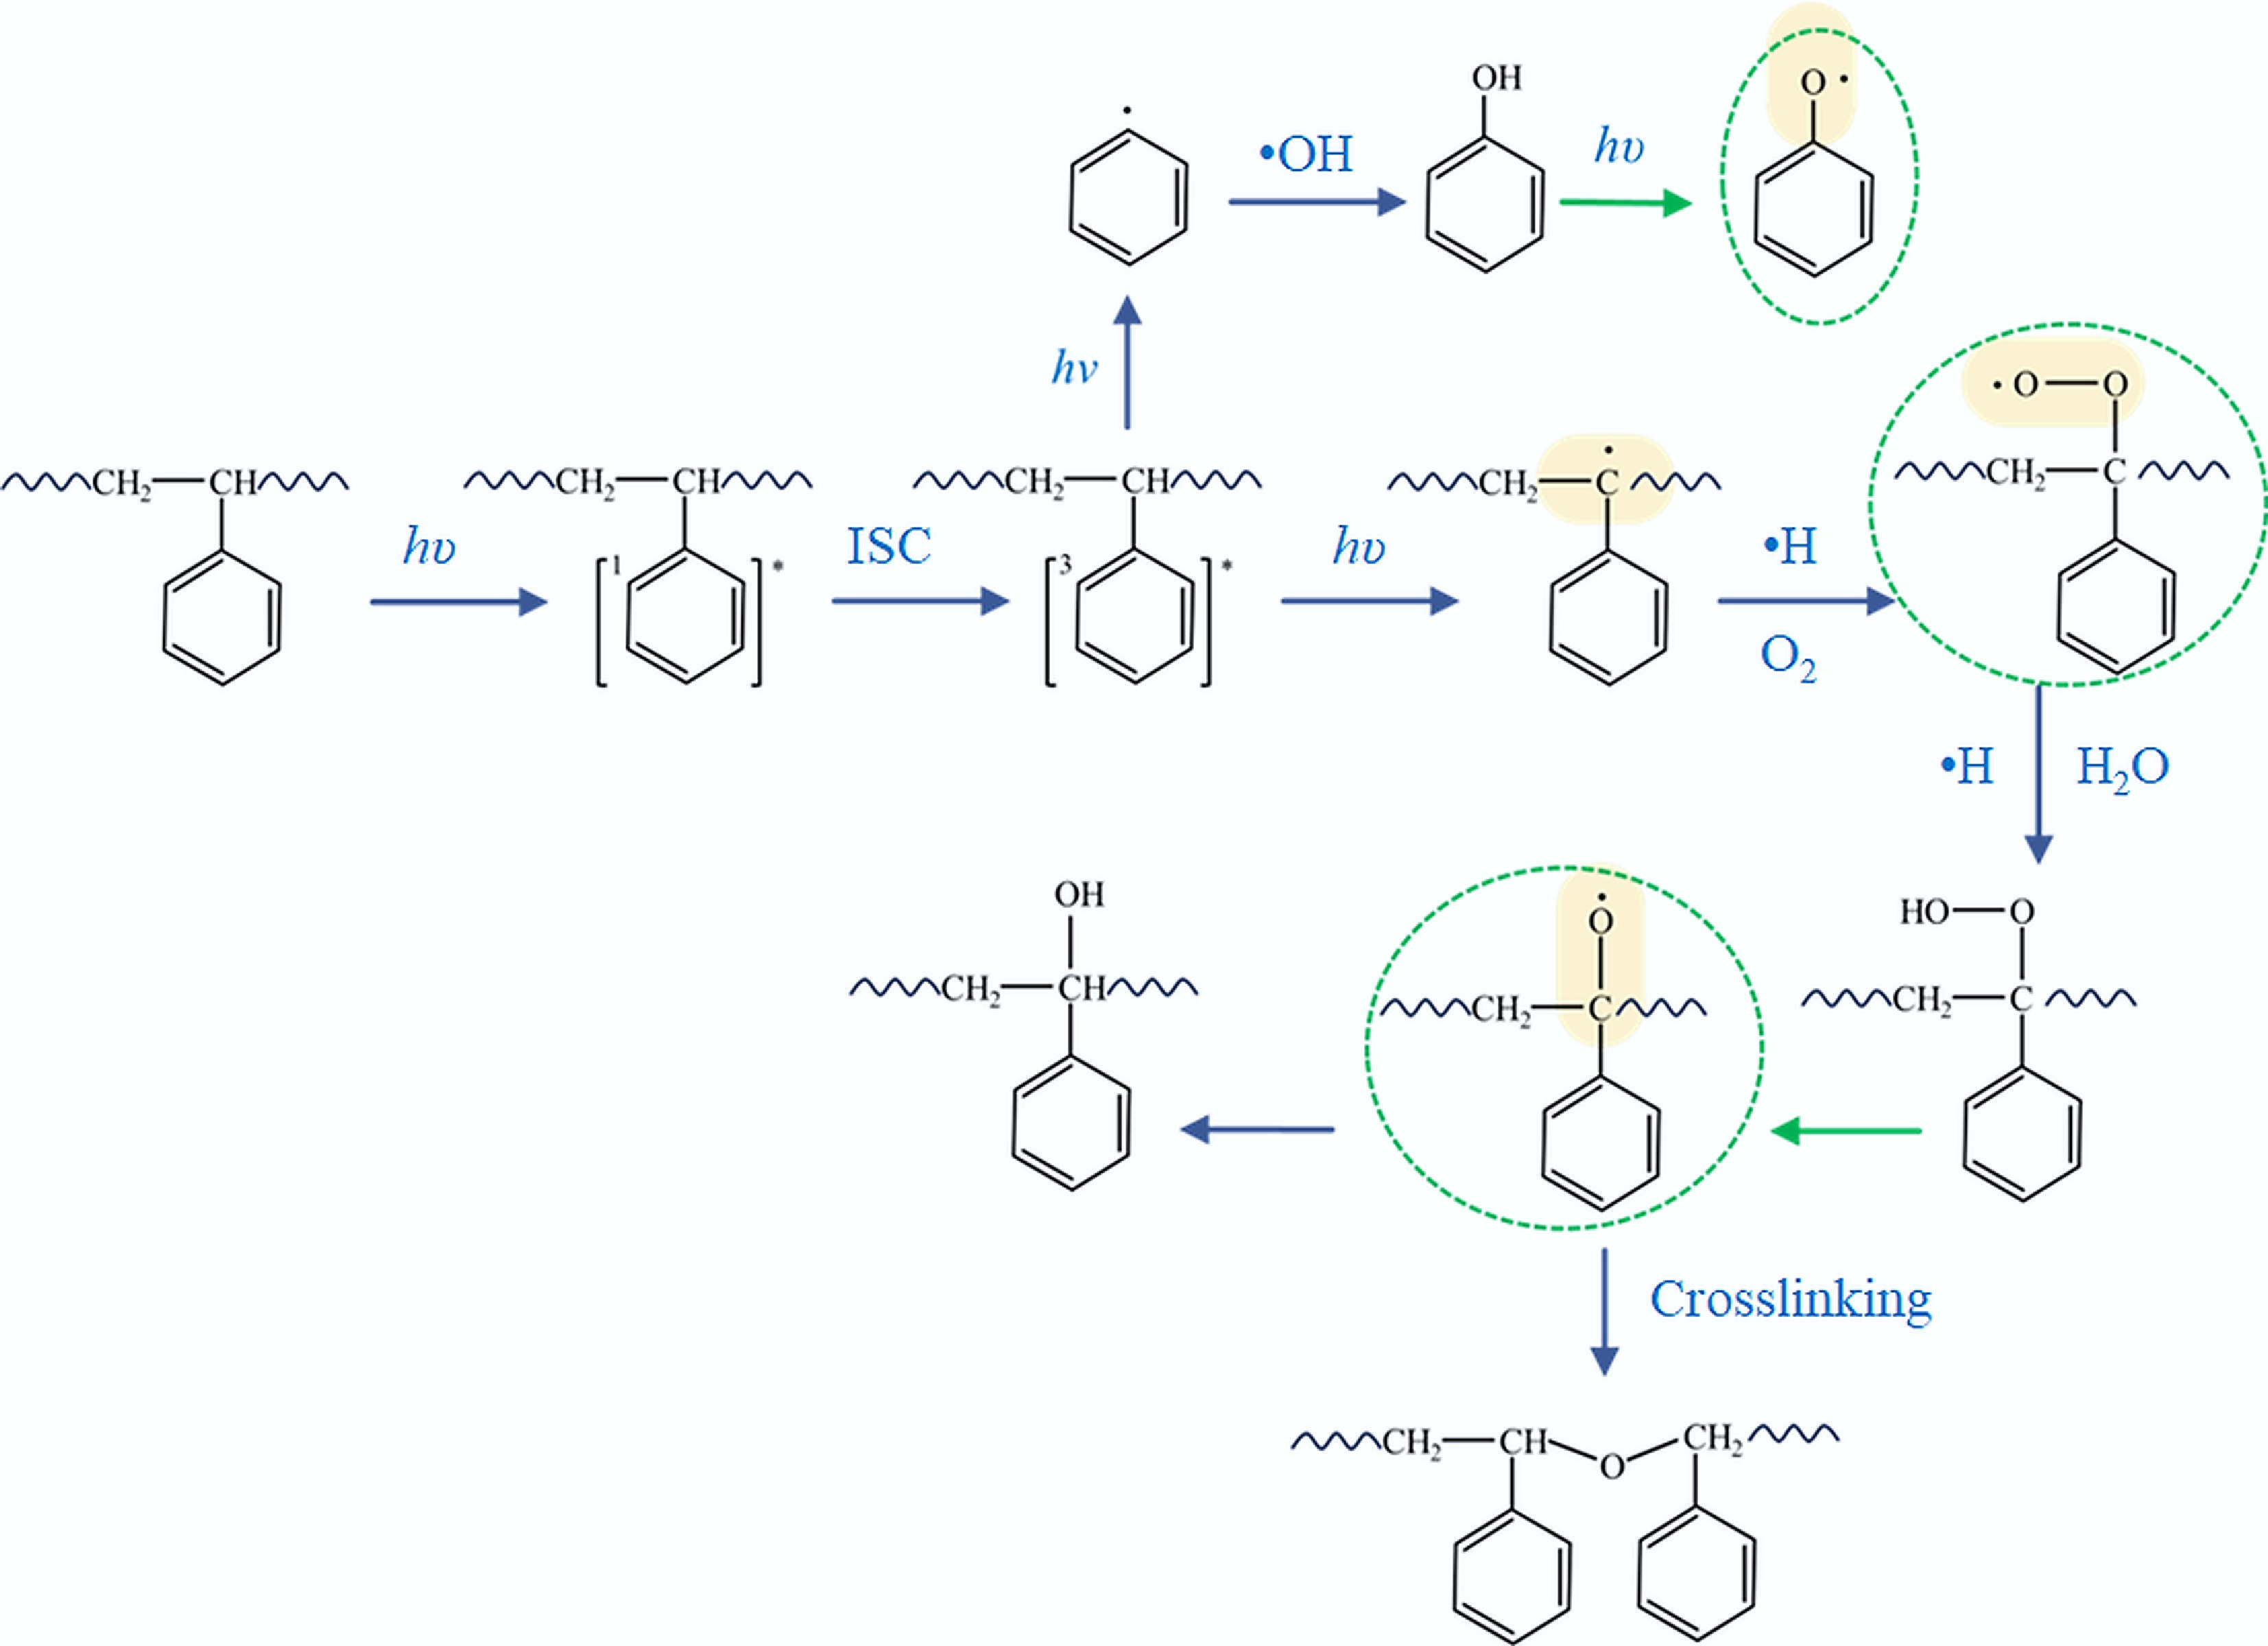
Figure 3.
Formation processes of EPFRs during photoaging of PS-MPs.
-
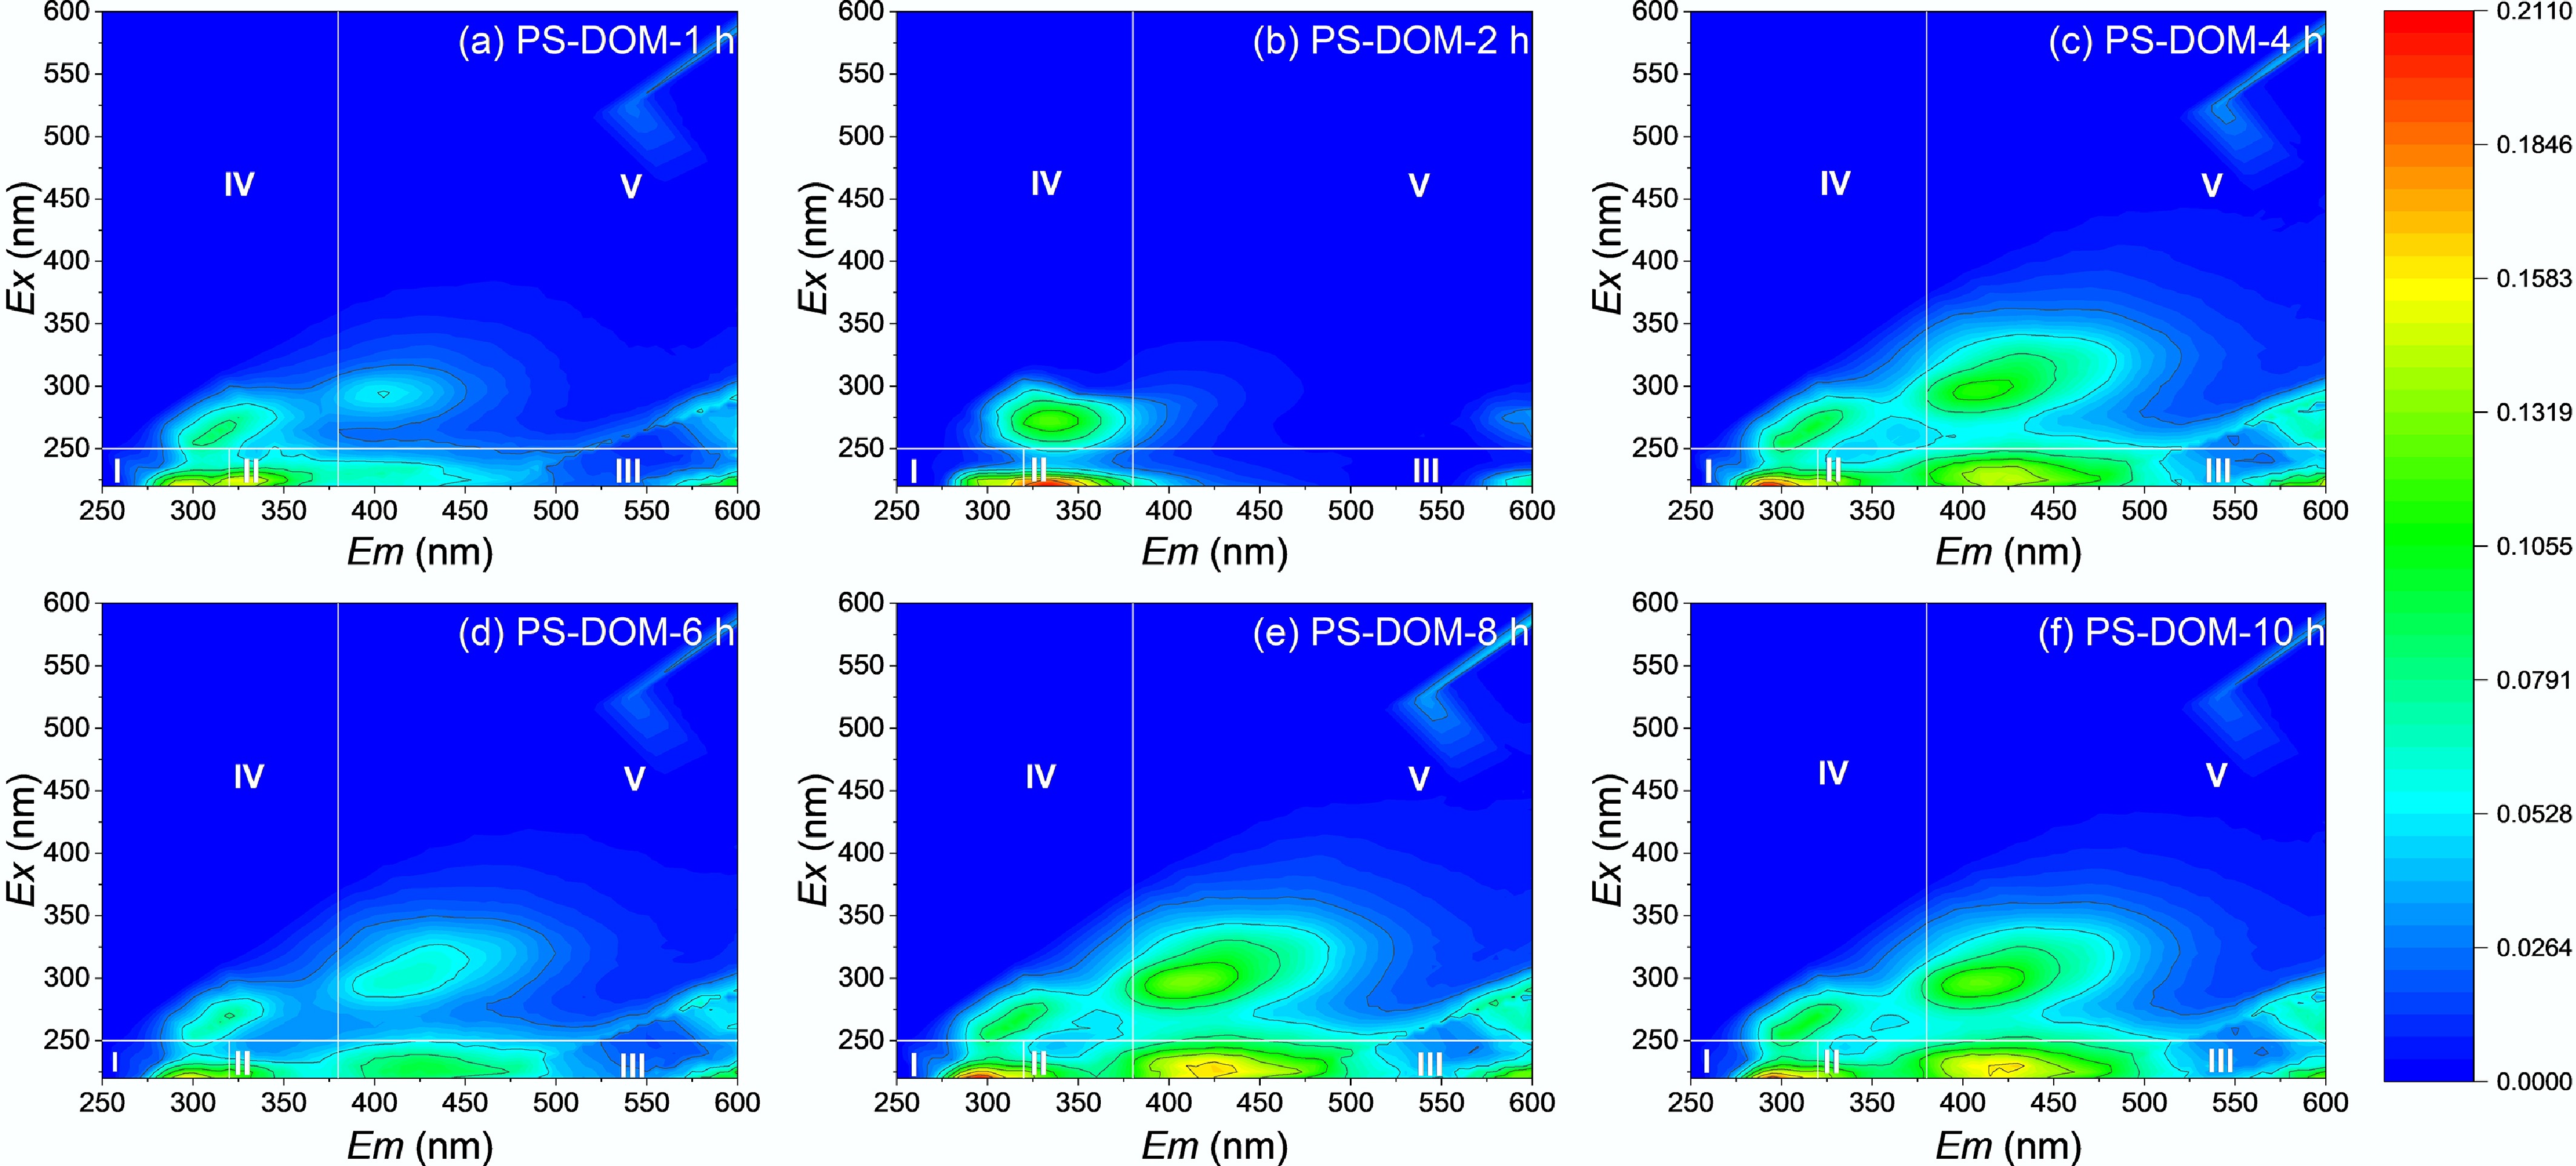
Figure 4.
EEM-FRI of PS-DOM derived for (a) 1, (b) 2, (c) 4, (d) 6, (e) 8, and (f) 10 h.
-
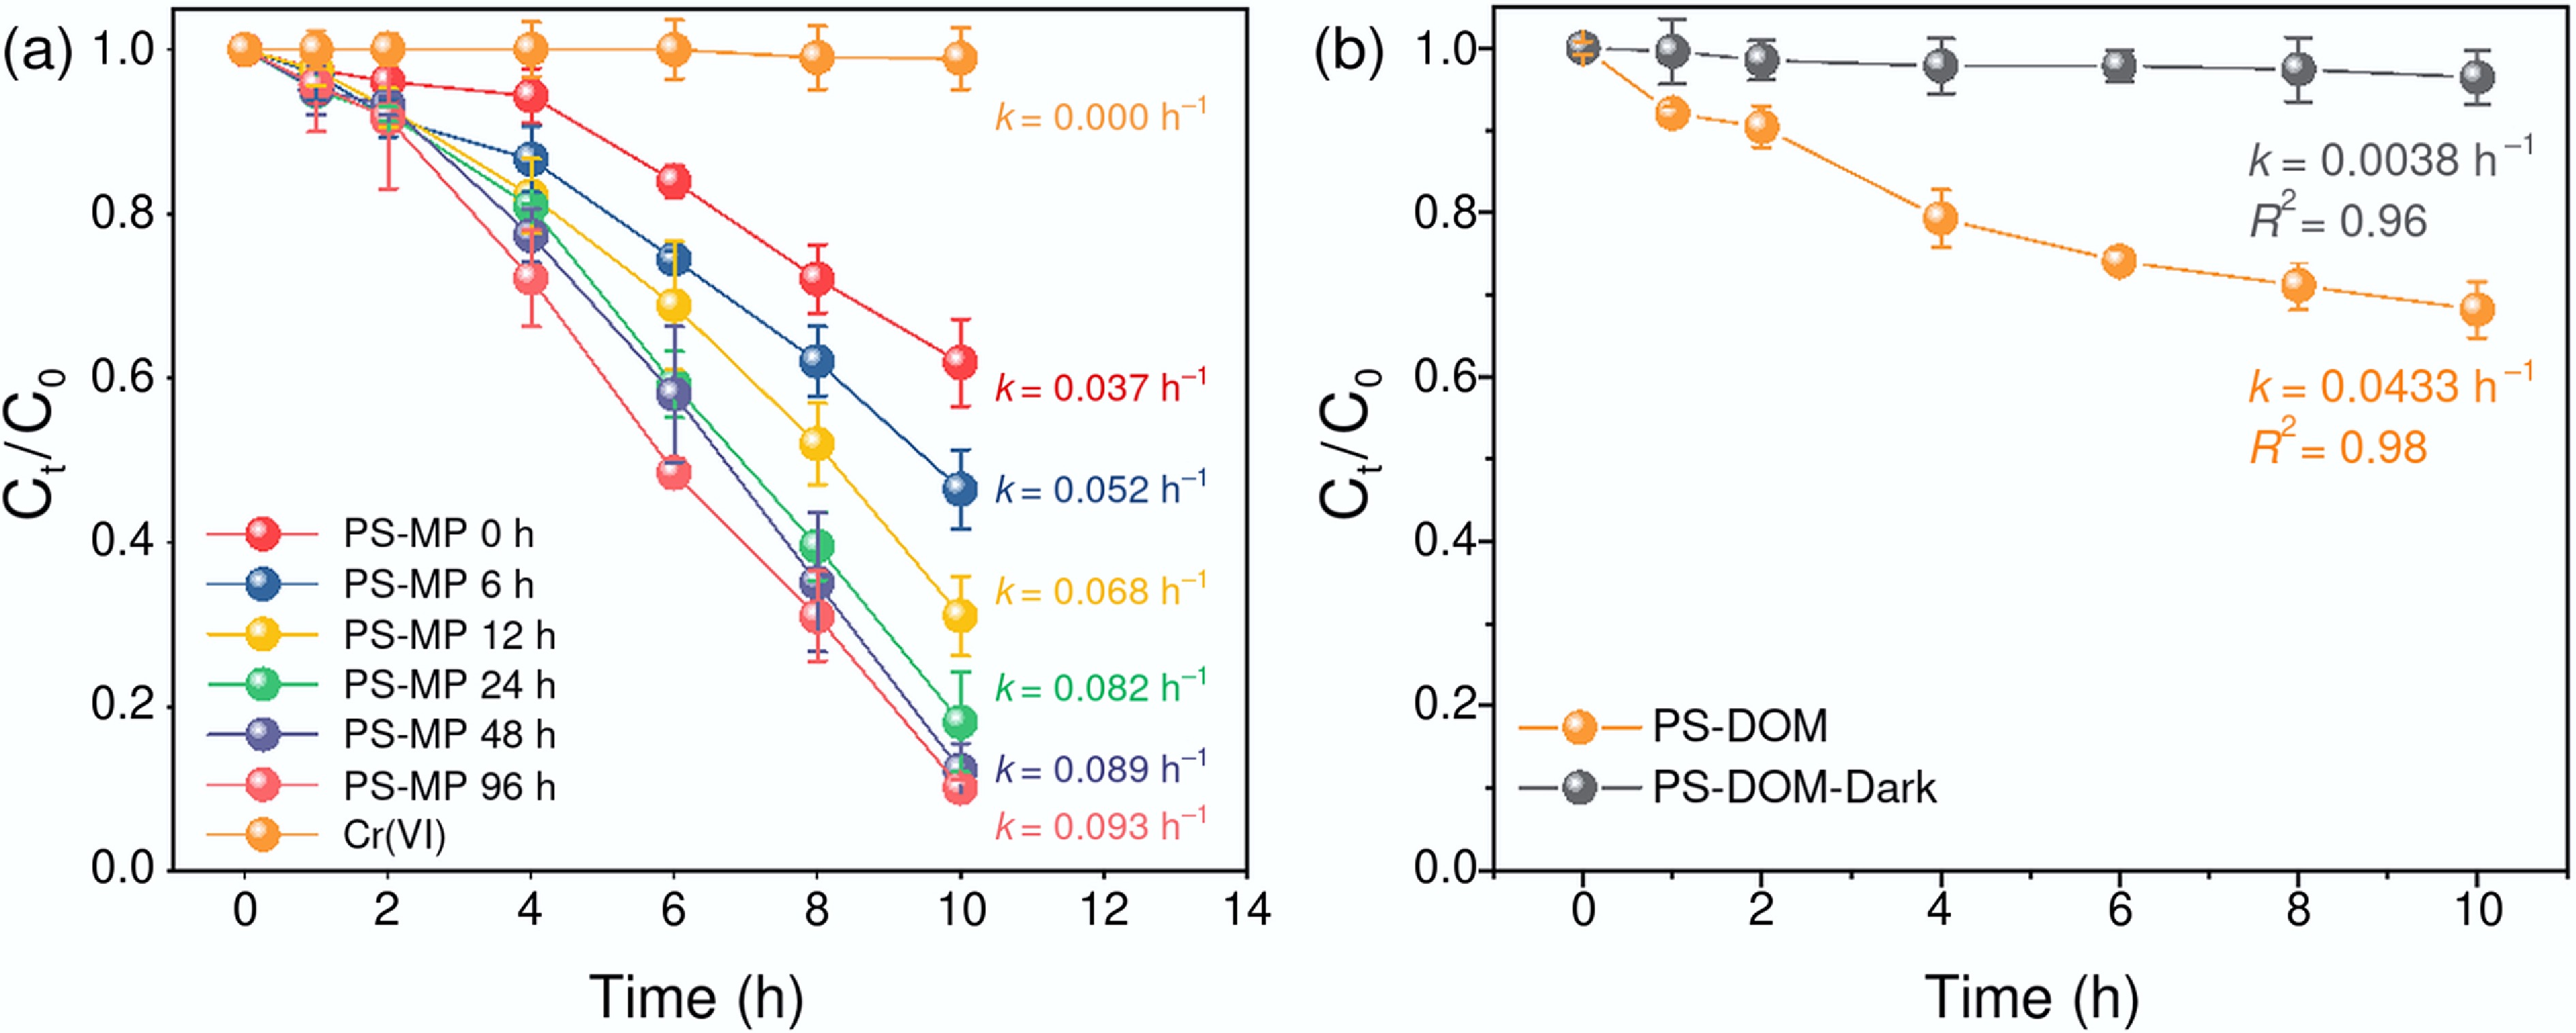
Figure 5.
(a) Cr(VI) photoreduction by PS-MPs under different photoaging times; (b) Cr(VI) photoreduction by PS-DOM under UV irradiation and dark conditions.
-
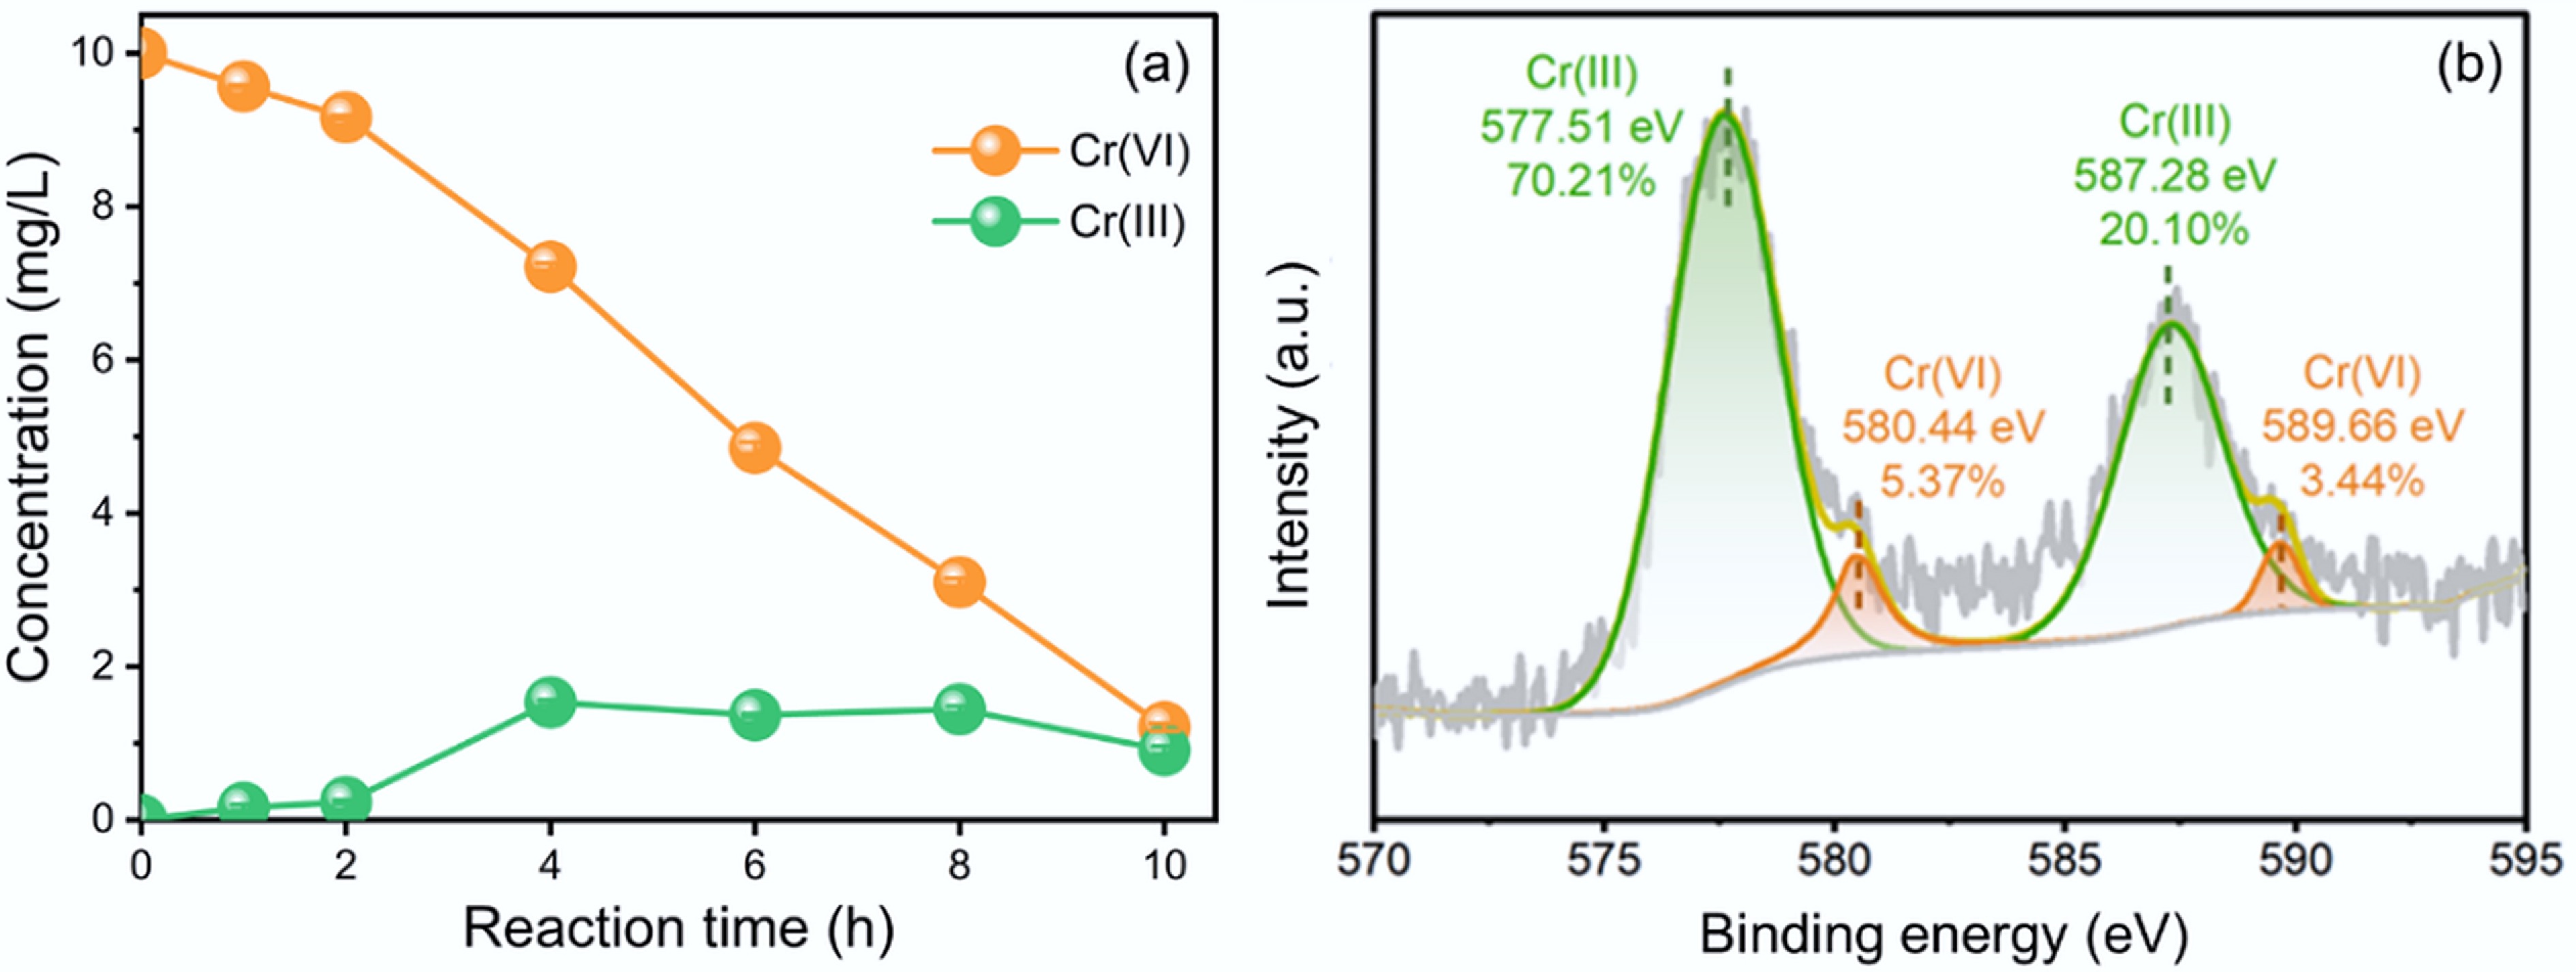
Figure 6.
(a) Concentrations of Cr(VI) and Cr(III) in solution during photoreaction; (b) high-resolution XPS spectrum of Cr 2p on PS-MPs after photoreaction.
-
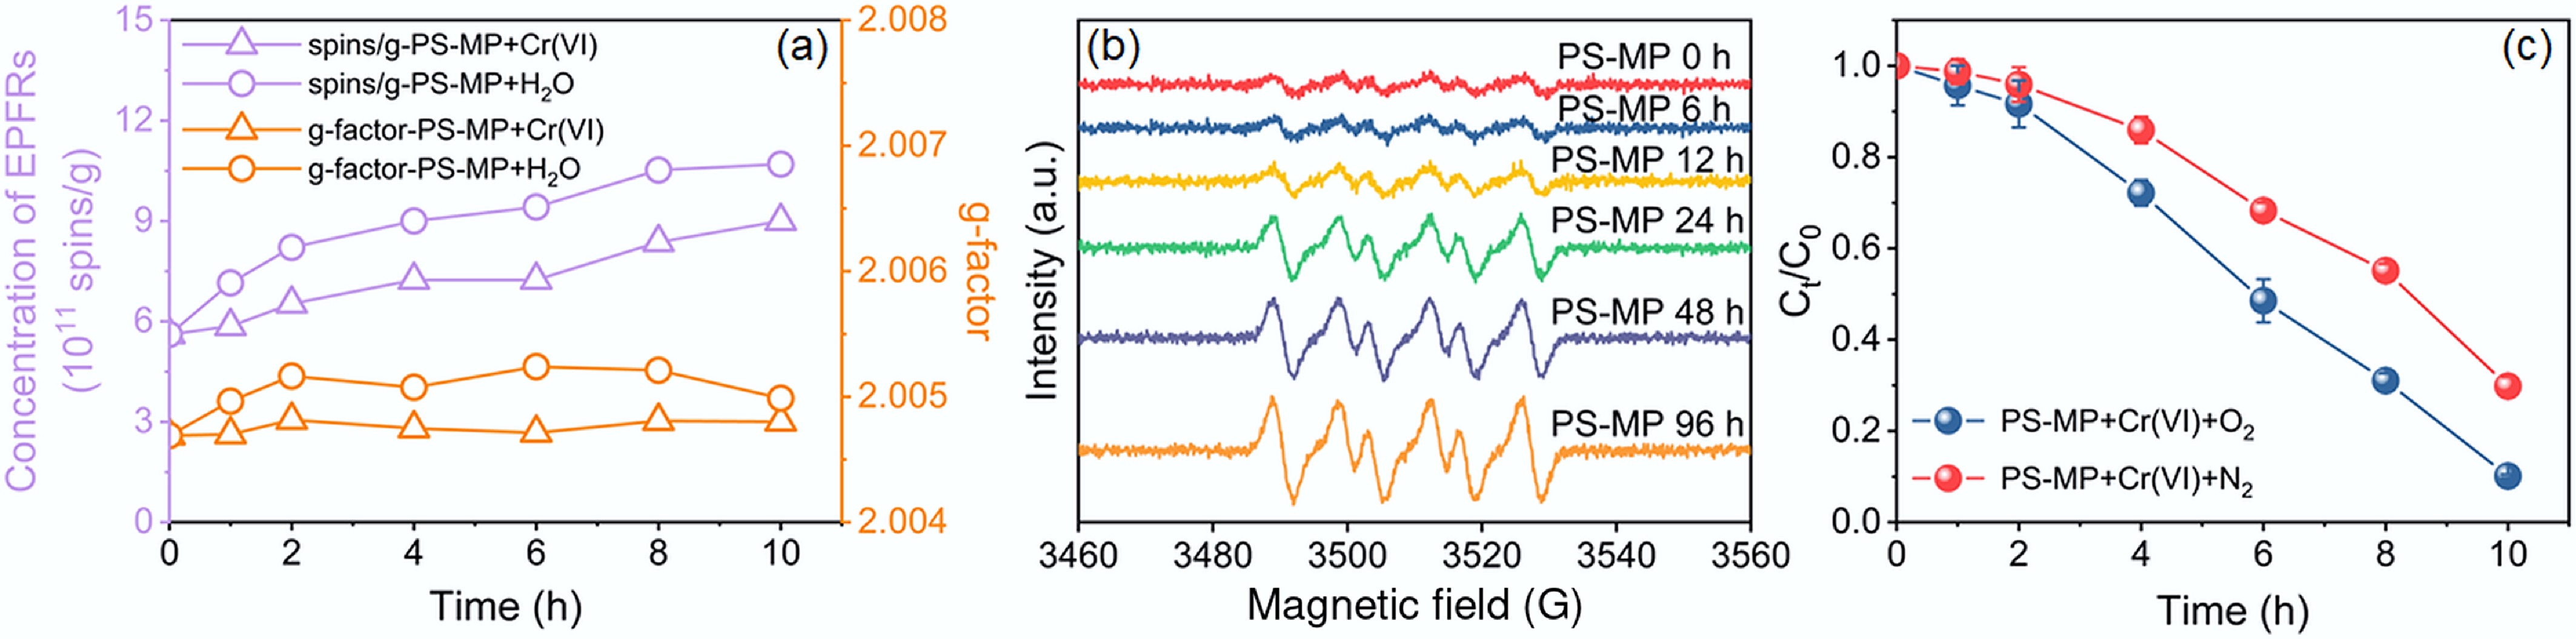
Figure 7.
(a) EPFRs concentration and g-factor of PS-MPs during Cr(VI) photoreduction in Cr(VI) solution and pure water; (b) EPR spectra of PS-MPs under different photo-aging times; (c) Cr(VI) photoreduction by PS-MPs under O2 and N2 conditions.
-
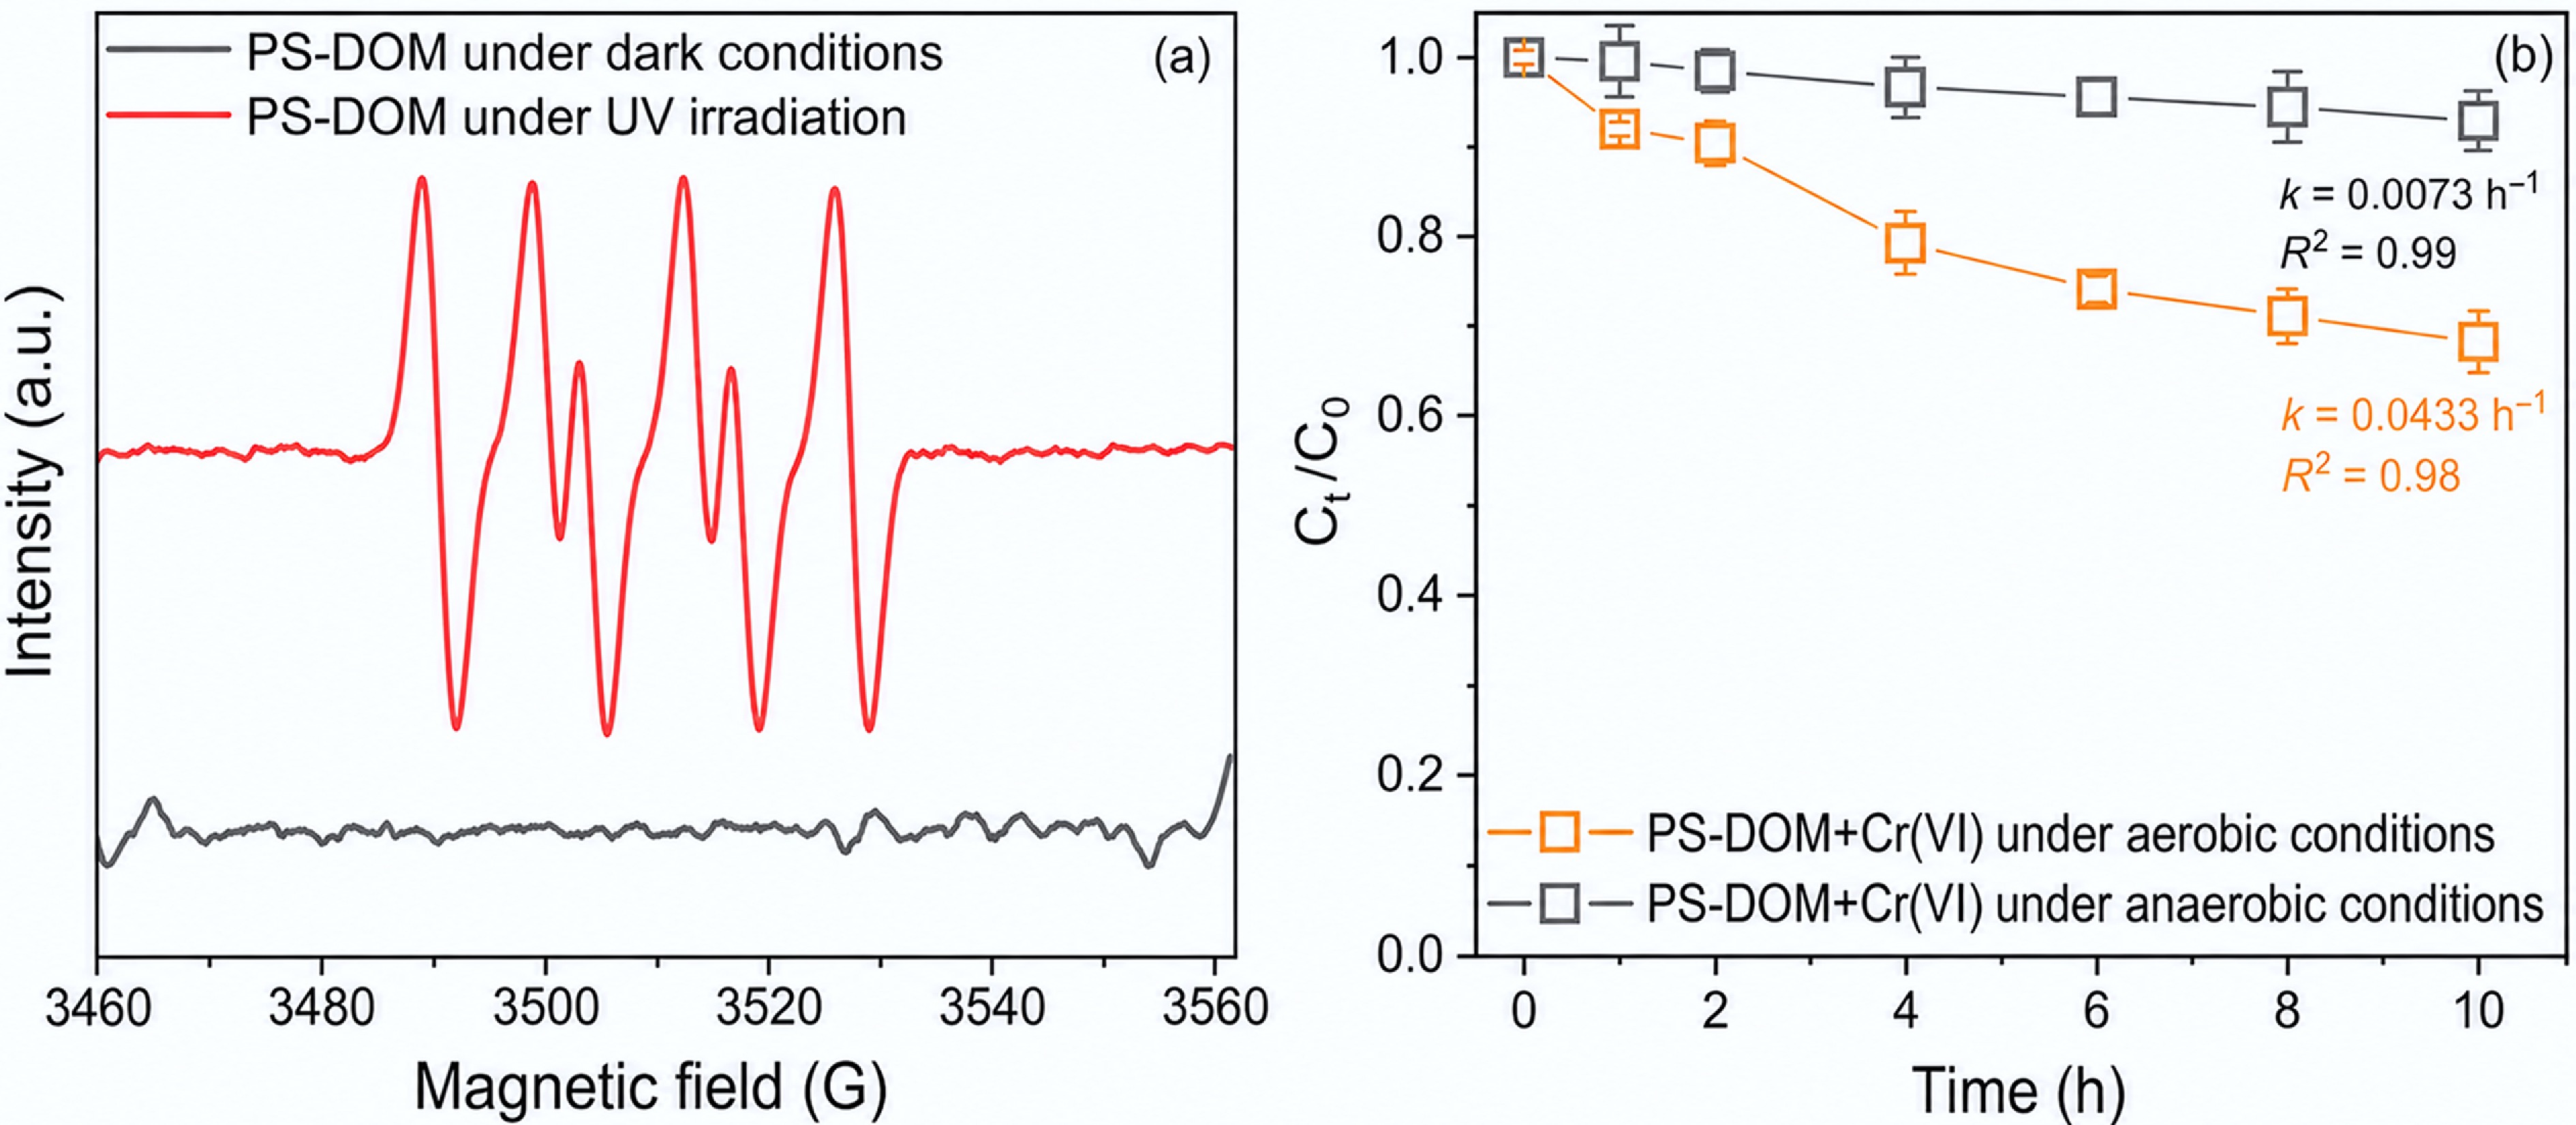
Figure 8.
(a) EPR spectra of DMPO-O2•- adducts generated by PS-DOM under dark and UV irradiation conditions; (b) Cr(VI) photoreduction by PS-DOM under aerobic and anaerobic conditions.
-
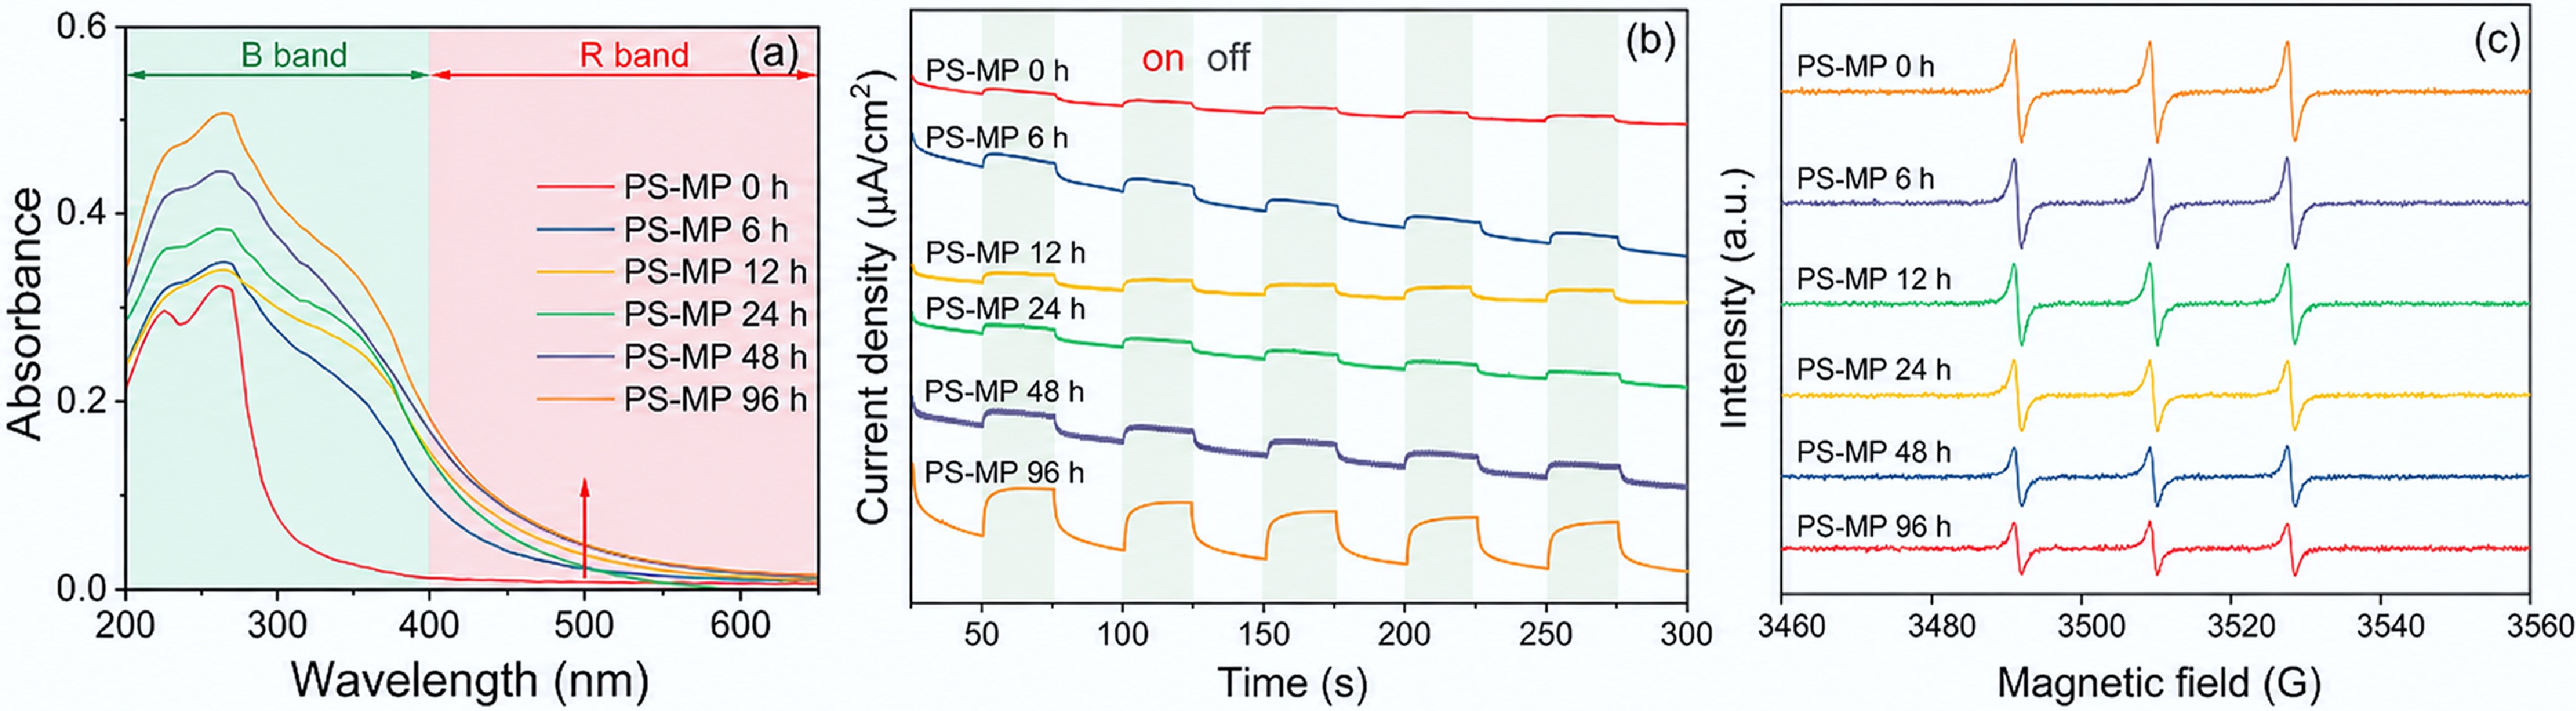
Figure 9.
(a) UV-vis absorption spectra of PS-MPs with different photoaging times; (b) transient photocurrent responses of PS-MPs with different photoaging times; (c) EPR spectra of photoinduced electrons generated by PS-MPs under irradiation.
Figures
(9)
Tables
(0)