-
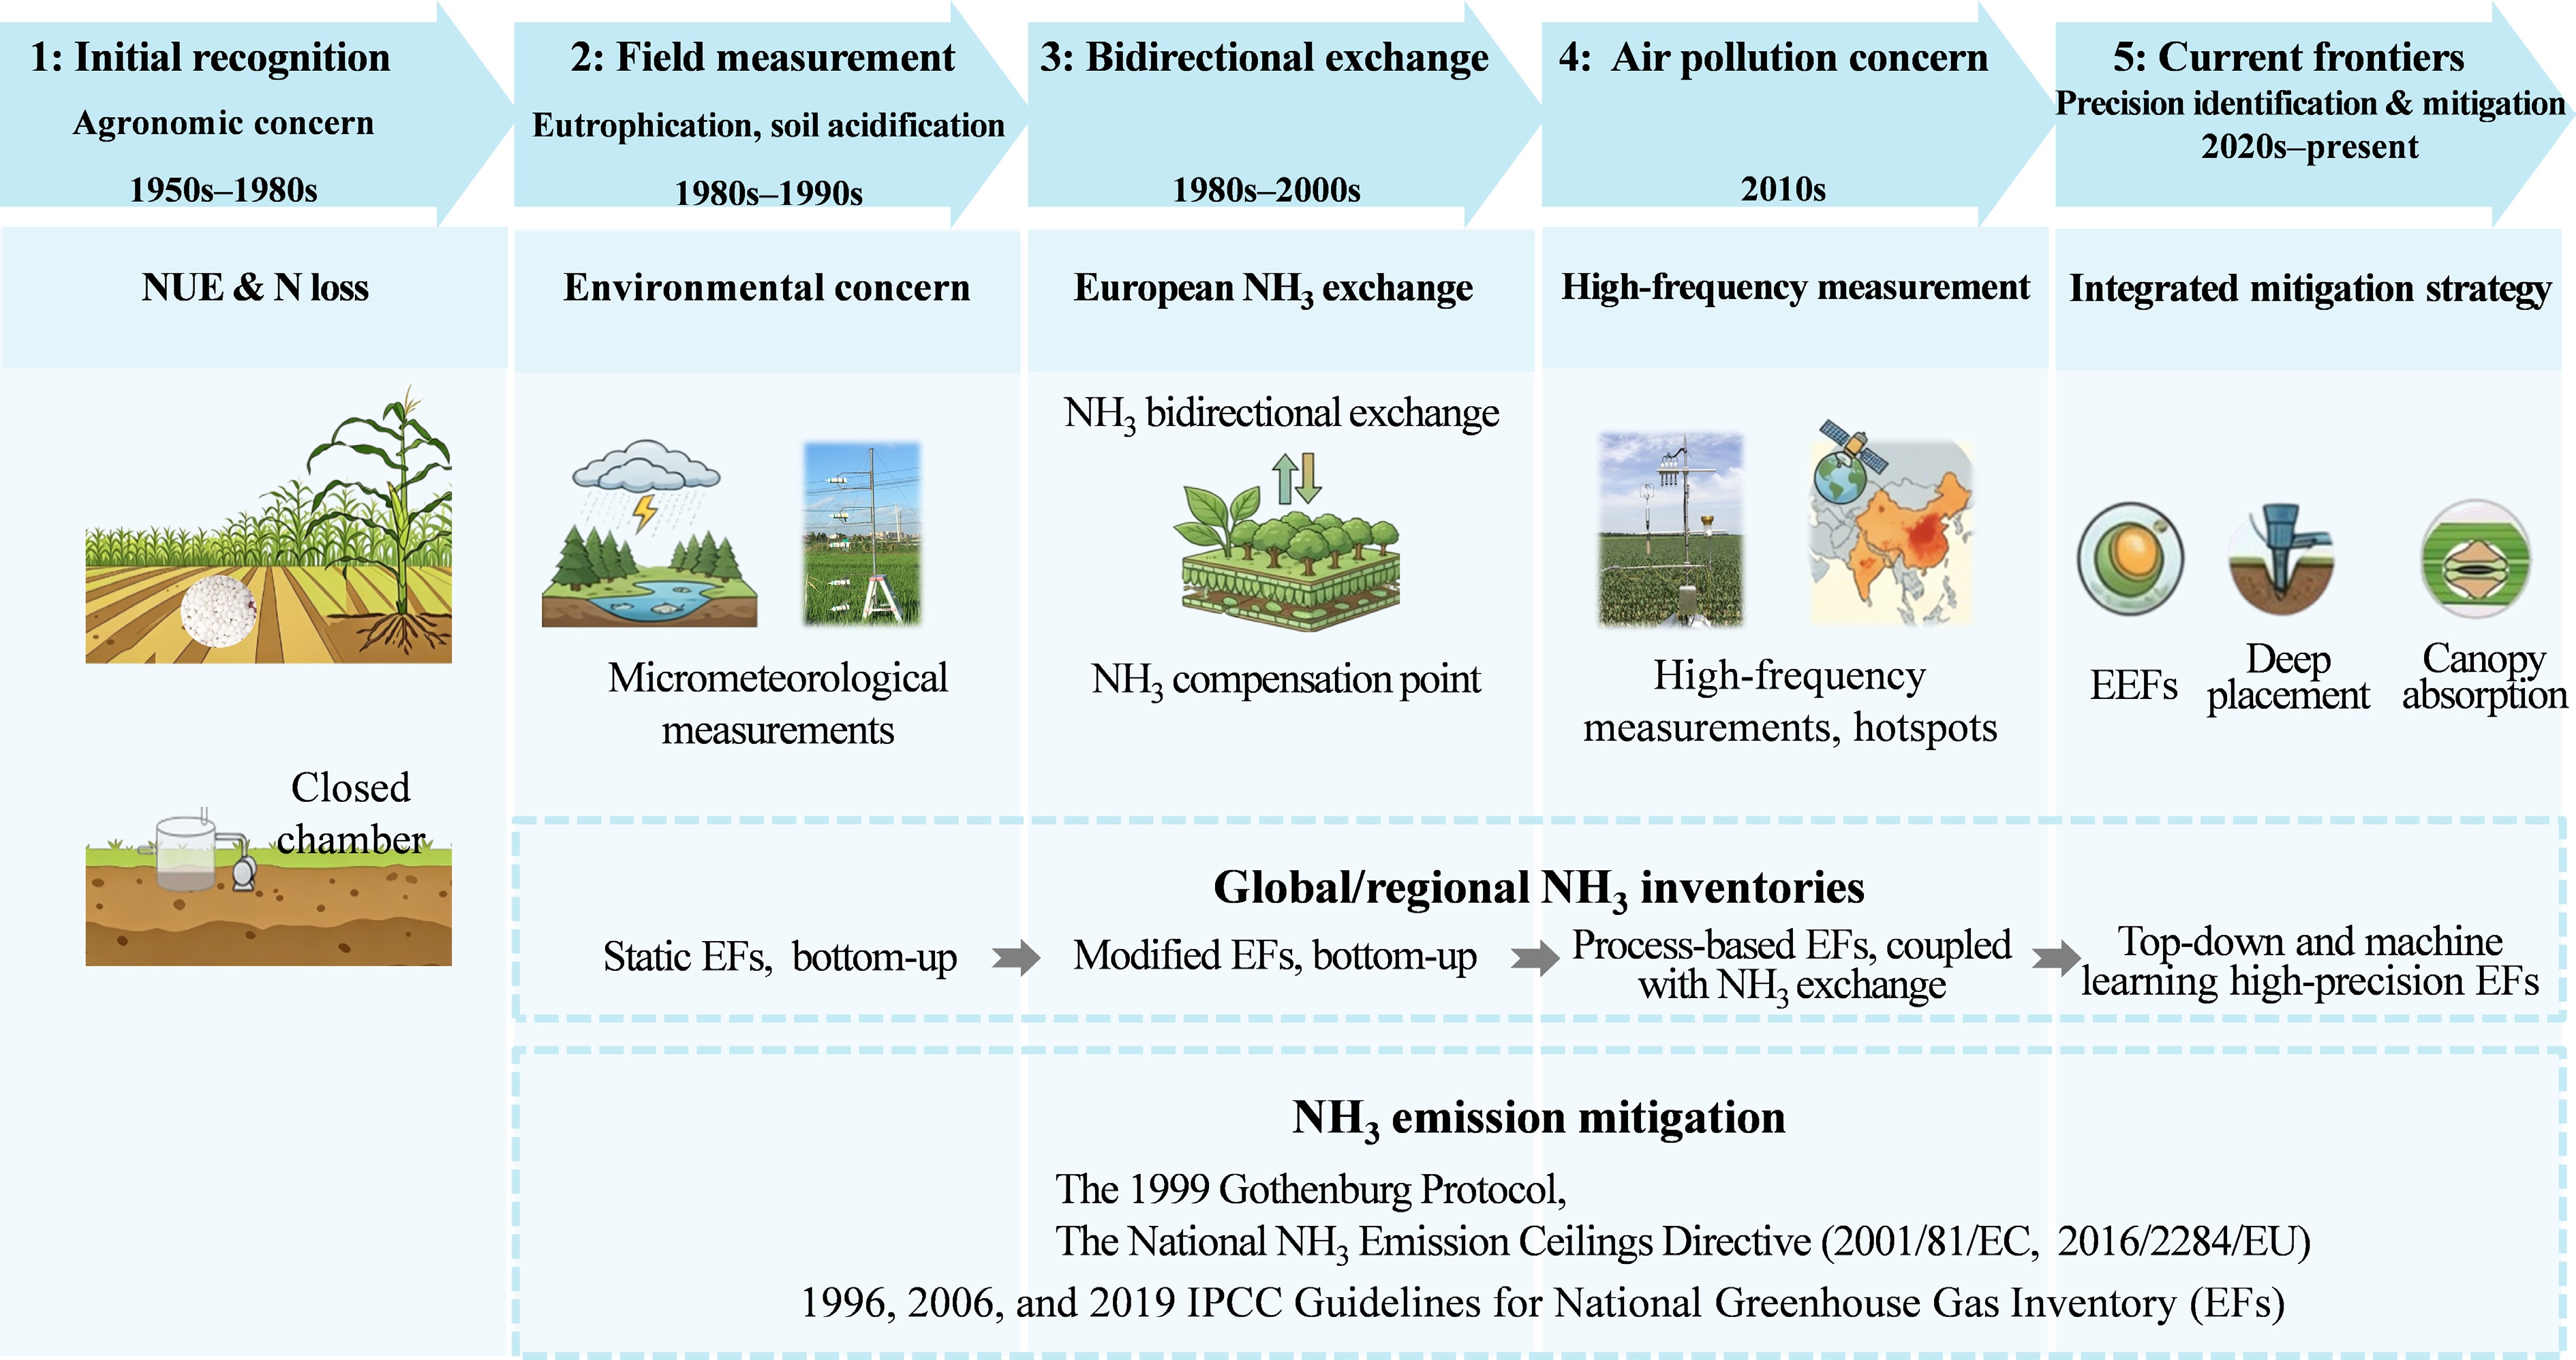
Figure 1.
An historical framework of research concerning NH3 emissions from croplands. NUE-nitrogen use efficiency; EEFs-enhanced efficiency fertilizers; EFs-emission factors; EC-European Commission; EU-European Union; IPCC-Intergovernmental Panel on Climate Change.
-
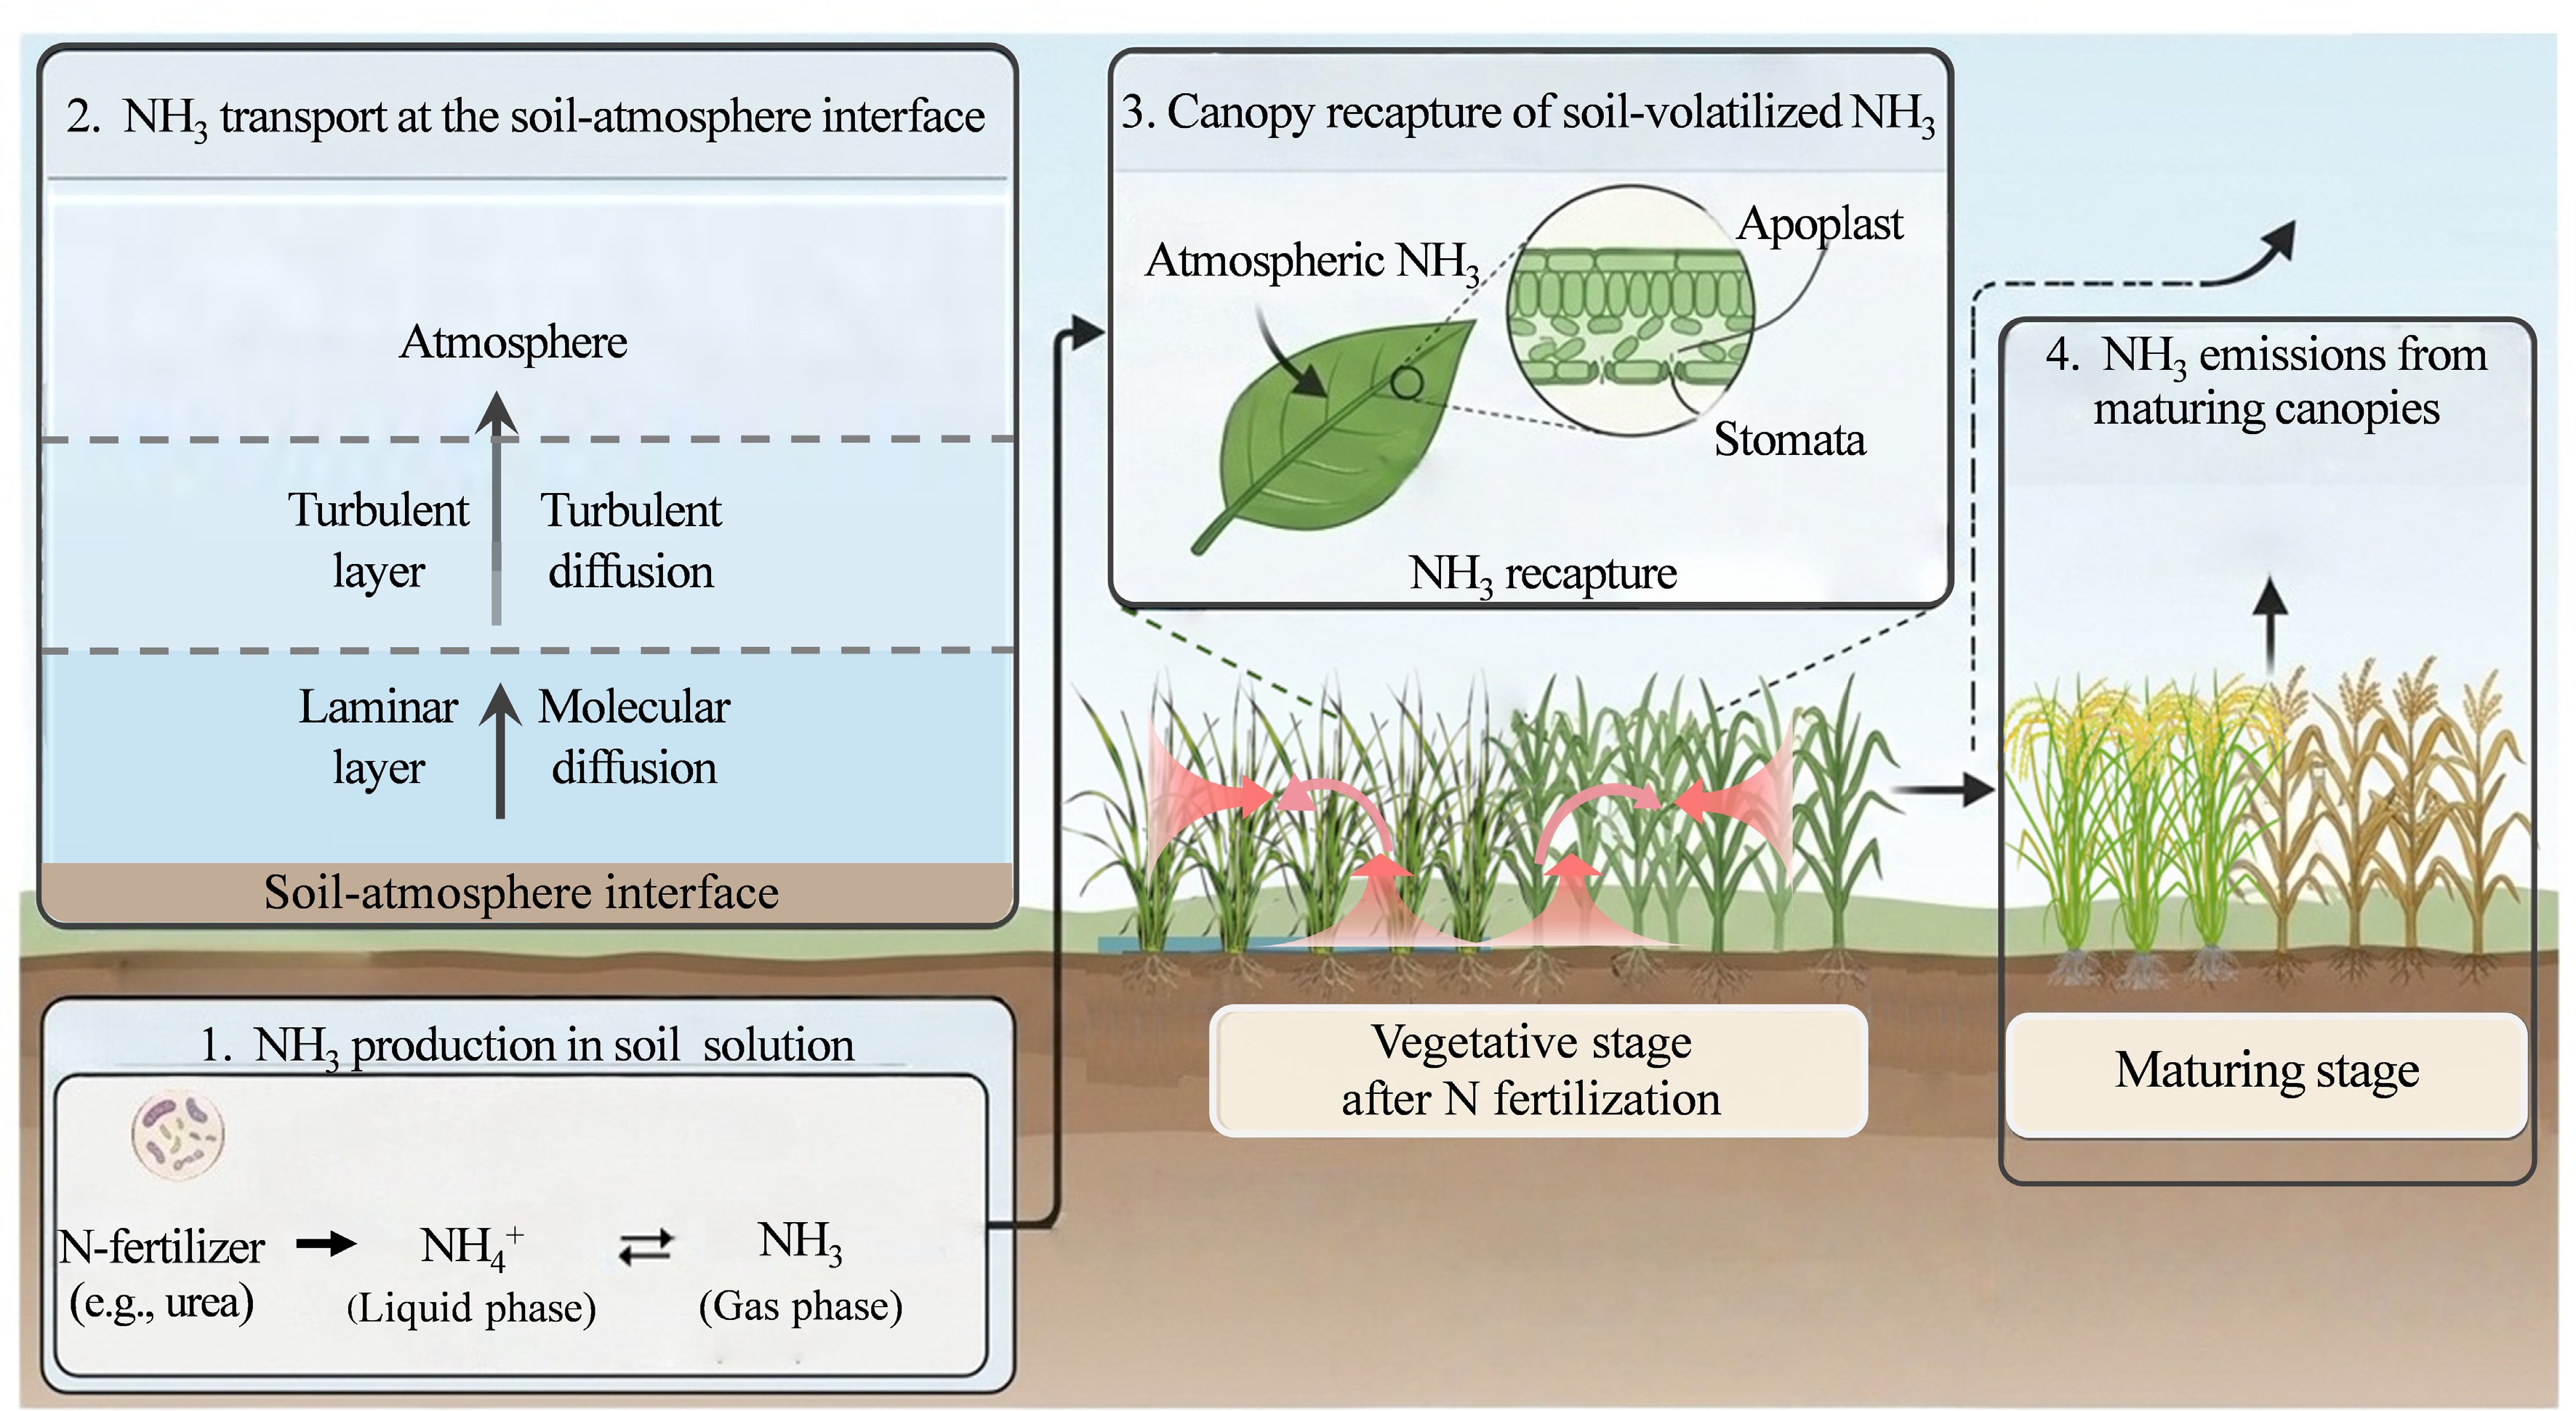
Figure 2.
Processes of NH3 emissions across the soil–water–plant–atmosphere continuum.
-
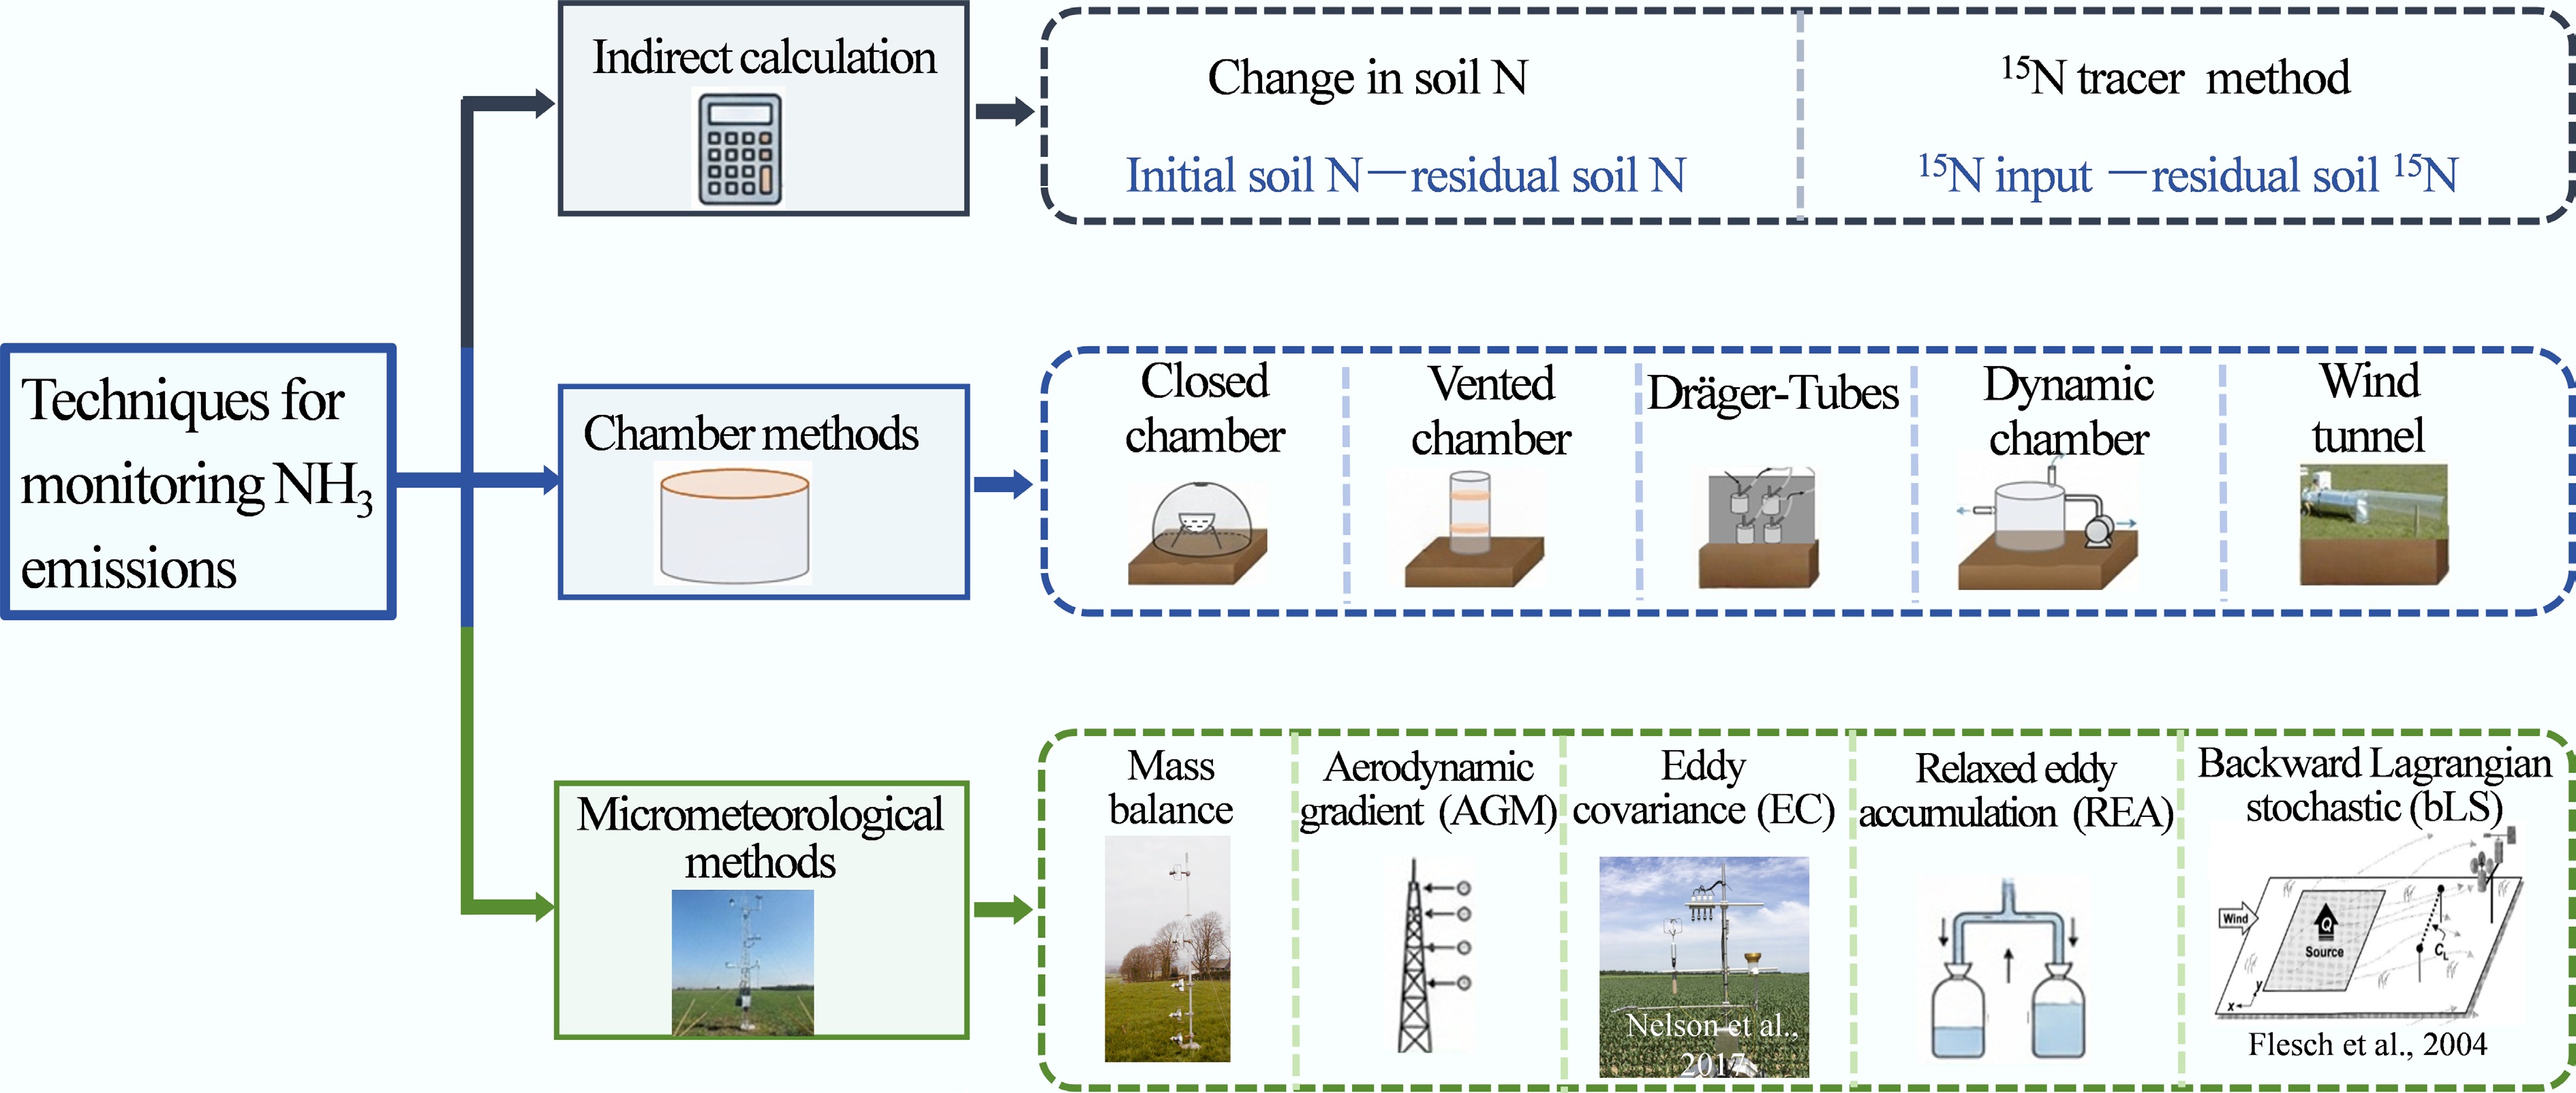
Figure 3.
Overview of techniques used to quantify NH3 emissions from croplands.
-
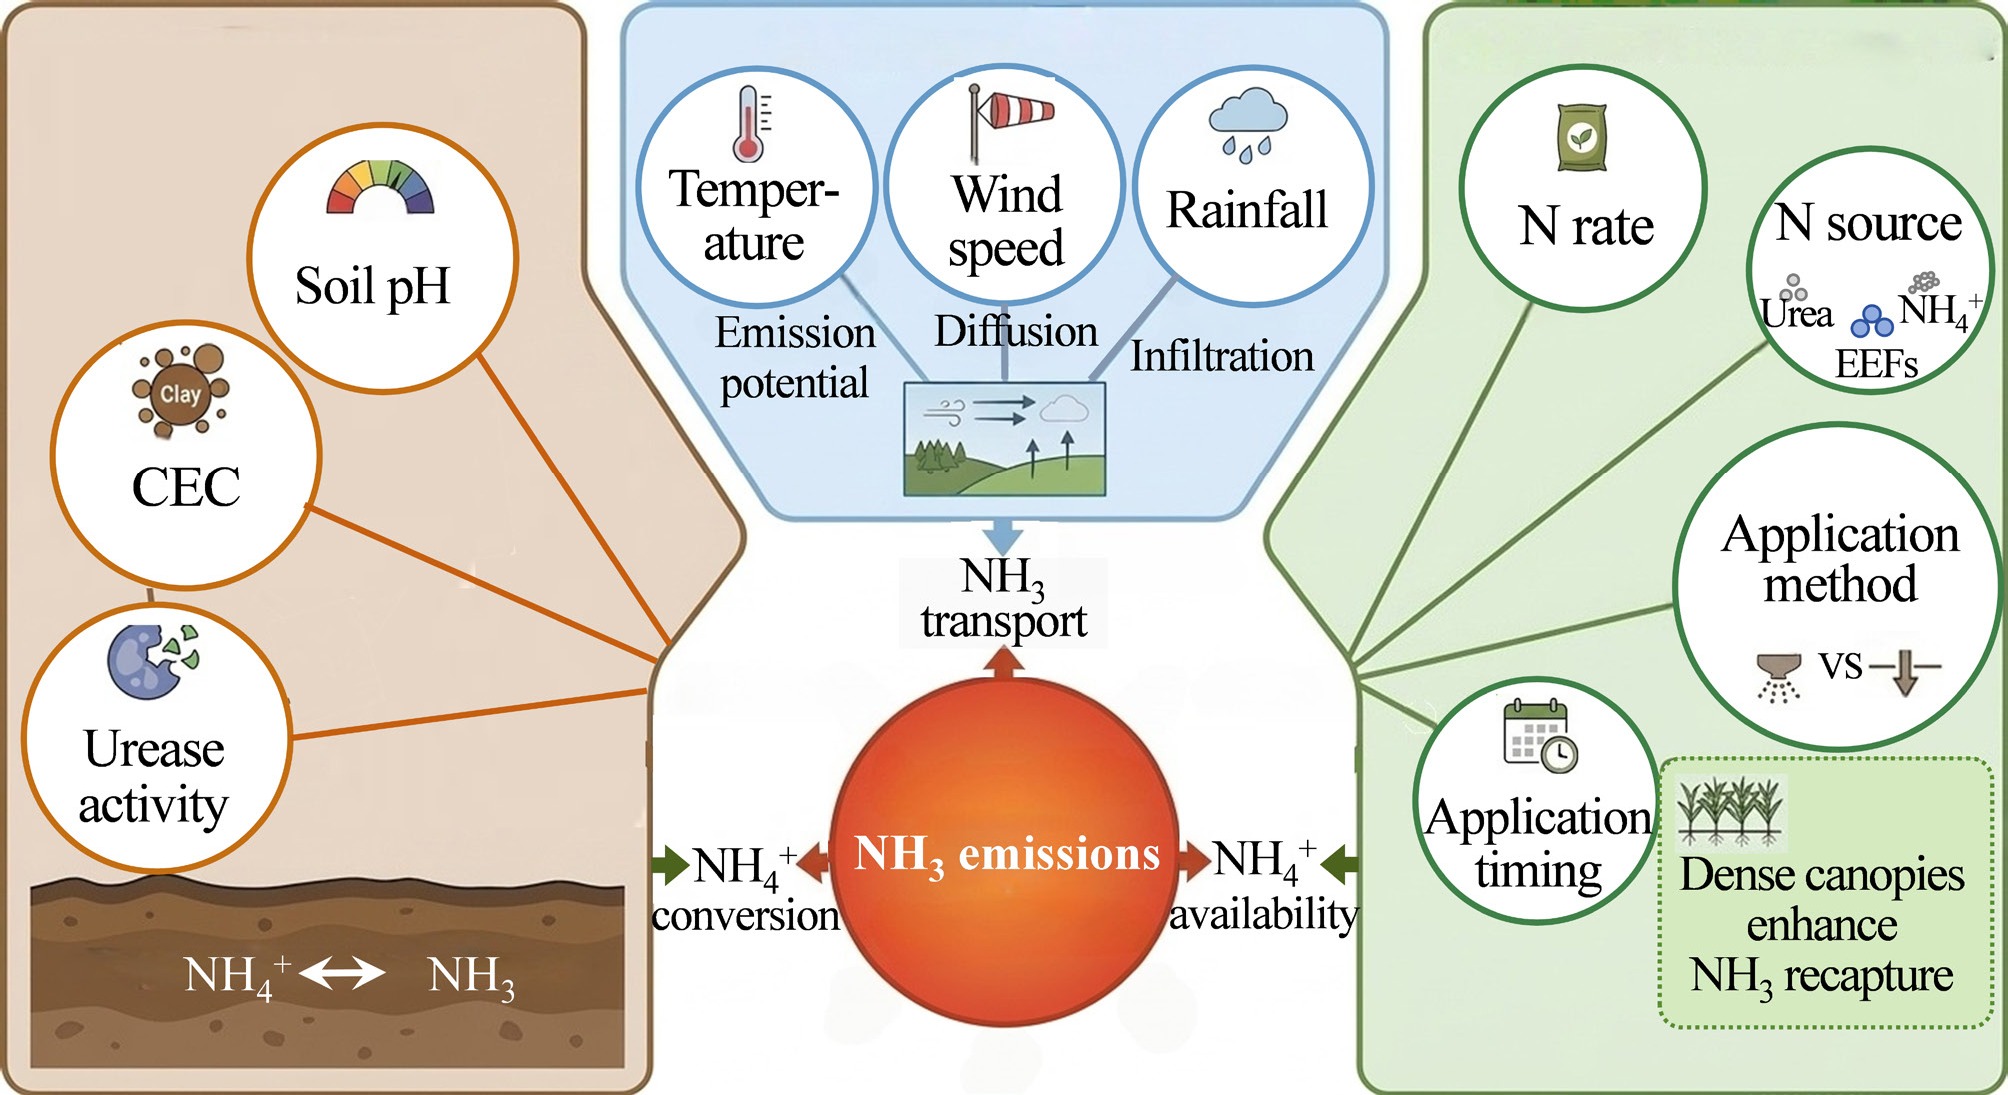
Figure 4.
Schematic diagram of factors modulating NH3 emissions from croplands. CEC-cation exchange capacity; EEFs-enhanced efficiency fertilizers.
-
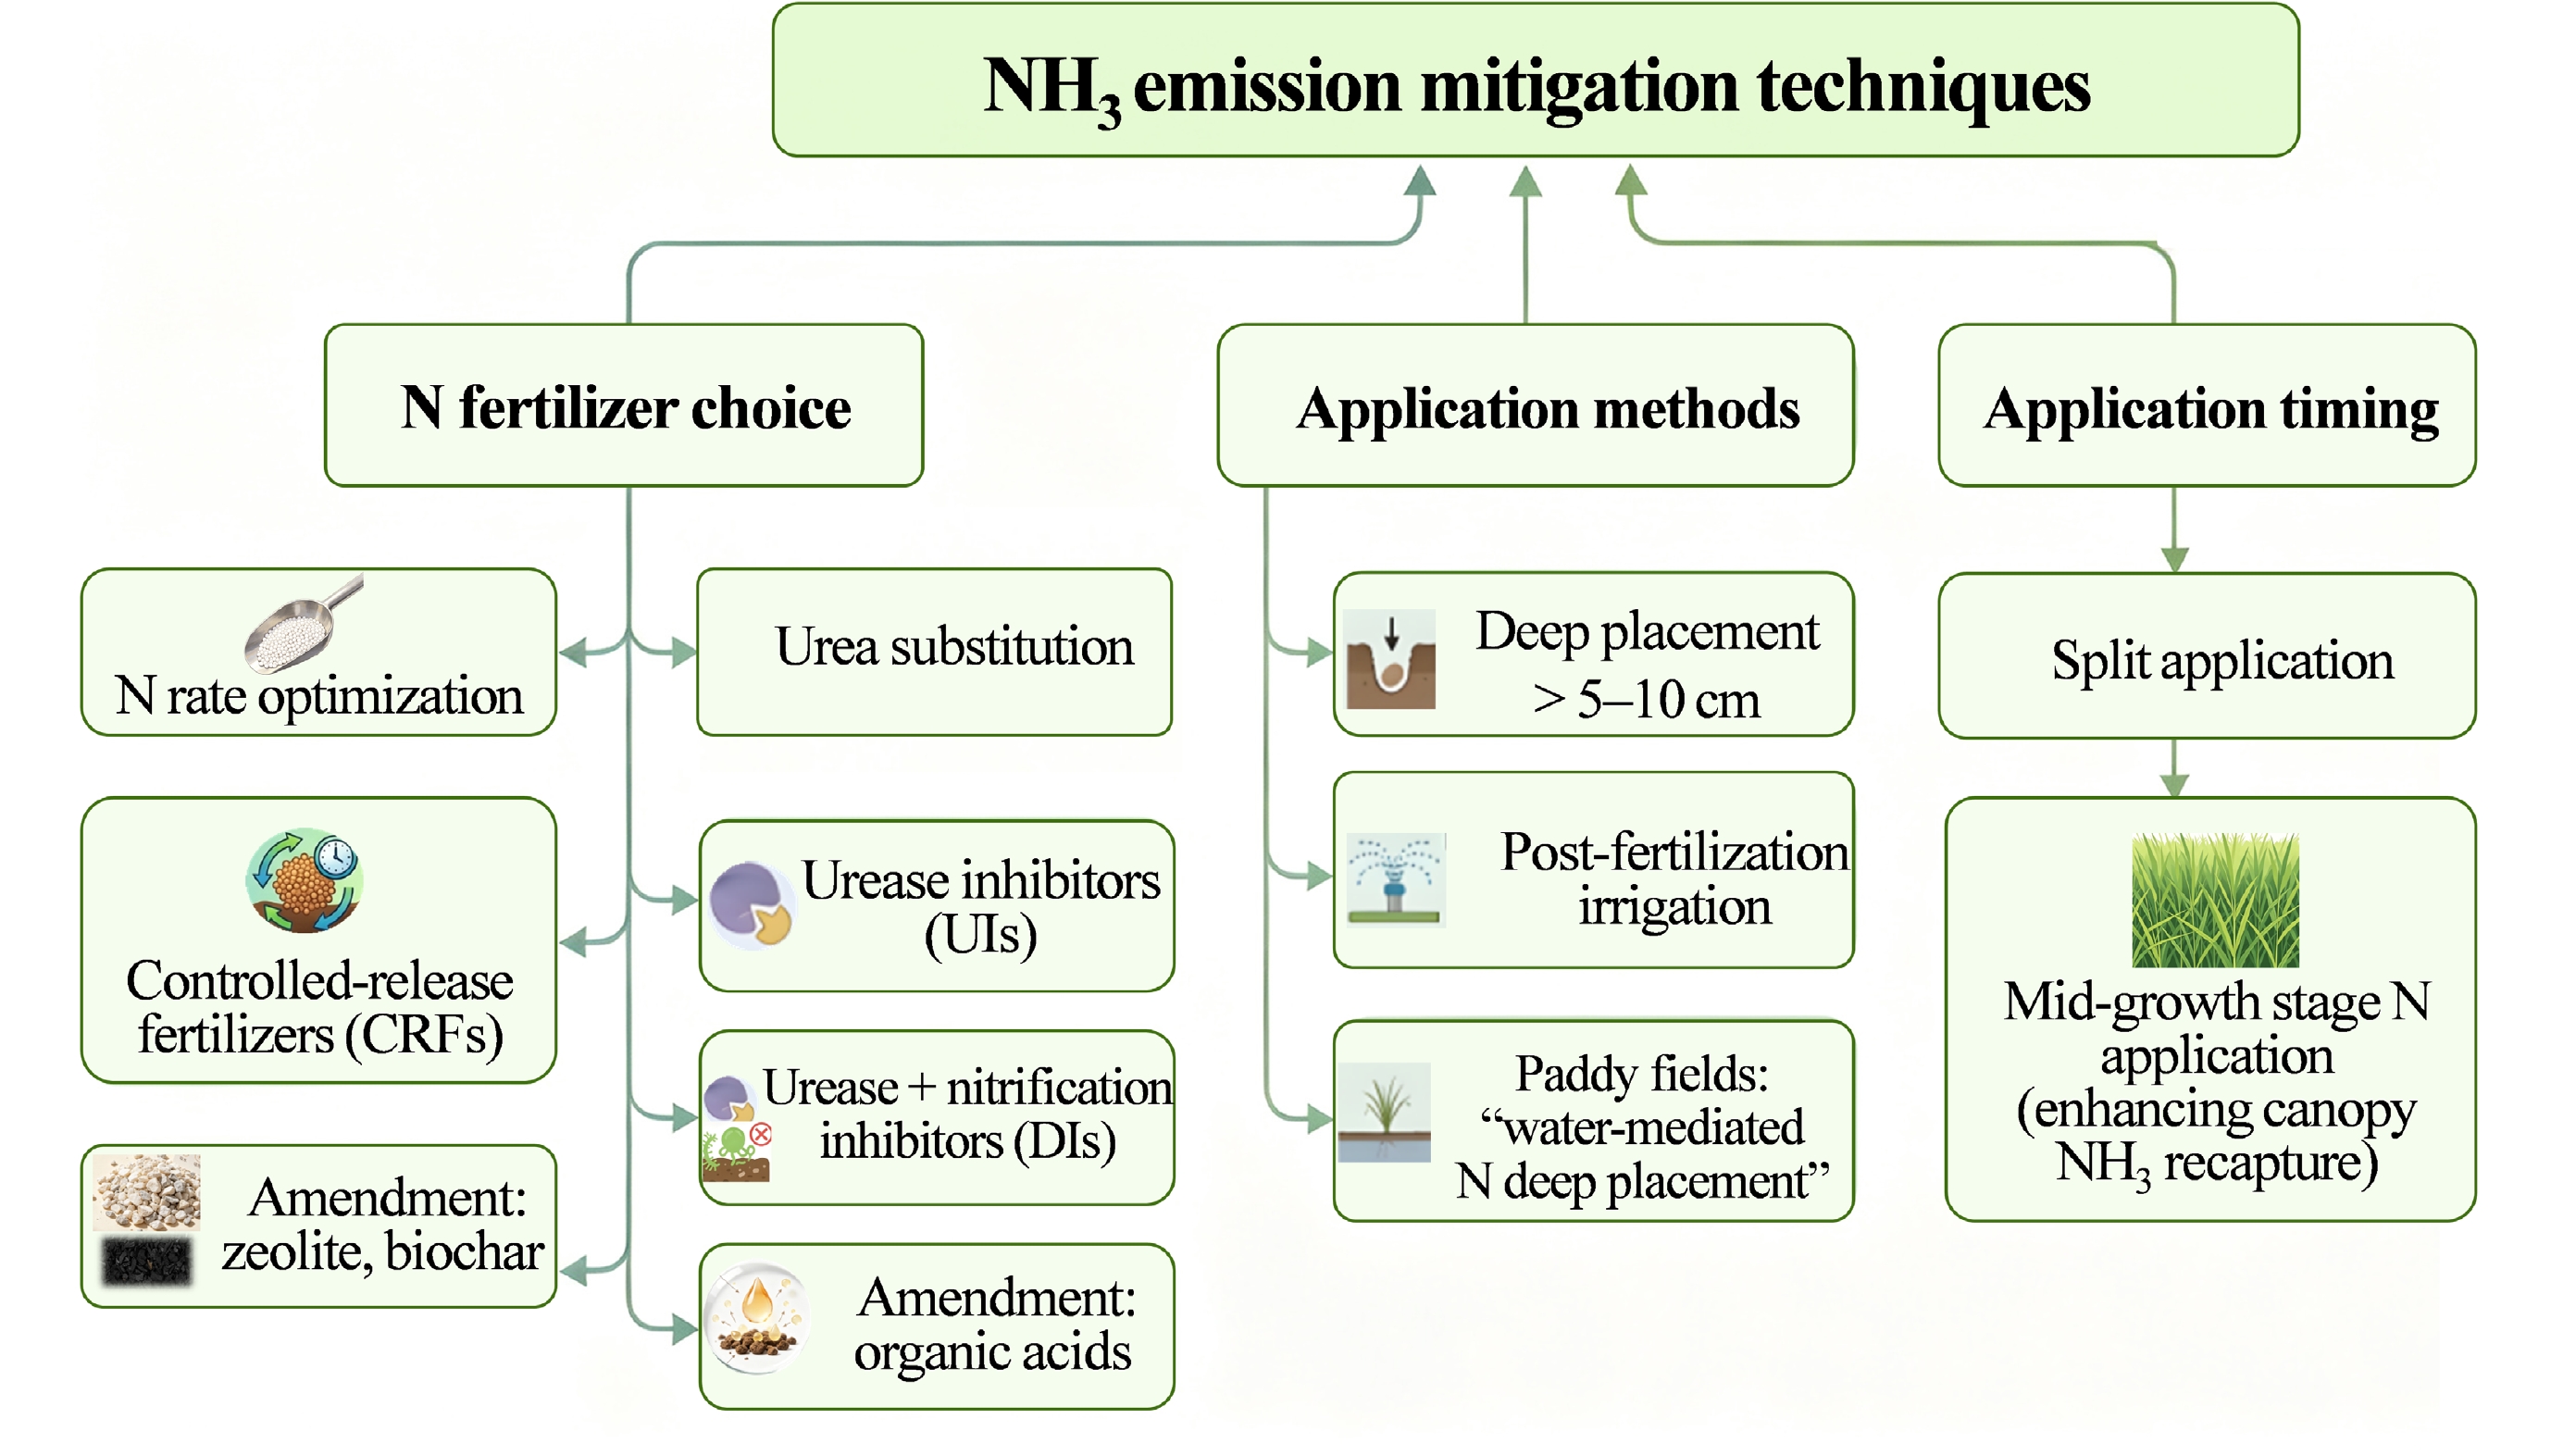
Figure 5.
Diagram illustrating cropland NH3 emission reduction strategies.
-
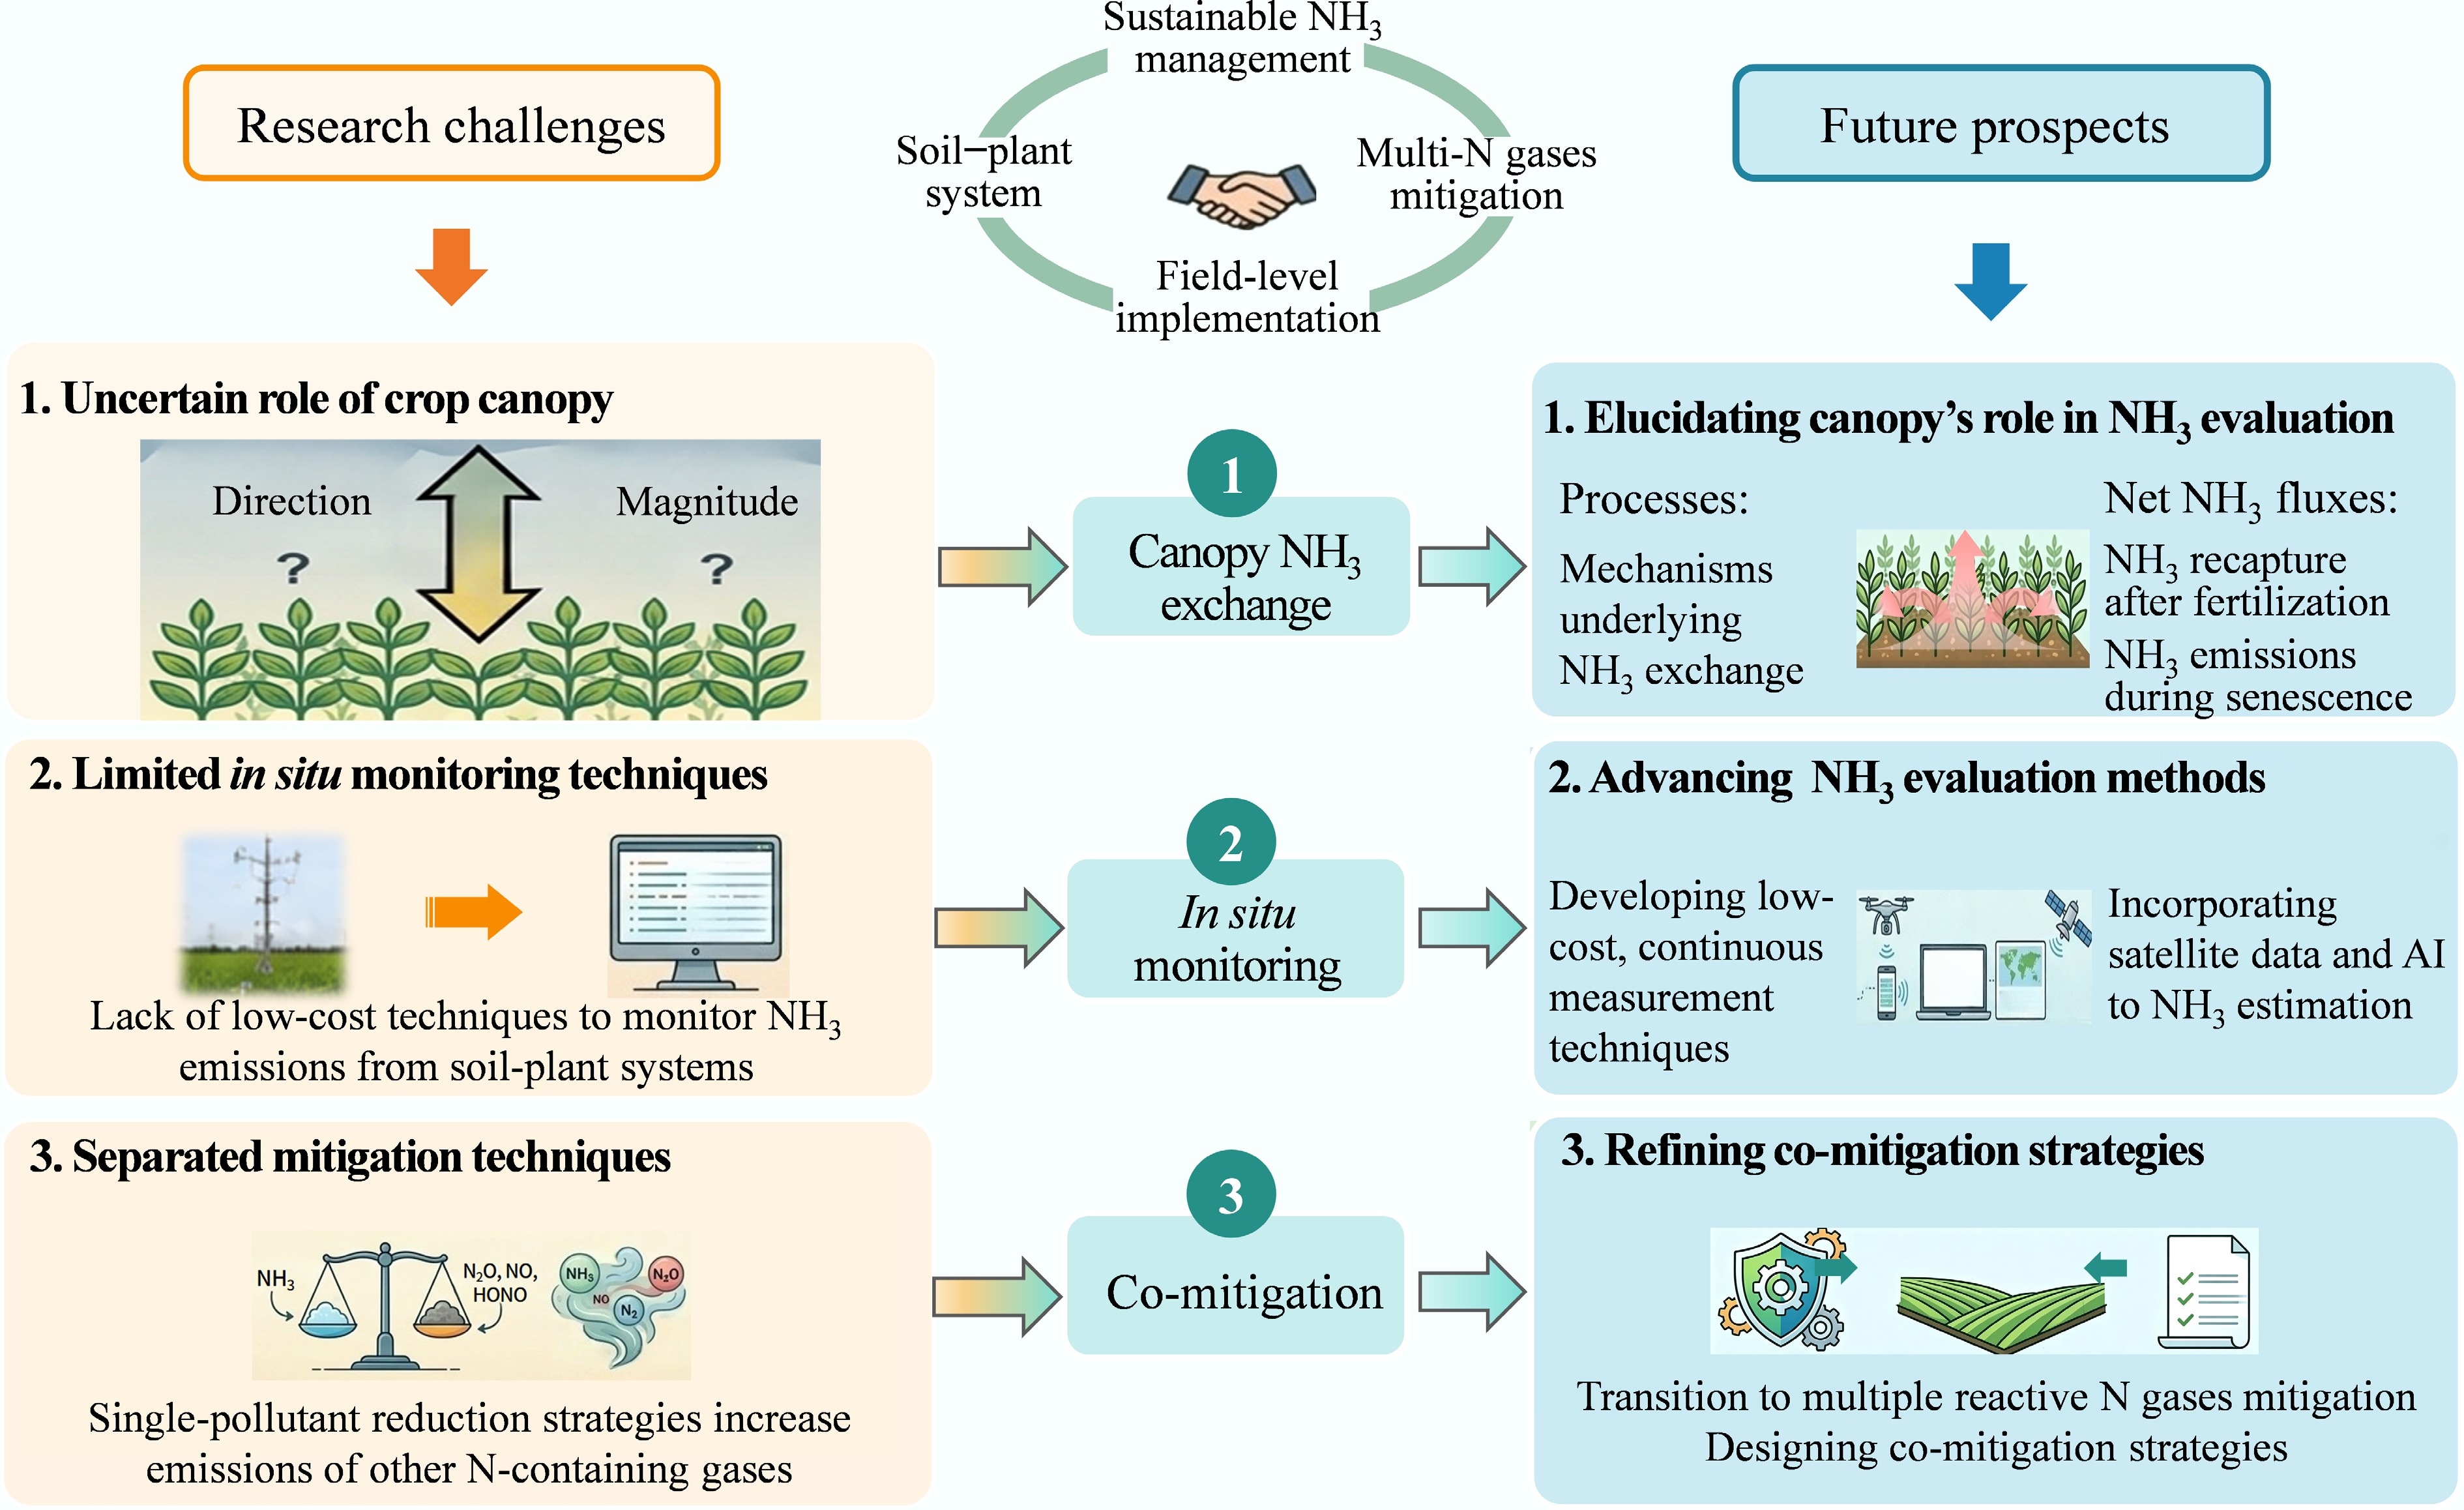
Figure 6.
Schematic diagram of the main research challenges and future prospects for research on cropland NH3 emissions.
-
Measurement technique Spatial coverage Precision Cost and labor requirement Suitability and limitation Indirect methods Plot to field scale Low to medium (overestimates NH3 losses. 15N tracing improves accuracy) Low to high cost (high for 15N isotopes), high labor (soil sampling) Suitable for estimating short-term losses under specific circumstances Passive chambers
(closed, vented)Small plot scale (0.01–0.2 m2) Low (underestimates NH3 fluxes by 26%–63% by dampening wind speed[13,79]) Very low cost, low labor, no power supply required Ideal for relative comparisons among treatments in remote areas. Not suitable for absolute emission quantification Active chambers (dynamic chambers, Dräger-Tubes) Small plot scale (0.01–0.2 m2) Medium to high (highly depends on air exchange rate and calibration) Medium cost, moderate labor; dynamic chambers require continuous power Suitable for plot-scale treatment comparisons Wind tunnels Small plot scale
(~1 m2)High (effectively simulates aerodynamic conditions) High cost, complex equipment setup, requires continuous power Suitable for plot-scale treatment comparisons. Cannot simulate calm winds Integrated horizontal flux
(IHF)Field scale
(15‒50 m radius)High (integrates spatial heterogeneity) Medium cost, high labor (frequent sampler replacement and lab analysis) Recommended standard for post-fertilization measurements in uniform, open fields Aerodynamic gradient
method (AGM)Field scale (ha) High (sensitive to atmospheric stability and NH3 gradient) Medium cost, high labor (depends on sampler type) Suitable for bidirectional exchange in large, uniform ecosystems Relaxed eddy accumulation (REA) Field scale (ha) Medium to high (provides time-averaged fluxes) Medium cost, high labor (depends on sampler type) Suitable for bidirectional exchange in large, uniform ecosystems Eddy covariance (EC) Field scale >(ha) High (provides high-frequency temporal resolution) High cost (requires fast-response laser spectrometers), high computational expertise Ideal for continuous, real-time, and long-term monitoring of bidirectional fluxes Backward Lagrangian stochastic model (bLS) Field-to-farm scale High (highly flexible source configuration) High cost (if using open-path lasers), high computational expertise Highly suitable for quantifying emissions from complex, distinct, or heterogeneous sources Table 1.
Comparison of major techniques measuring NH3 emissions from croplands
-
Mitigation technique Primary mechanism Reduction efficiency (%) Ref. N rate optimization Reduces substrate availability for NH3 emissions 30.7 [107] Deep placement Acts as a physical barrier; enhances soil adsorption 48.0
54.7
34.6[22]
[100]
[107]UIs Delays urea hydrolysis to avoid rapid pH increases 53.1
53.7
50.0
52.0[22]
[100]
[107]
[95]Controlled-release fertilizers Regulates N release to prevent high NH4+ concentrations 56.8
68.0
60.8[22]
[100]
[107]Nitrification inhibitors (NIs) Inhibits nitrification, leading to NH4+ accumulation and increasing NH3 emission potential −42.6*
−38.0*
−27.5*[22]
[100]
[107]Split applications of fertilizer Avoids NH4+ accumulation and synchronizes N supply with crop needs 0
23.6
0
31.7[22]
[108]
[100]
[107]Post-fertilization irrigation Transports urea and NH4+ downward into the soil profile 38.8
34.5[22]
[100]Substitution of Urea by ammonium sulfate or ammonium nitrate in drylands Eliminates hydrolysis-induced pH increases 51.2–88.3
63.5[22]
[100]Reducing basal fertilizer proportion Avoids NH4+ accumulation 61.5 [107] Delaying early
tillering fertilizerEnhances canopy NH3 recapture and root uptake of NH4+ 31.0 [46] Amendments Promotes temporal adsorption of NH4+ 31.4 [100] * Negative values in association with NIs indicate an increase in NH3 emissions. Table 2.
A summary of NH3 emission reduction efficiencies for major mitigation techniques based on existing meta-analyses
Figures
(6)
Tables
(2)