-
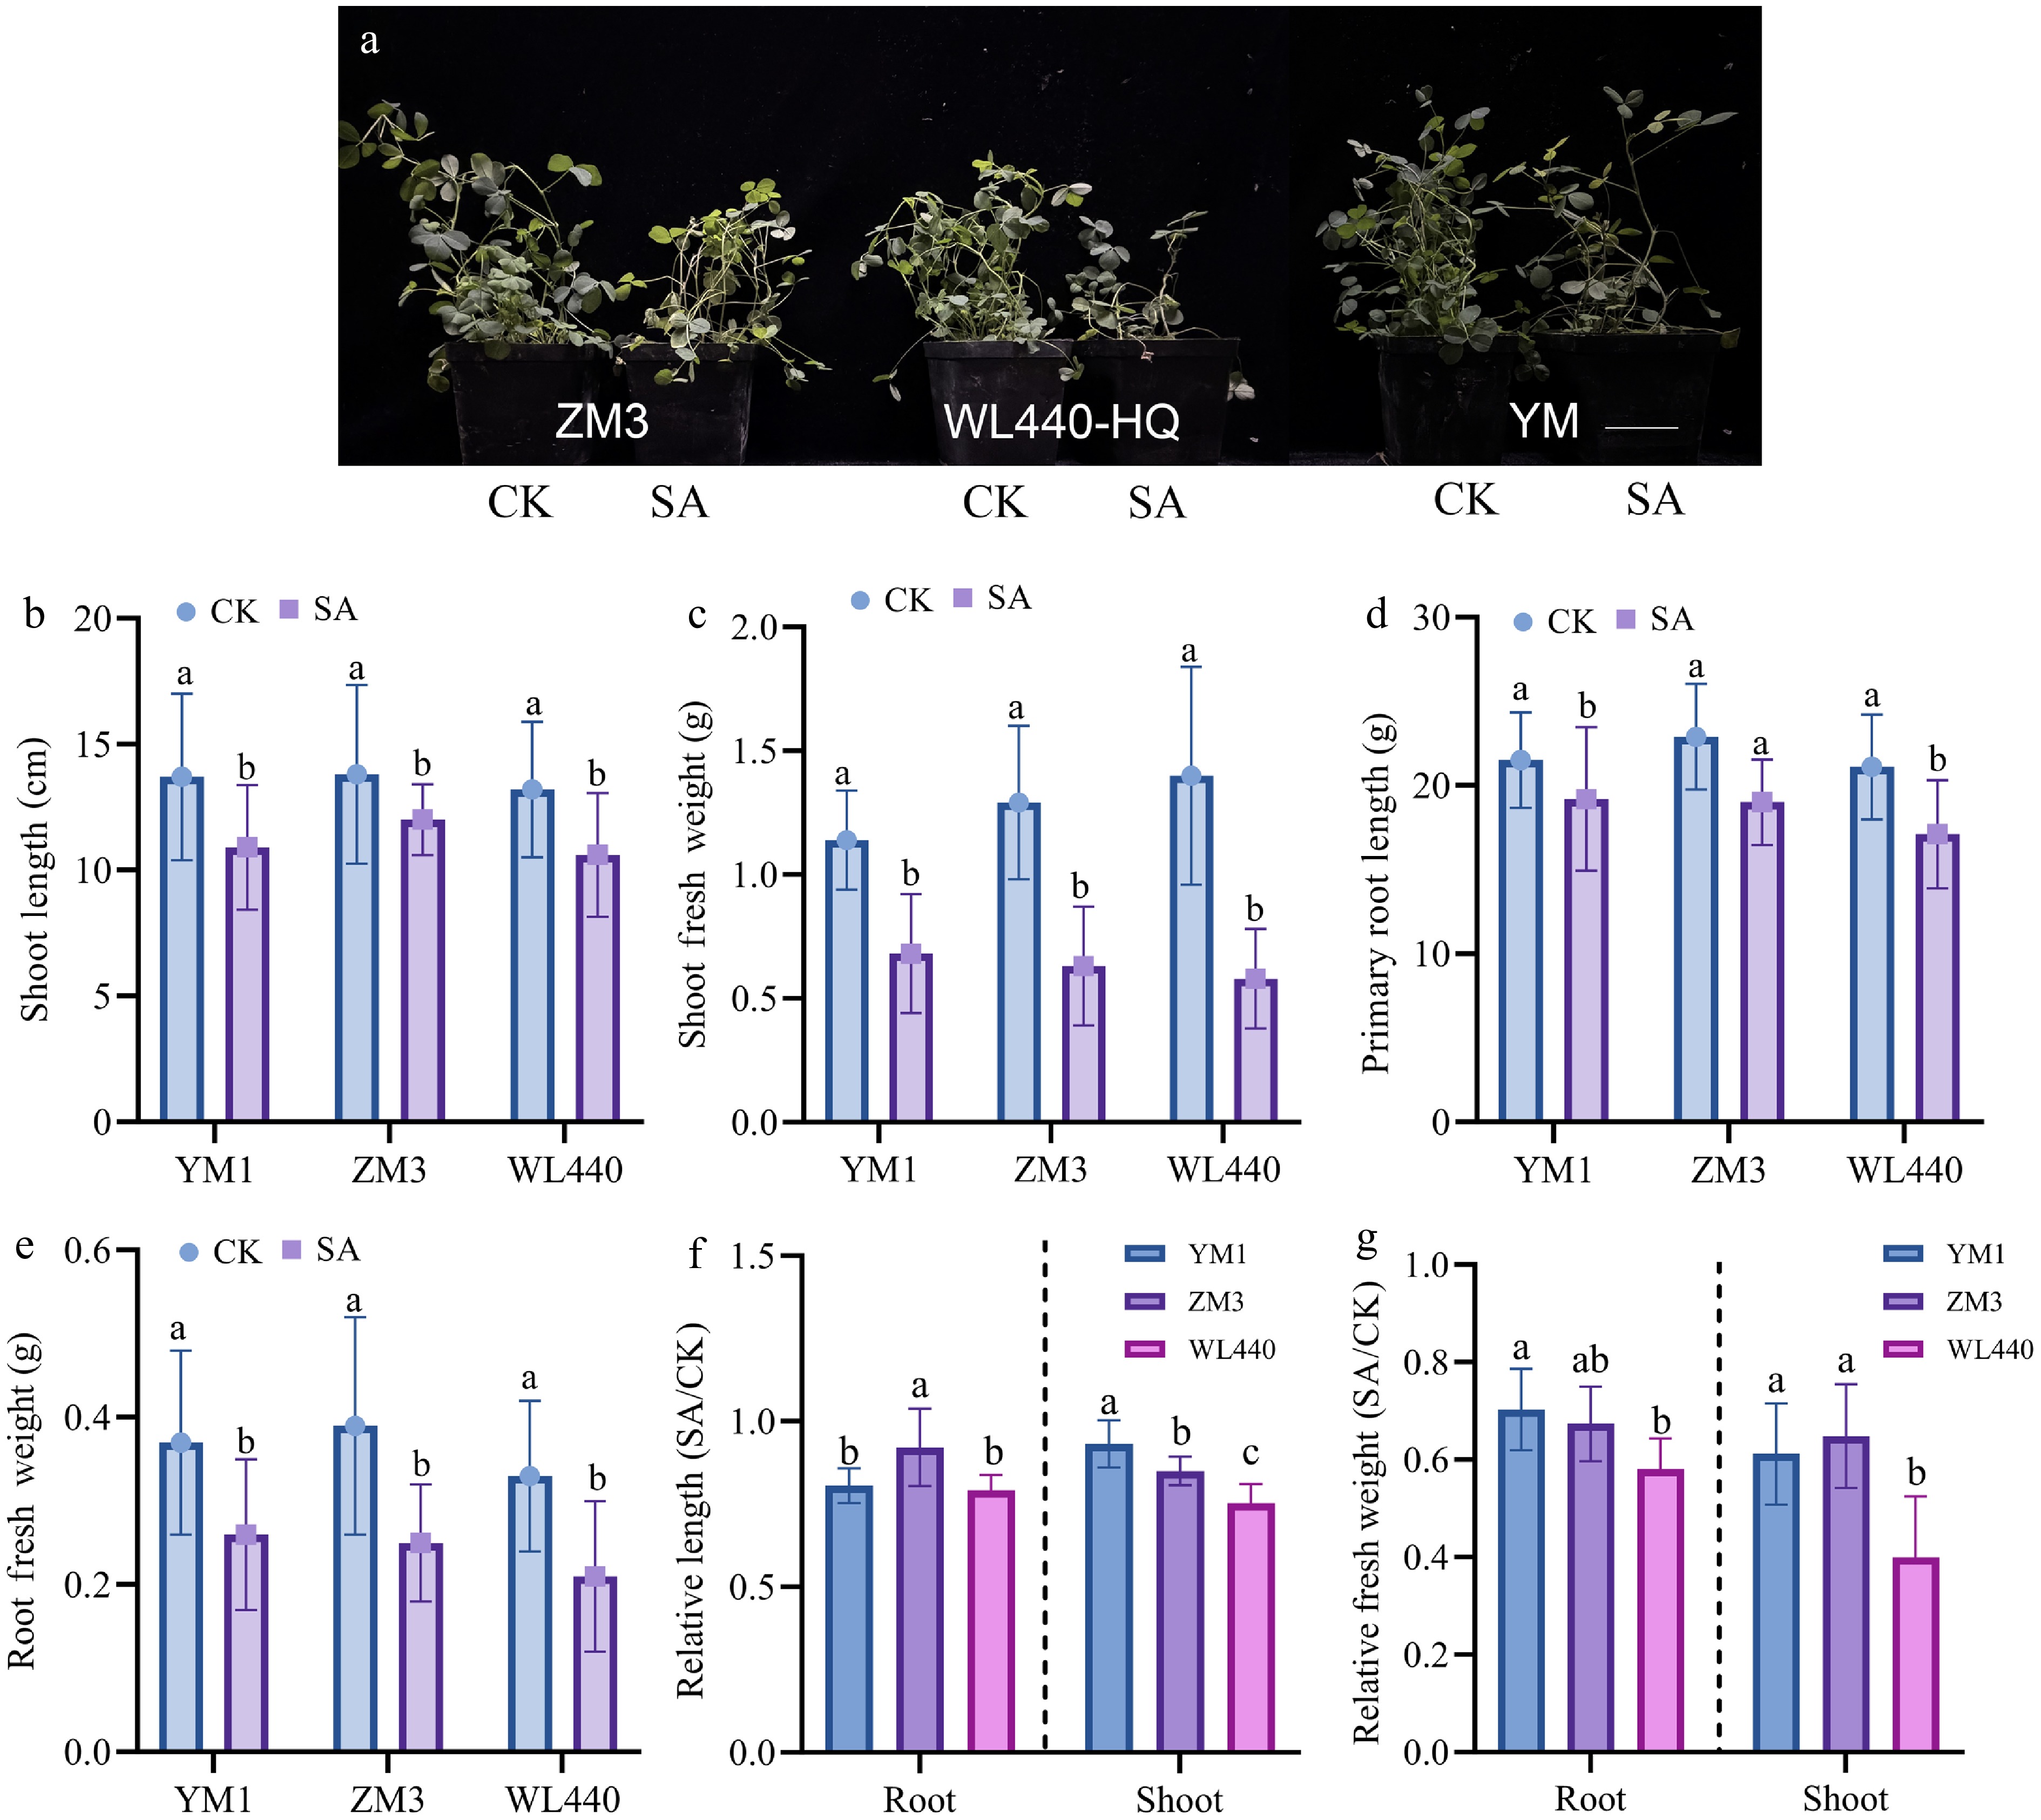
Figure 1.
Growth indices of different alfalfa varieties under saline-alkali stress. (a) Phenotypes of 4-week-old alfalfa seedlings under control (CK) and saline-alkali (SA, 100 mmol/L NaCl + 100 mmol/L NaHCO3) stress for 2 weeks. Scale bar = 5 cm. (b) Shoot length; (c) shoot fresh weight; (d) primary root length; (e) root fresh weight; (f) relative primary root length and shoot length (SA/CK) of three alfalfa varieties under saline-alkali stress; (g) relative root fresh weight and shoot fresh weight (SA/CK) of three alfalfa varieties under saline-alkali stress. CK, control treatment; SA, saline-alkali stress treatment. Data are presented as mean ± standard deviation (n = 10). Different lowercase letters indicate significant differences between treatments within the same variety for (b)–(e) and within the same tissue for (f)–(g) (p < 0.05).
-
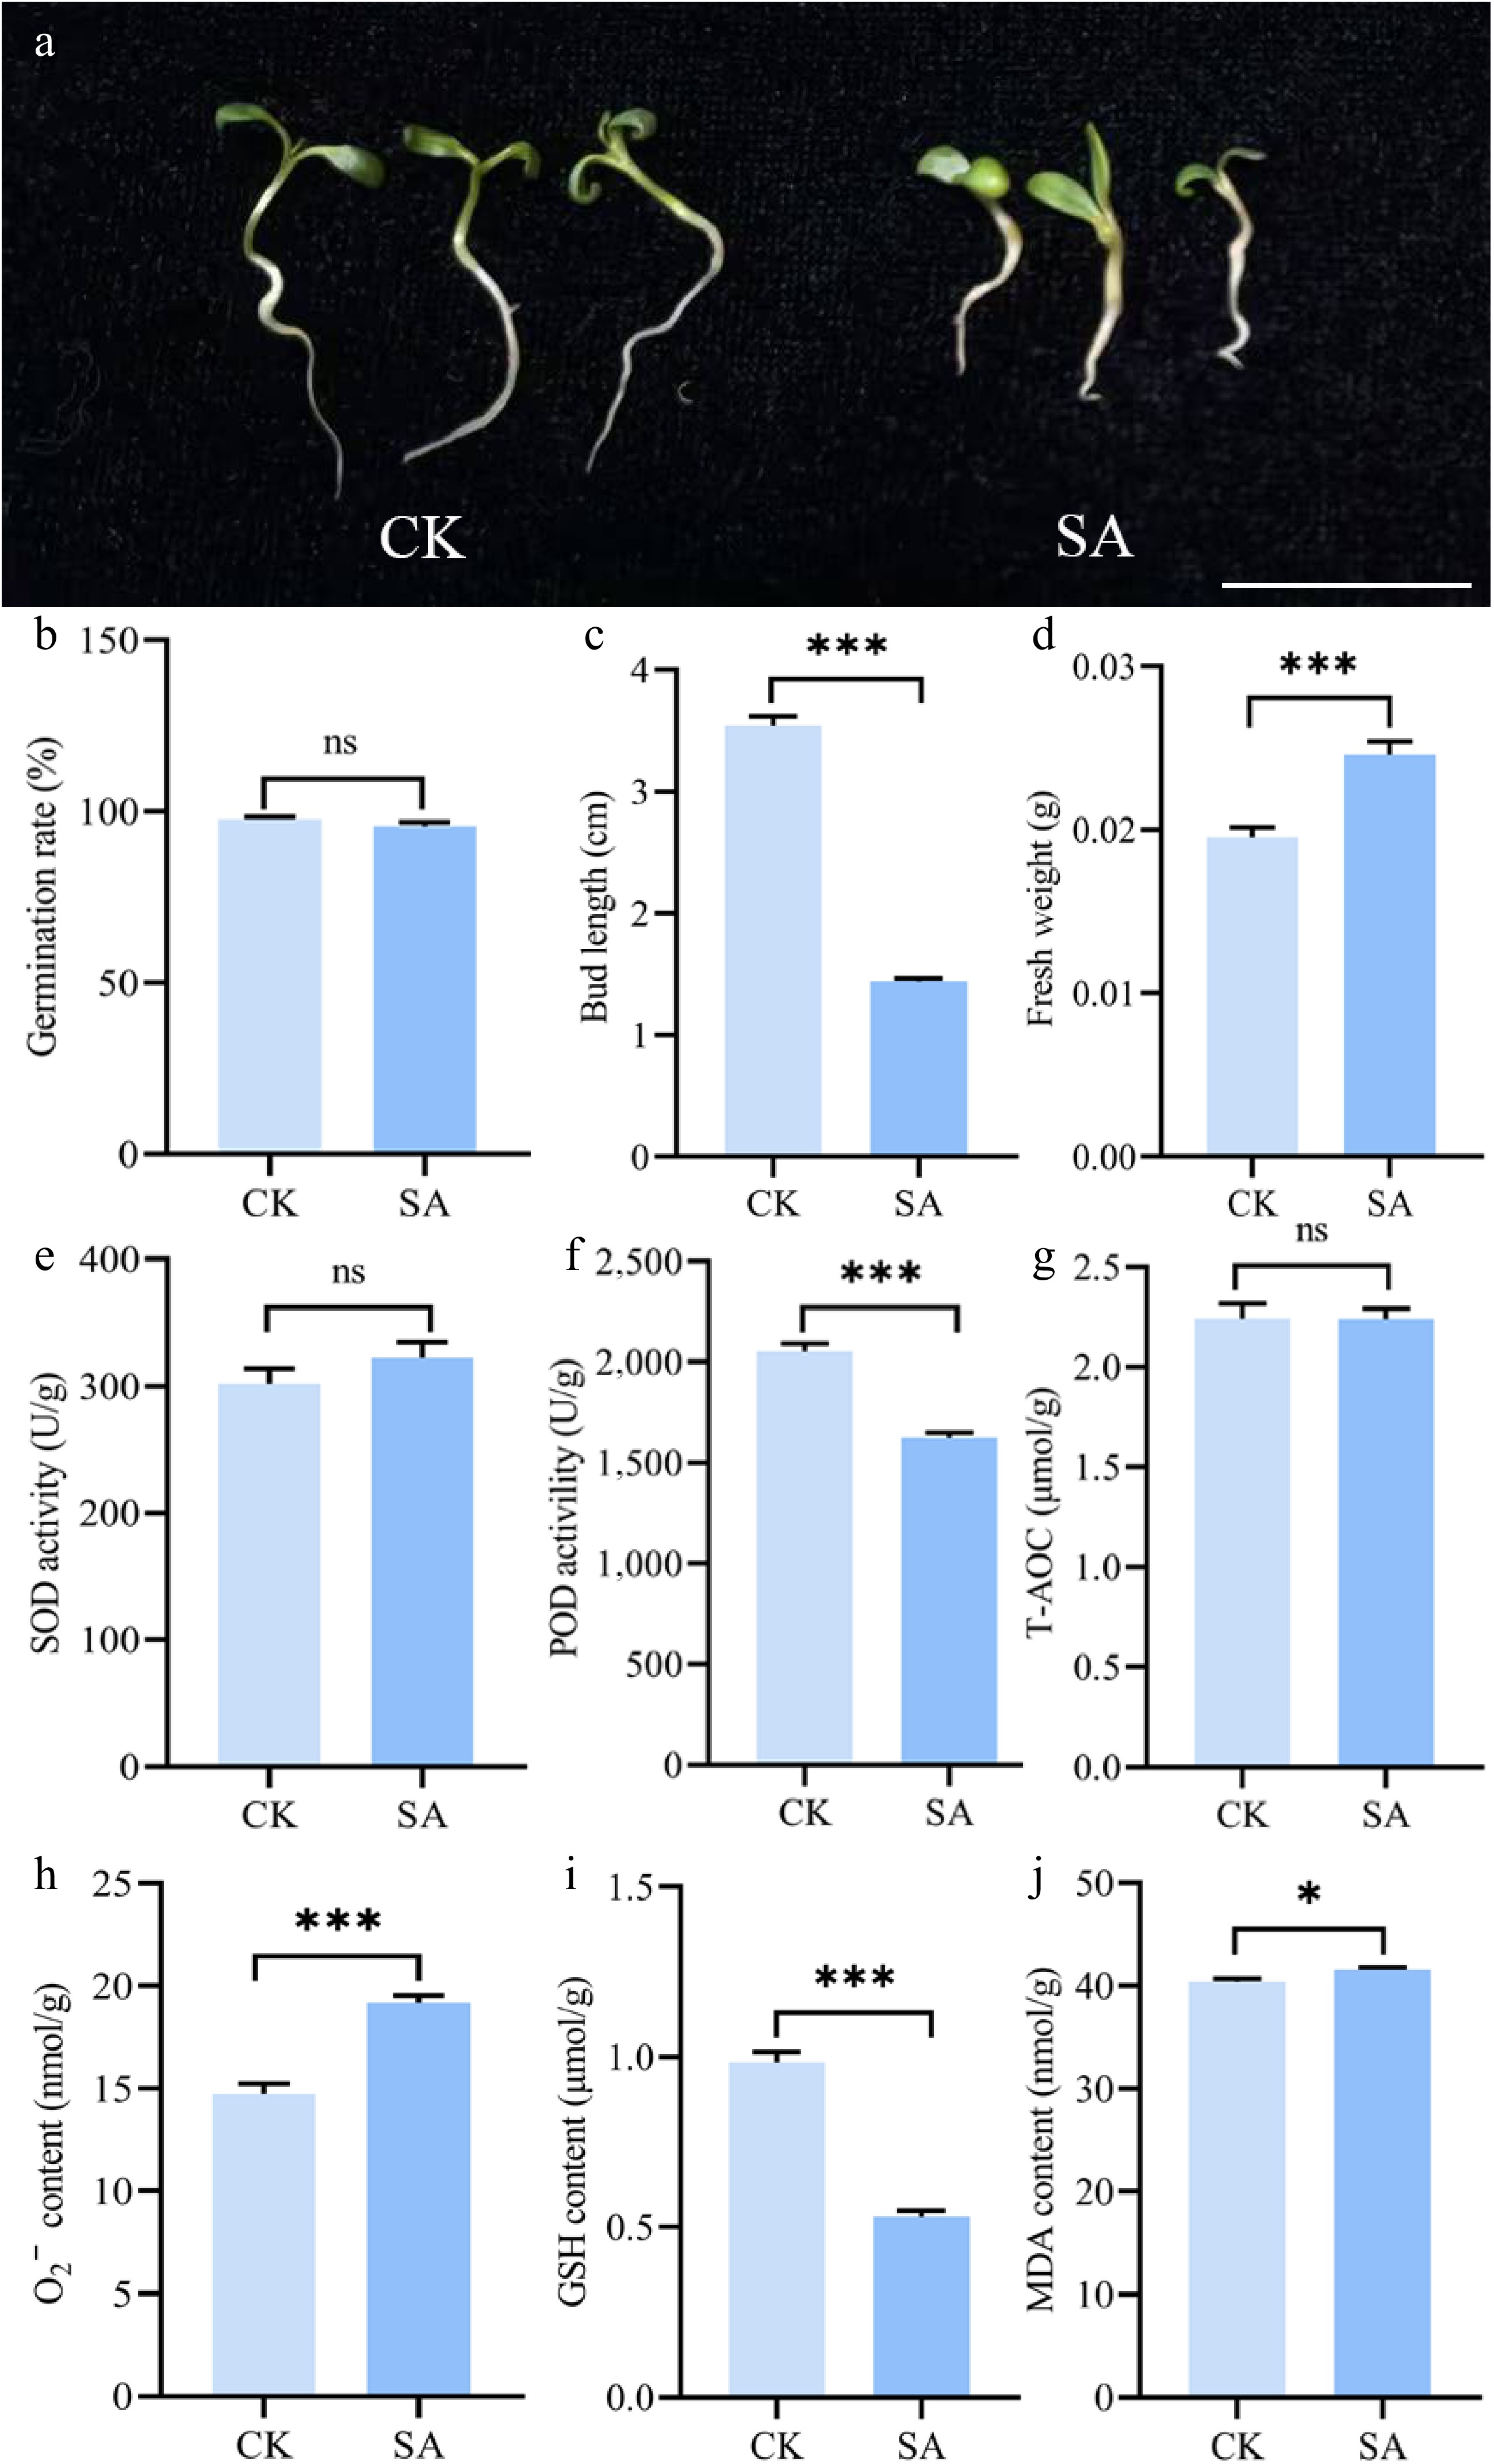
Figure 2.
Physiological and biochemical responses of alfalfa (Medicago sativa L.) to saline-alkali stress at the germination and early seedling stage. (a) The germination phenotype of alfalfa seedlings under control (CK) and saline-alkali stress (75 mmol/L NaCl + 10 mmol/L NaHCO3 treatments). Scale bar = 2 cm; (b) germination rate; (c) bud length; (d) fresh weight; (e) superoxide dismutase (SOD) activity; (f) peroxidase (POD) activity; (g) total antioxidant capacity (T-AOC); (h) superoxide anion content; (i) glutathione (GSH) content; (j) malondialdehyde (MDA) content. Data are presented as mean ± standard deviation. Asterisks denote significant differences between groups: * p < 0.05, *** p < 0.001.
-
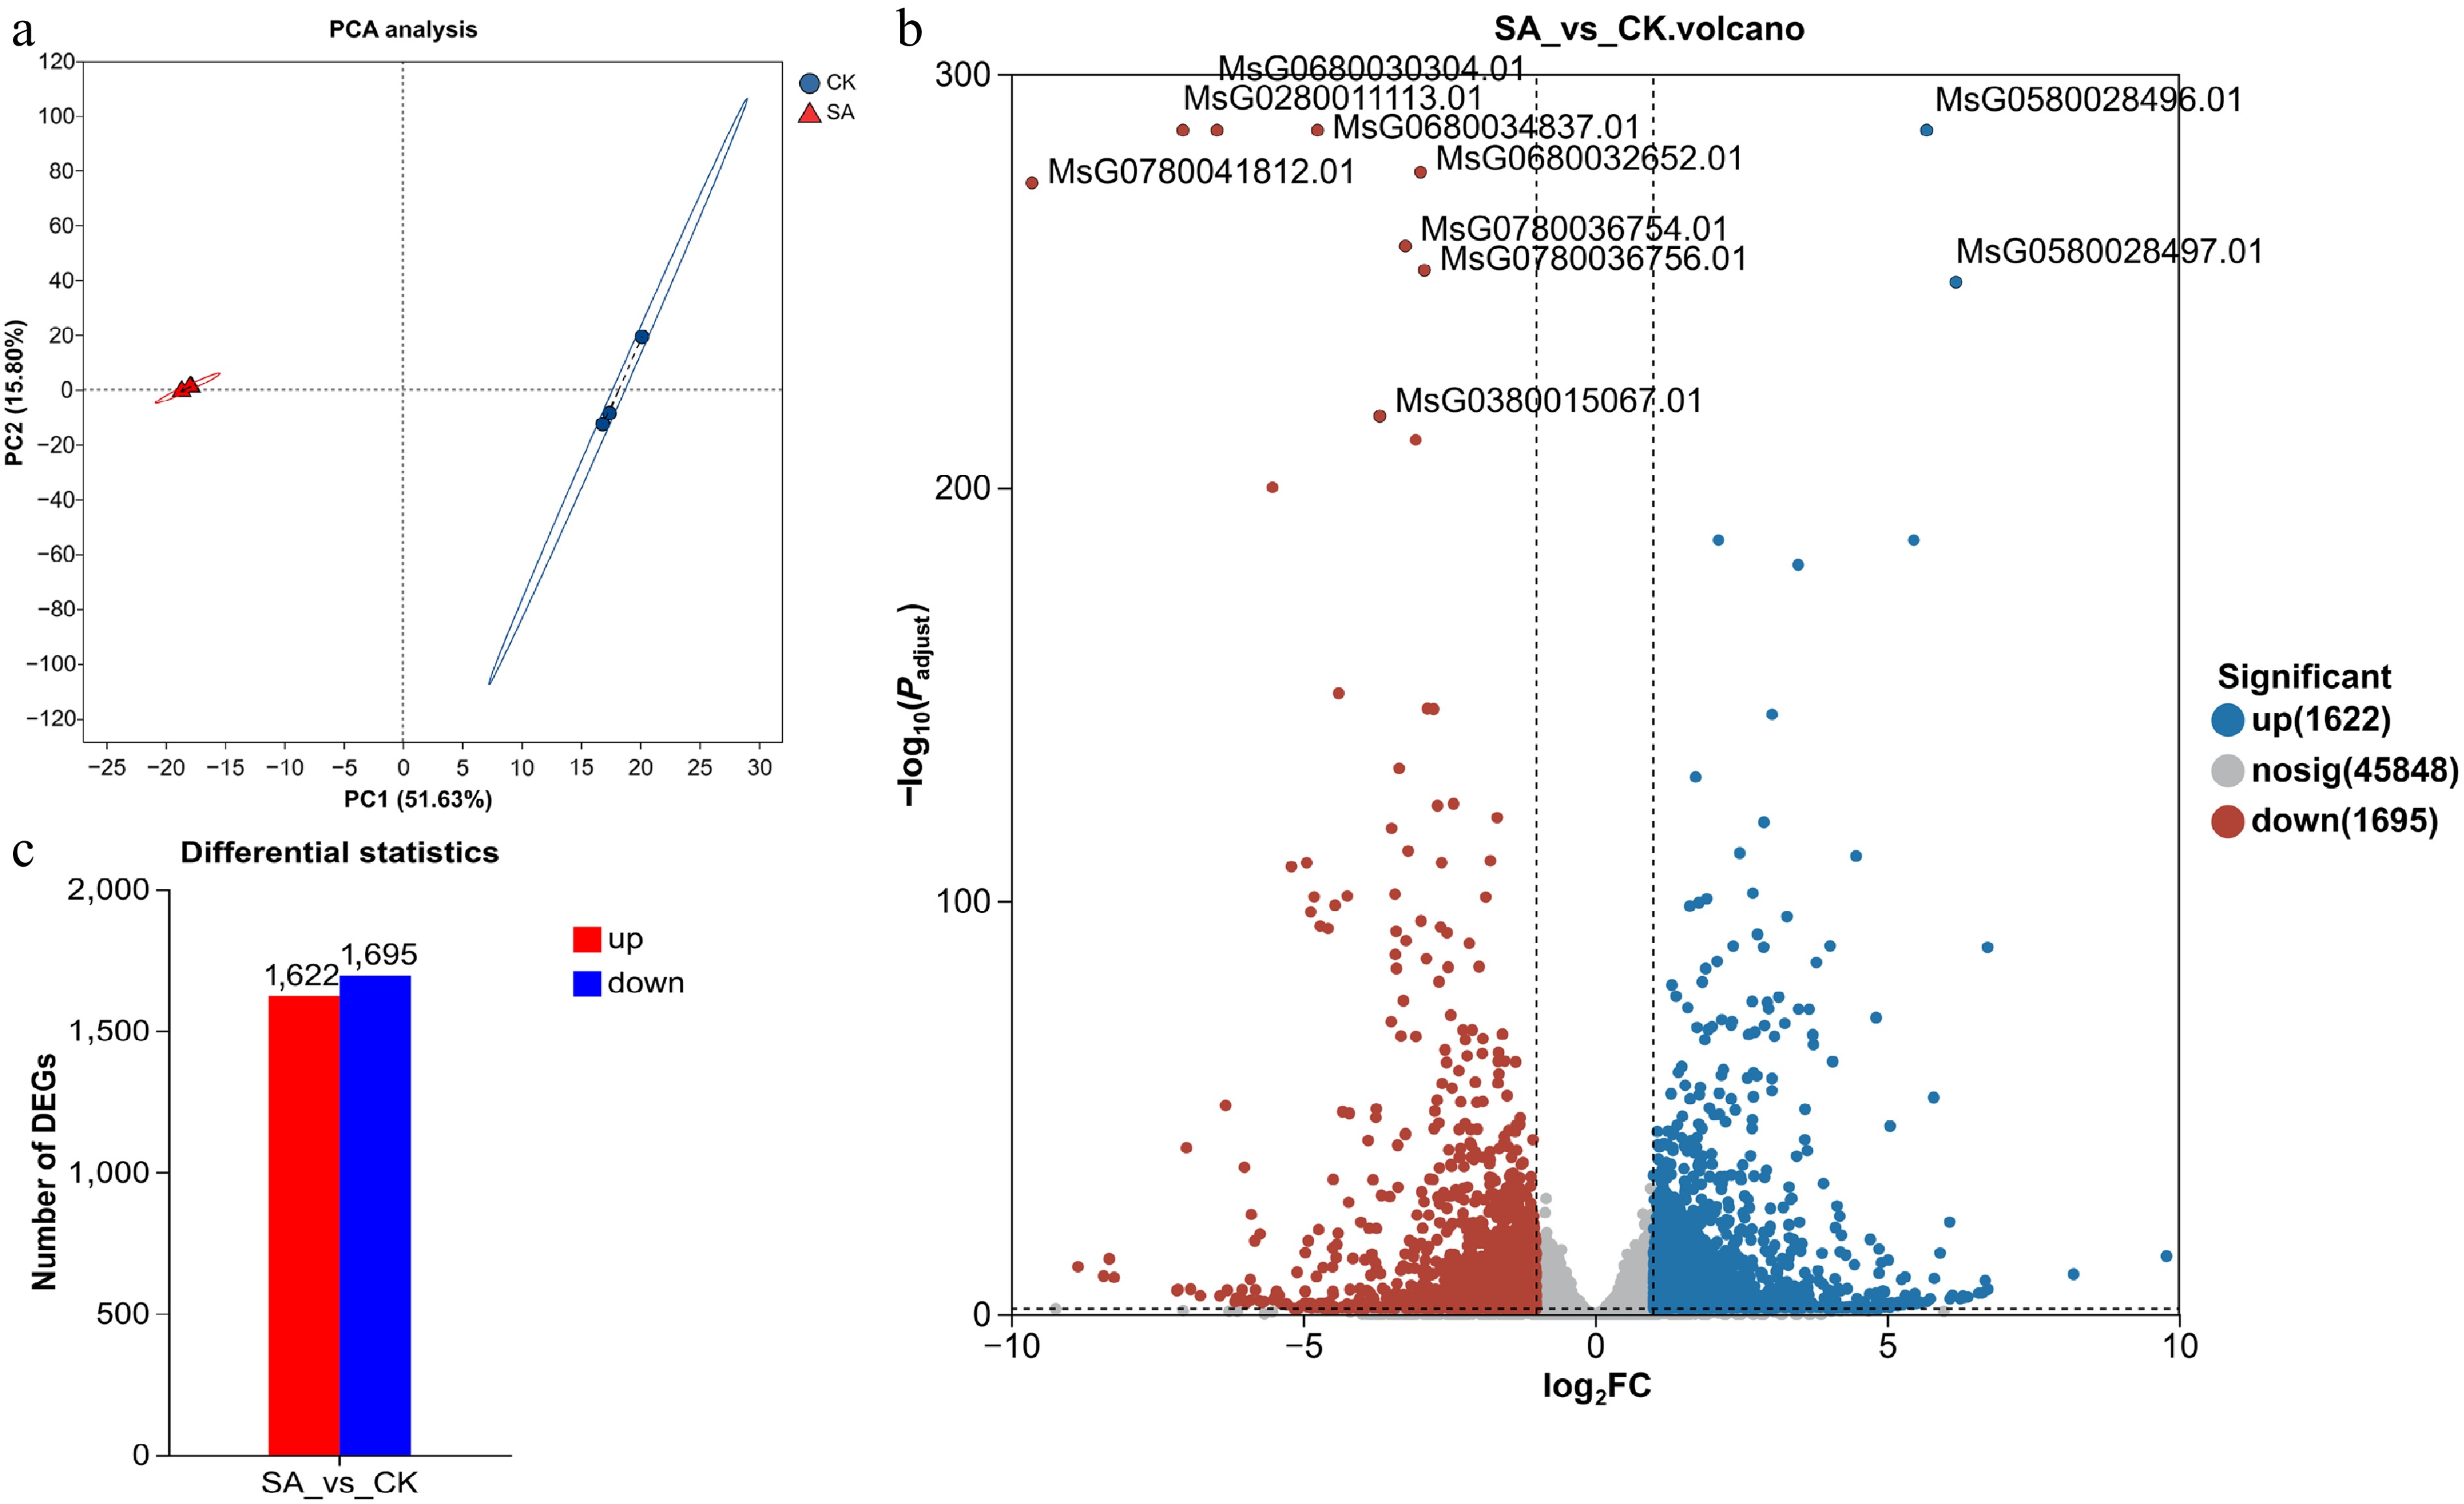
Figure 3.
Principal component analysis and identification of differentially expressed genes (DEGs) between compound saline-alkali stress (SA) and control (CK) groups based on transcriptome data. (a) Principal component analysis (PCA) of all transcriptome samples. The explained variance of PC1 and PC2 is labeled on the axes. Blue circles represent CK control samples; red triangles represent SA compound saline-alkali stress samples. (b) Volcano plot of DEGs in SA vs CK comparison. The x-axis indicates log2 (fold change), and the y-axis represents −log10 (adjusted p-value). Blue dots: significantly upregulated genes; red dots: significantly downregulated genes; gray dots: genes with no significant expression difference. IDs of several highly significant DEGs are annotated in the plot. (c) Bar chart showing the number of DEGs in SA vs CK. Red bars denote upregulated DEGs; blue bars denote downregulated DEGs.
-
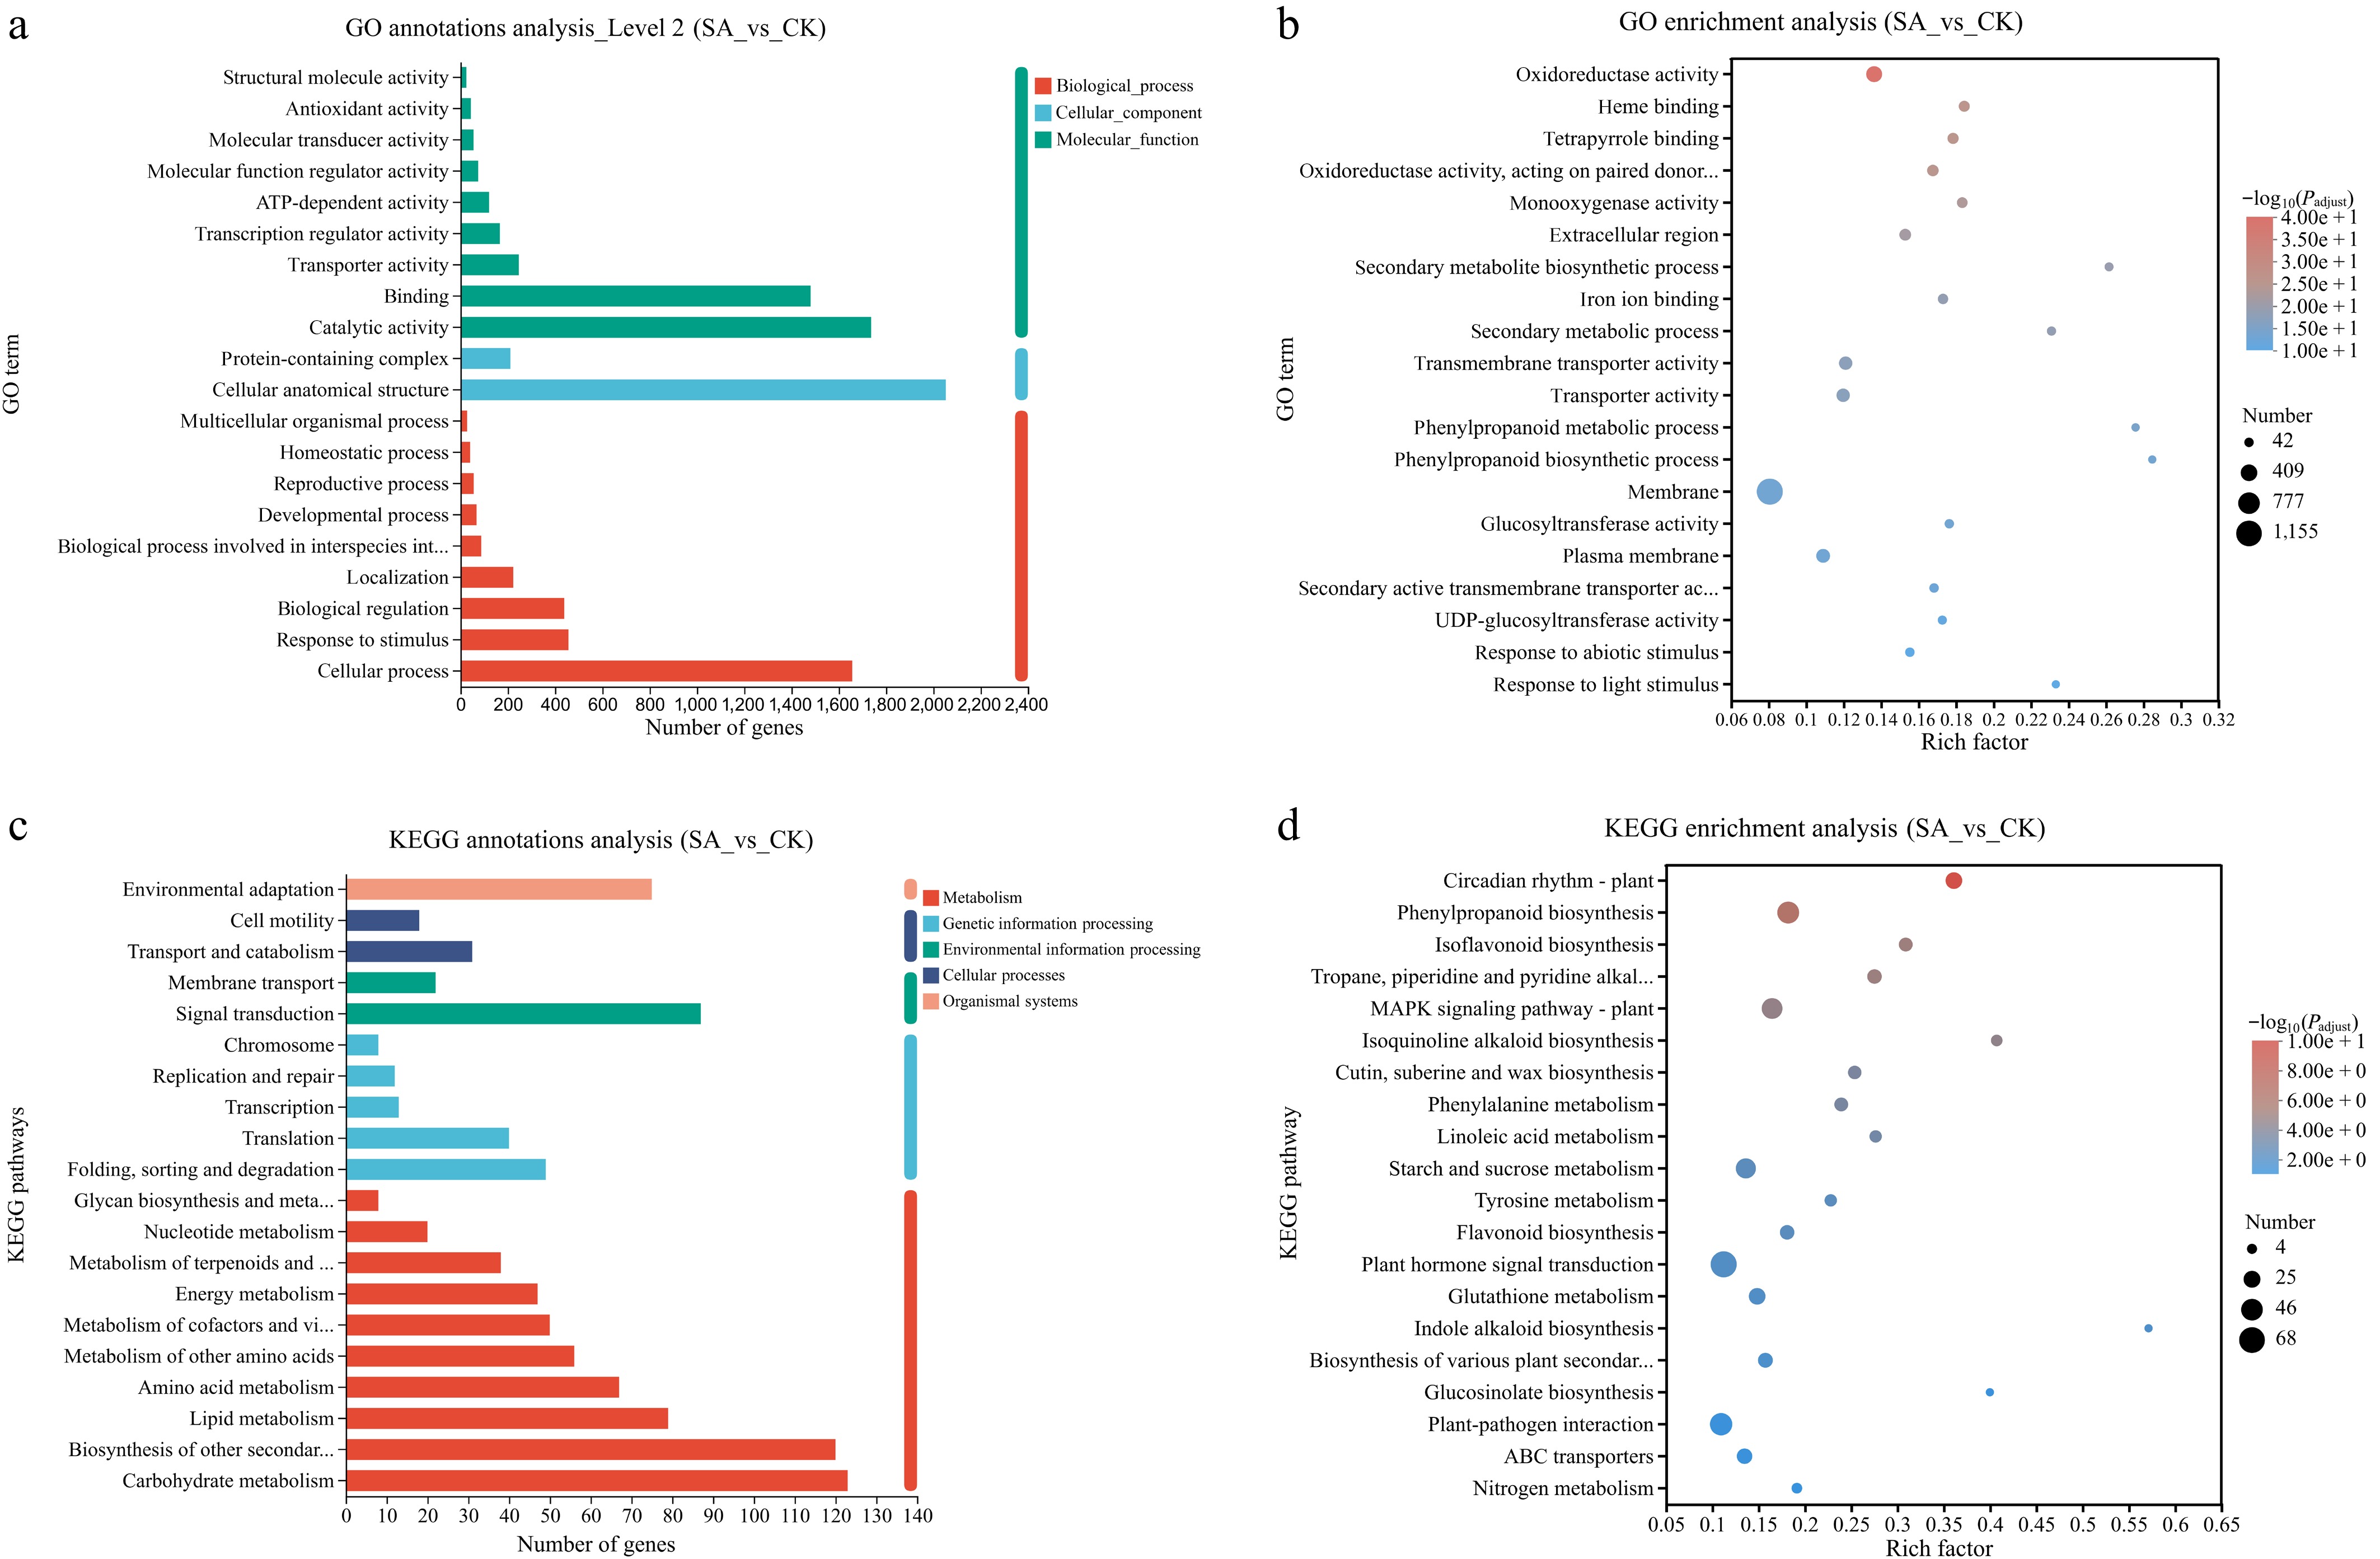
Figure 4.
GO and KEGG functional annotation and enrichment analysis of differentially expressed genes (DEGs) under compound saline-alkali stress (SA) compared with control (CK). (a) Bar chart of GO level 2 classification annotation. The x-axis represents the number of annotated DEGs. Red: biological process (BP); light blue: cellular component (CC); dark green: molecular function (MF). (b) Bubble plot of GO functional enrichment. The x-axis indicates Rich factor, the size of each bubble corresponds to the number of DEGs enriched in the term, and the color gradient represents −log10 (padjust), reflecting enrichment significance. (c) Bar chart of KEGG pathway level 2 classification annotation. The x-axis shows the number of annotated DEGs, and distinct colors represent five primary KEGG pathway categories. (d) Bubble plot of KEGG pathway enrichment. The x-axis denotes Rich factor, bubble size stands for the count of DEGs within each pathway, and color gradient corresponds to −log10 (padjust).
-
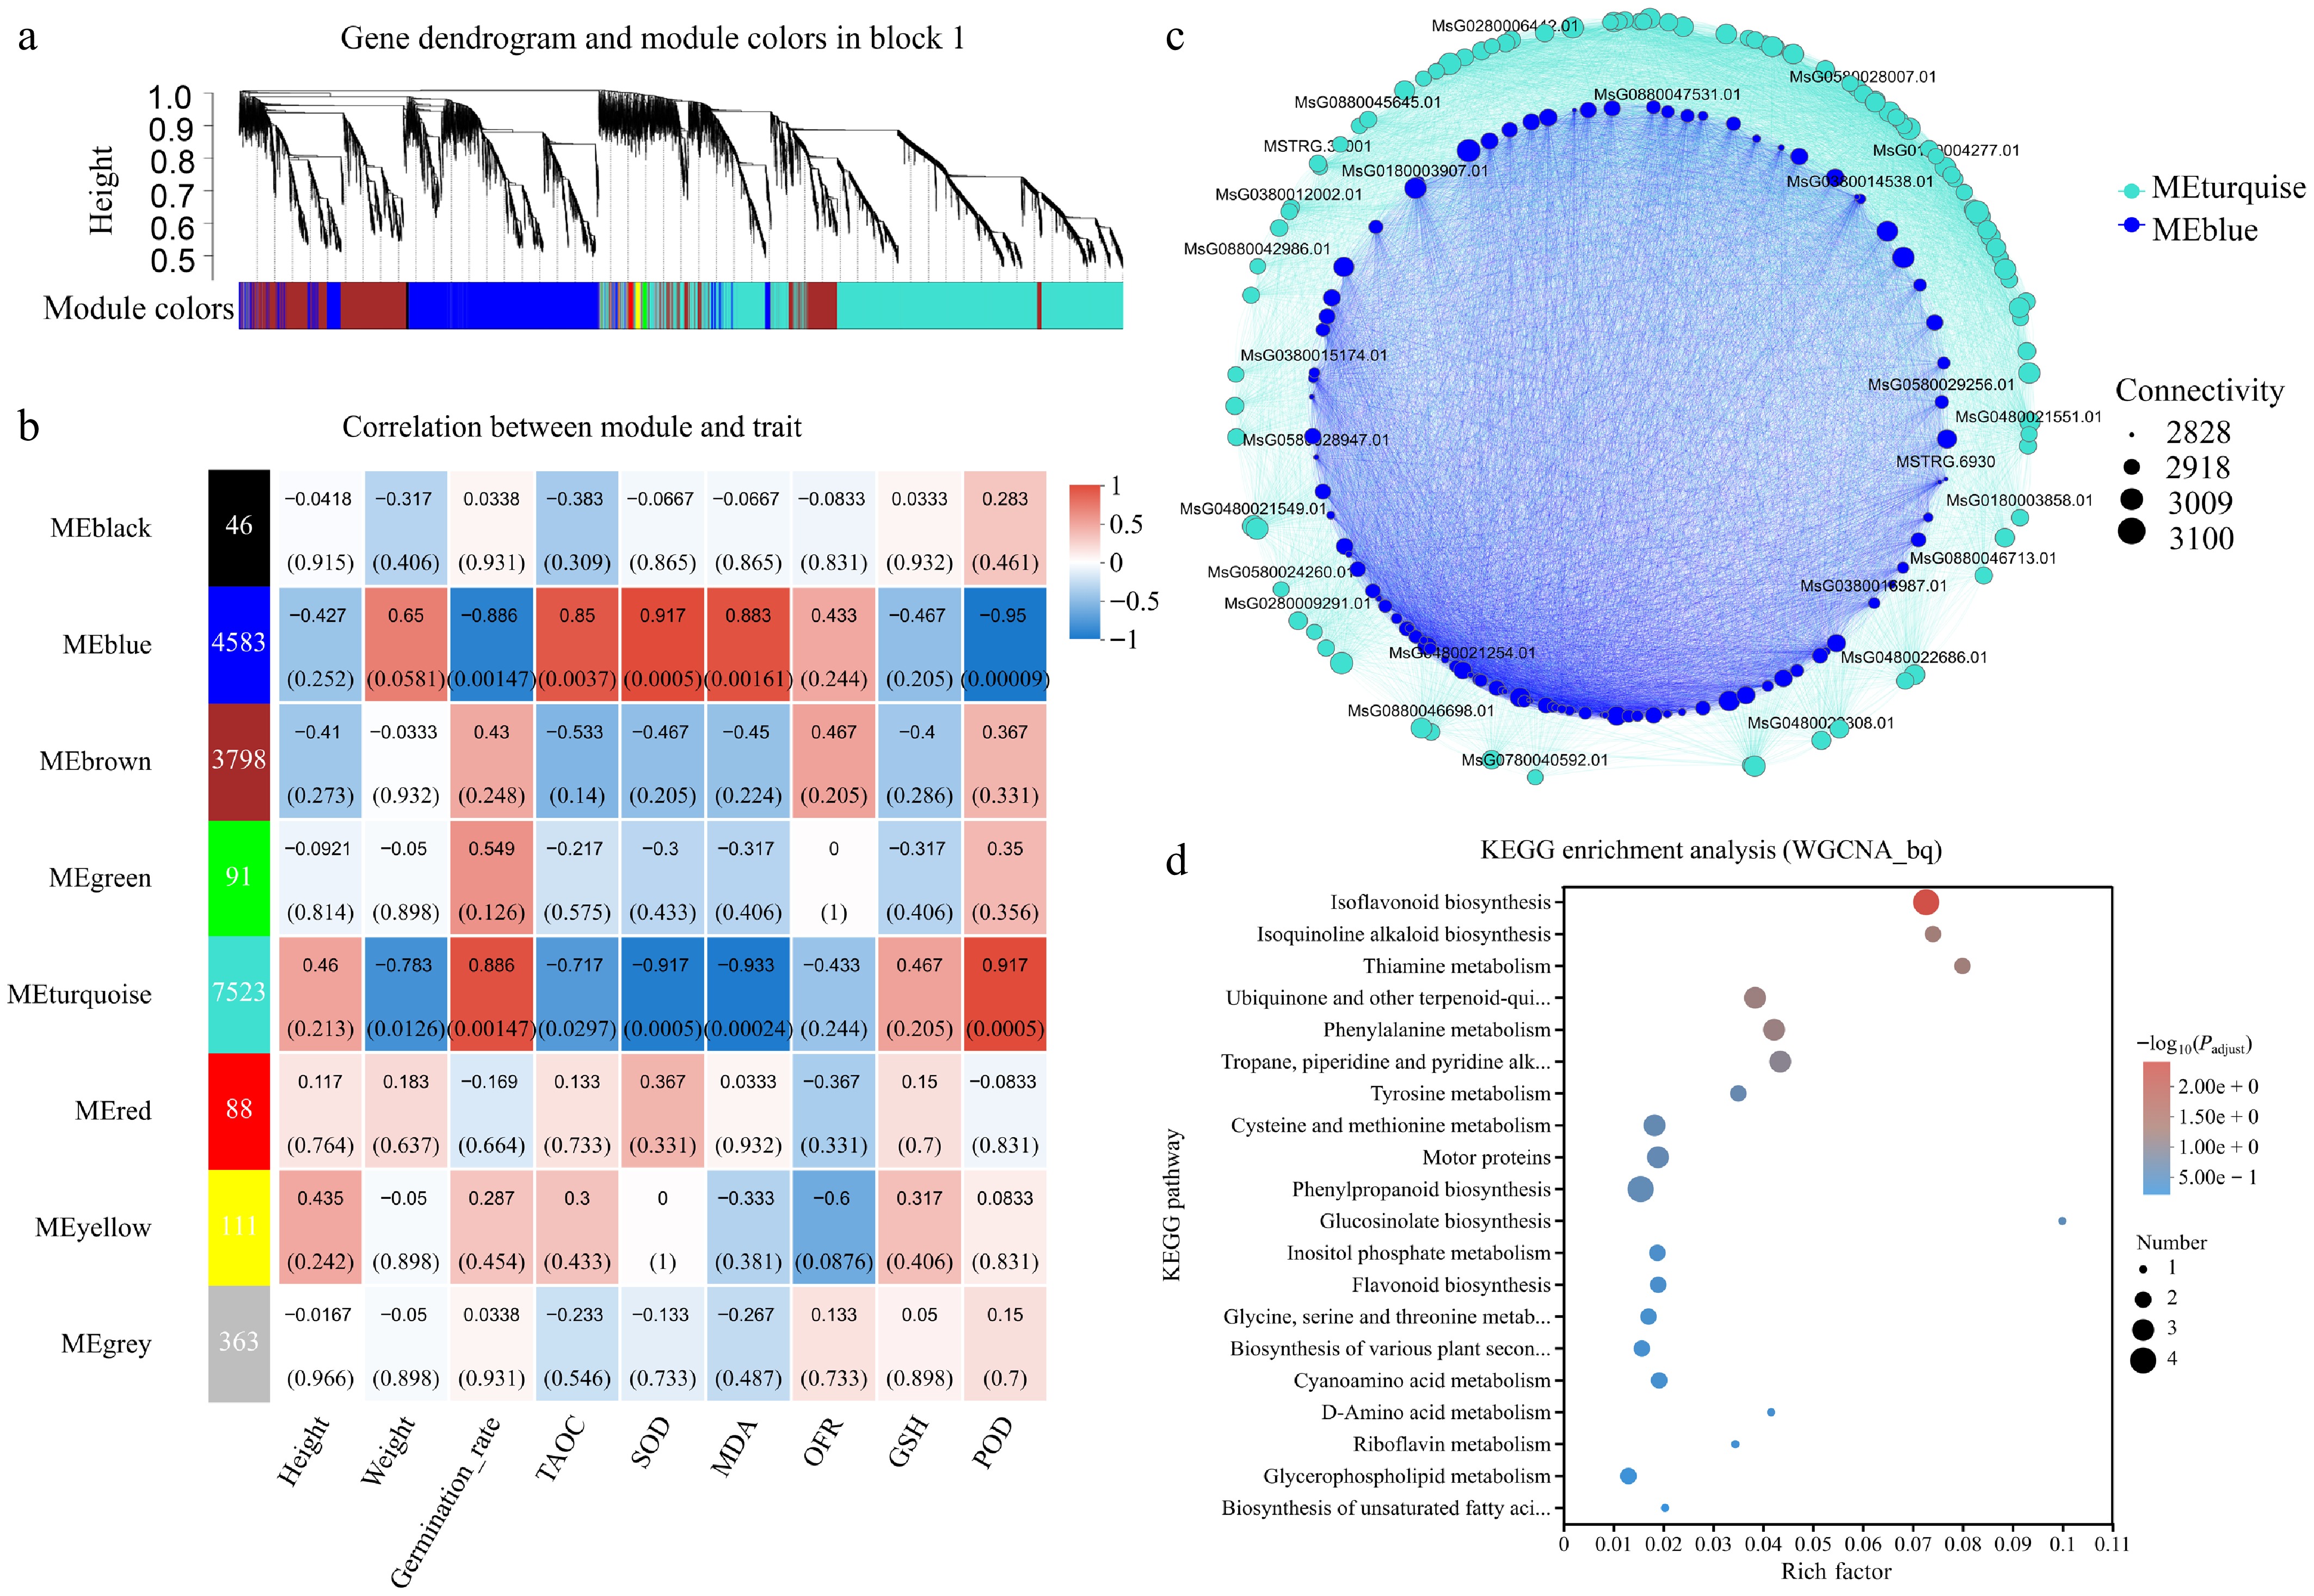
Figure 5.
WGCNA of differentially expressed genes under compound saline-alkali stress. (a) Gene hierarchical clustering dendrogram and corresponding module color assignment. The y-axis represents clustering height, and the color bar underneath distinguishes distinct co-expression modules. (b) Heatmap illustrating Pearson correlations between module eigengenes and seedling physiological traits. The left column lists each module name and its total gene number. Physiological traits along the x-axis include seedling height, fresh weight, germination rate, T-AOC, SOD activity, superoxide anion (O2−), reduced glutathione (GSH), malondialdehyde (MDA), and POD activity. Color intensity denotes the correlation coefficient, and values in parentheses indicate the significance p-value of the correlation. (c) Co-expression interaction network of two core modules, MEblue (blue nodes) and MEturquoise (turquoise nodes). Node size corresponds to gene connectivity, reflecting hub gene status in the network. (d) Bubble plot of KEGG pathway enrichment for genes within core stress-responsive modules. The x-axis represents the Rich factor, bubble size indicates the number of enriched genes in each pathway, and color gradient corresponds to the adjusted p-value (padjust).
-
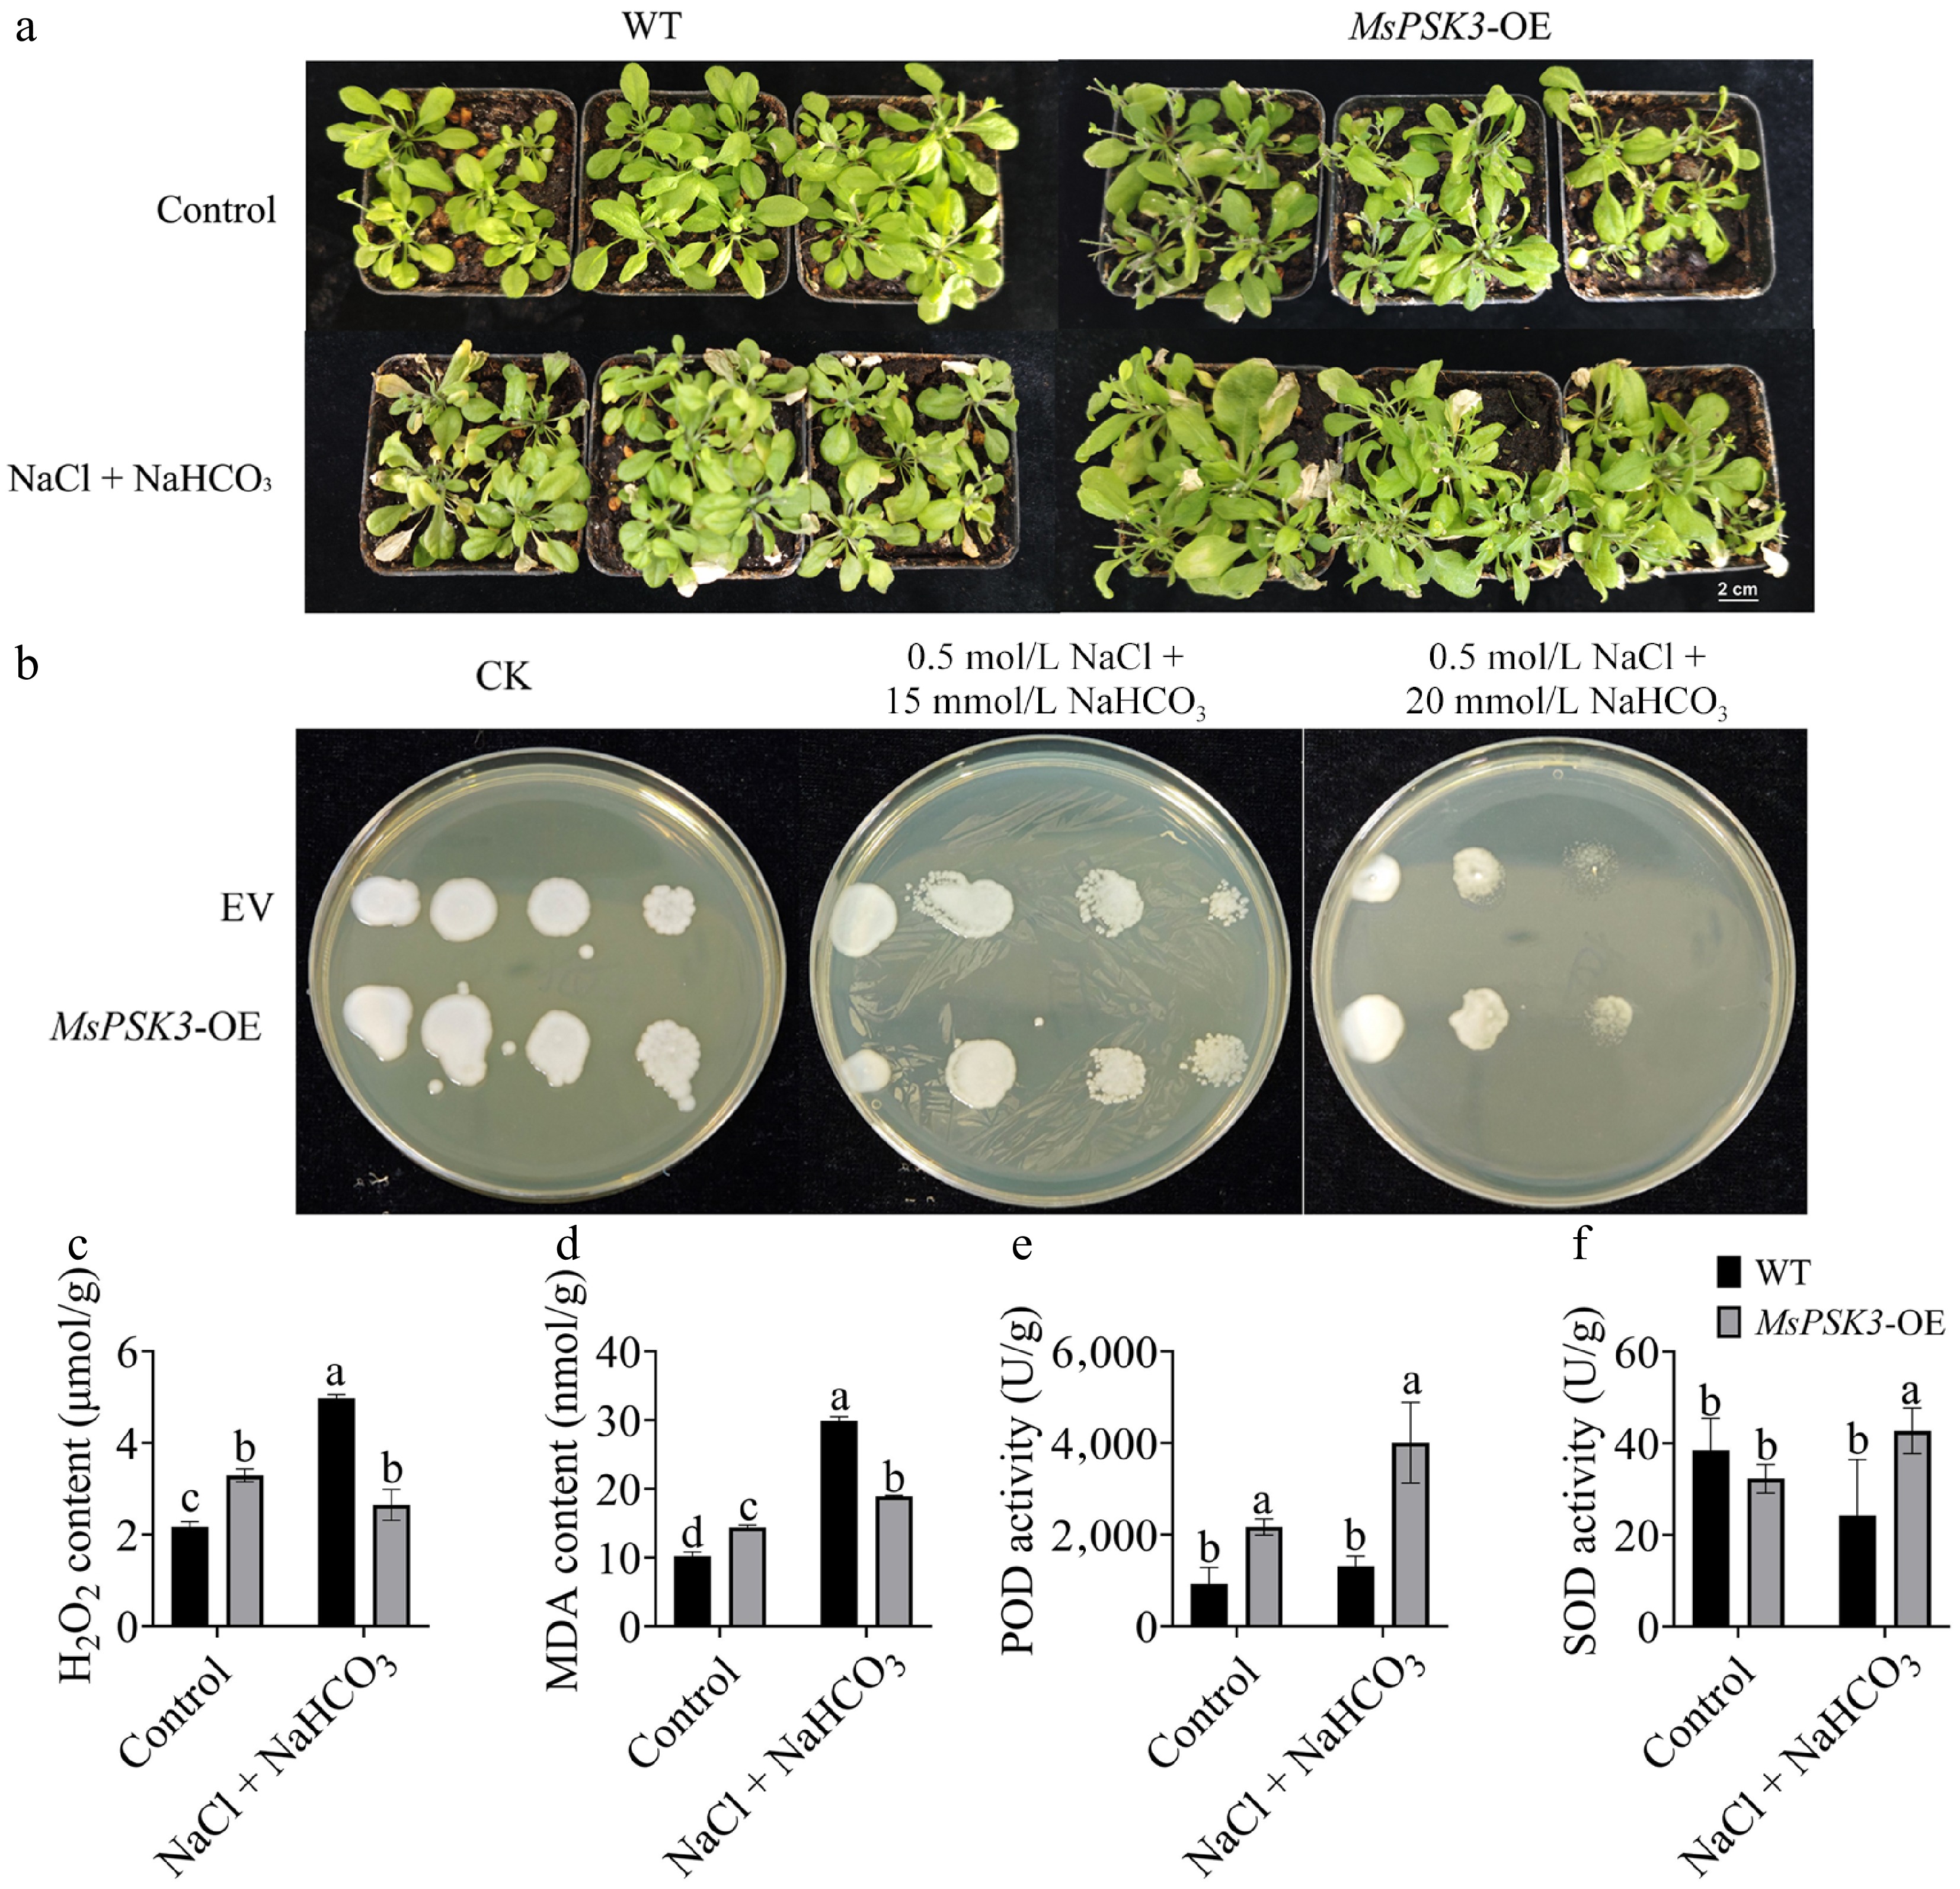
Figure 6.
Overexpression of MsPSK3 enhances saline-alkali stress tolerance in A. thaliana and P. pastoris. (a) Phenotypic comparison of wild-type (Col-0) and MsPSK3-overexpressing (MsPSK3-OE) Arabidopsis plants under control (CK) and saline-alkali (SA, 50 mmol/L NaCl + 50 mmol/L NaHCO3) treatments. Scale bar = 2 cm; (b) growth of empty vector (EV)-transformed and MsPSK3-overexpressing (PSK3-OE) P. pastoris on LB medium supplemented with 0.5 mol/L NaCl plus 0, 15, or 20 mmol/L NaHCO3. Scale bar = 2 cm; (c) hydrogen peroxide (H2O2) content; (d) malondialdehyde (MDA) content; (e) peroxidase (POD) activity; (f) superoxide dismutase (SOD) activity. Values are presented as mean ± standard error (SE, n = 3). Different lowercase letters indicate significant differences (p < 0.05) between groups.
-
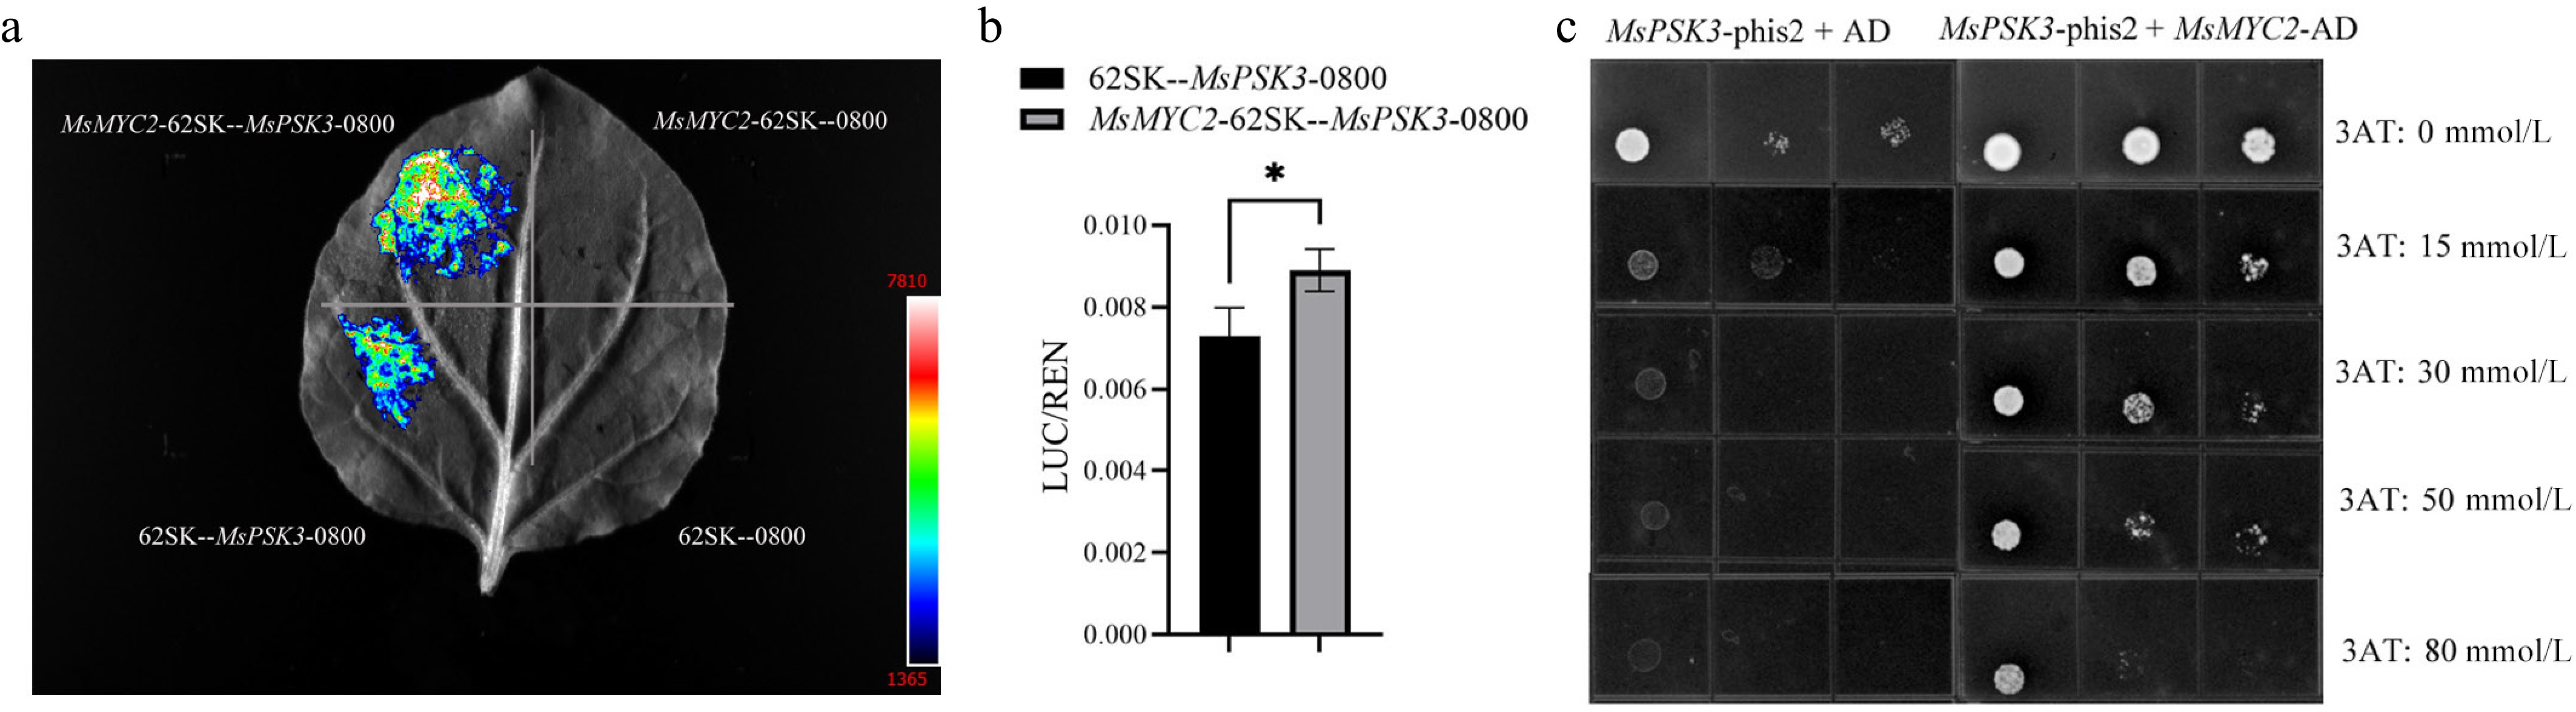
Figure 7.
Transcriptional activation and protein interaction analysis of MsPSK3 with transcription factor MYC2. (a) In vivo luminescence imaging of firefly luciferase (LUC) activity in tobacco leaves co-infiltrated with the proMsPSK3: LUC reporter and 35S: MYC2 effector plasmids. Luminescence intensity is represented by a color gradient ranging from blue (low luminescence) to red (high luminescence). 62-SK refers to the empty pGreen II 62-SK vector, and 0800 corresponds to the empty pGreen II 0800-LUC vector. (b) Quantitative determination of the LUC/REN ratio via dual-luciferase reporter assays. Data are presented as mean ± SE (n = 3); asterisks denote significant differences at p < 0.05 according to Student's t-test. (c) Yeast one-hybrid (Y1H) analysis confirming the physical interaction between MYC2 and the MsPSK3 promoter. Transformed yeast strains were cultured on selective SD/-Leu/-His medium supplemented with a concentration gradient of 3-amino-1,2,4-triazole (3AT; 0−80 mmol/L). The combination of PSK3-phis2 + AD was set as the negative control, whereas PSK3-phis2 + MYC2-AD was the experimental group. phis2 and AD indicate the phis2 and pGADT7 vectors, respectively. From left to right, yeast suspensions in each spot were serially diluted at 10-, 100-, and 1,000-fold.
Figures
(7)
Tables
(0)