-
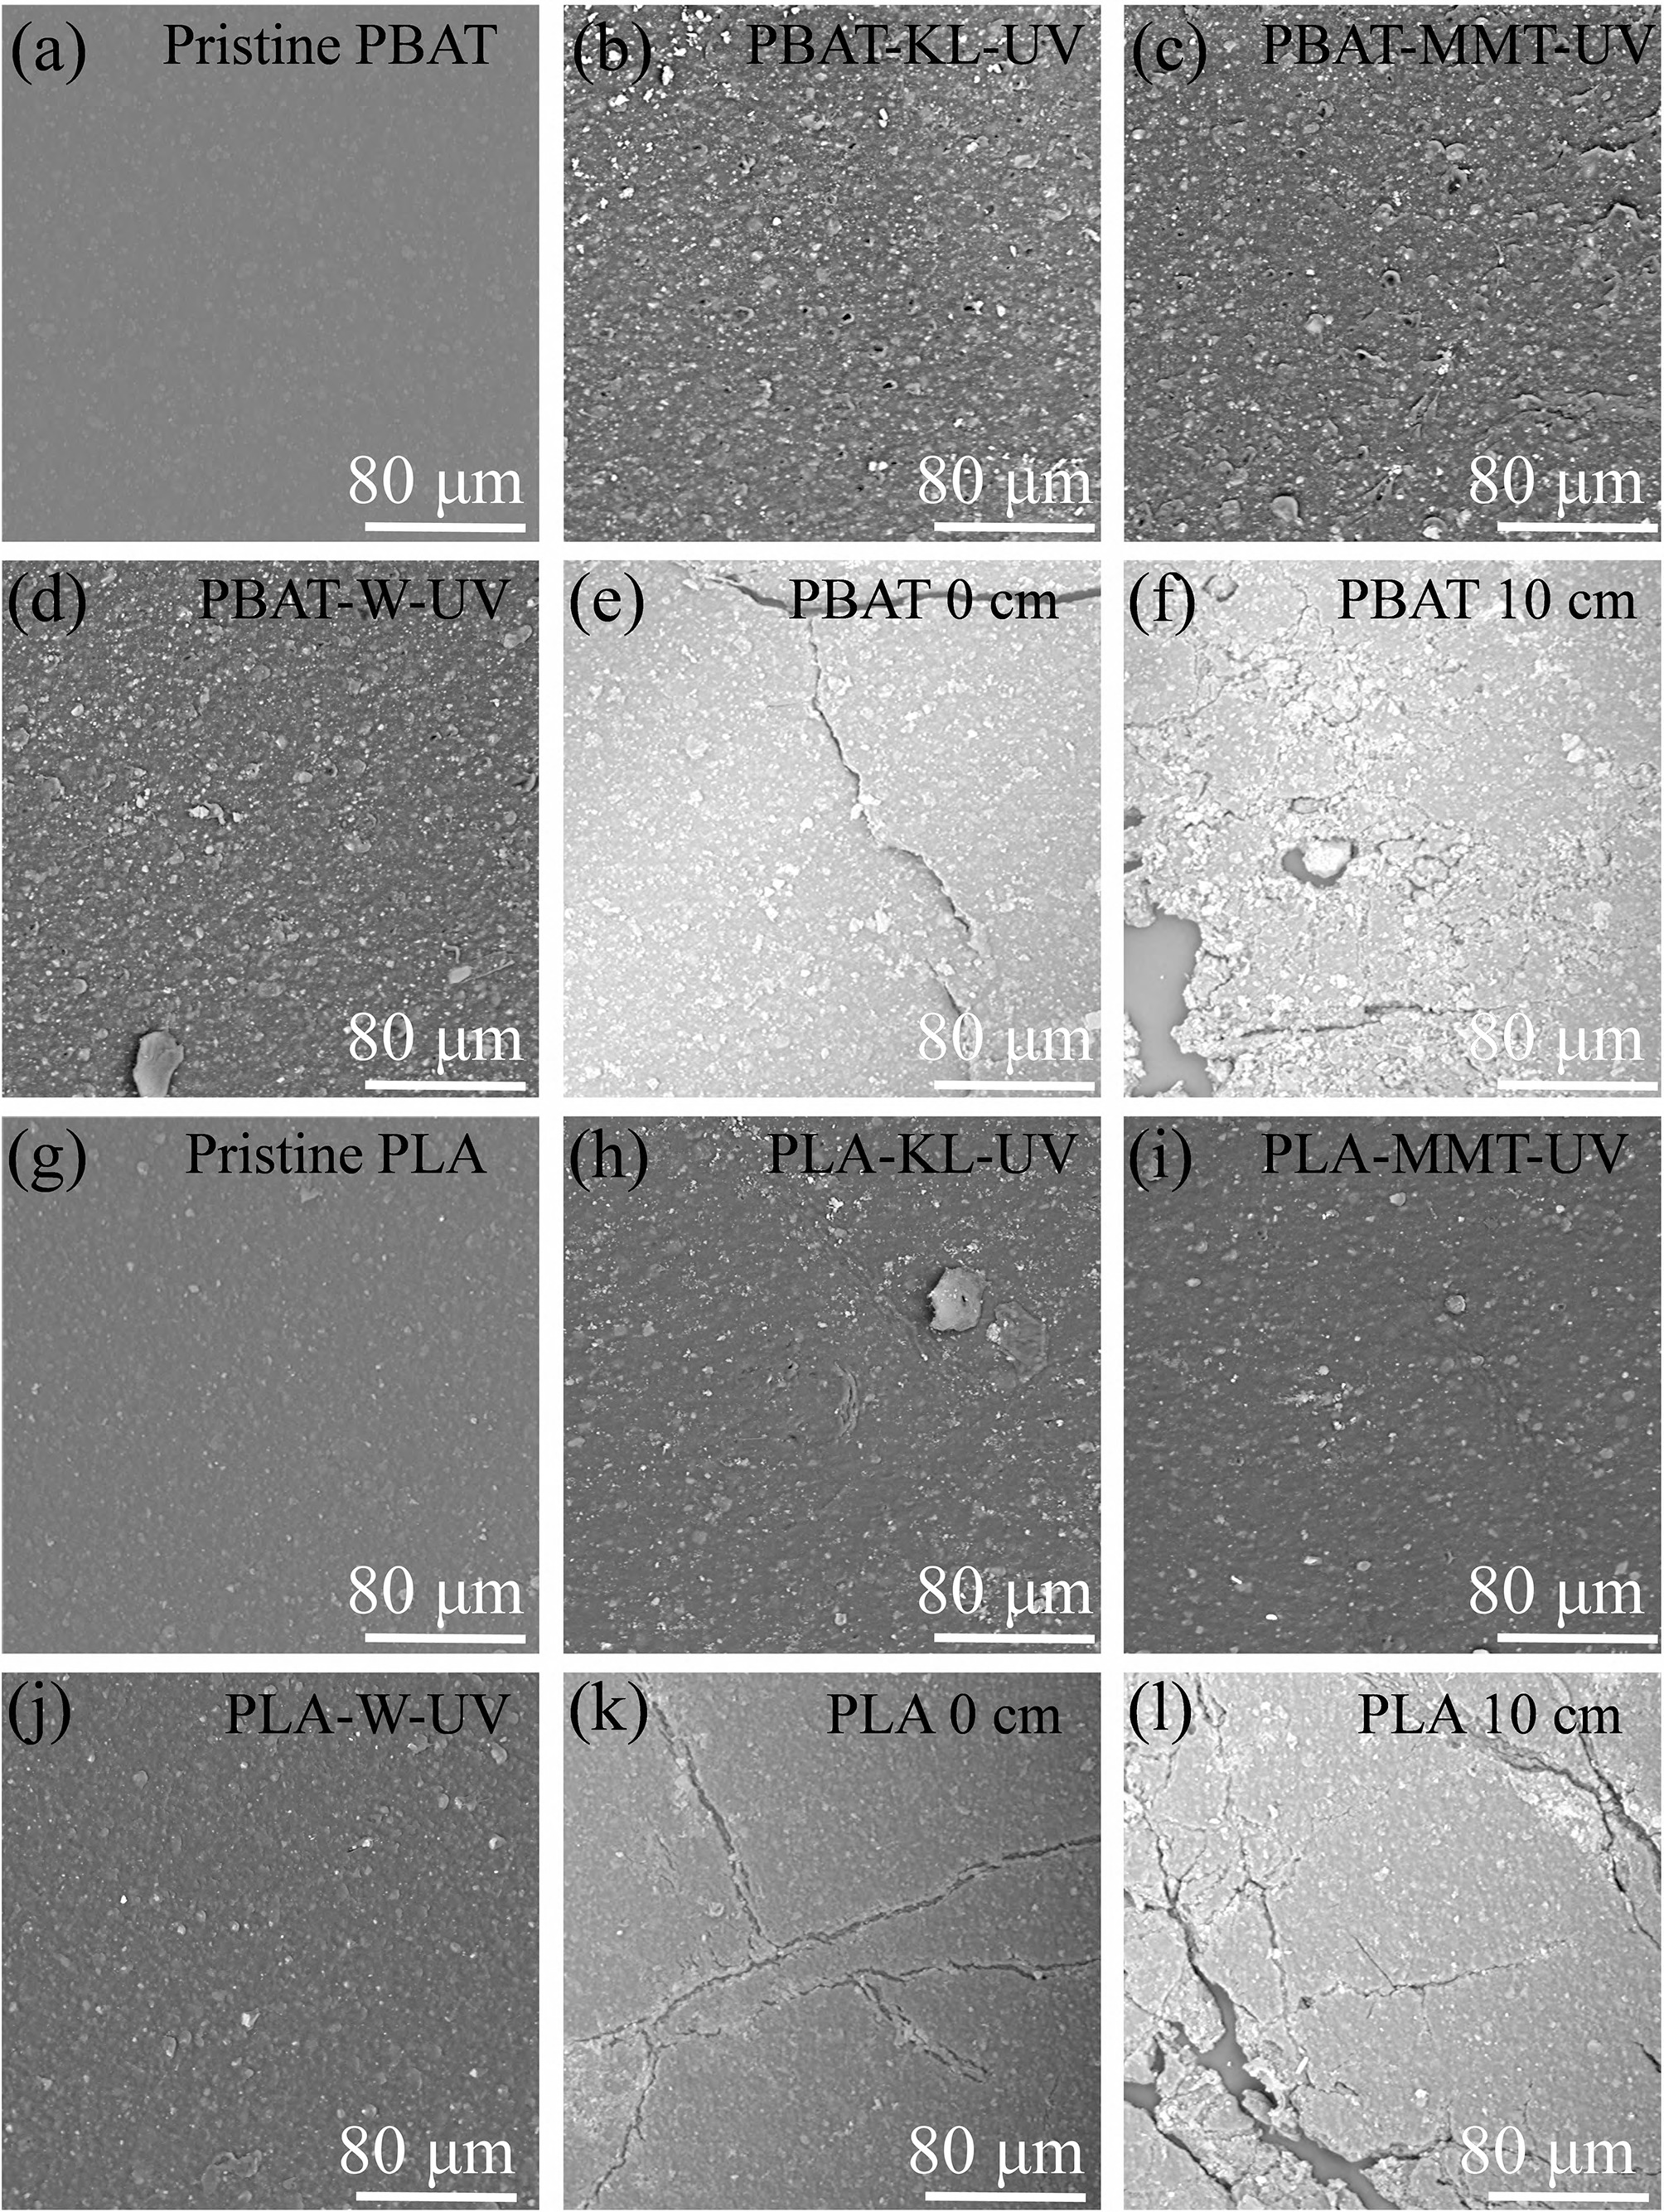
Figure 1.
SEM image of BDM degradation: (a)–(f) PBAT; (g)–(l) PLA.
-
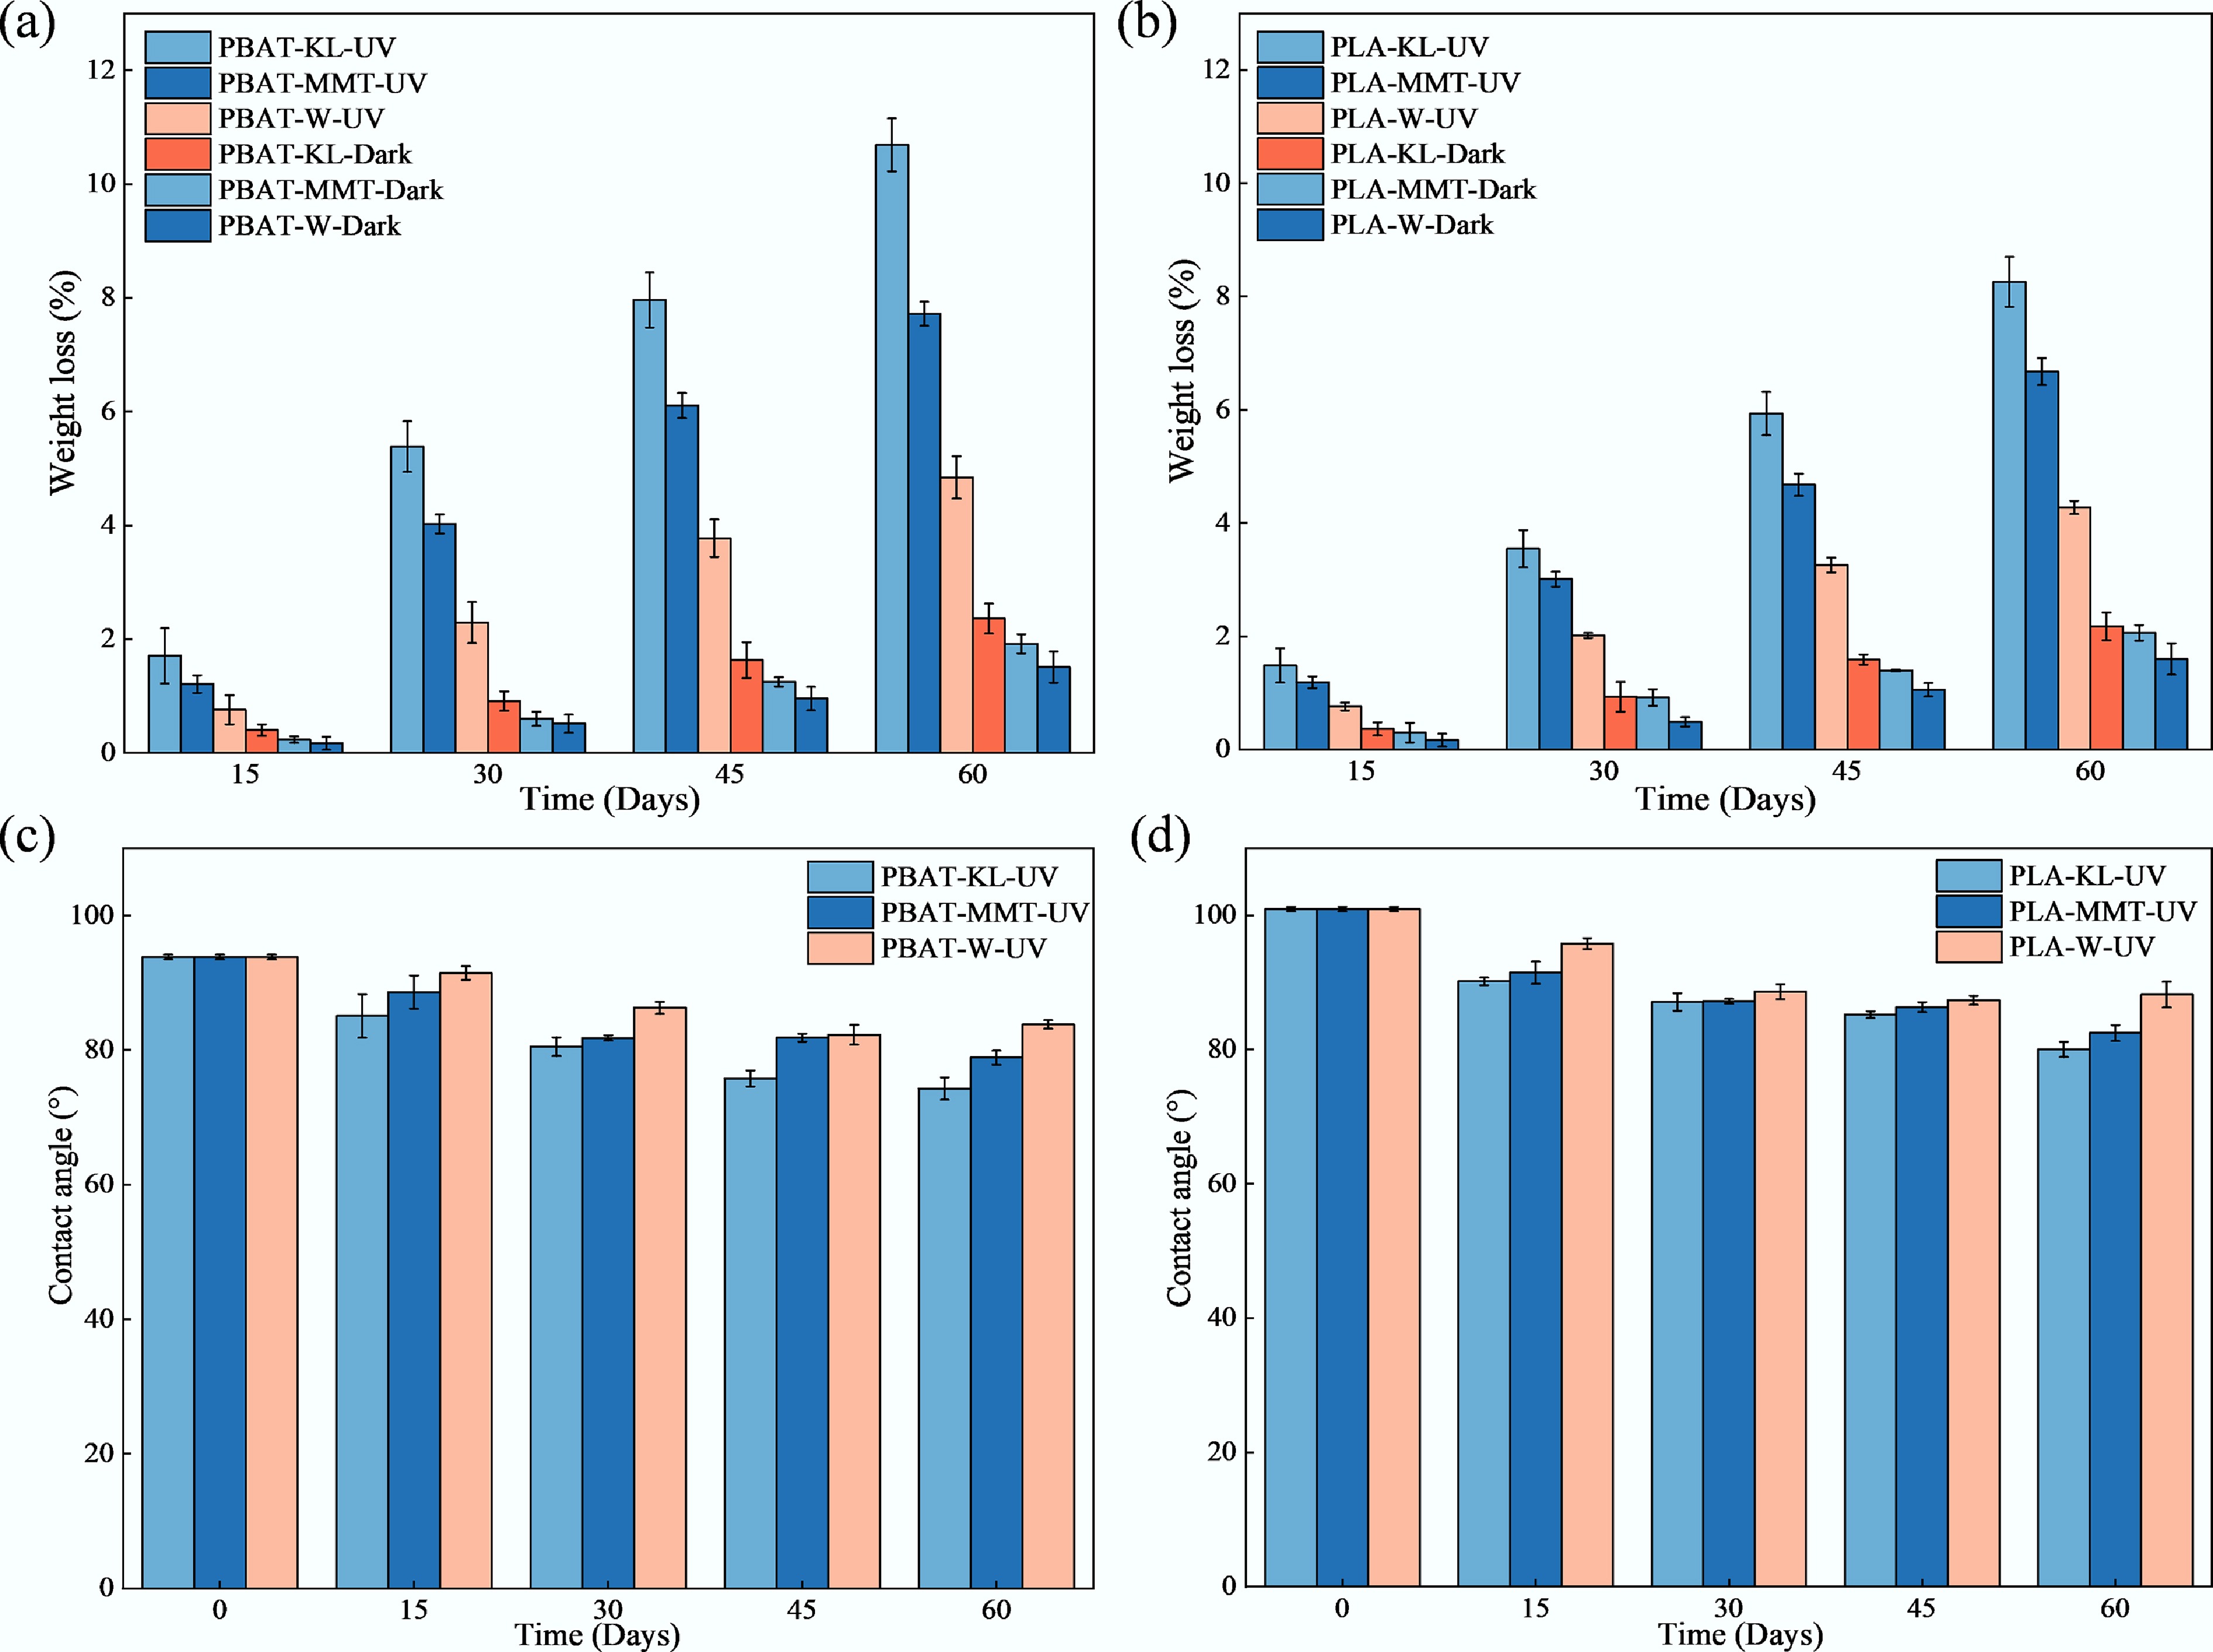
Figure 2.
Weight loss of (a) PBAT and (b) PLA. Water contact angle of (c) PBAT and (d) PLA.
-
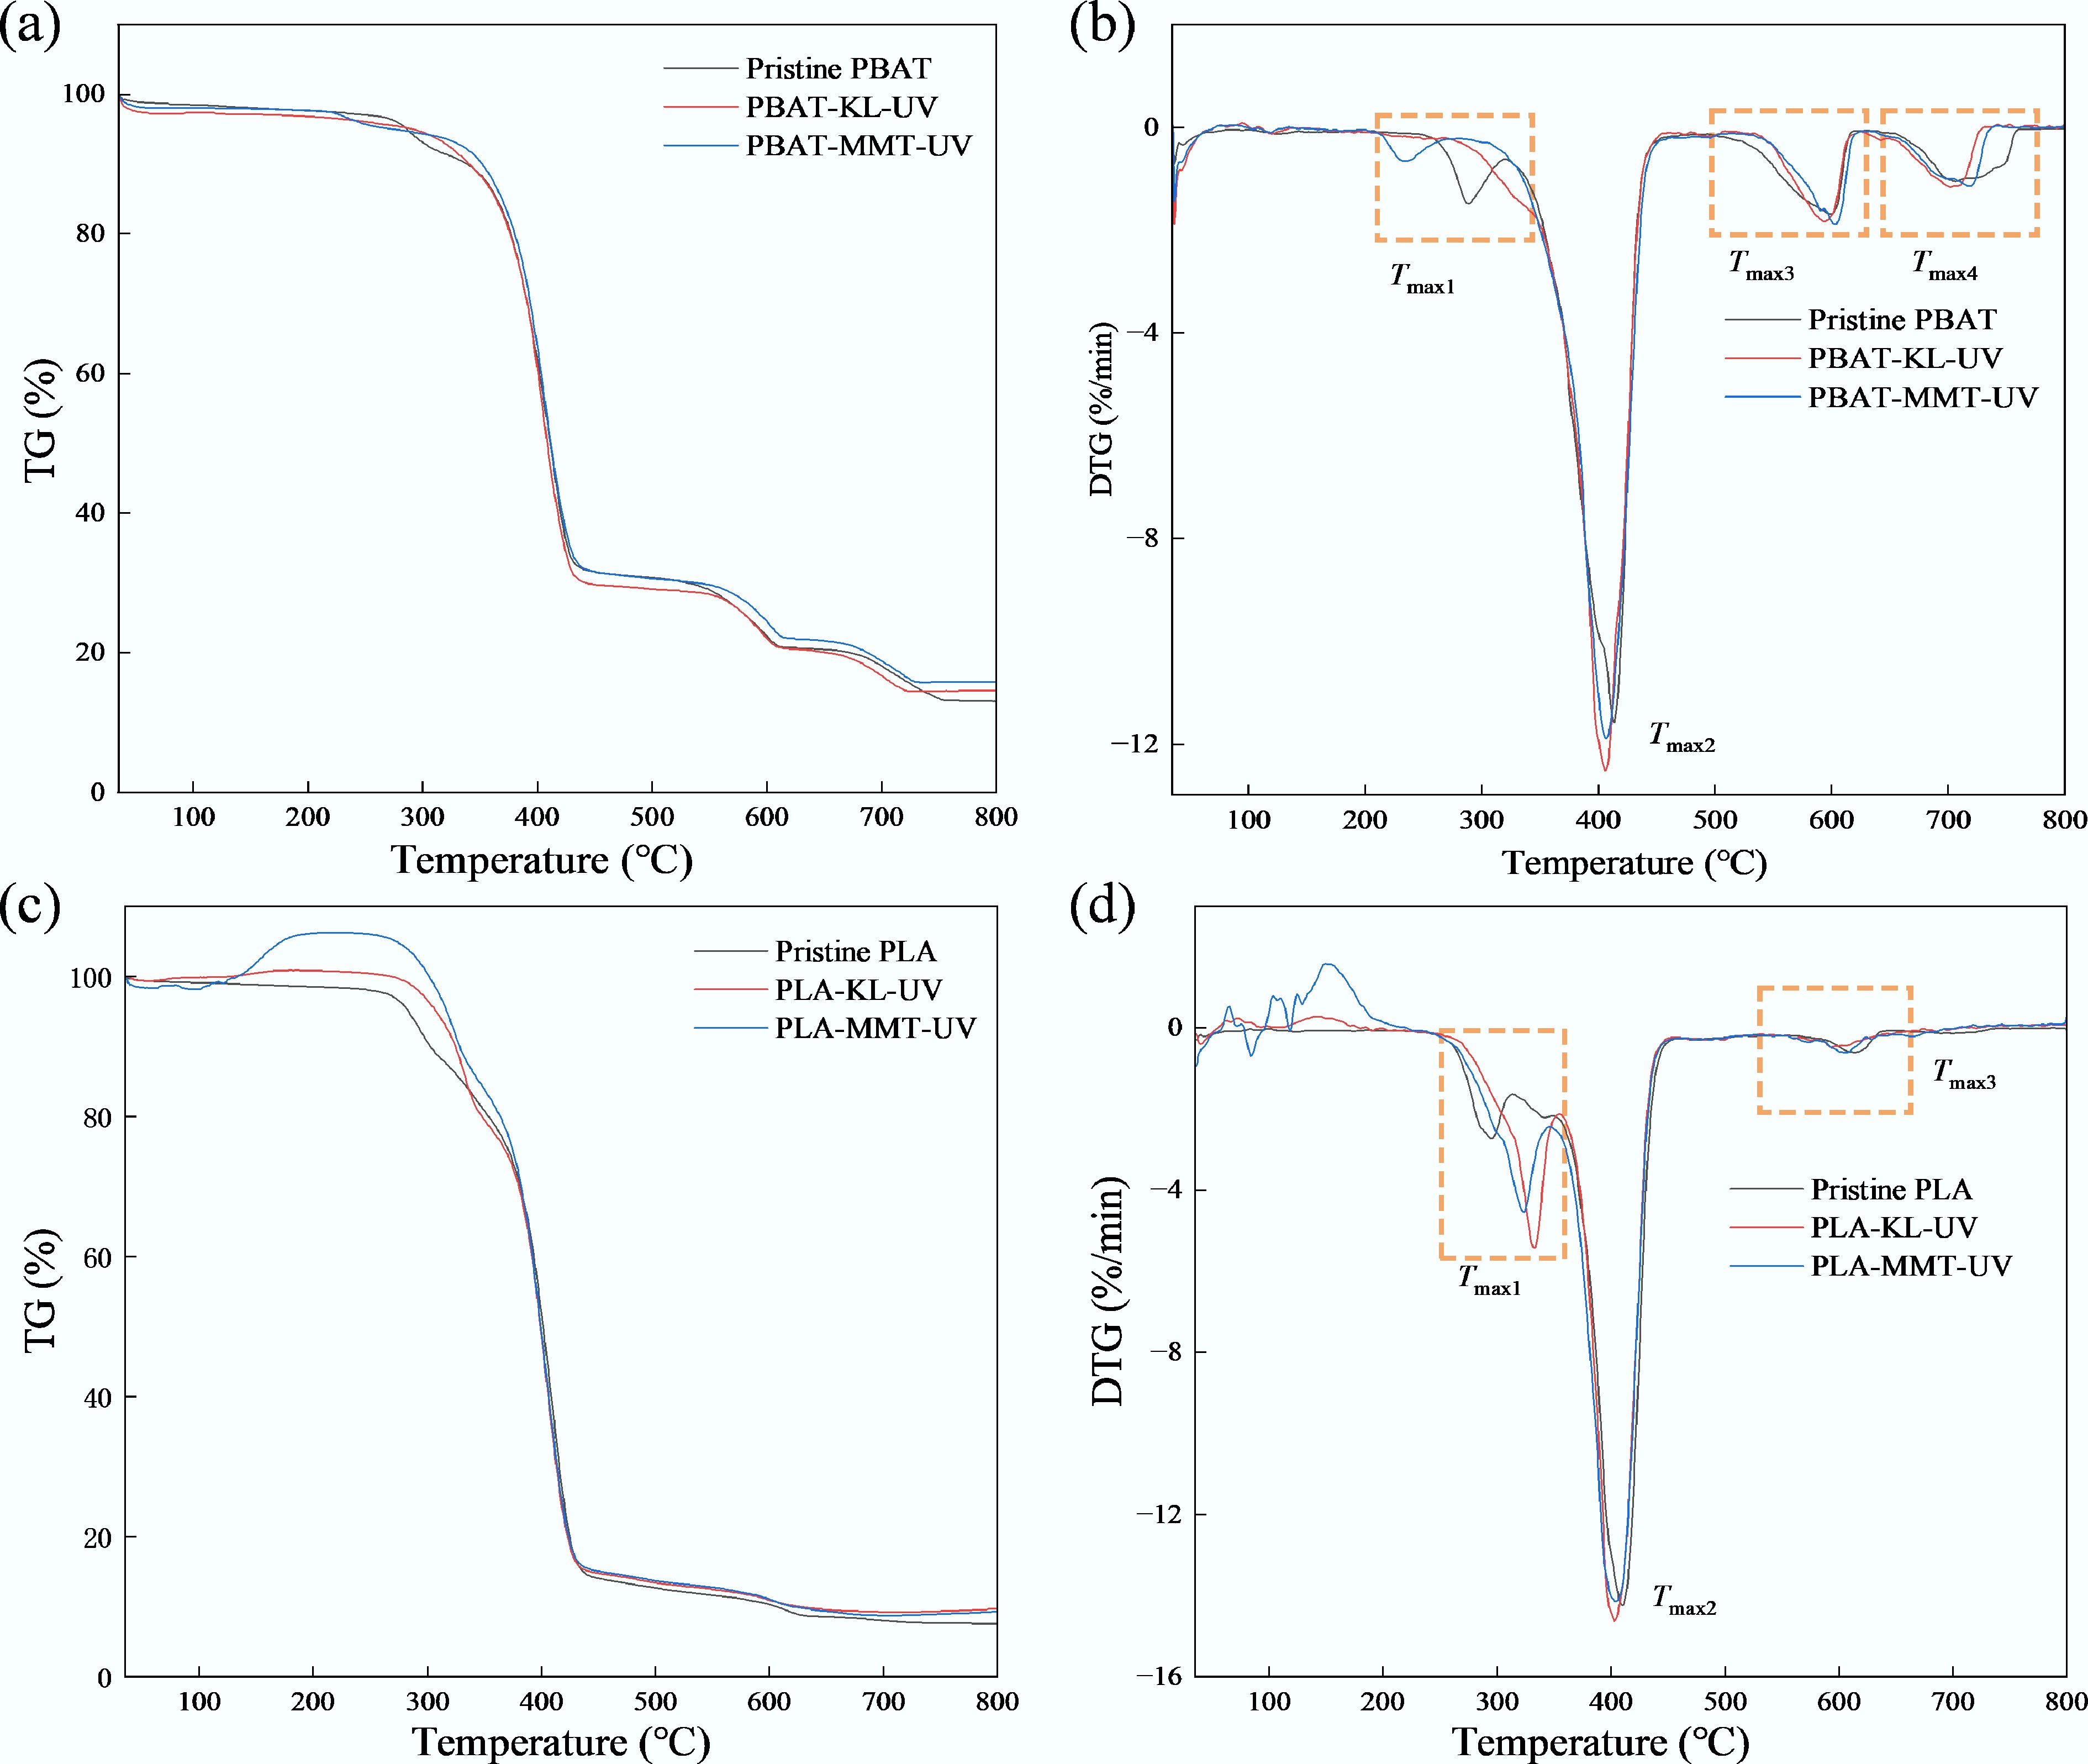
Figure 3.
TG and DTG curves of BDM: (a) TG and (b)DTG curves of PBAT; (c) TG and (d) DTG curves of PLA.
-
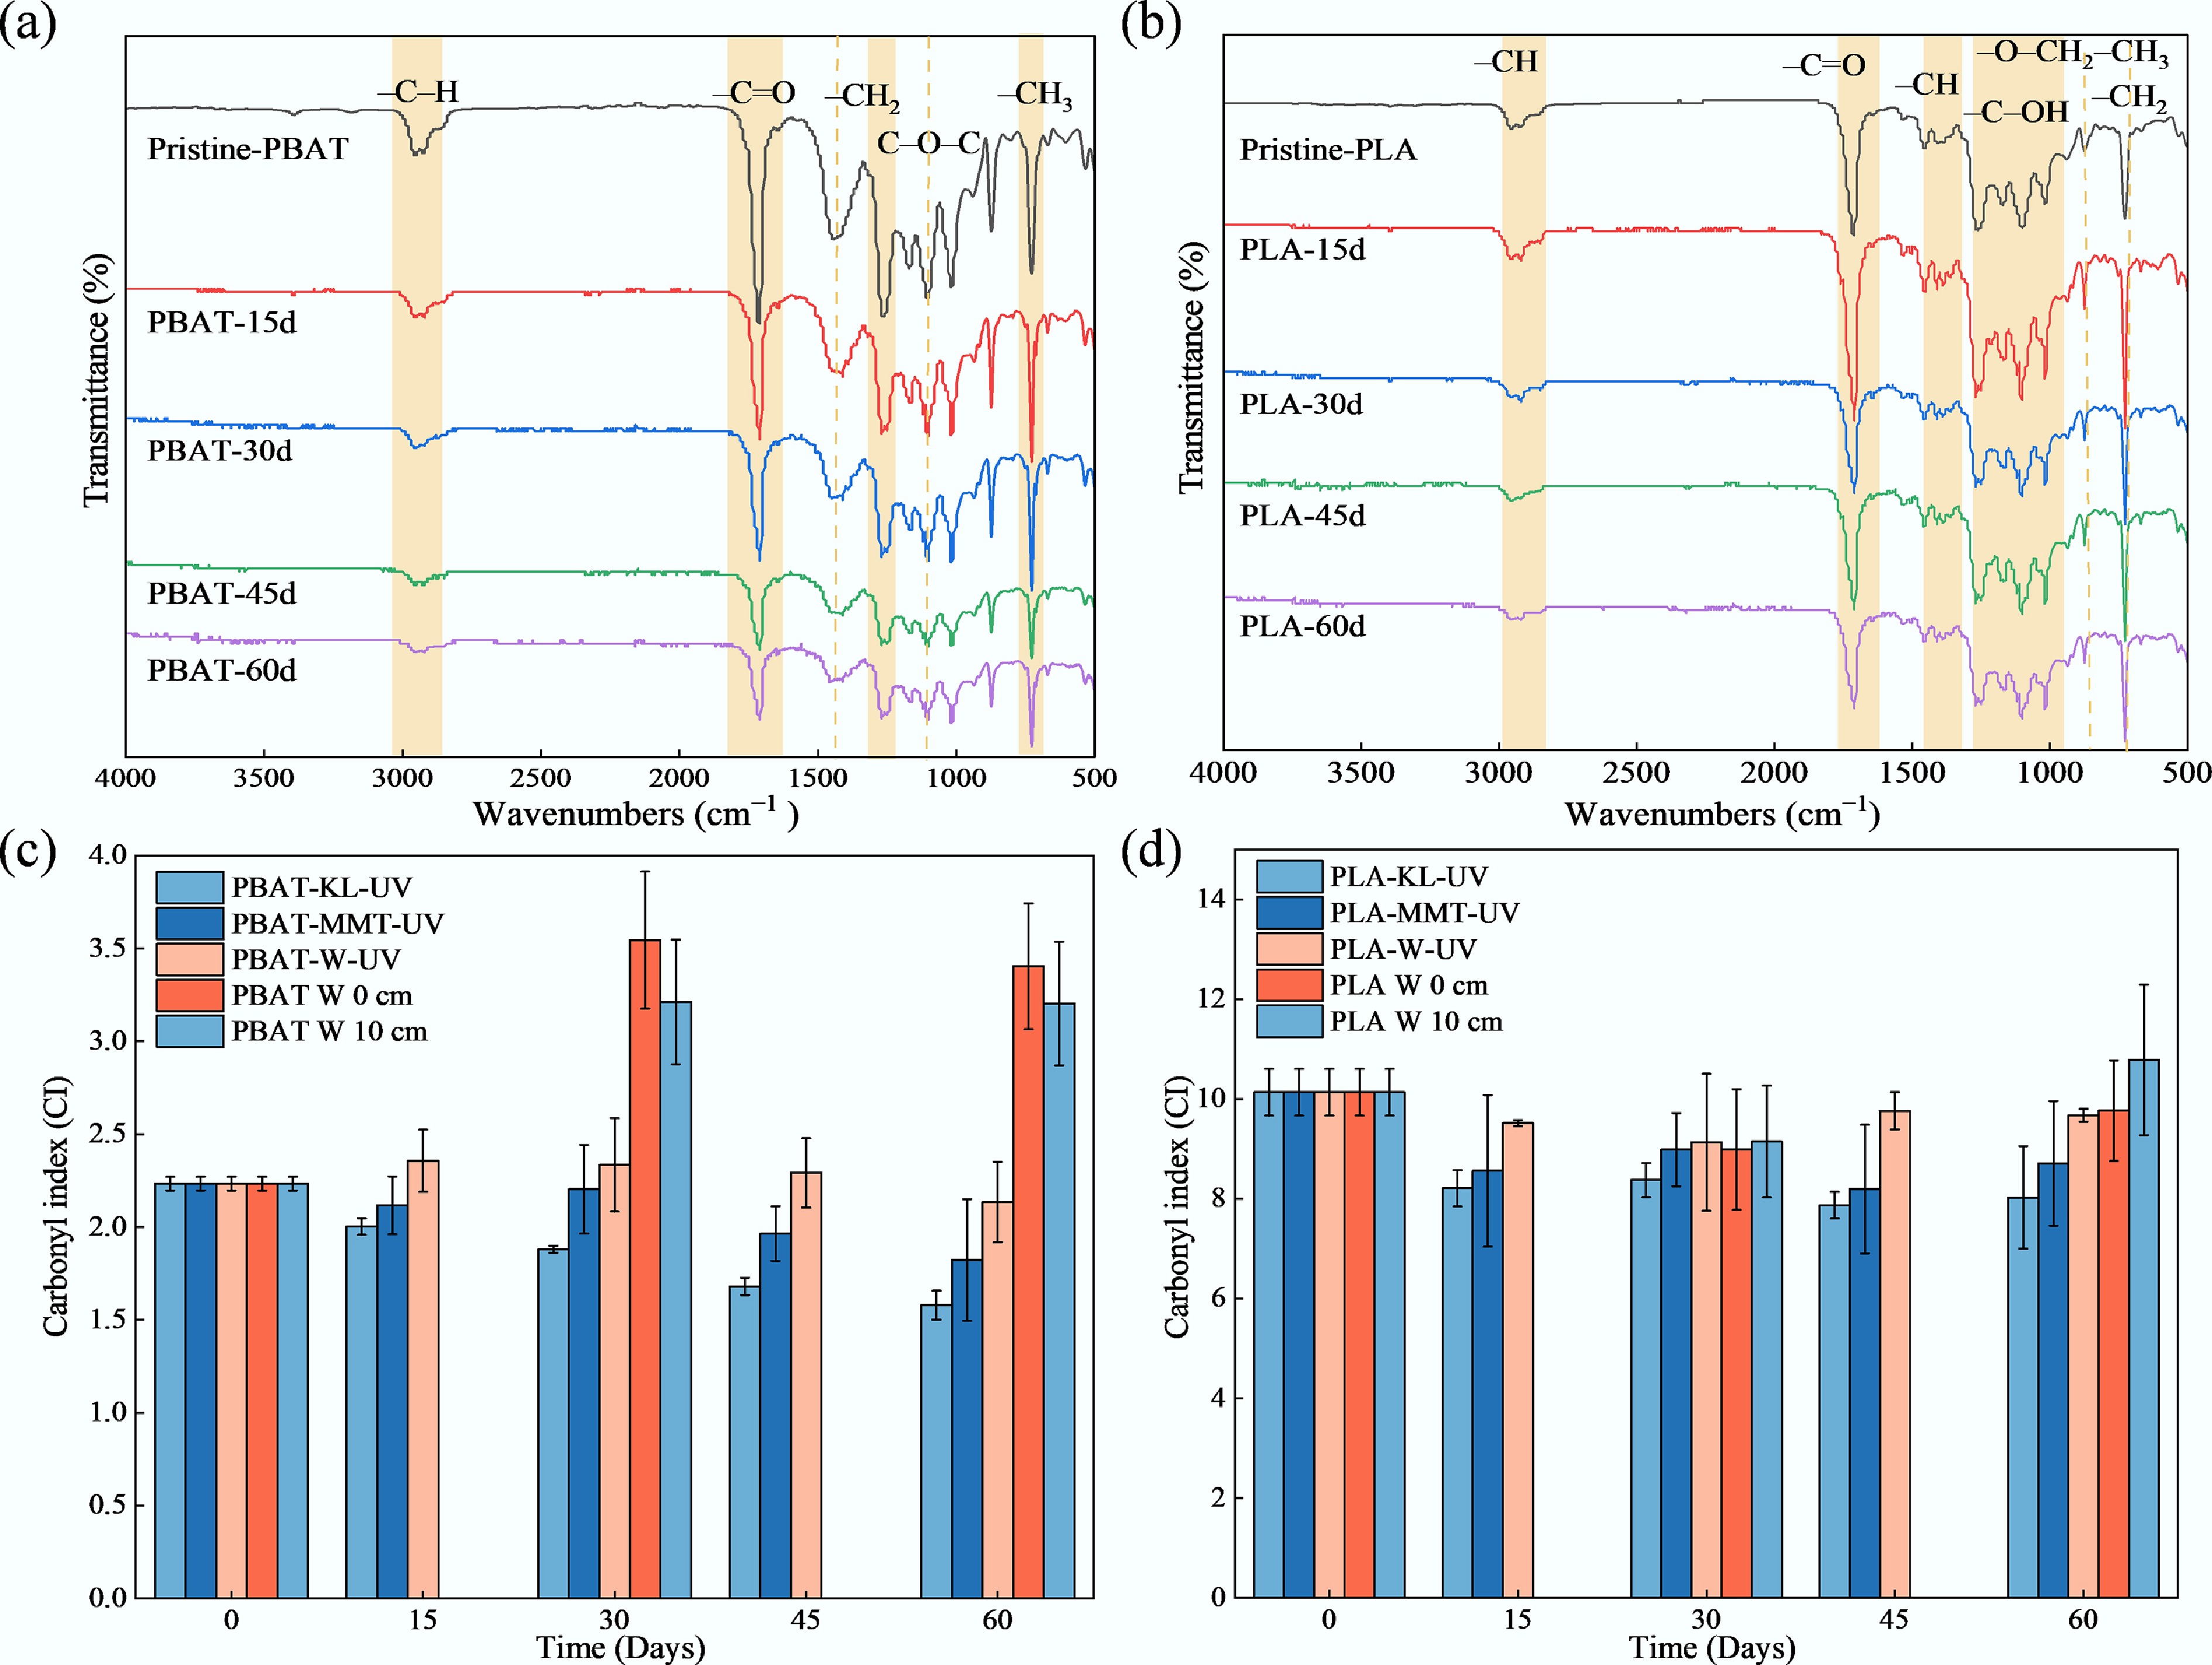
Figure 4.
ATR-FTIR spectra of (a) PBAT and (b) PLA in KL; carbonyl index of (c) PBAT and (d) PLA.
-
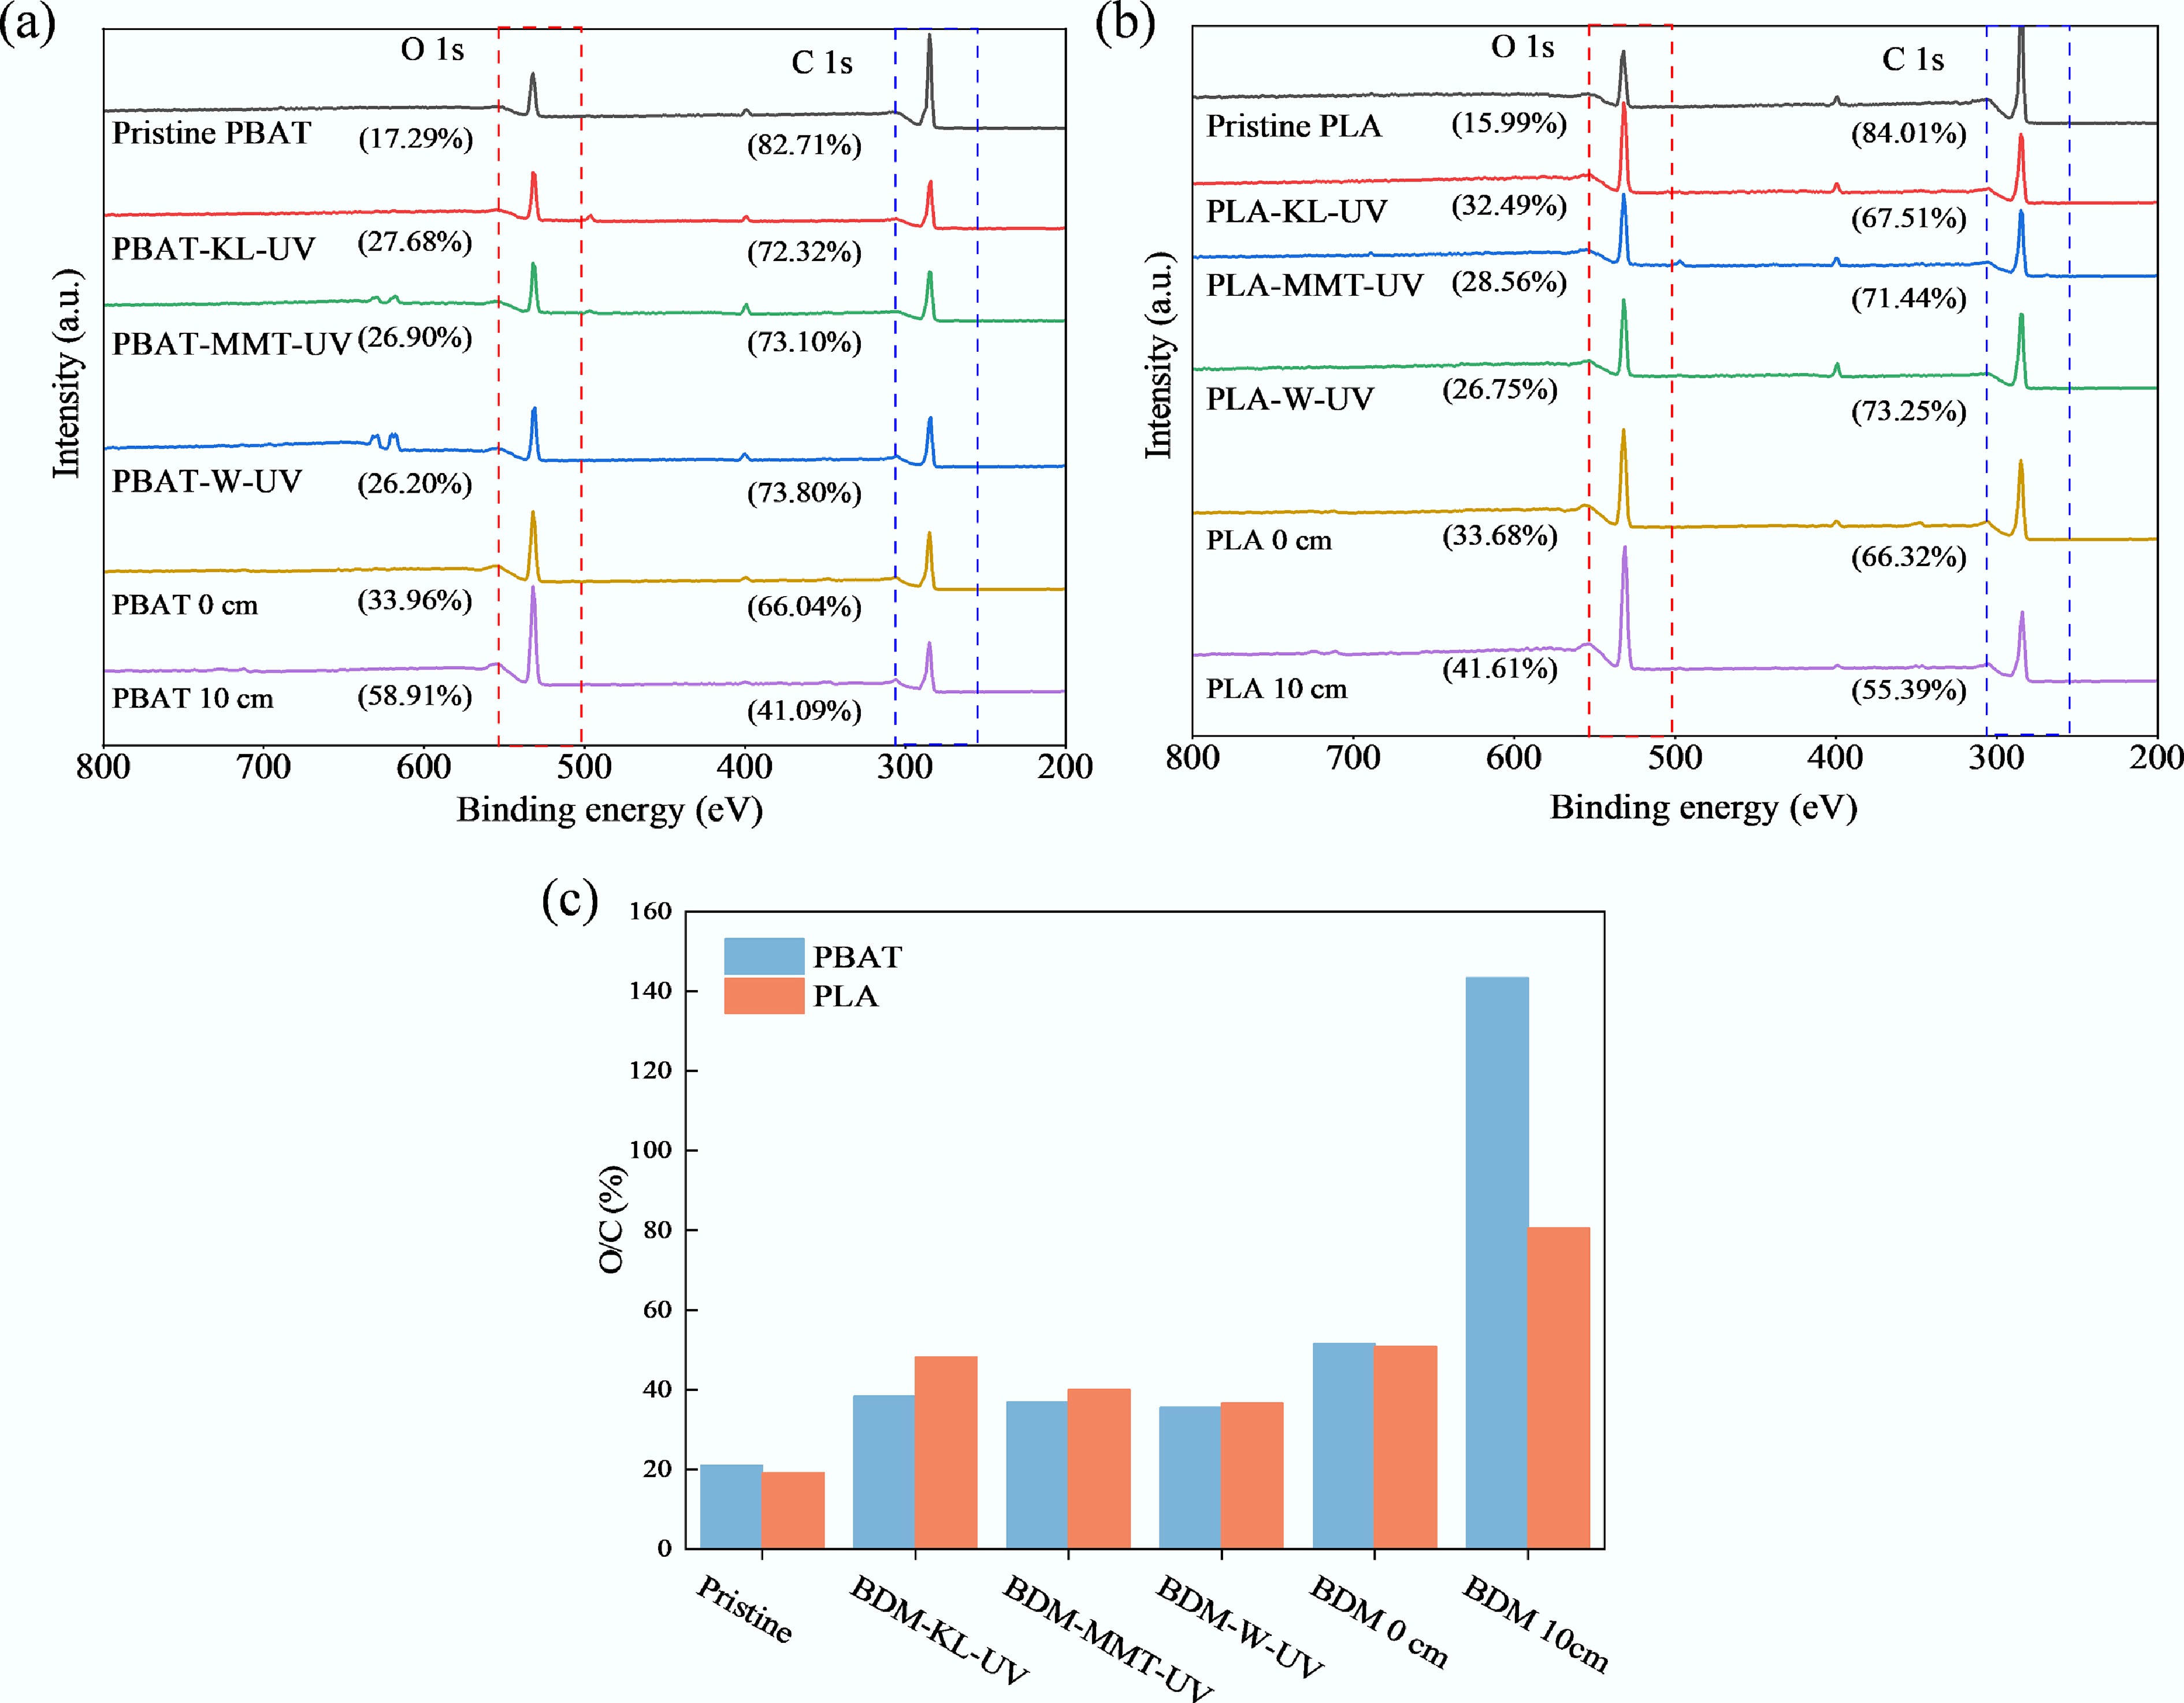
Figure 5.
(a), (b) XPS full spectrum of BDM. (c) O/C of PBAT and PLA.
-
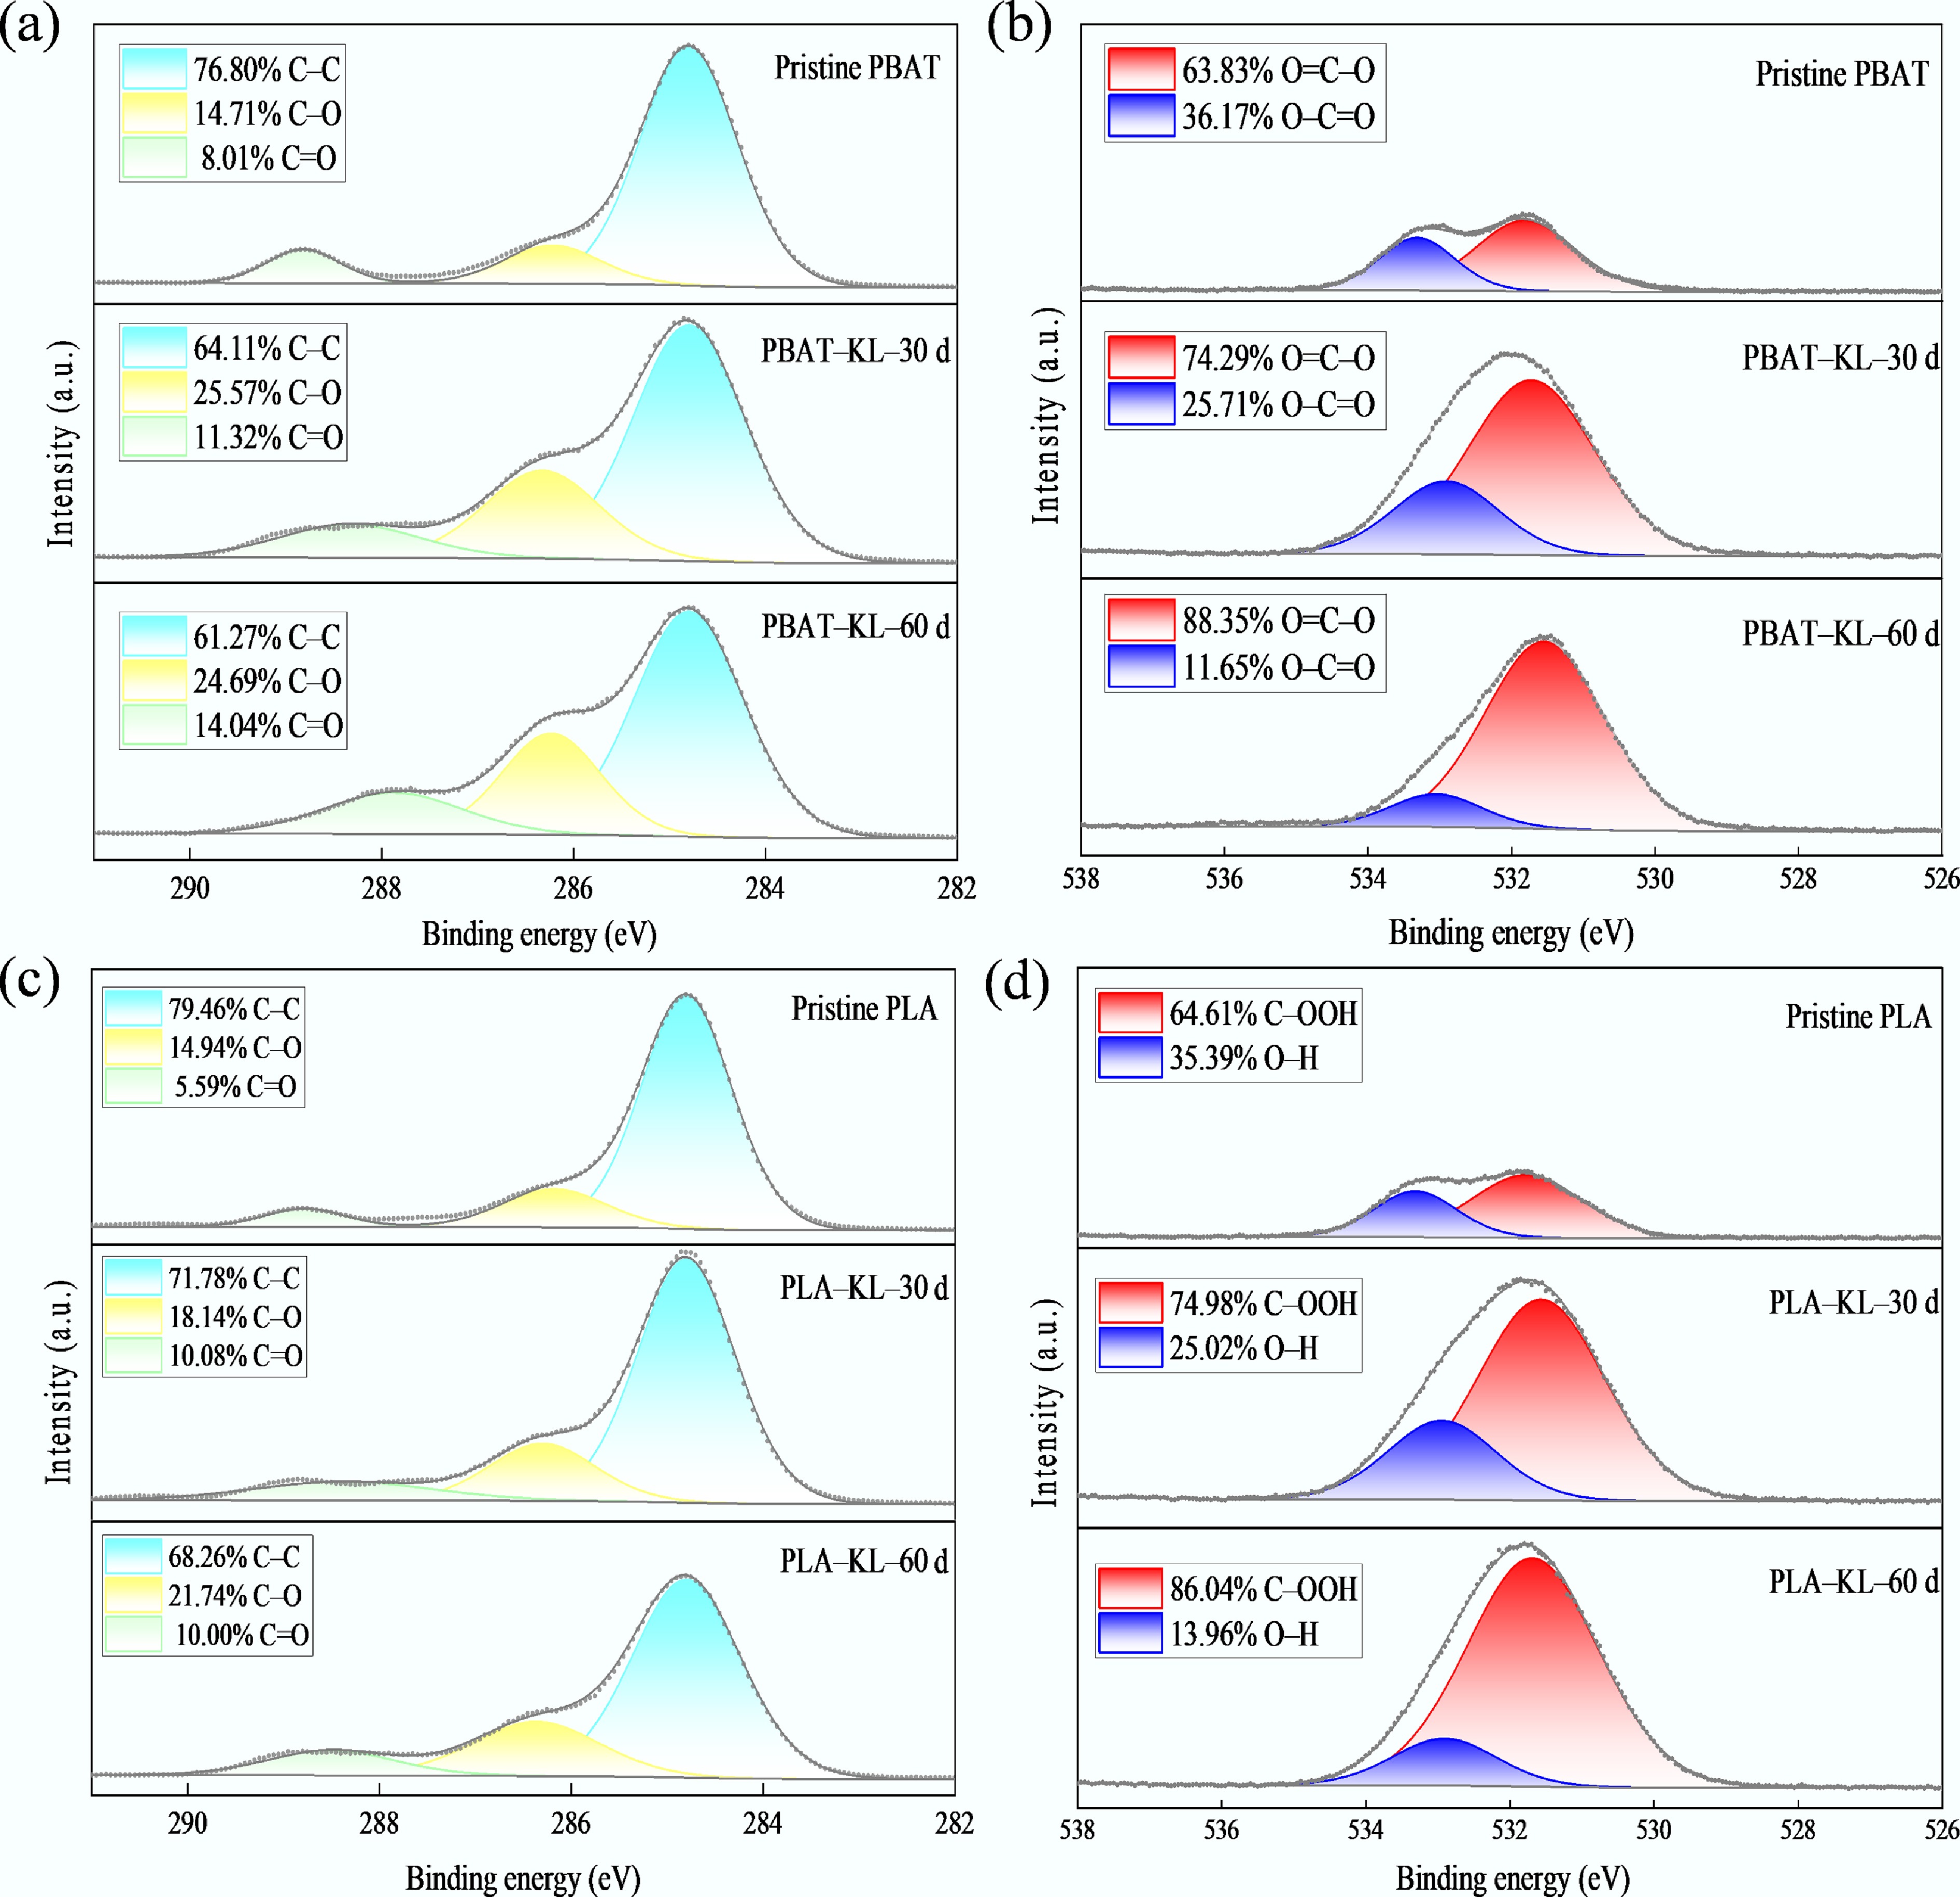
Figure 6.
High-resolution XPS spectroscopy regional spectra for C 1s and O 1s of (a), (b) PBAT, and (c), (d) PLA, in KL.
-
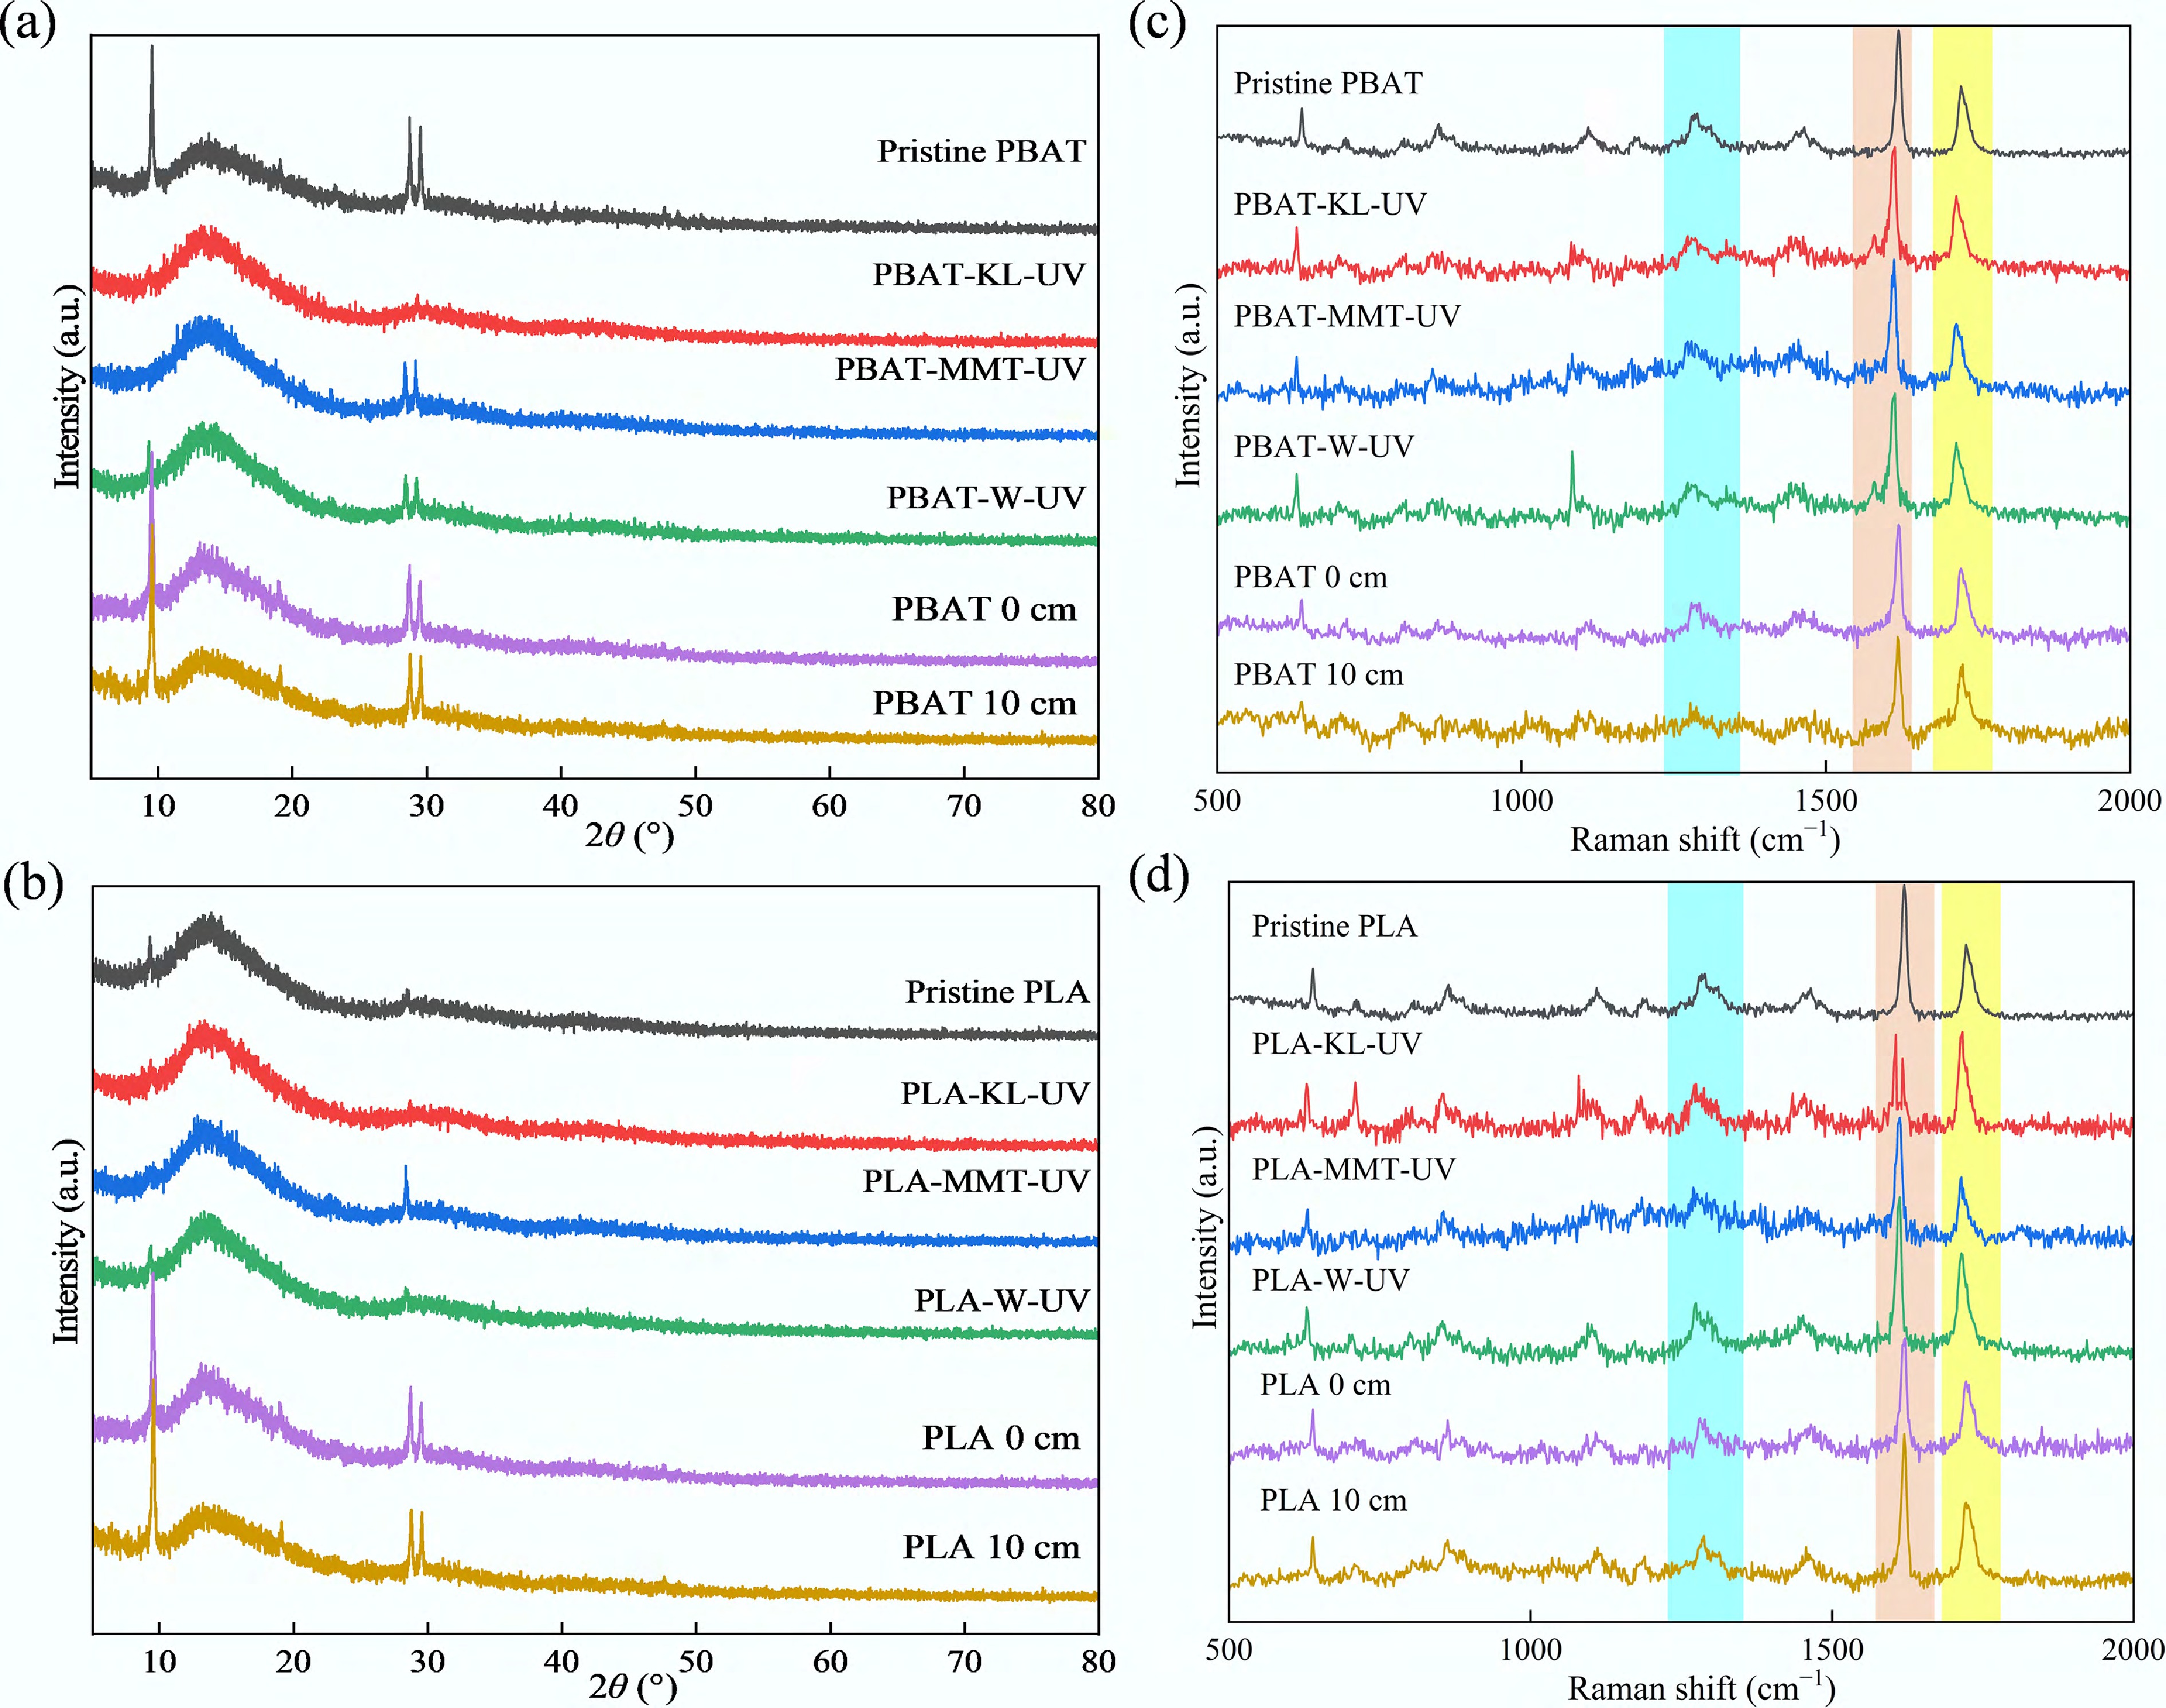
Figure 7.
XRD patterns of (a) PBAT, (b) PLA, and Raman spectra of (c) PBAT and (d) PLA of BDM (blue D band: 1,300 cm–1, orange G band: 1,580 cm–1, yellow C=O functional group band: 1,724 cm–1).
-
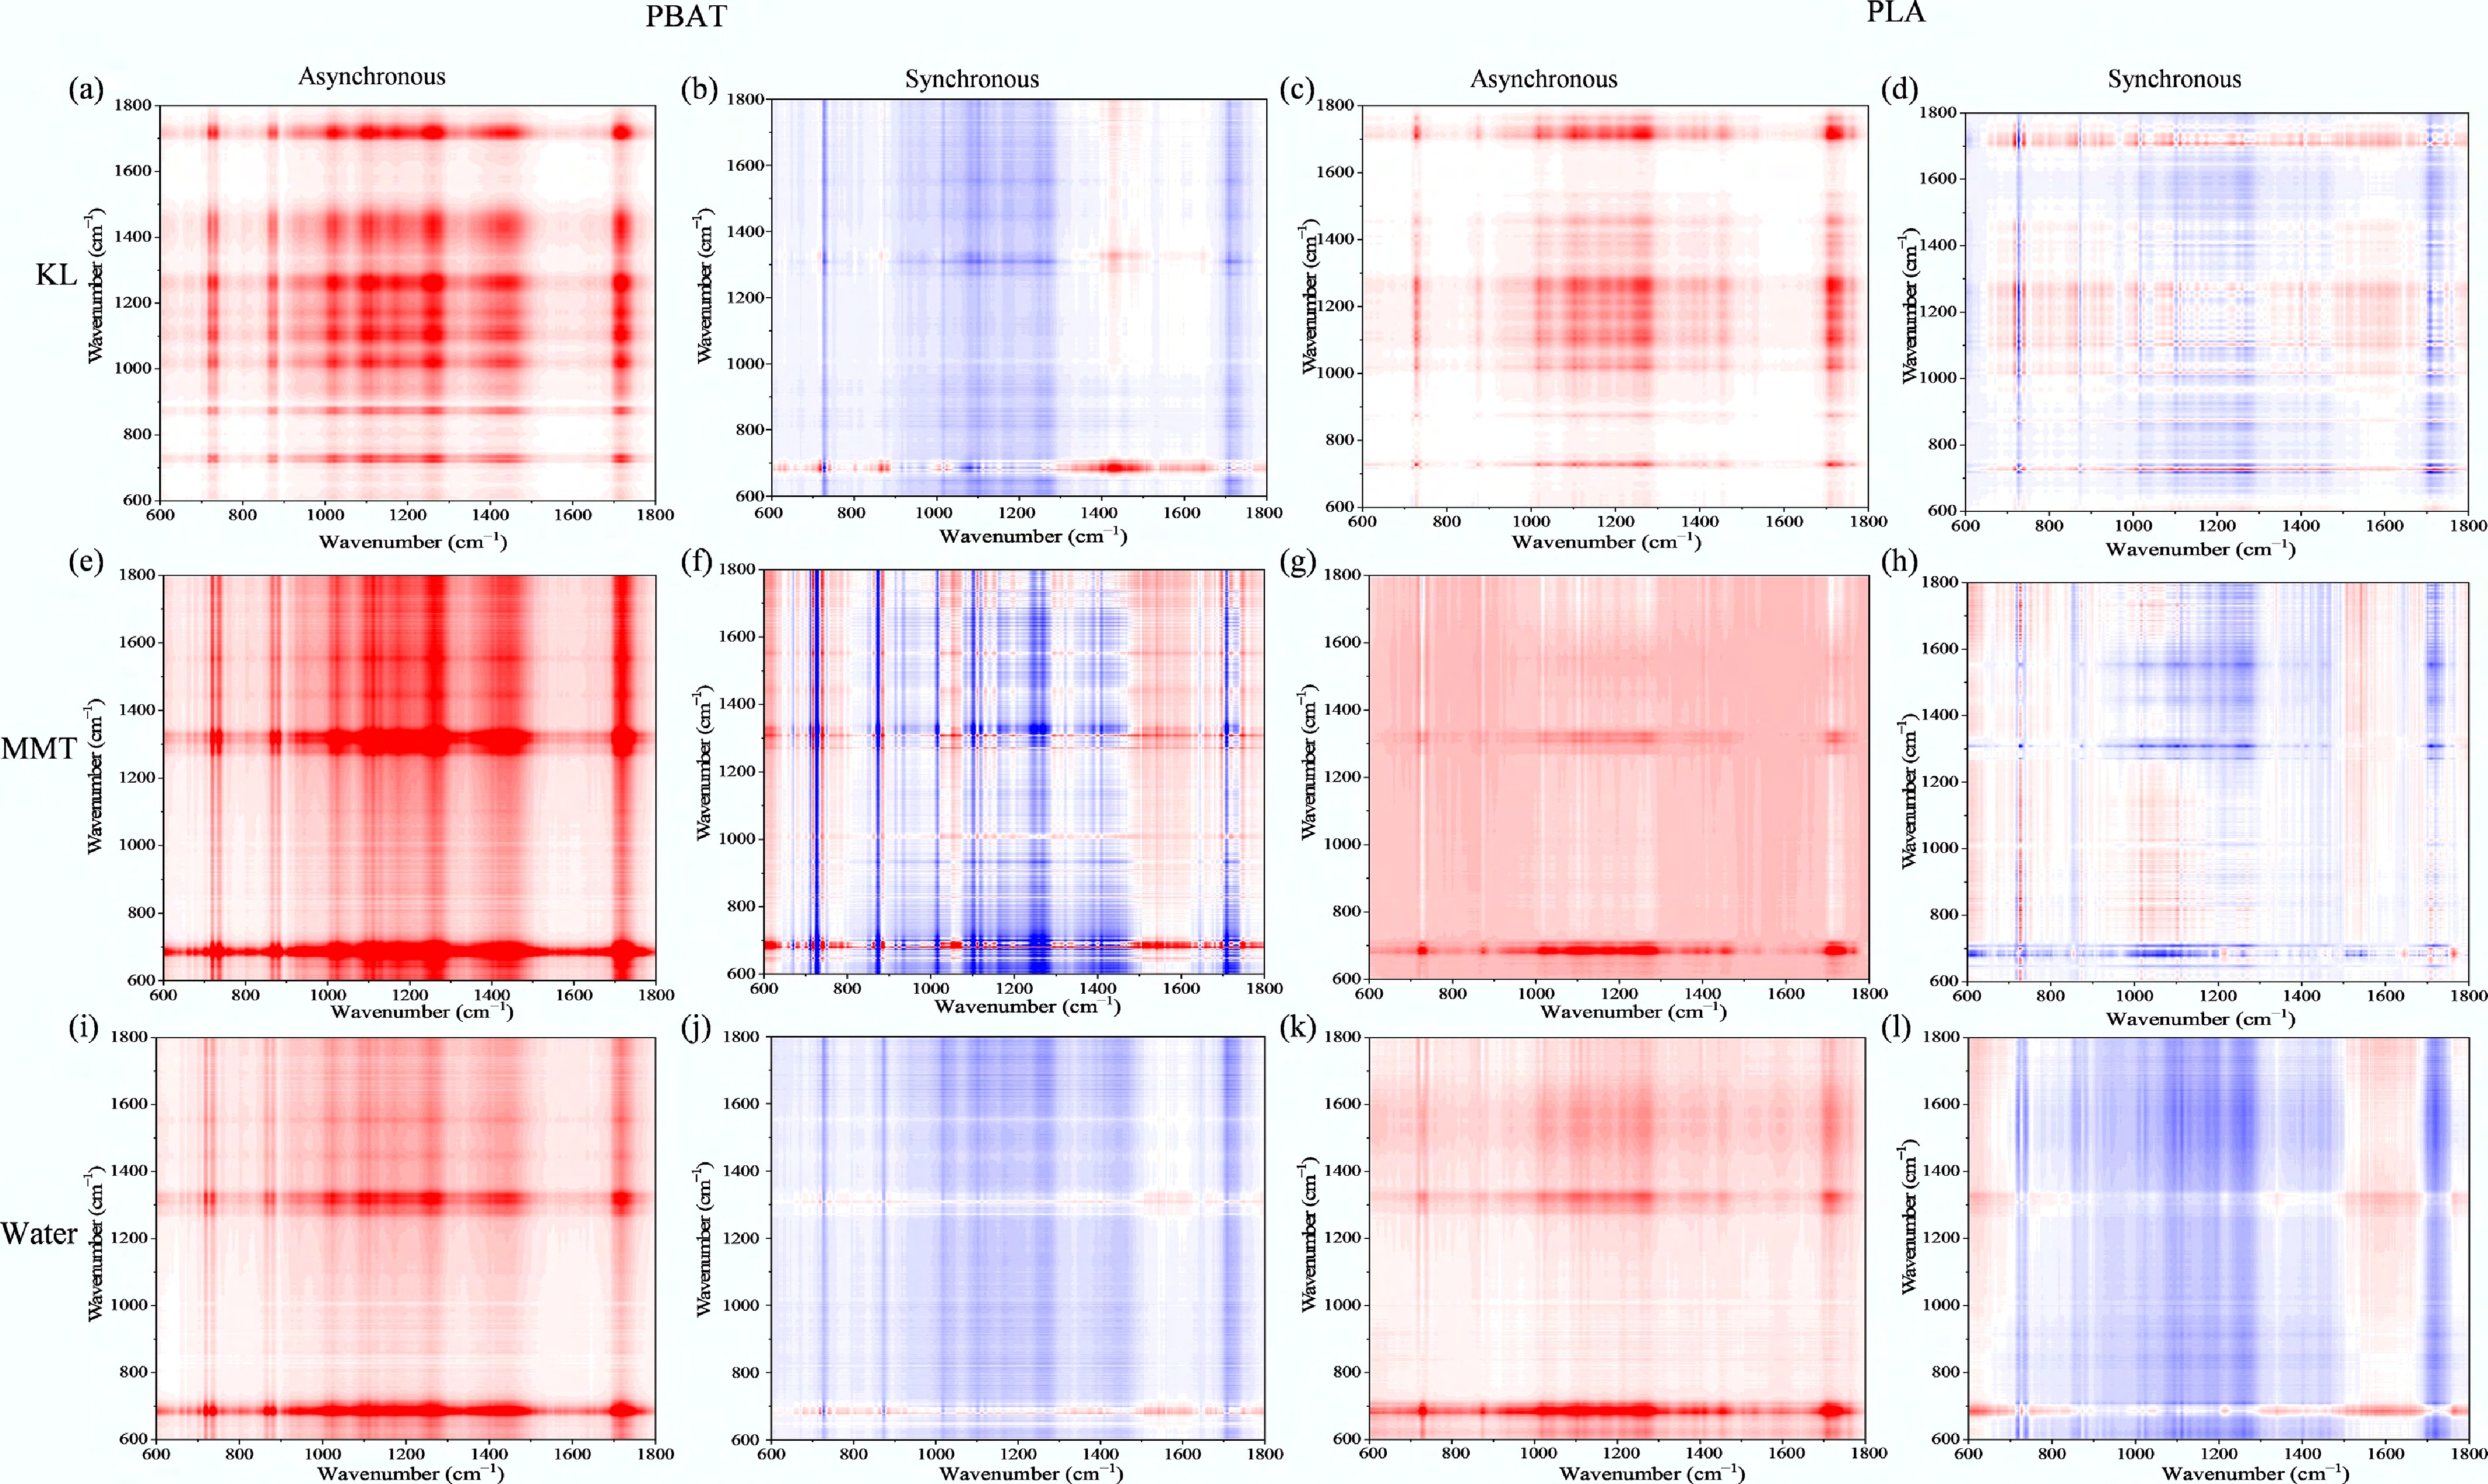
Figure 8.
Synchronous and asynchronous correlation maps of PBAT and PLA constructed based on ATR-FTIR spectra at different time intervals. (PBAT: a, e, i) and (PLA: c, g, k): synchronous maps; (PBAT: b, f, j) and (PLA: d, h, l): asynchronous maps under KL, MMT, and W-UV conditions.
-
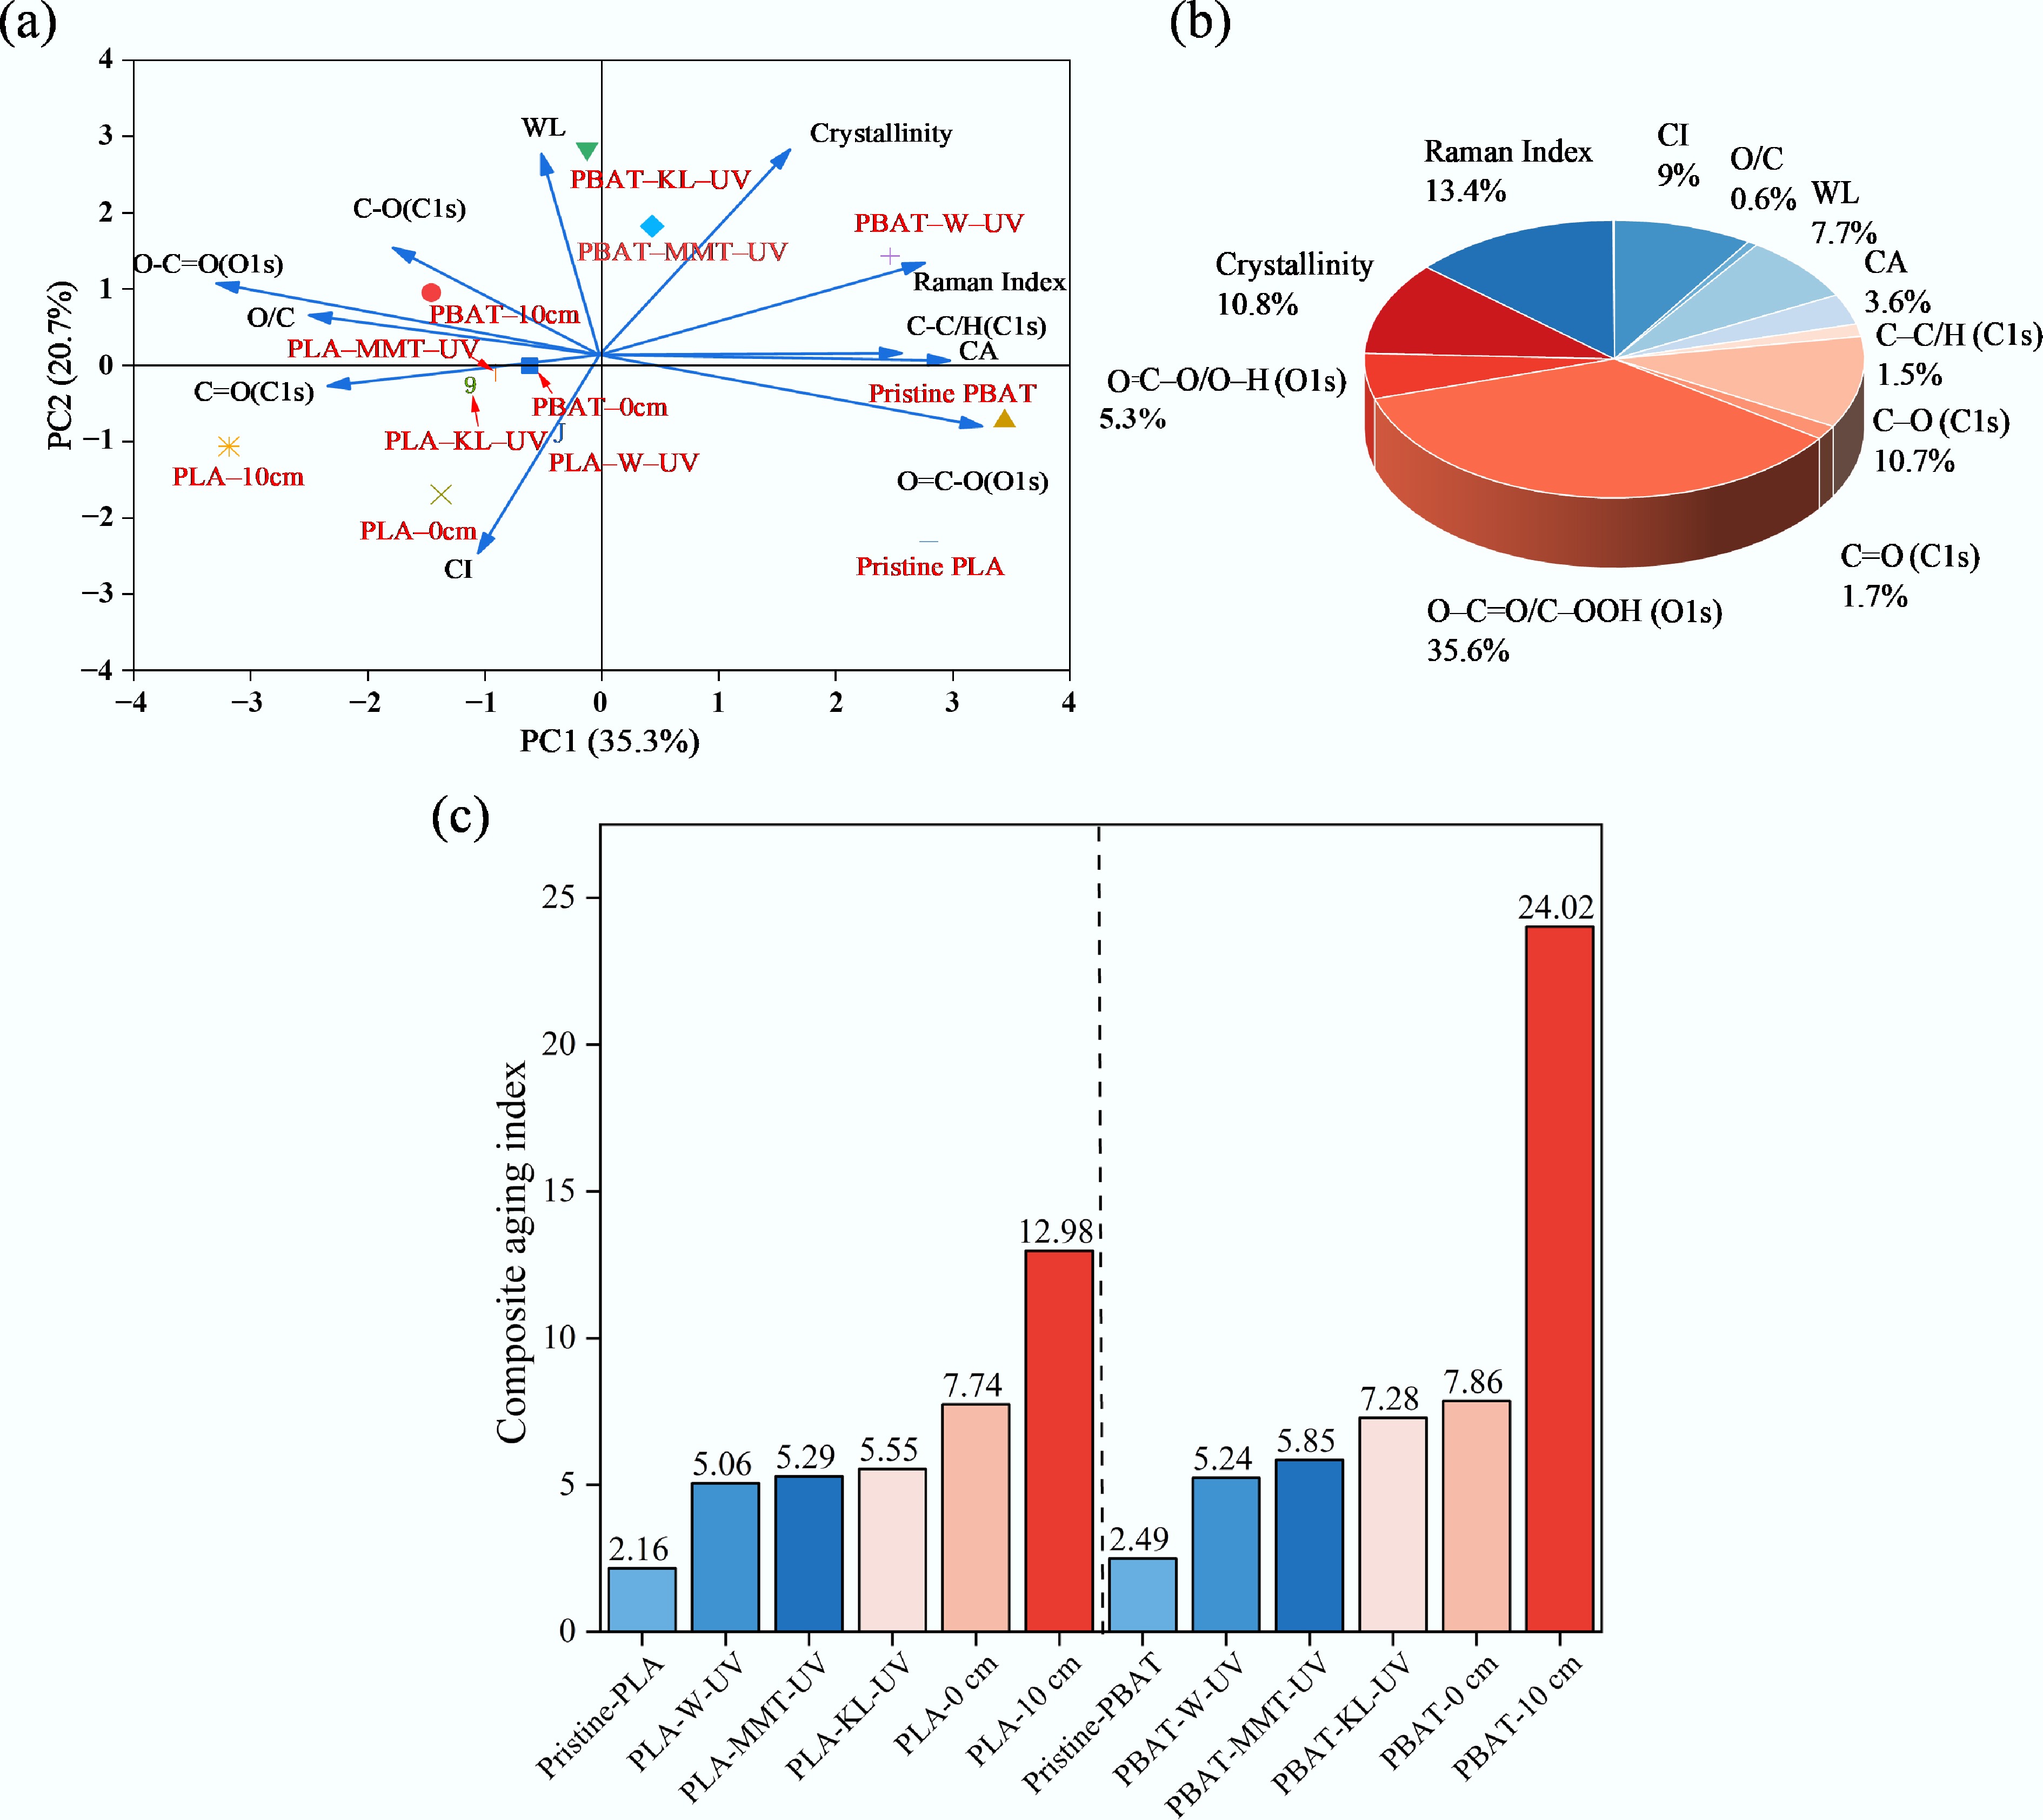
Figure 9.
(a) Principal component analysis (PCA) of BDM. (b) Pie chart showing the weights of each index. (c) The composite aging index.
-
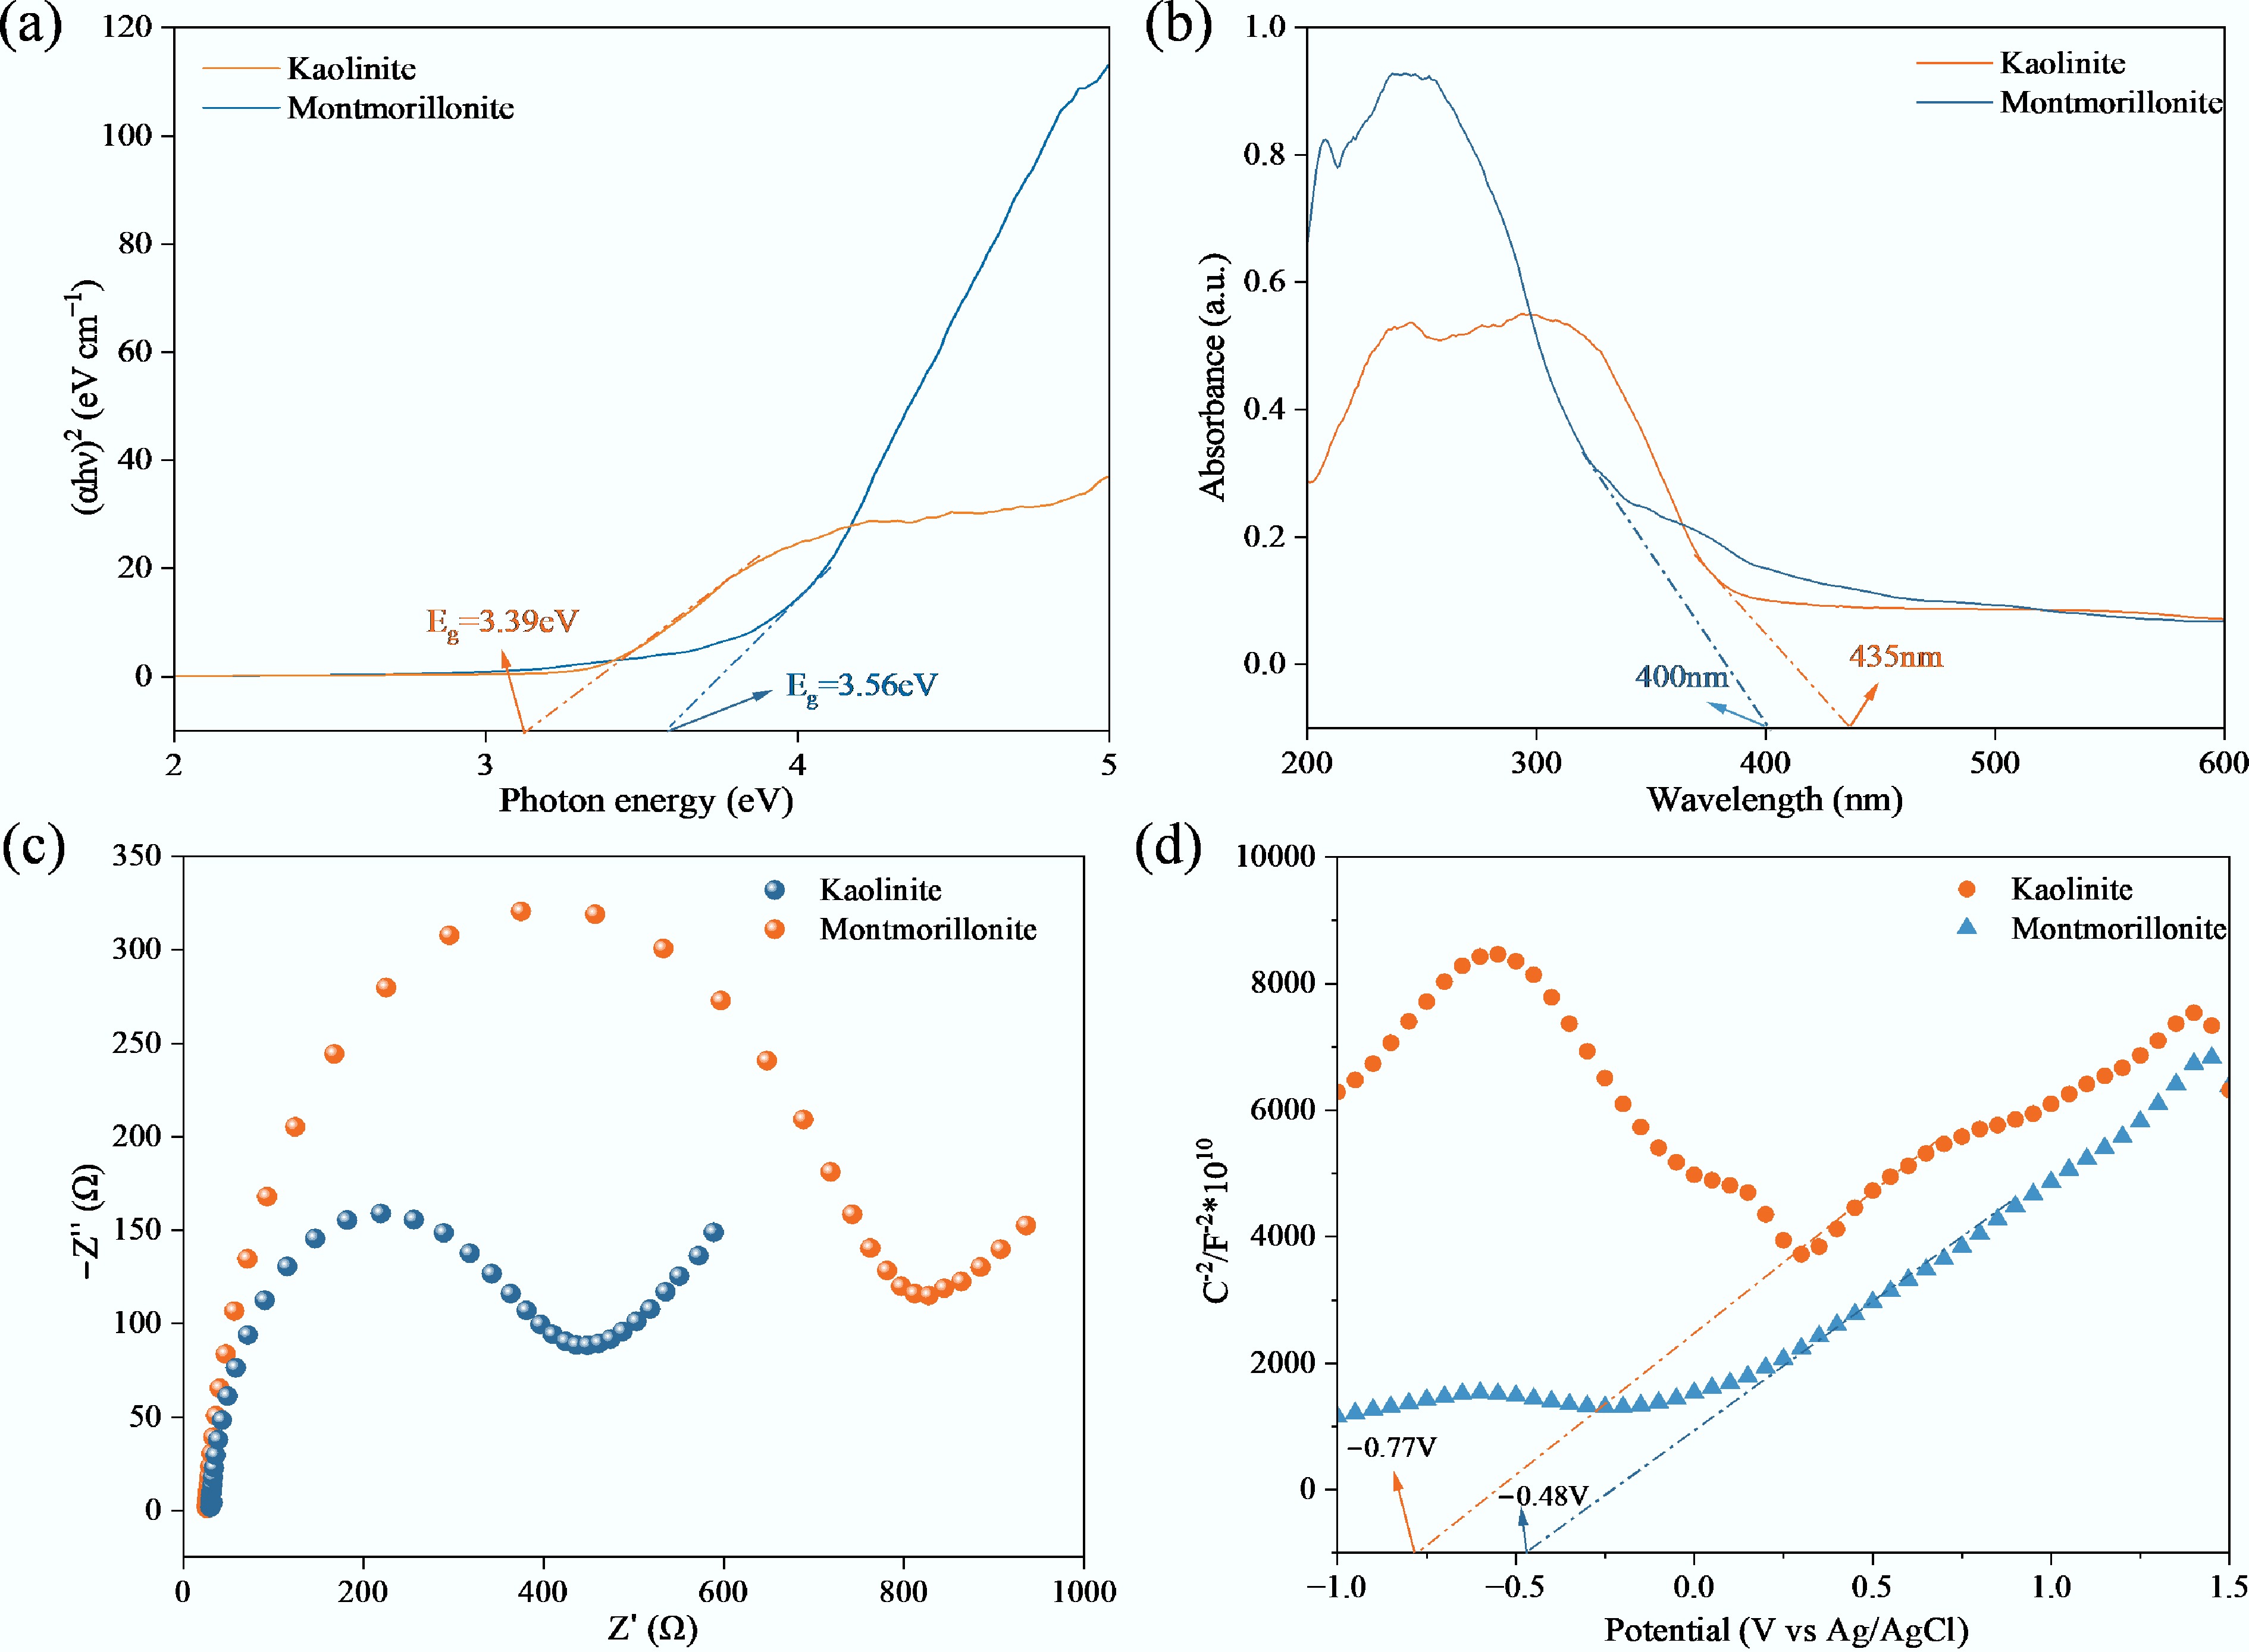
Figure 10.
(a) UV-DRS, (b) band gap, (c) EIS spectra, and (d) Mott–Schottky curves of KL and MMT.
-
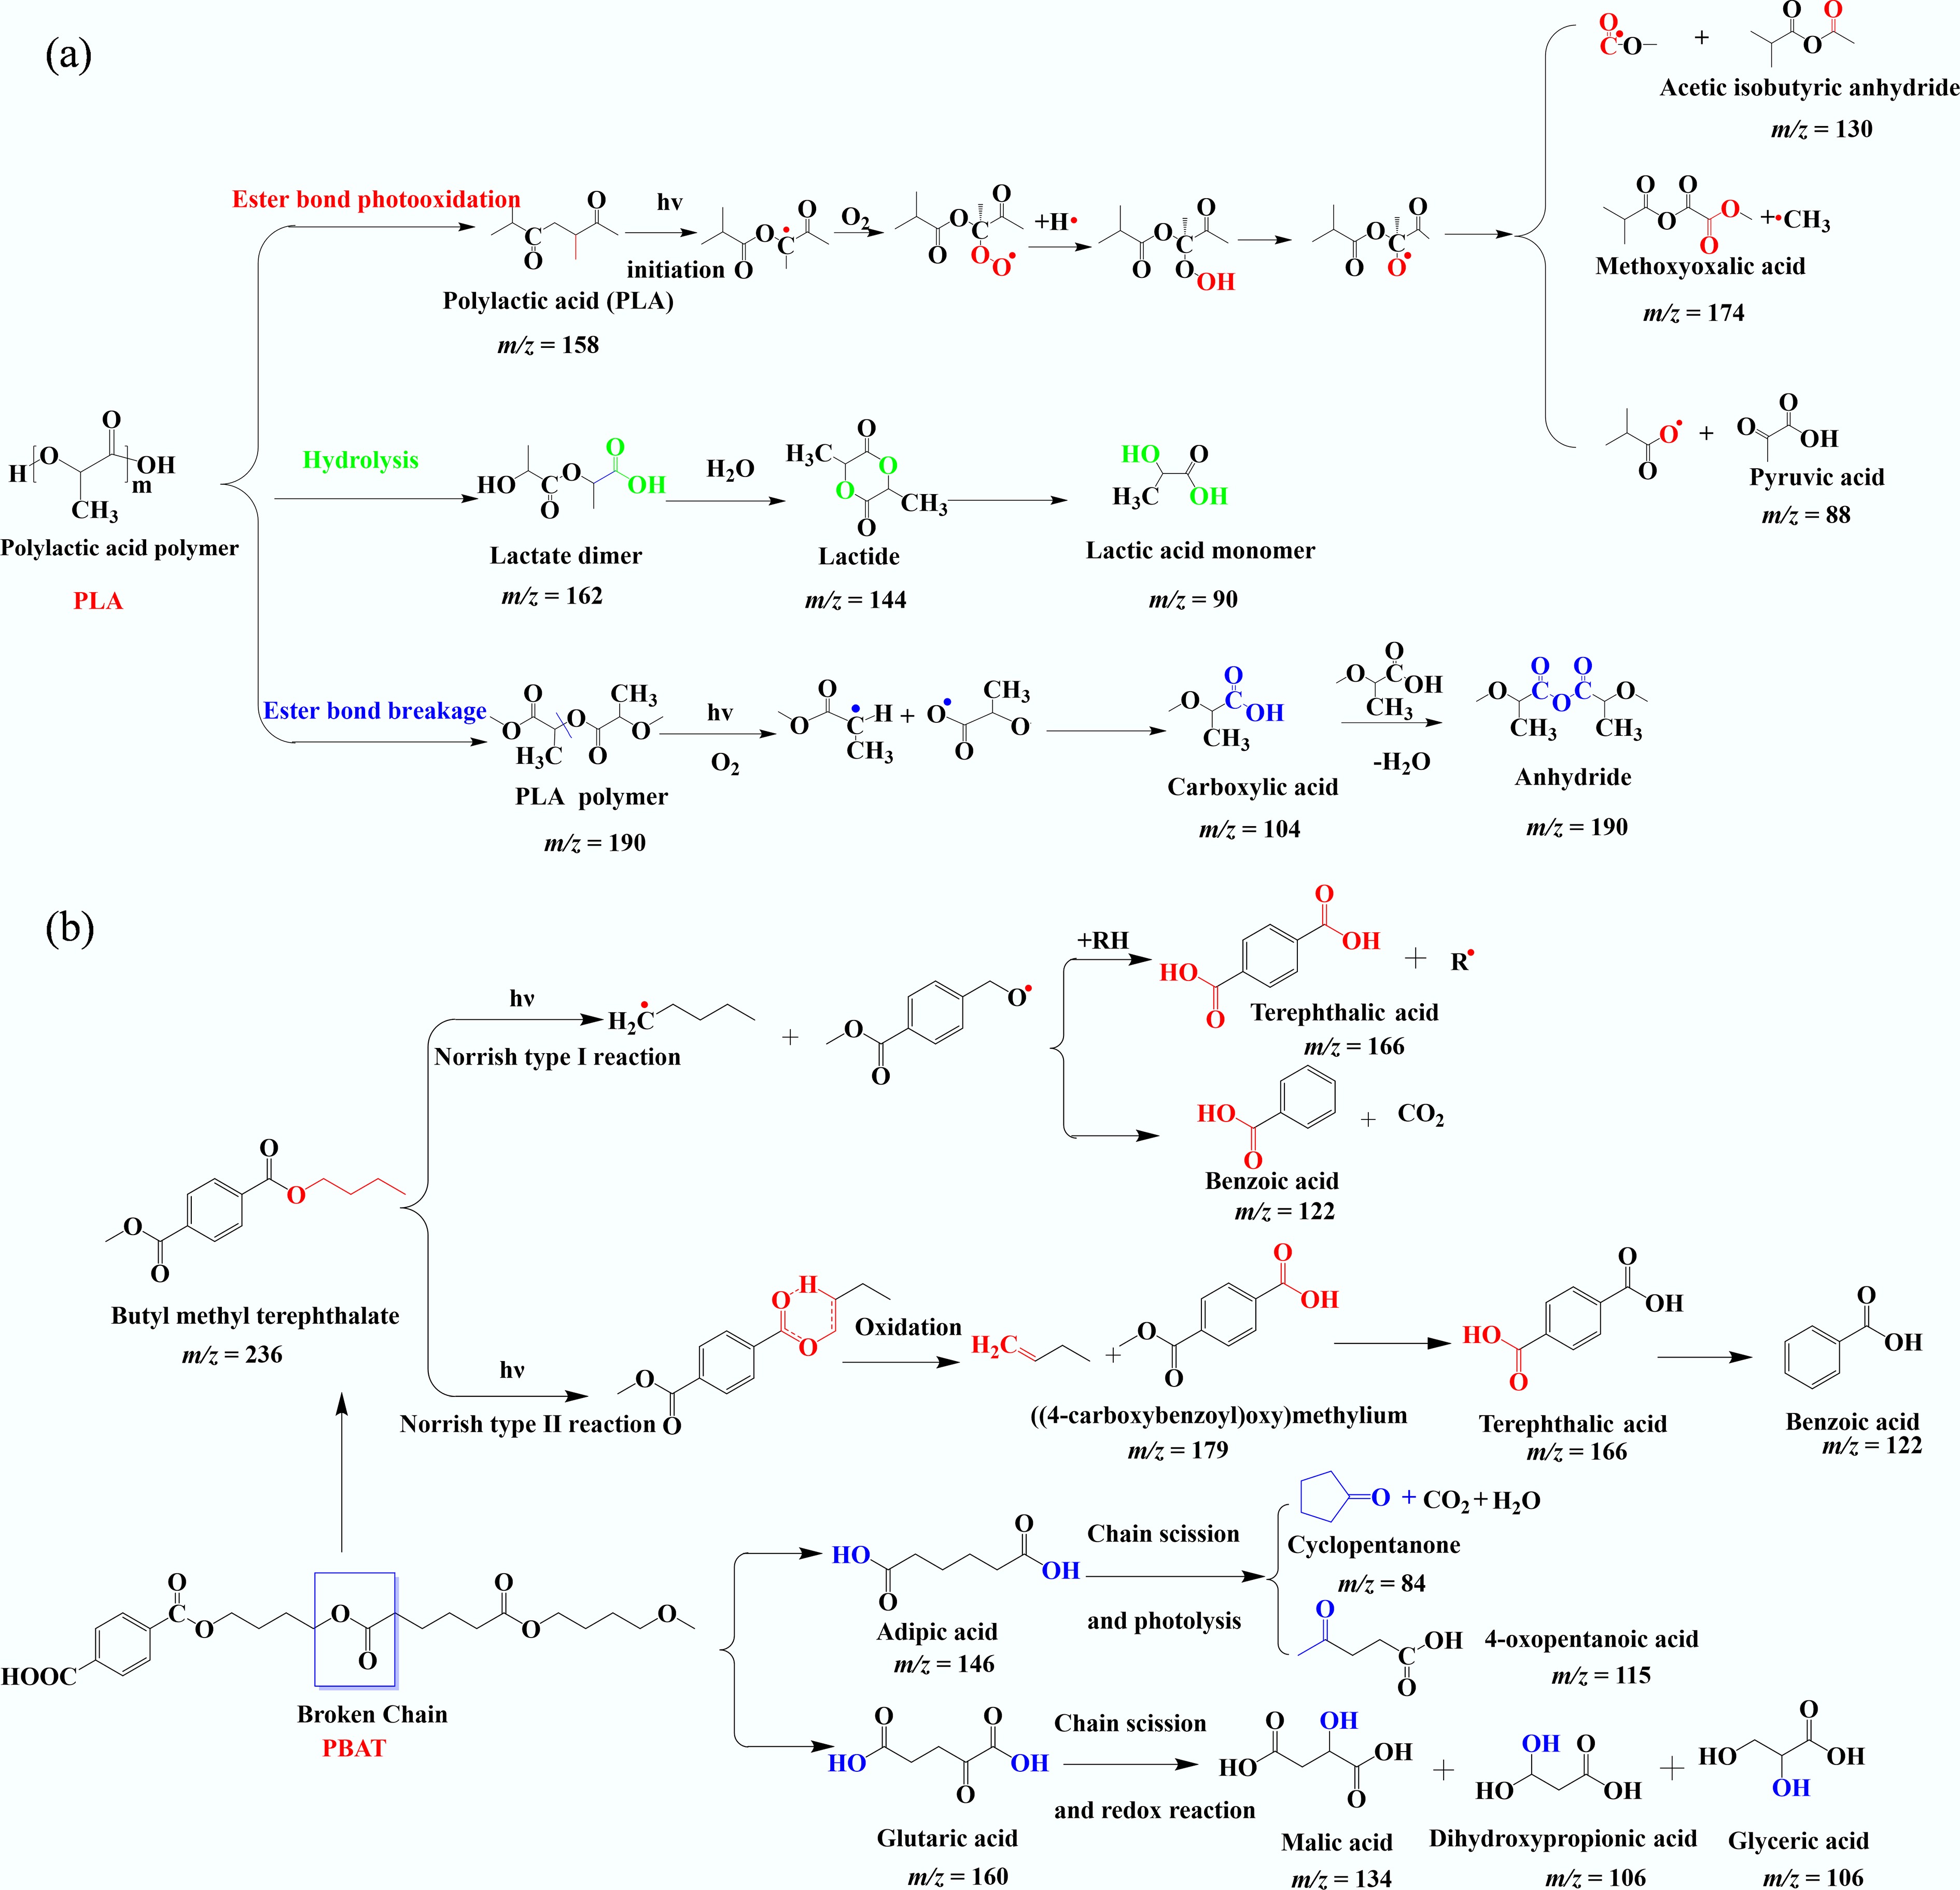
Figure 11.
Photodegradation pathways and products of (a) PLA and (b) PBAT.
Figures
(11)
Tables
(0)