-
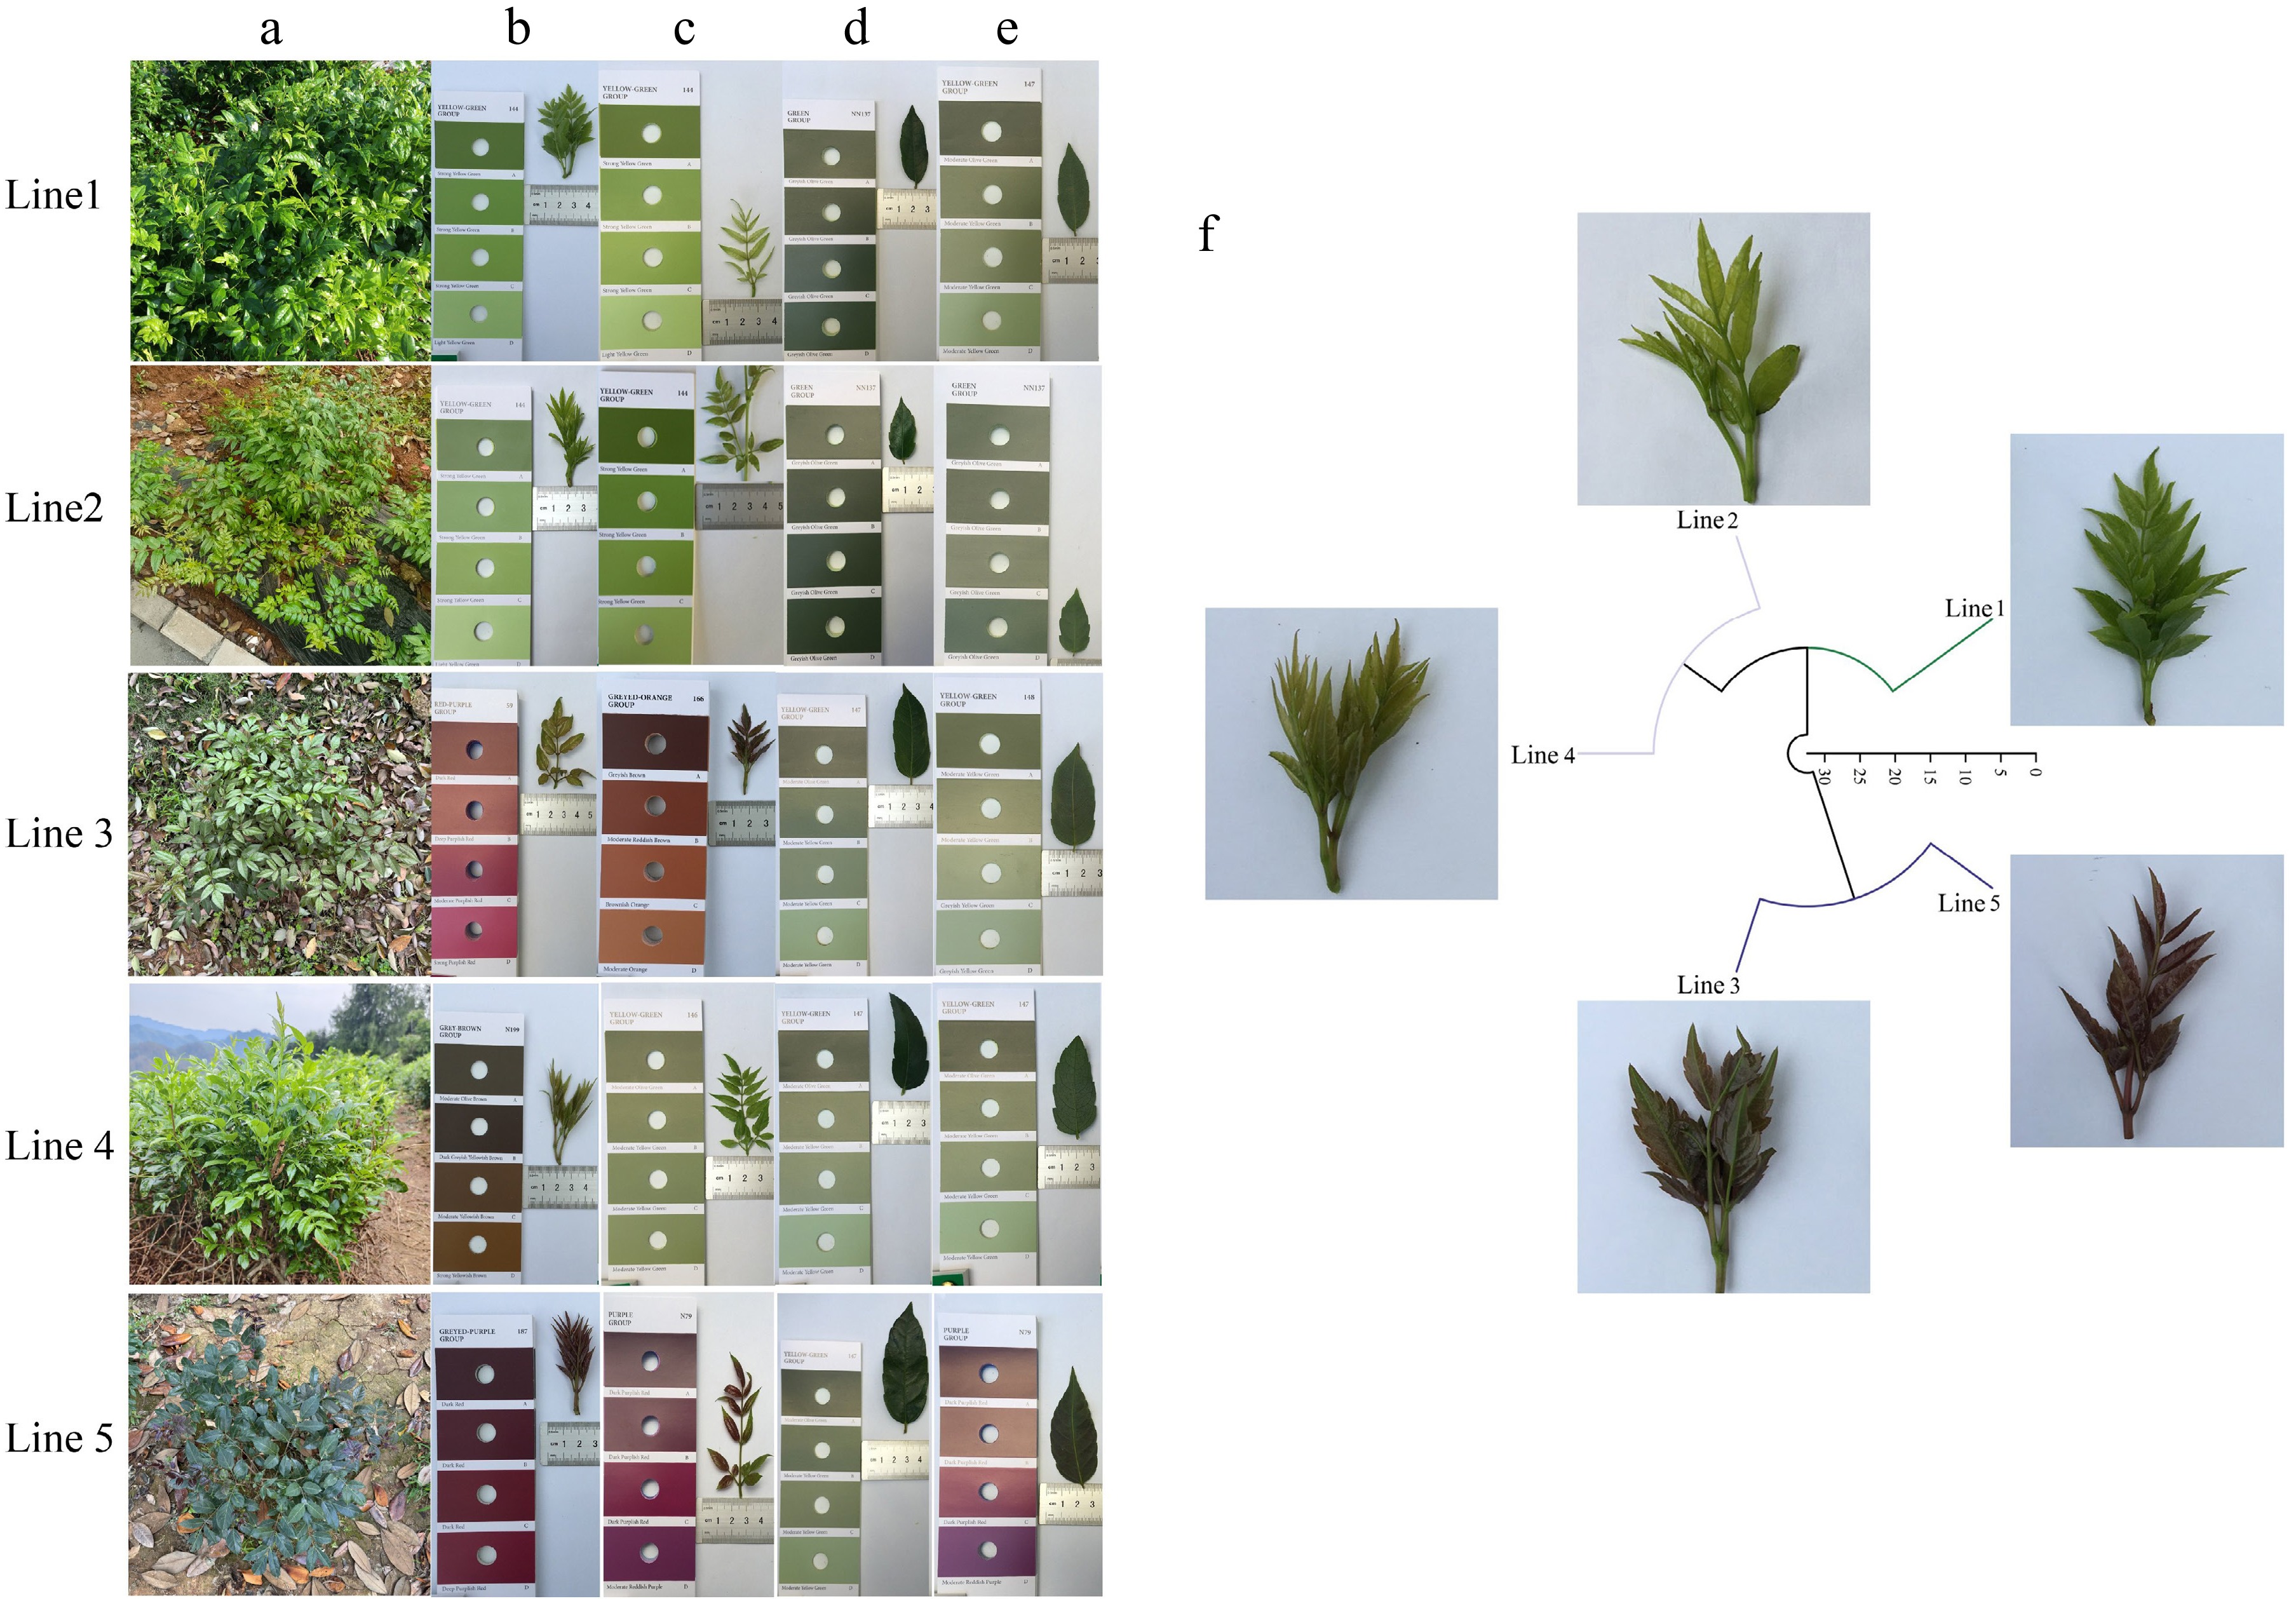
Figure 1.
Field phenotype characteristics of five Ampelopsis grossedentata lines. Note: 1, 2, 3, 4, and 5 represent line 1 'Chunlv Xiaoye Mei', line 2 'Boliang Mei', line 3 'Zixiangbian Mei', line 4 'Banshan Banzi Mei', and line 5 'Zimo Mei', respectively. (a) Field photograph of the plant. (b) Colorimetric chart of newly sprouted stems and leaves in spring. (c) Colorimetric chart of newly sprouted stems and leaves in summer. (d) Colorimetric chart of the adaxial side of mature stems and leaves in summer. (e) Colorimetric chart of the abaxial side of mature stems and leaves. (f) Cluster analysis of leaf color.
-
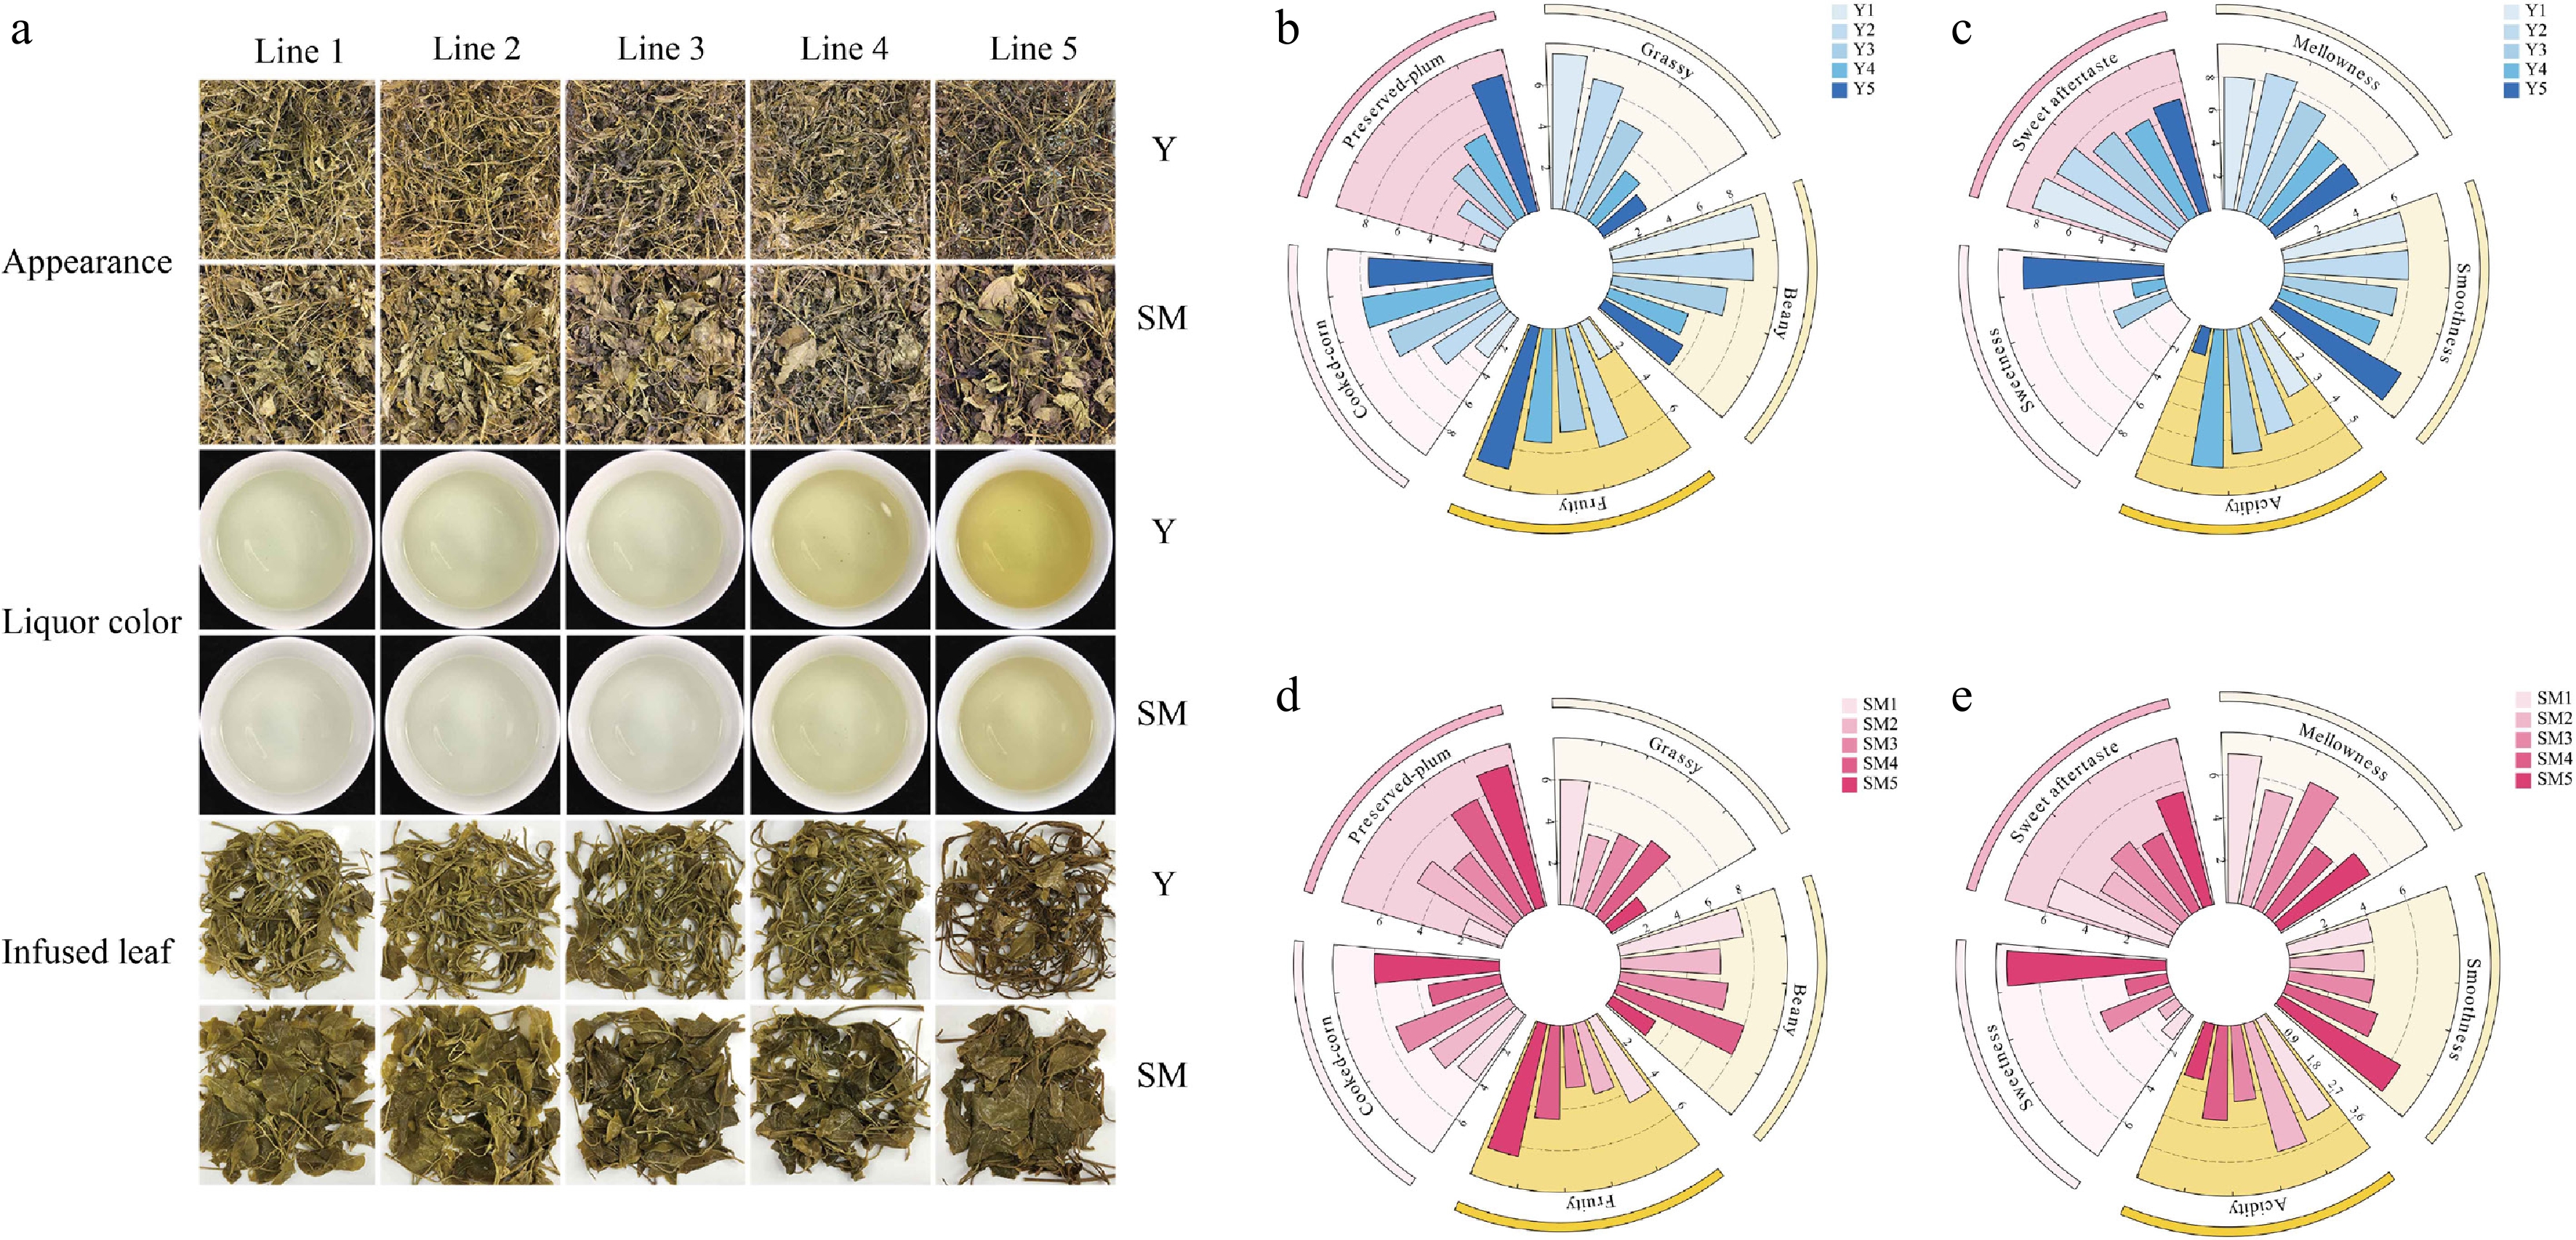
Figure 2.
Sensory evaluation and QDA analysis of taste and aroma for five A. grossedentata lines. Note: (a) Photos of the appearance, tea liquor, and leaf base of stems and leaves from five different maturity levels of A. grossedentata after microwave fixing. (b) Aroma characteristics in the Y stage. (c) Liquor taste characteristics in the Y stage. (d) Aroma characteristics in the SM stage. (e) Liquor taste characteristics in the SM stage.
-
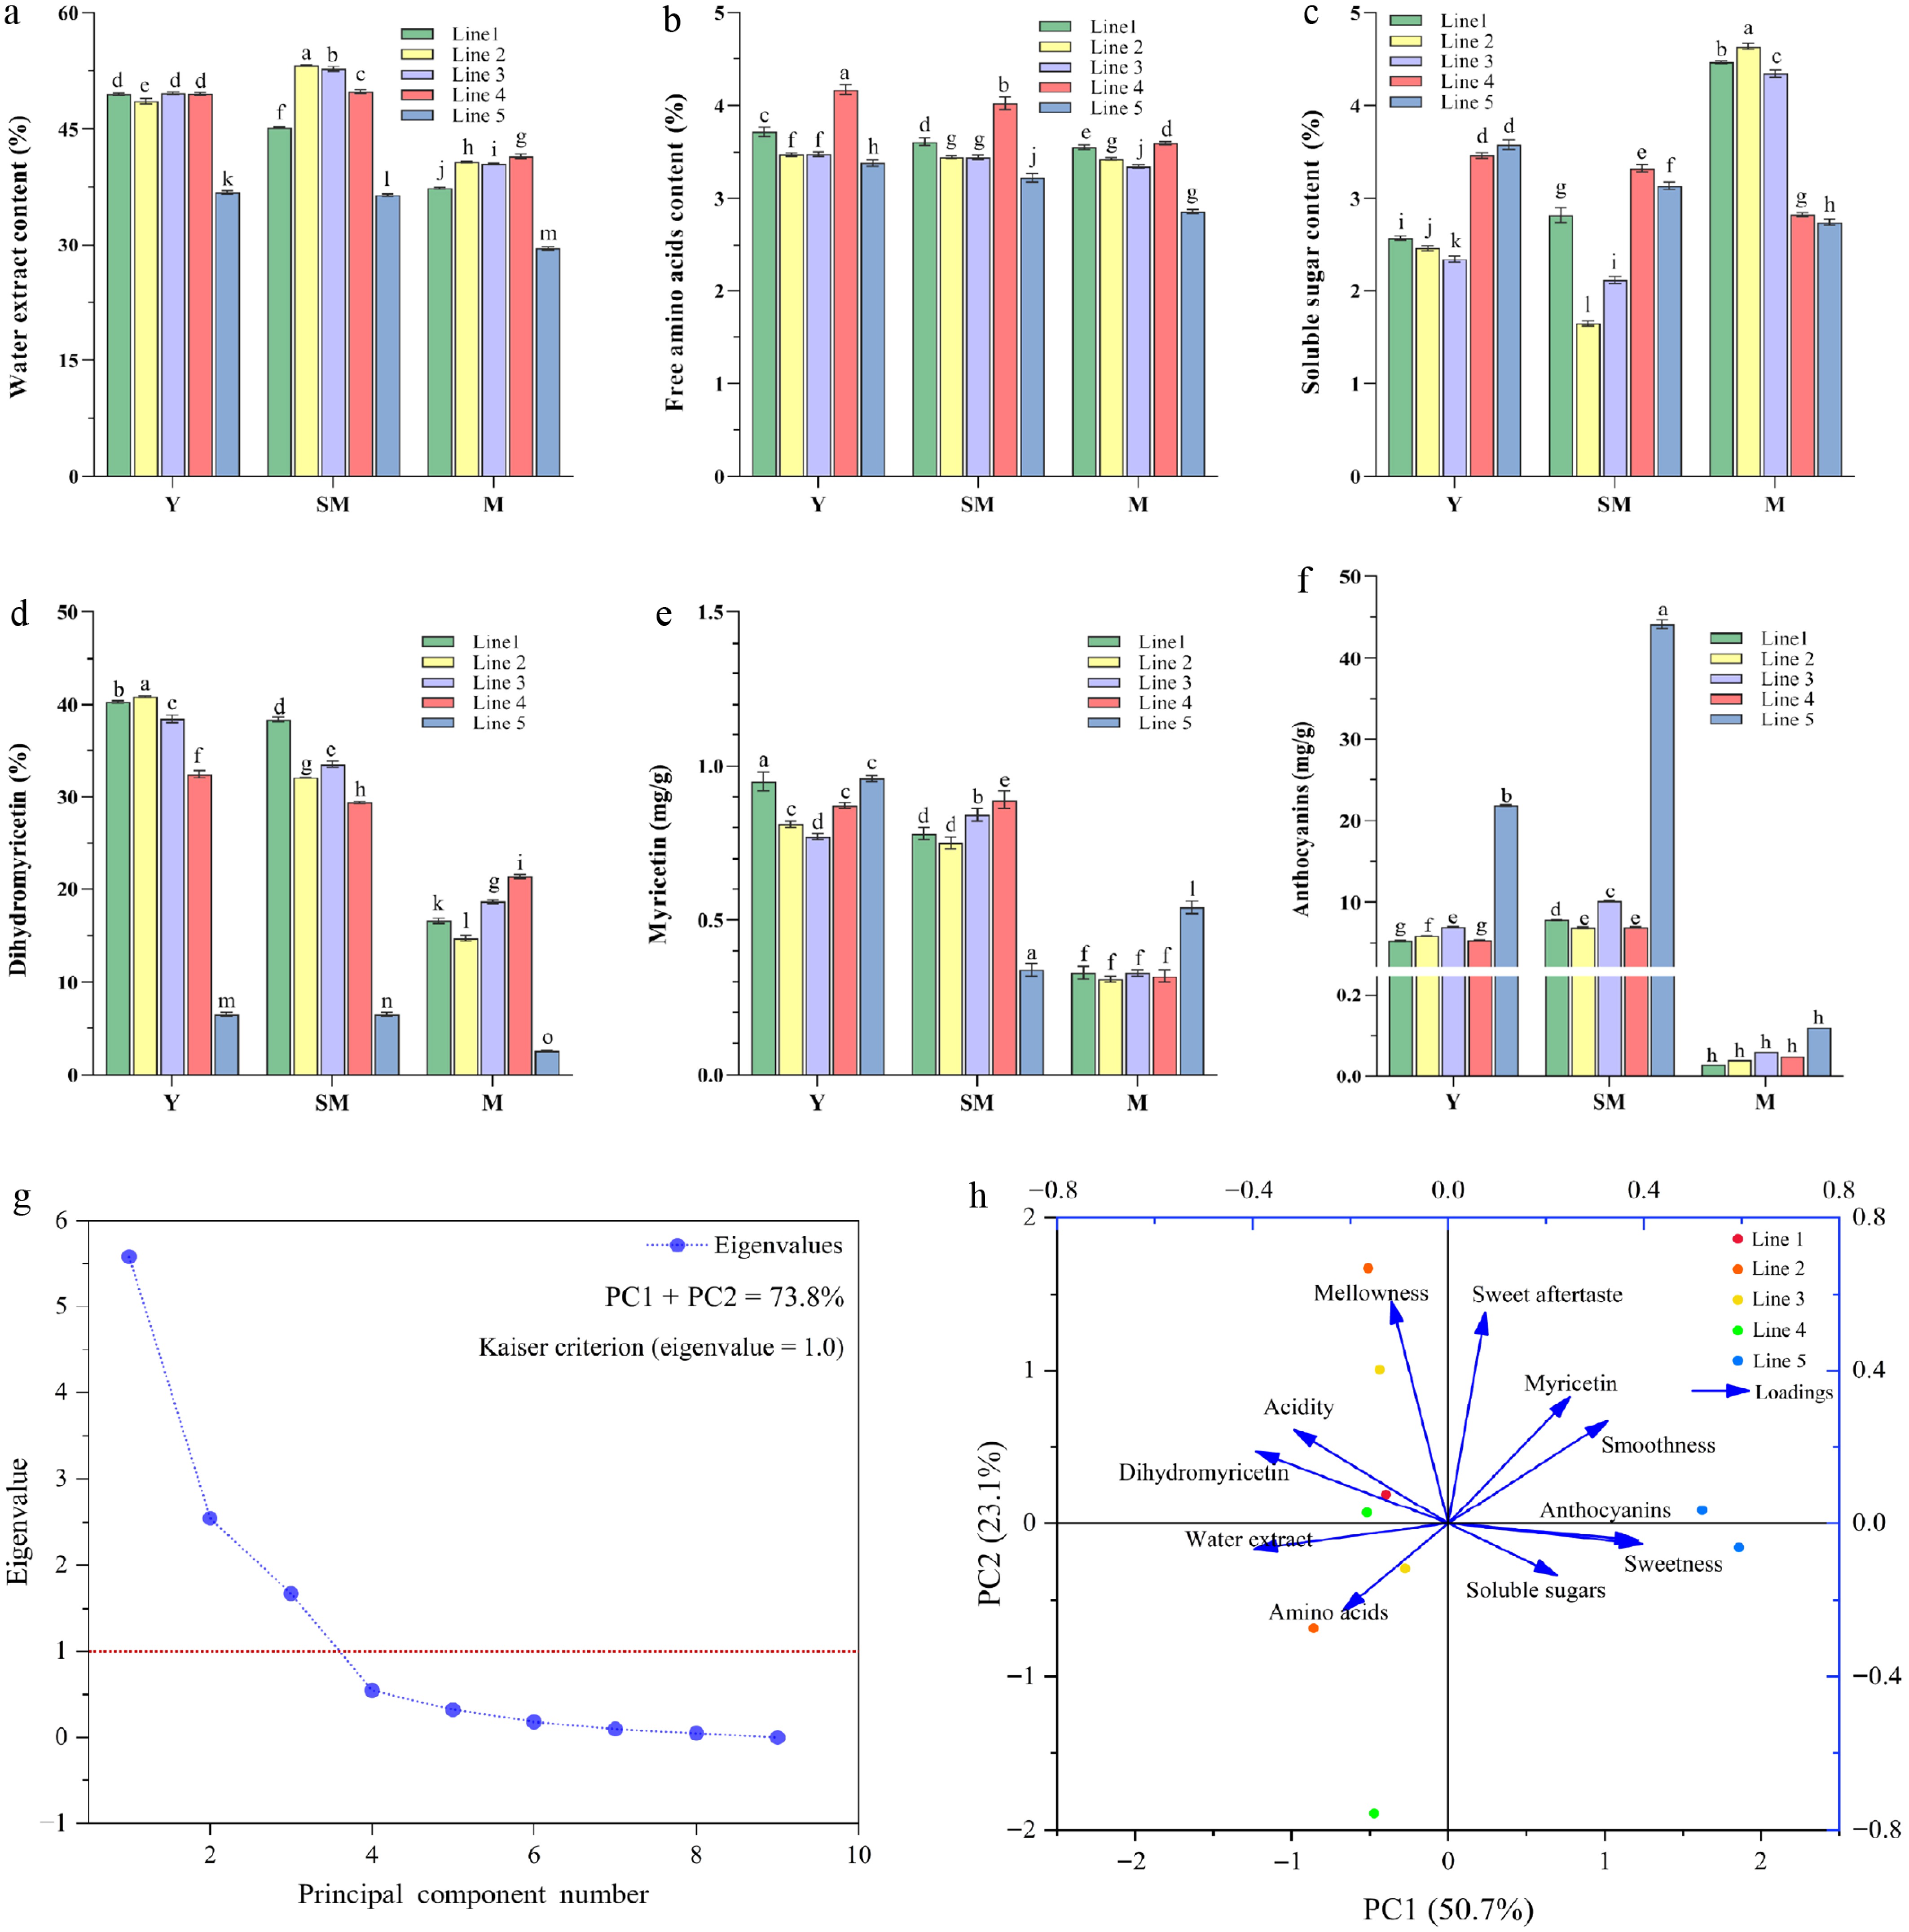
Figure 3.
Main biochemical component contents and taste characteristics PCA for five A. grossedentata lines. Note: 1, 2, 3, 4, and 5 represent line 1 'Chunlv Xiaoye Mei', line 2 'Boliang Mei', line 3 'Zixiangbian Mei', line 4 'Banshan Banzi Mei', and line 5 'Zimo Mei', respectively; Y, SM, and M denote young, semi-mature, and mature stems and leaves, respectively. (a)–(f) Represent the contents of water extract, free amino acids, soluble sugars, dihydromyricetin, myricetin, and anthocyanins, respectively. (g), (h) Represents the scree plot of principal component eigenvalues and the PCA biplot (sample scores and variable loadings), respectively. In h, the variable vectors (purple arrows) indicate the projection directions of chemical constituents and sensory attributes in the principal component space. The angles between vectors reflect their correlations: an angle < 90° denotes a positive correlation, while an angle > 90° indicates a negative correlation. Different letters within the same column signify significant differences (p < 0.05).
-
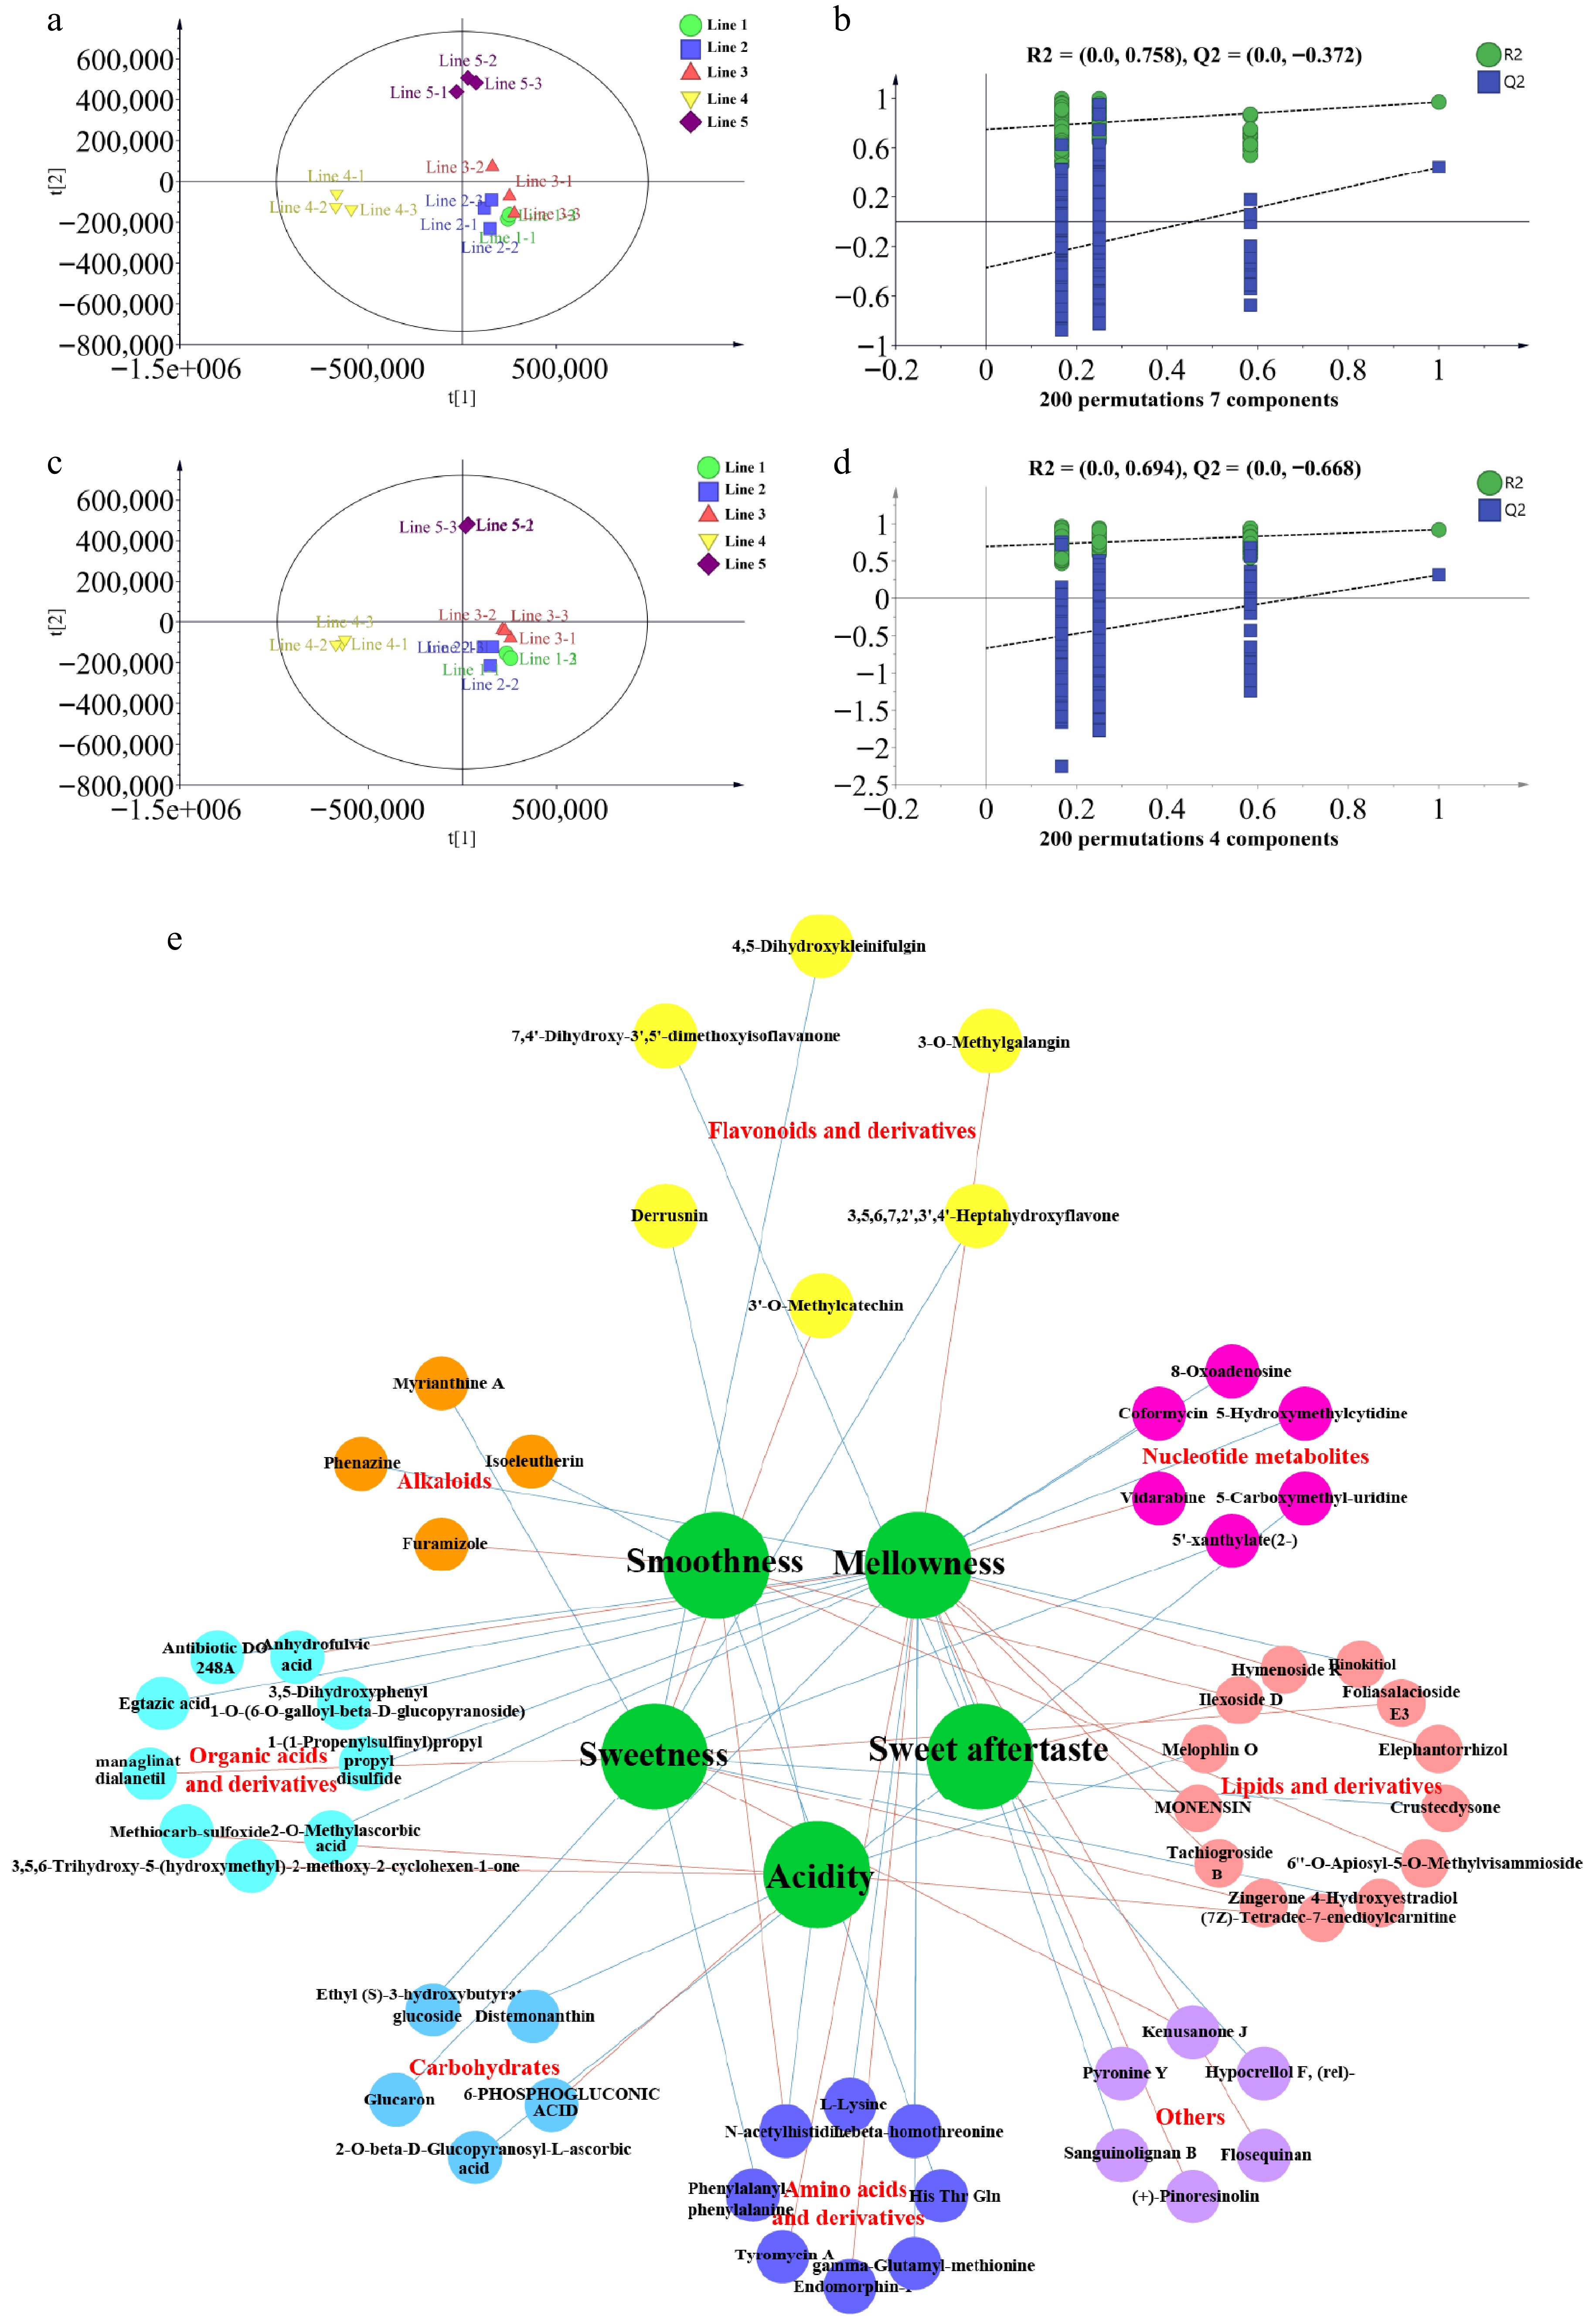
Figure 4.
Association analysis between differential metabolites from non-targeted metabolomics and taste quality. Note: (a) PLS-DA score plot, (b) PLS-DA permutation test plot, (c) OPLS-DA score plot, (d) OPLS-DA permutation test plot, and (e) correlation network diagram between flavor attributes and metabolites (|r| > 0.85, p < 0.01), with red lines indicating positive correlations and blue lines indicating negative correlations.
-
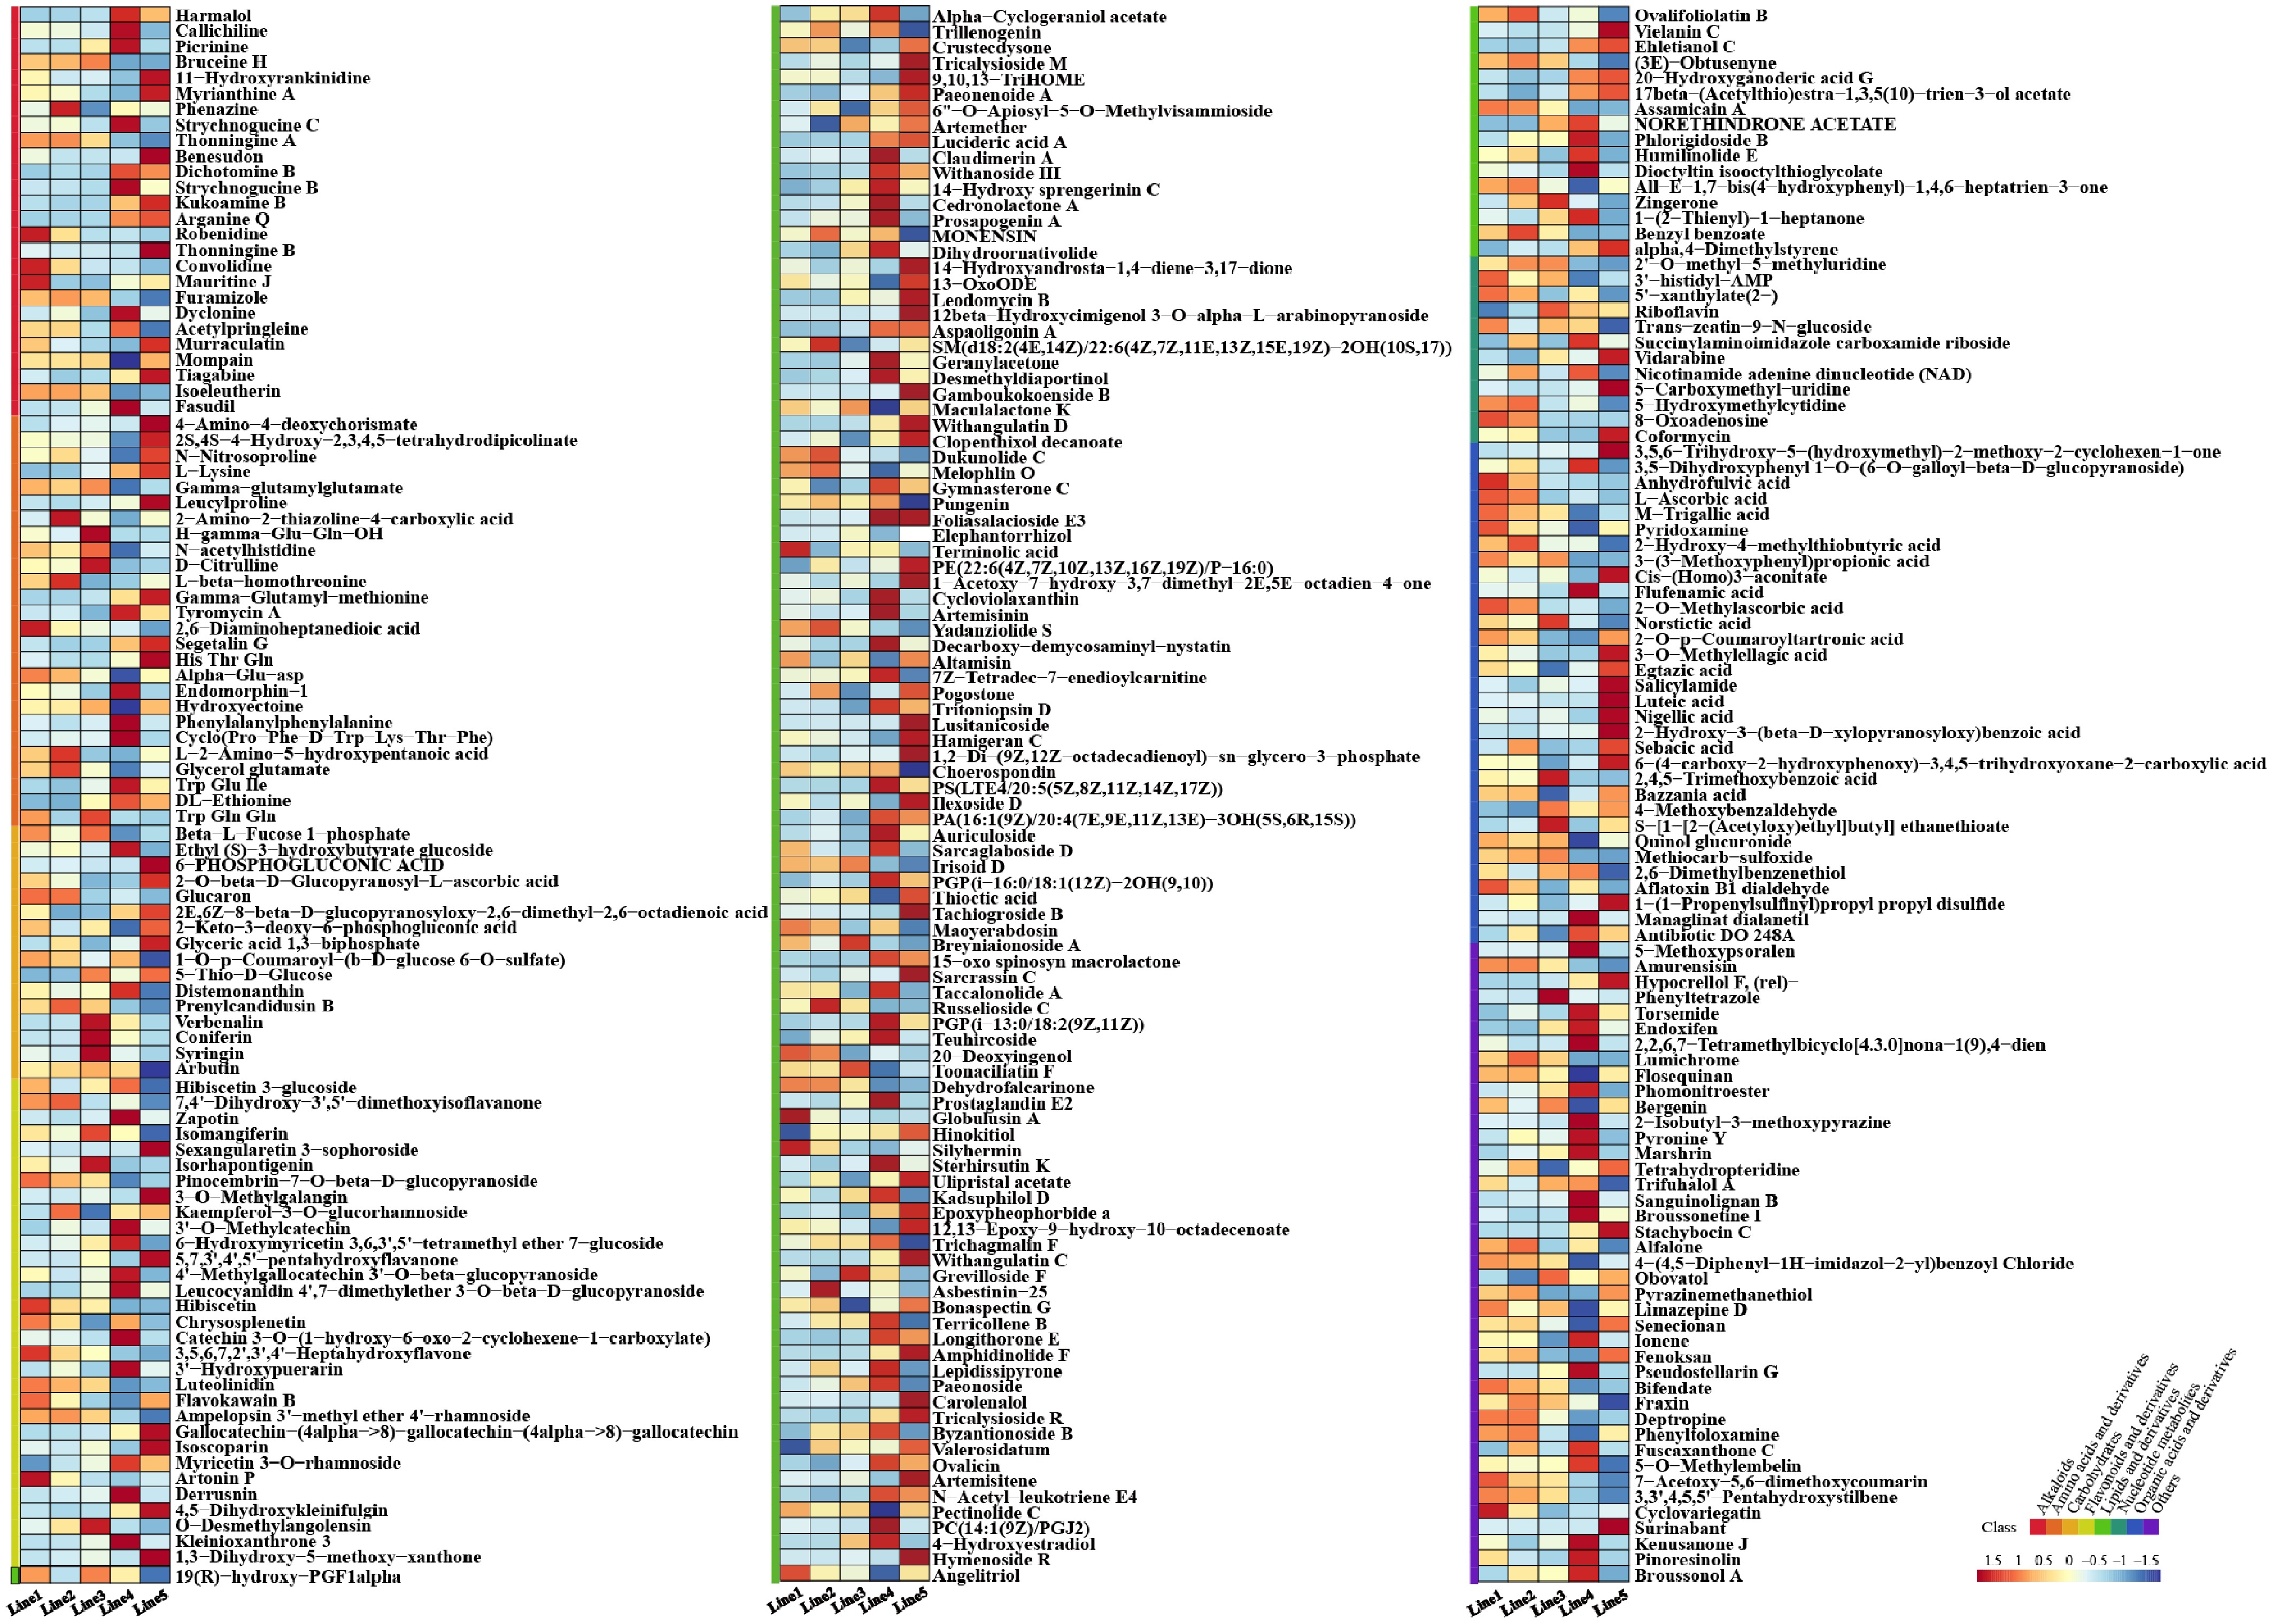
Figure 5.
Heatmap of taste-related differential metabolites across lines.
-
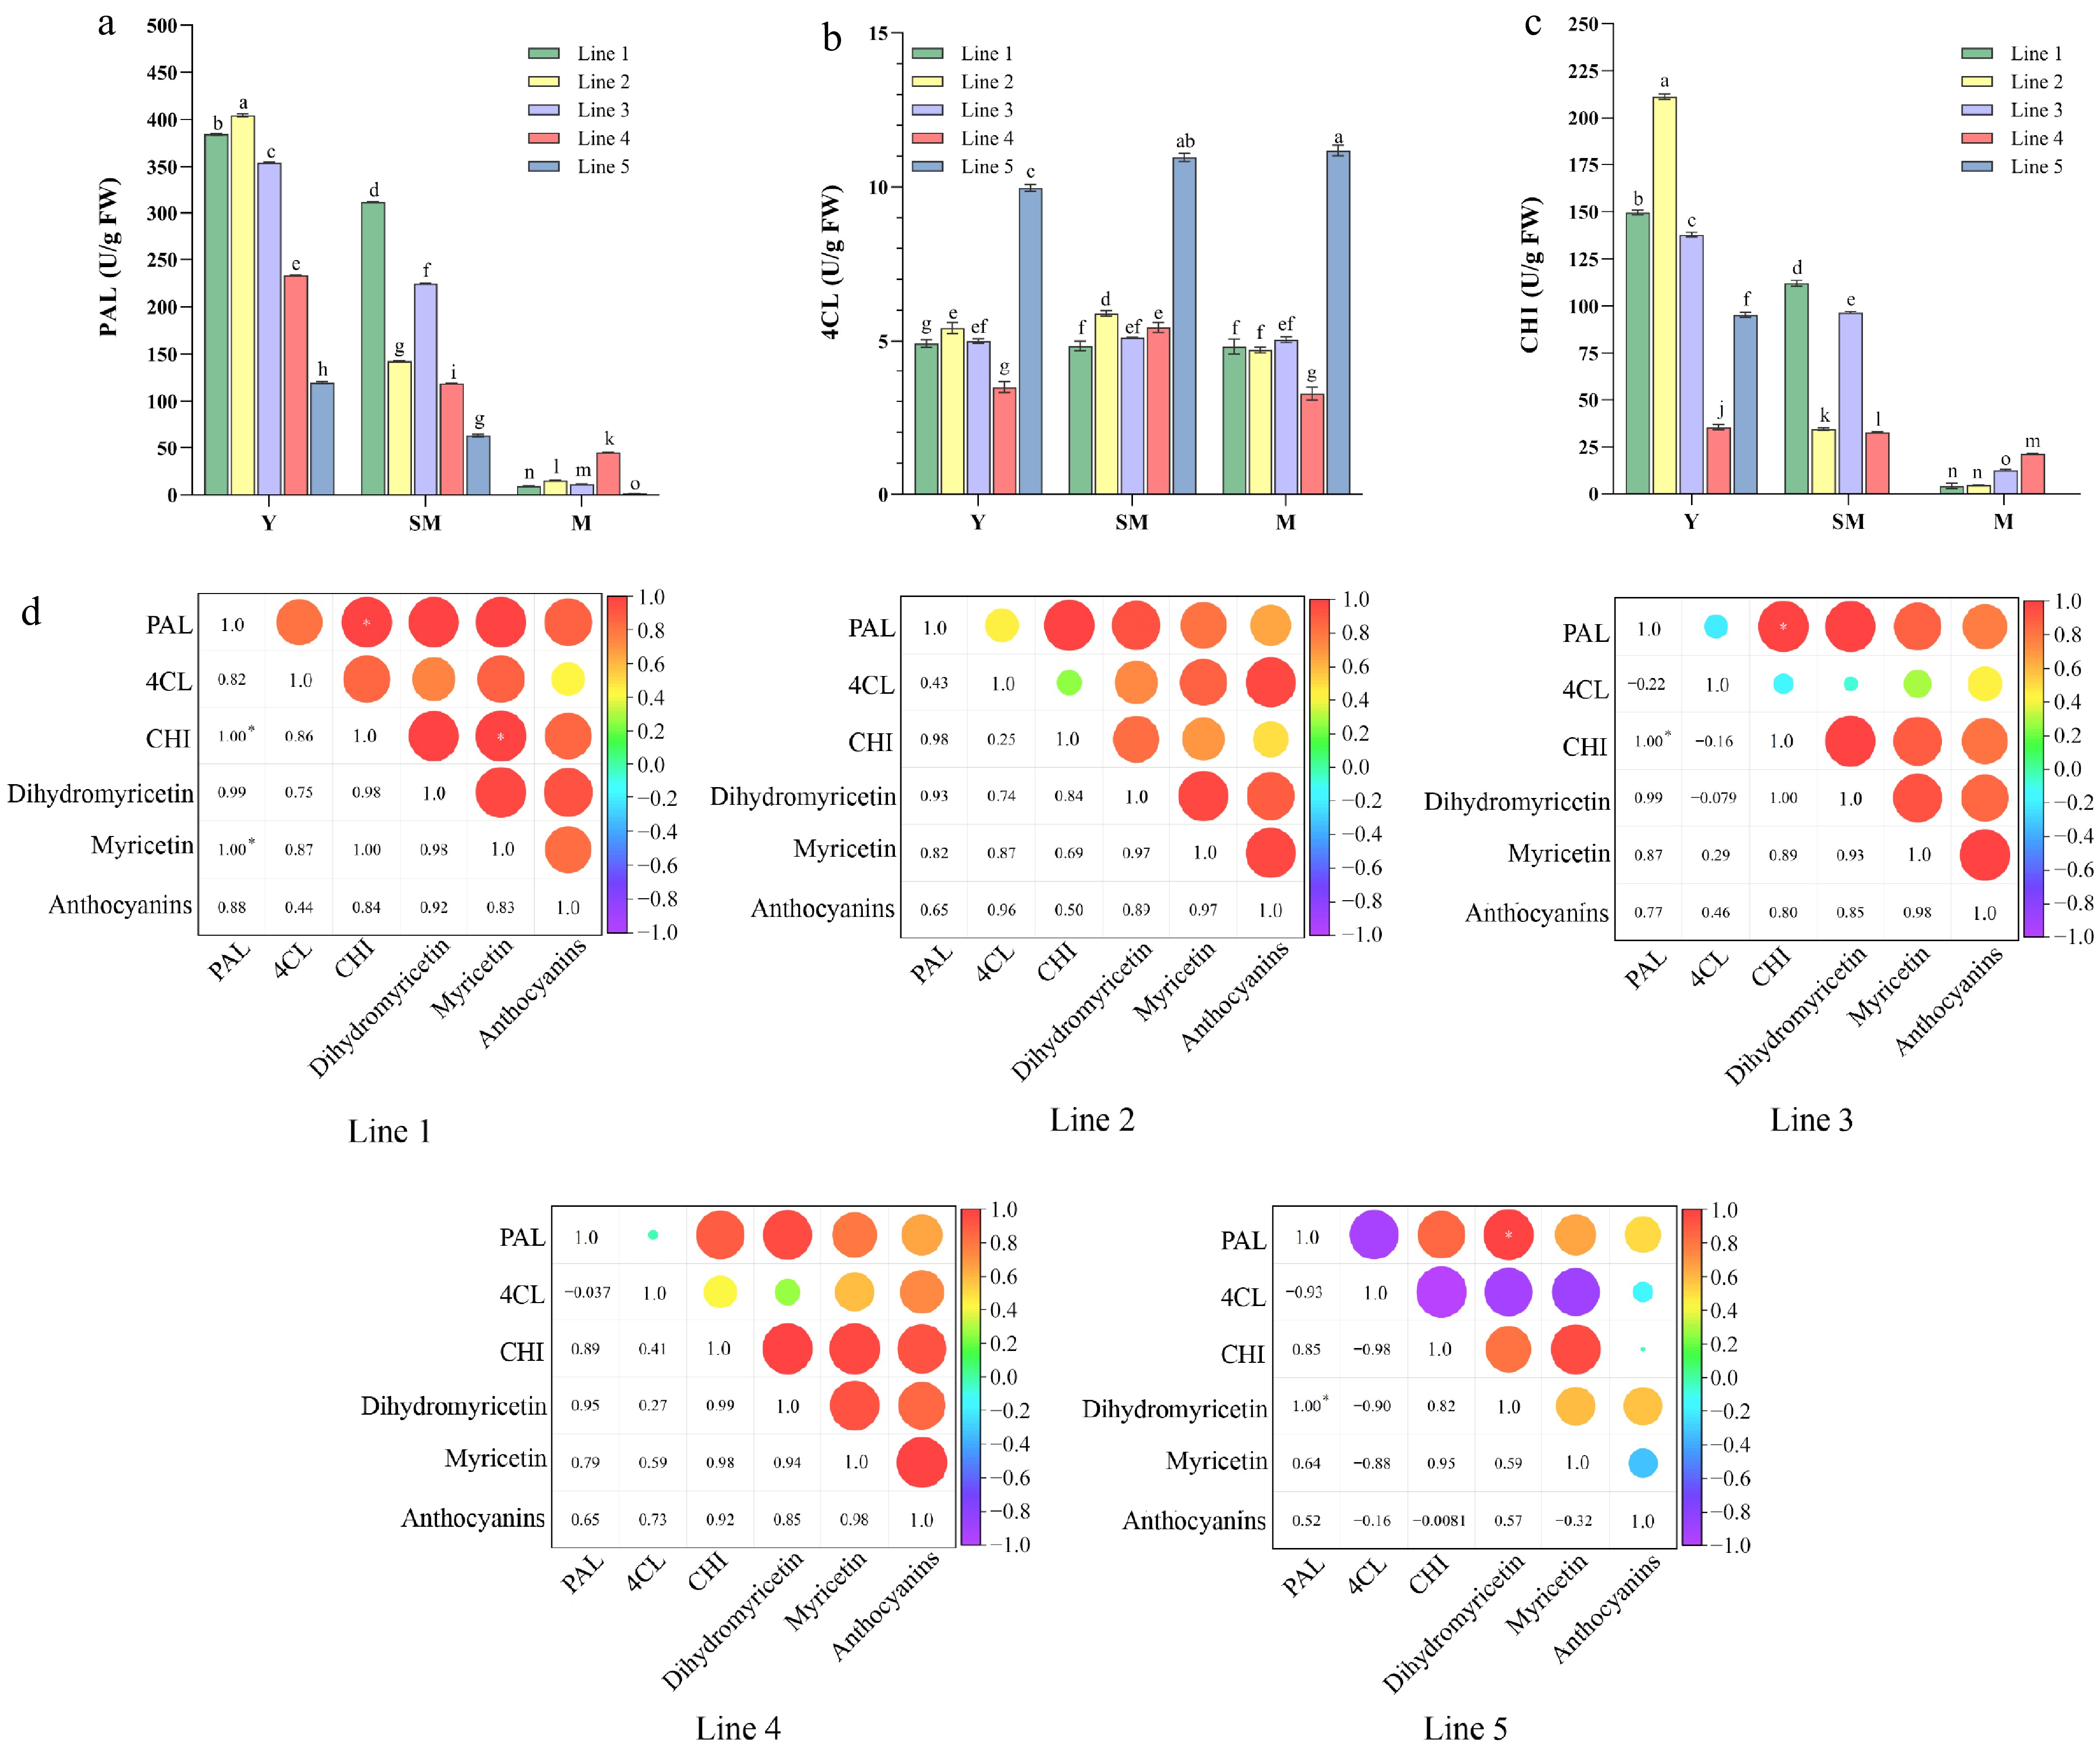
Figure 6.
Correlation analysis between enzyme activities and characteristic flavonoid contents. Note: 1, 2, 3, 4, and 5 represent line 1 'Chunlv Xiaoye Mei', line 2 'Boliang Mei', line 3 'Zixiangbian Mei', line 4 'Banshan Banzi Mei', and line 5 'Zimo Mei', respectively. (a)–(d) Represent PAL enzyme activity, 4CL enzyme activity, CHI enzyme activity, and the heatmap of correlations between characteristic flavonoid contents and key enzyme activities for each line, respectively. In panel d, the size of the circle represents the strength of the correlation, with color ranging from purple (negative correlation) to red (positive correlation); an asterisk (*) within a circle indicates a significant correlation (p < 0.05), and a double asterisk (**) indicates a highly significant correlation (p < 0.01).
-
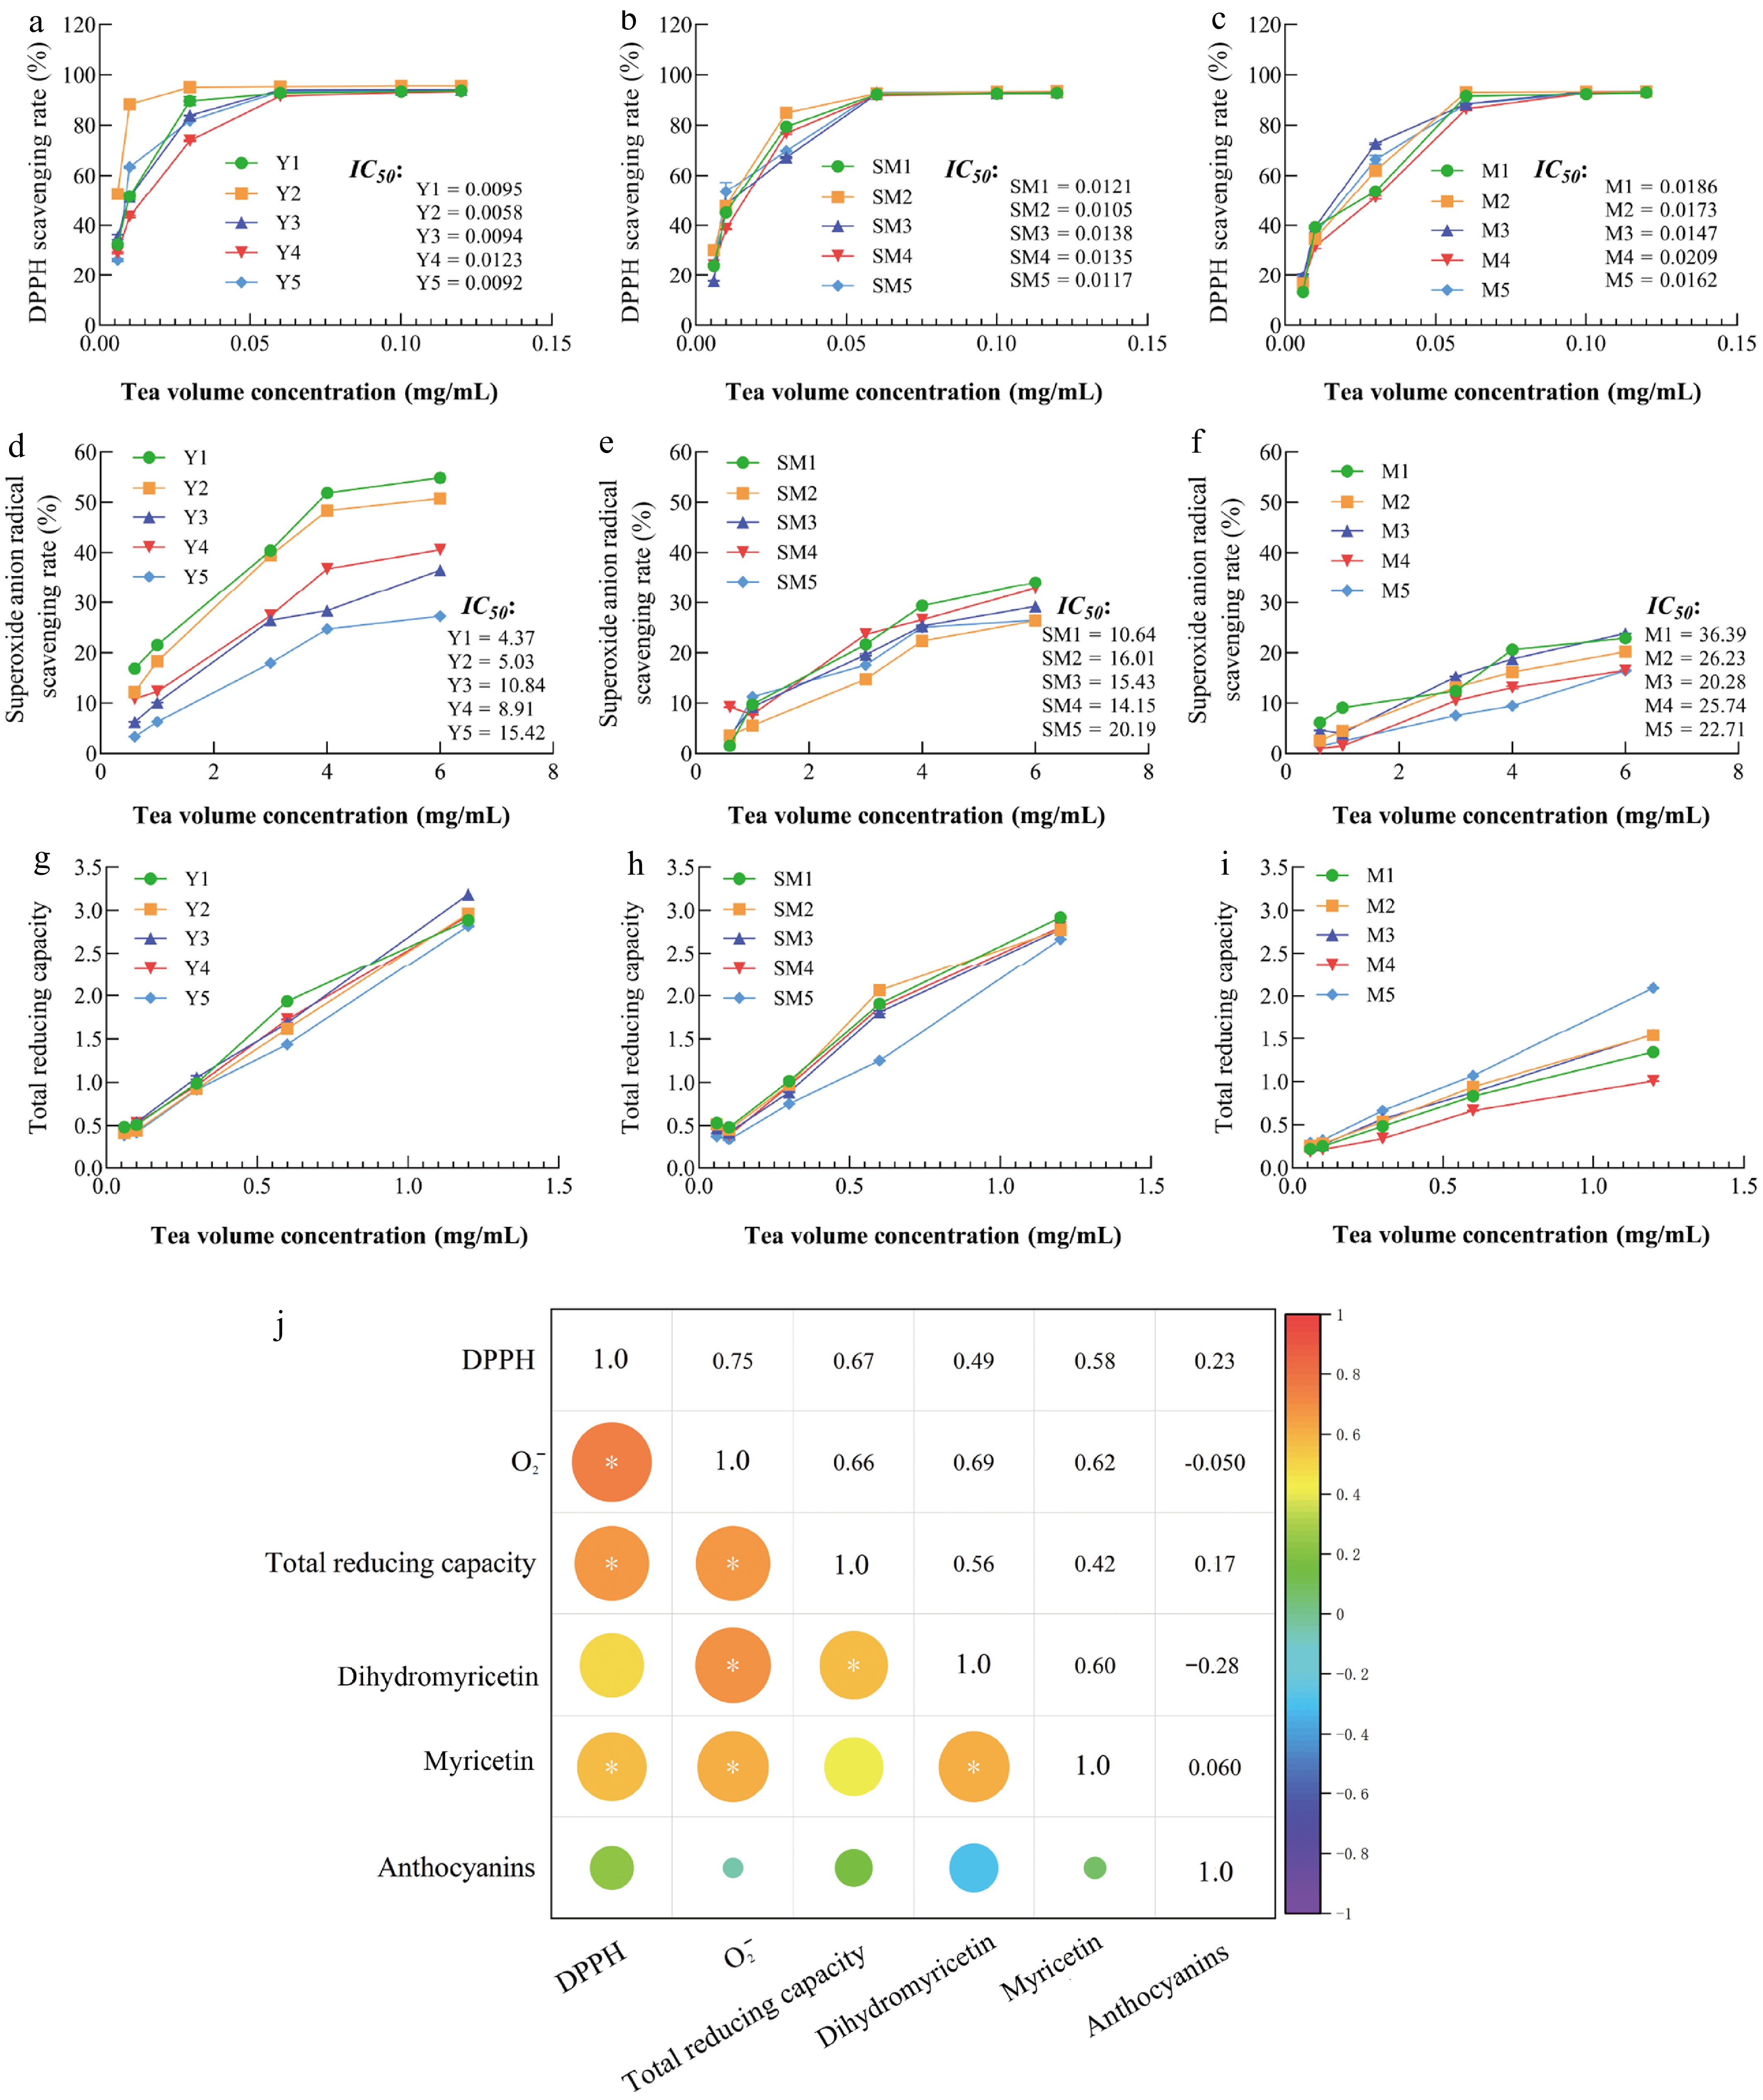
Figure 7.
Correlation analysis of overall antioxidant capacity and characteristic flavonoid content in the stems and leaves of five A. grossedentata lines. Note: 1, 2, 3, 4, and 5 represent line 1 'Chunlv Xiaoye Mei', line 2 'Boliang Mei', line 3 'Zixiangbian Mei', line 4 'Banshan Banzi Mei', and line 5 'Zimo Mei', respectively. Y, SM, and M denote young, semi-mature, and mature stems and leaves, respectively. (a)–(c) Represent DPPH radical scavenging activity (including IC50) of Y, SM, and M stage samples, respectively. (d)–(f) Represent superoxide anion scavenging activity (including IC50) of Y, SM, and M stage samples, respectively. (g)–(i) Represent the total reducing power of Y, SM, and M stage samples, respectively. (j) The heatmap of the correlation between the flavonoid content and the in vitro antioxidant activity of the features; in panel j, the size of the circle represents the strength of the correlation, with color ranging from purple (negative correlation) to red (positive correlation); an asterisk (*) within a circle indicates a significant correlation (p < 0.05), and a double asterisk (**) indicates a highly significant correlation (p < 0.01).
Figures
(7)
Tables
(0)