-
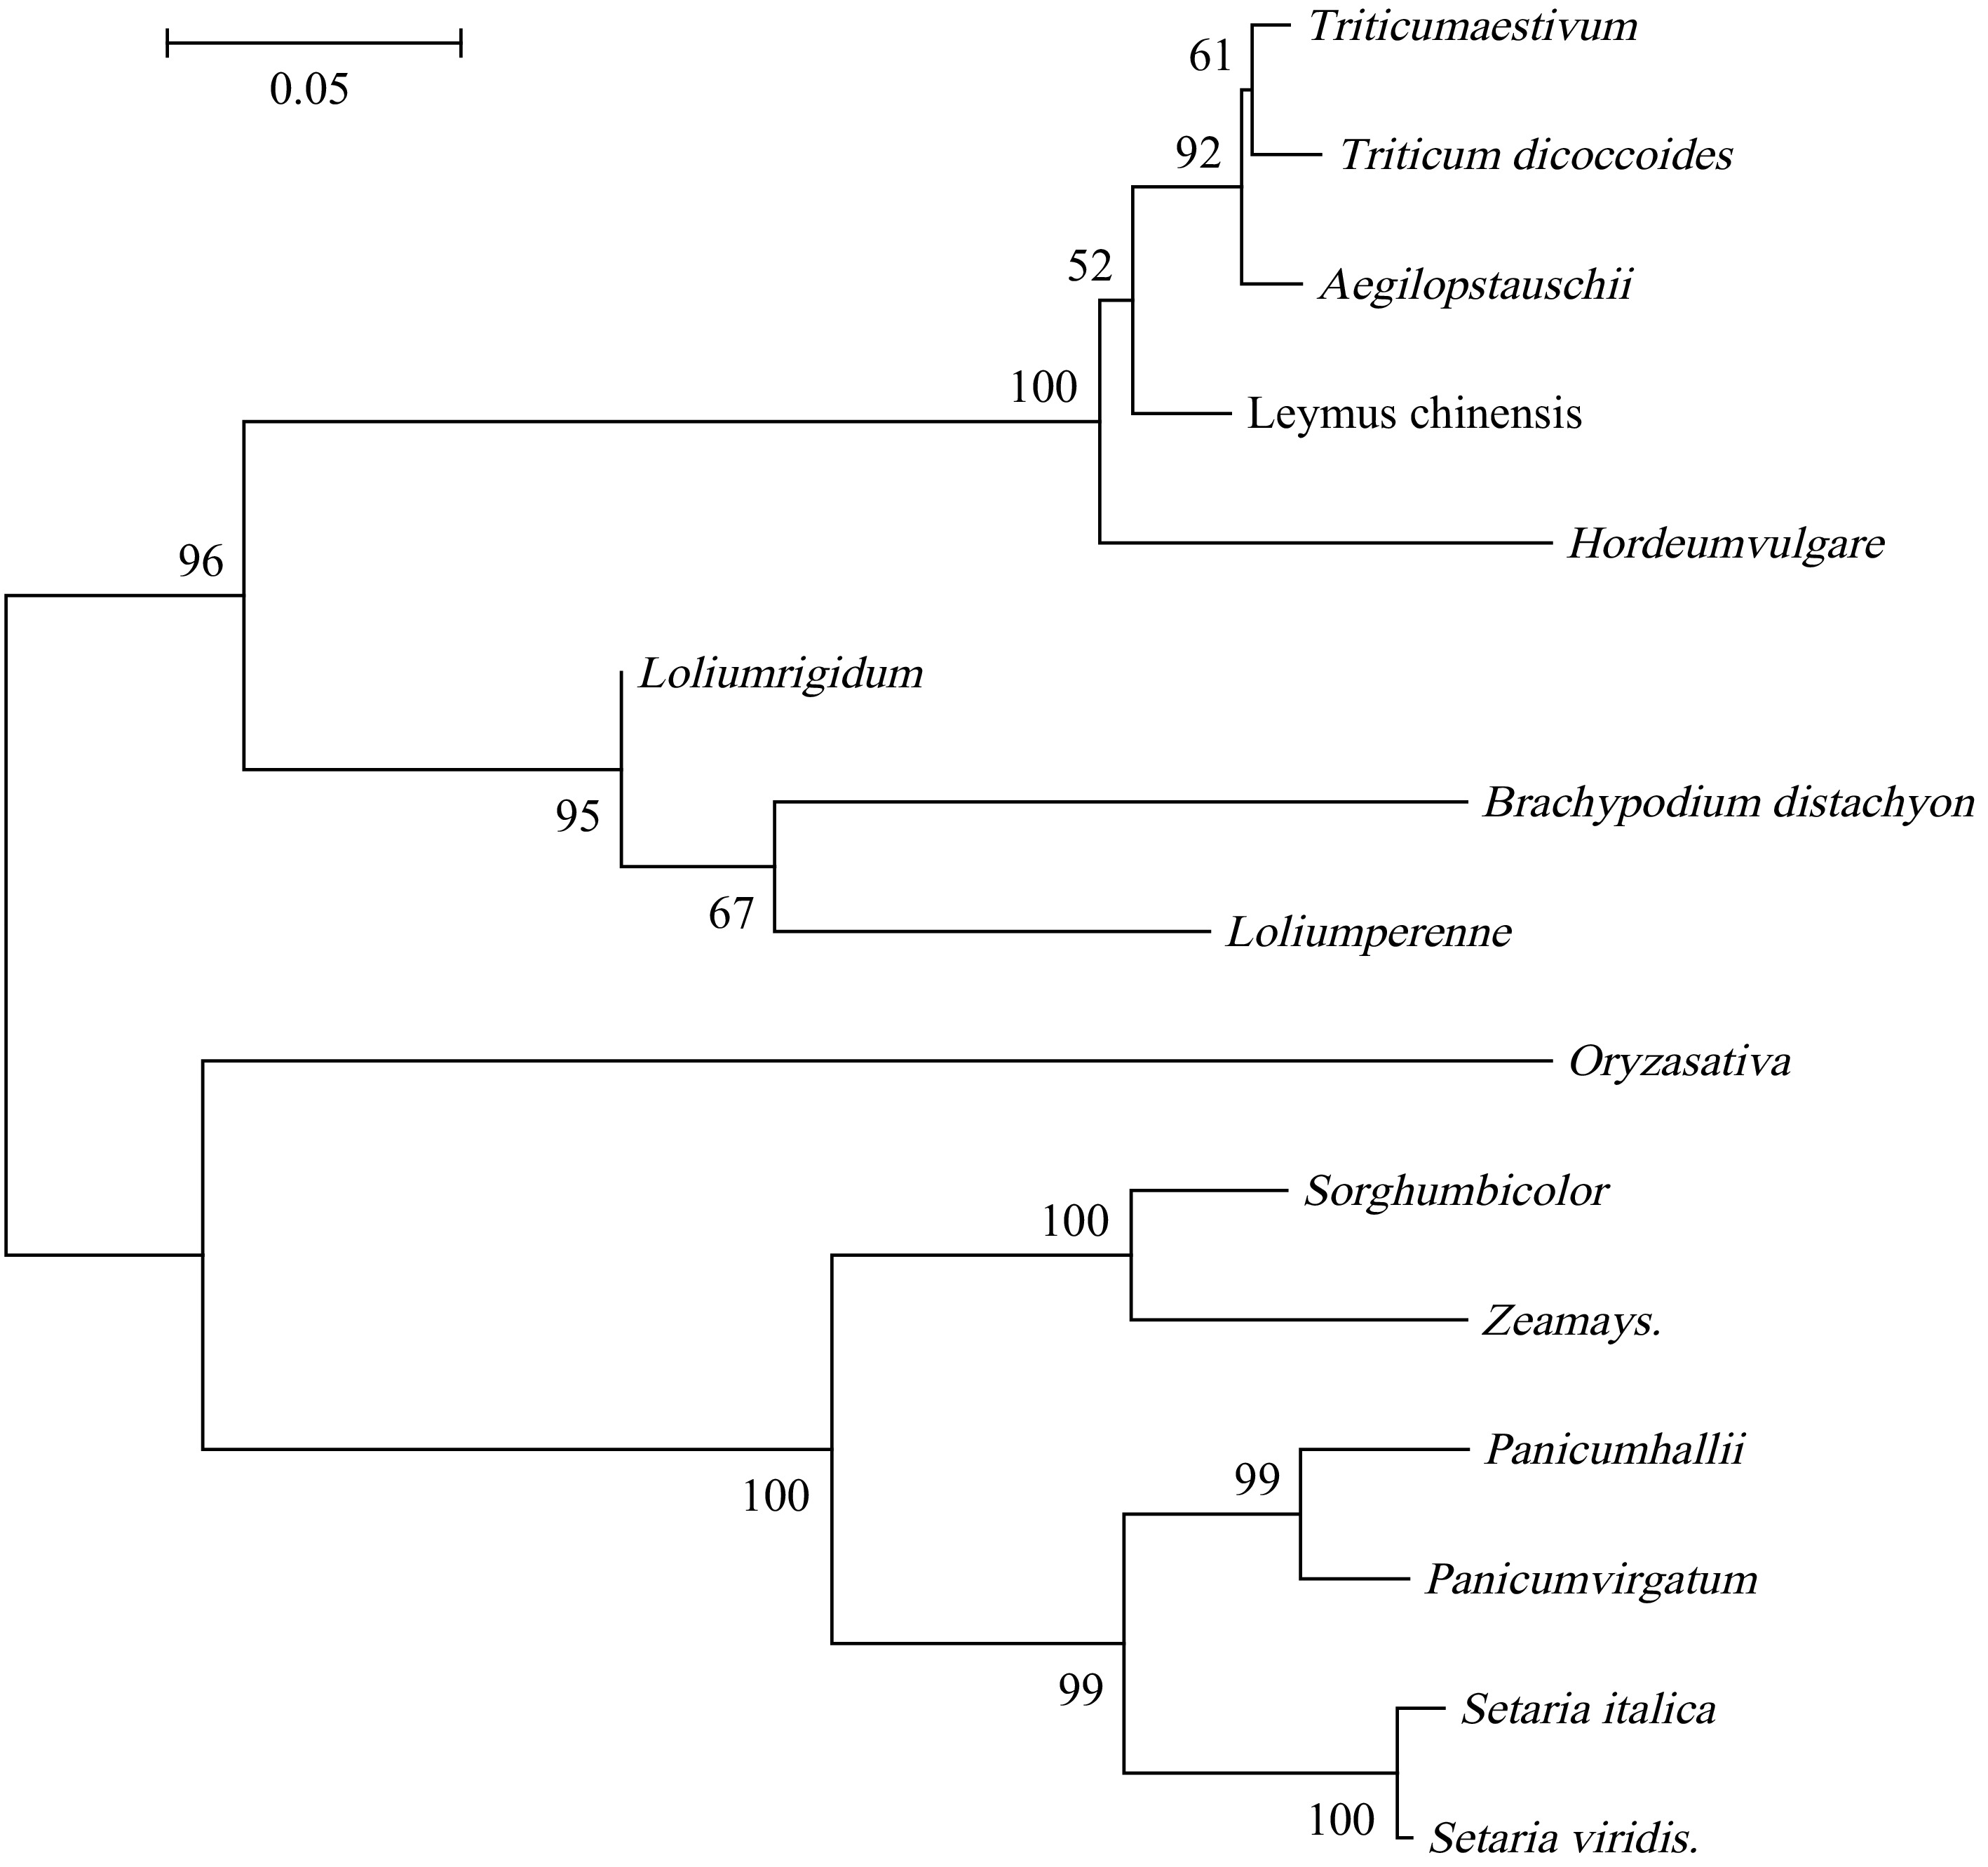
Figure 1.
Phylogenetic tree constructed based on multiple alignments of homologous sequences.
-
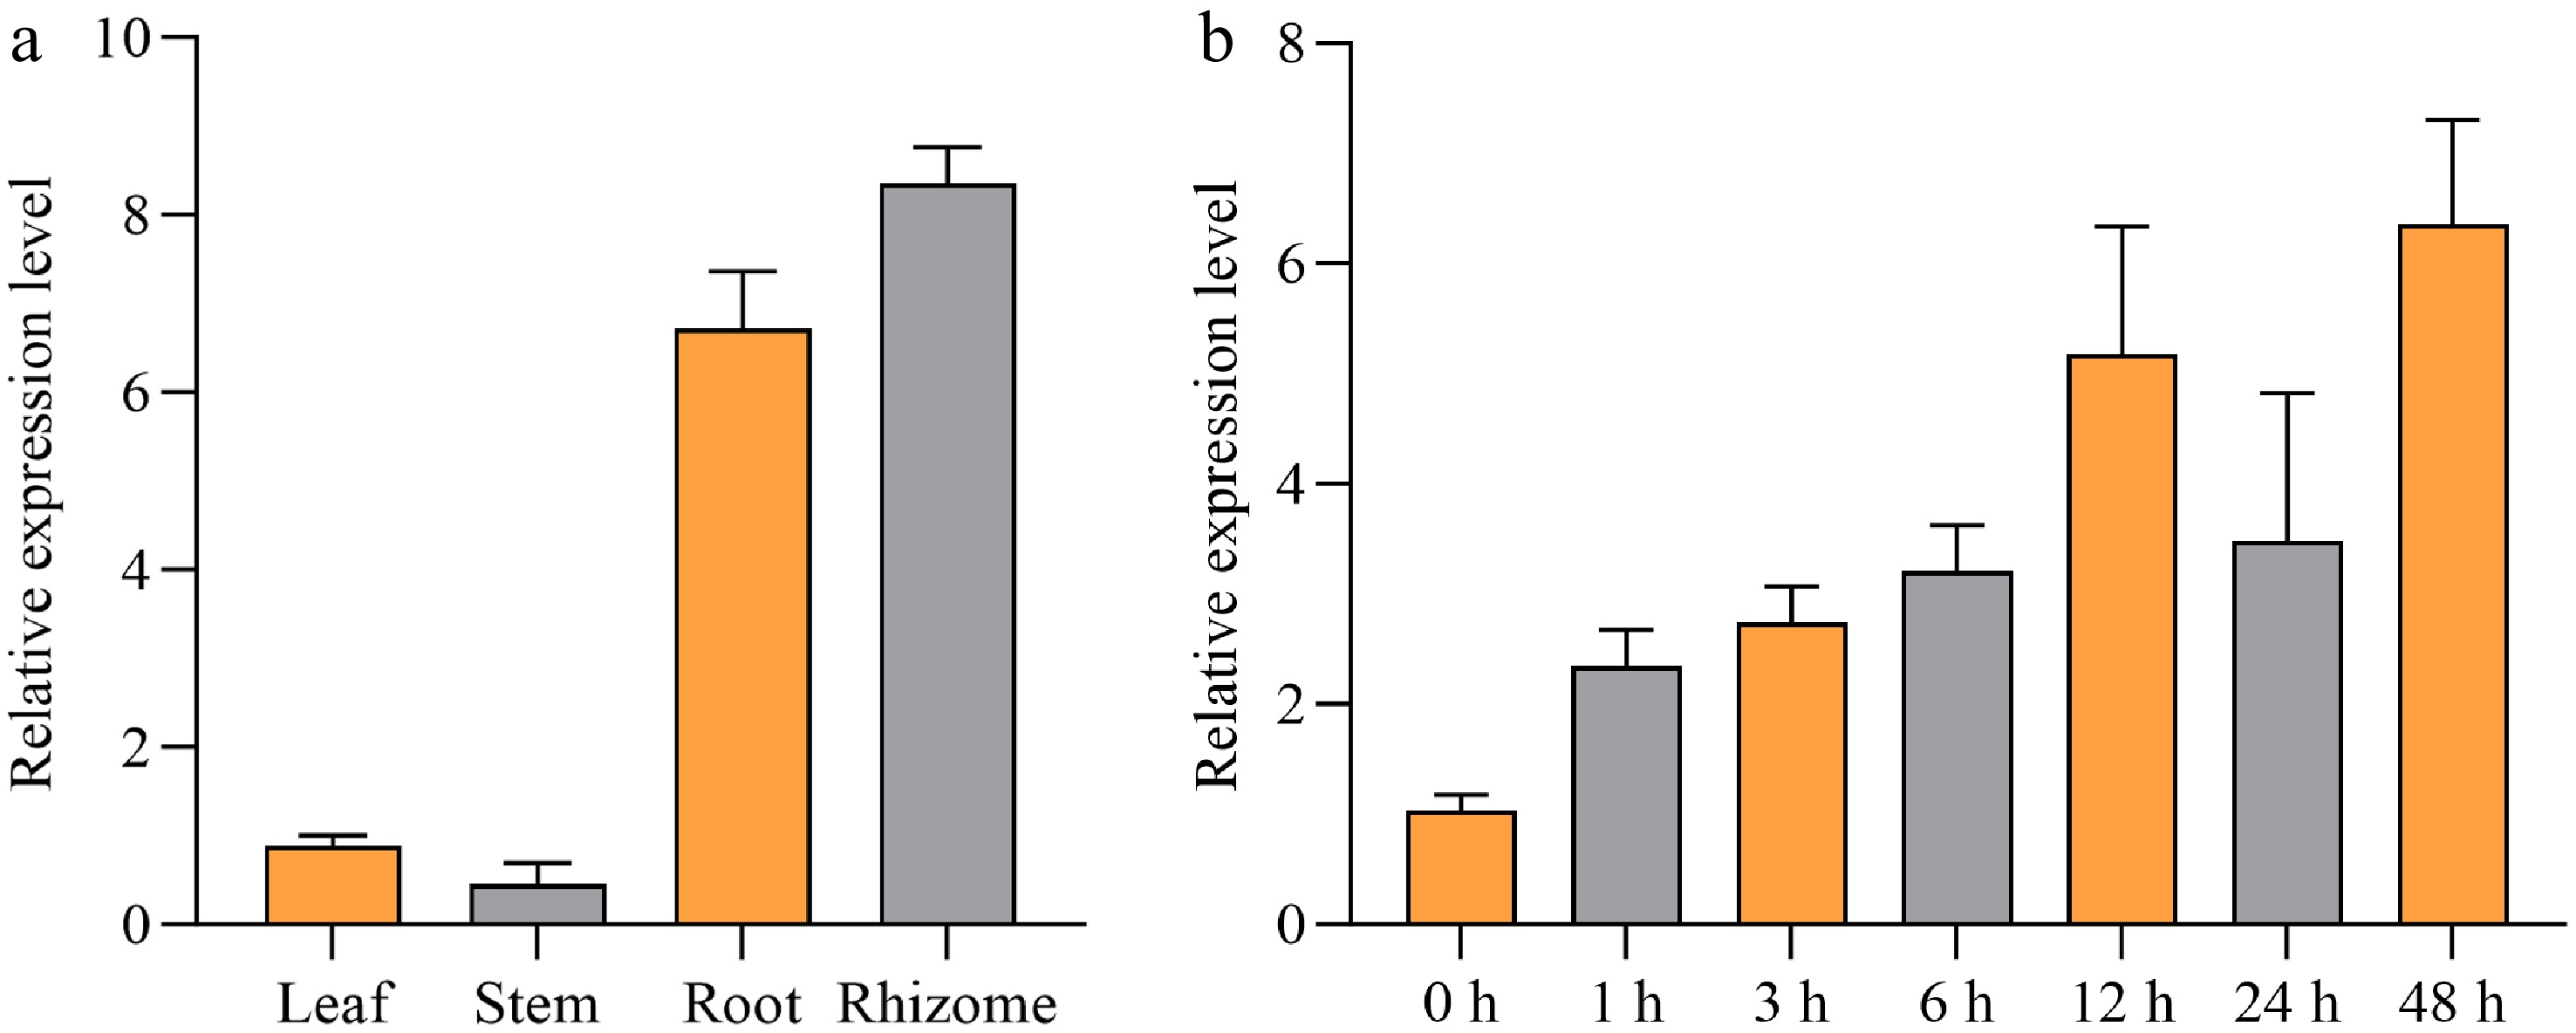
Figure 2.
Tissue-specific expression of LcAT1 in Leymus chinensis and its induction by alkaline stress. (a) qRT-PCR analysis of LcAT1 expression in leaves, stems, fibrous roots, and underground stolons under normal conditions. The Actin gene was used as an internal control. Values represent the mean ± SE of three biological replicates. (b) Time-course expression analysis of LcAT1 in roots of L. chinensis under 75 mmol/L alkaline stress at the indicated times (0−48 h). The Actin gene was used as an internal control. Values represent the mean ± SE of three biological replicates.
-
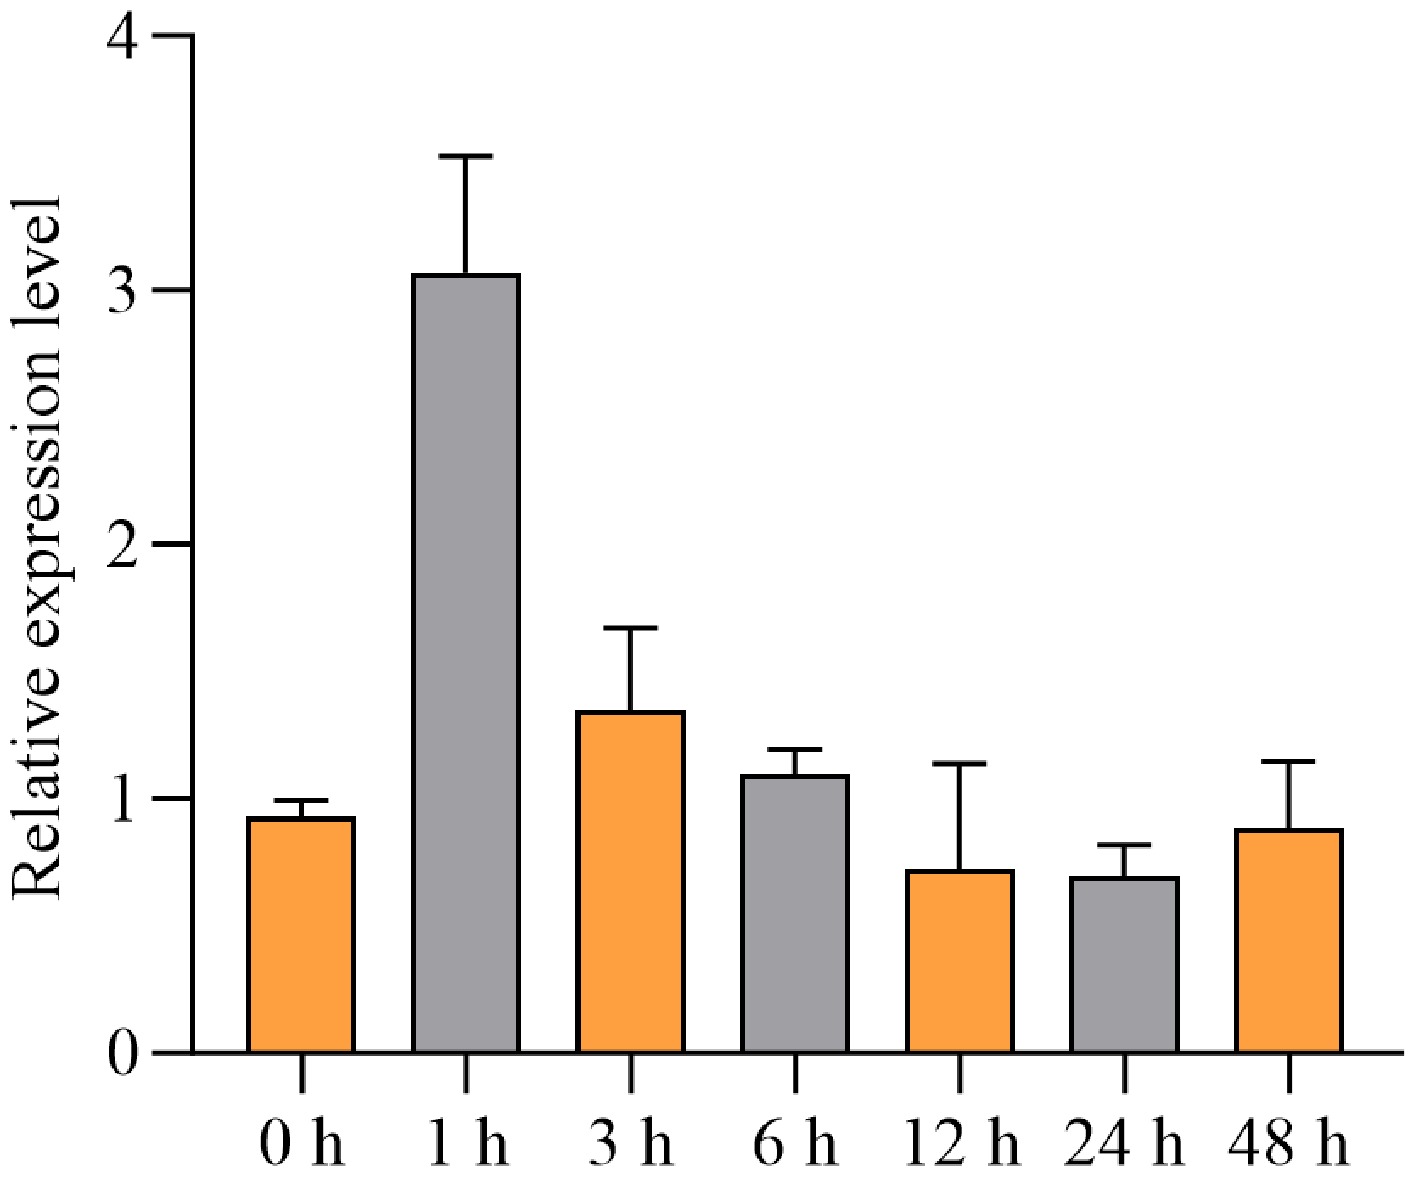
Figure 3.
Time-course qRT-PCR analysis of LcAT1 expression in roots of transgenic rice overexpressing LcAT1 following treatment with 75 mmol/L alkaline solution at the indicated times (0−48 h). The rice Actin gene was used as an internal control. Values represent the mean ± SE of three biological replicates.
-
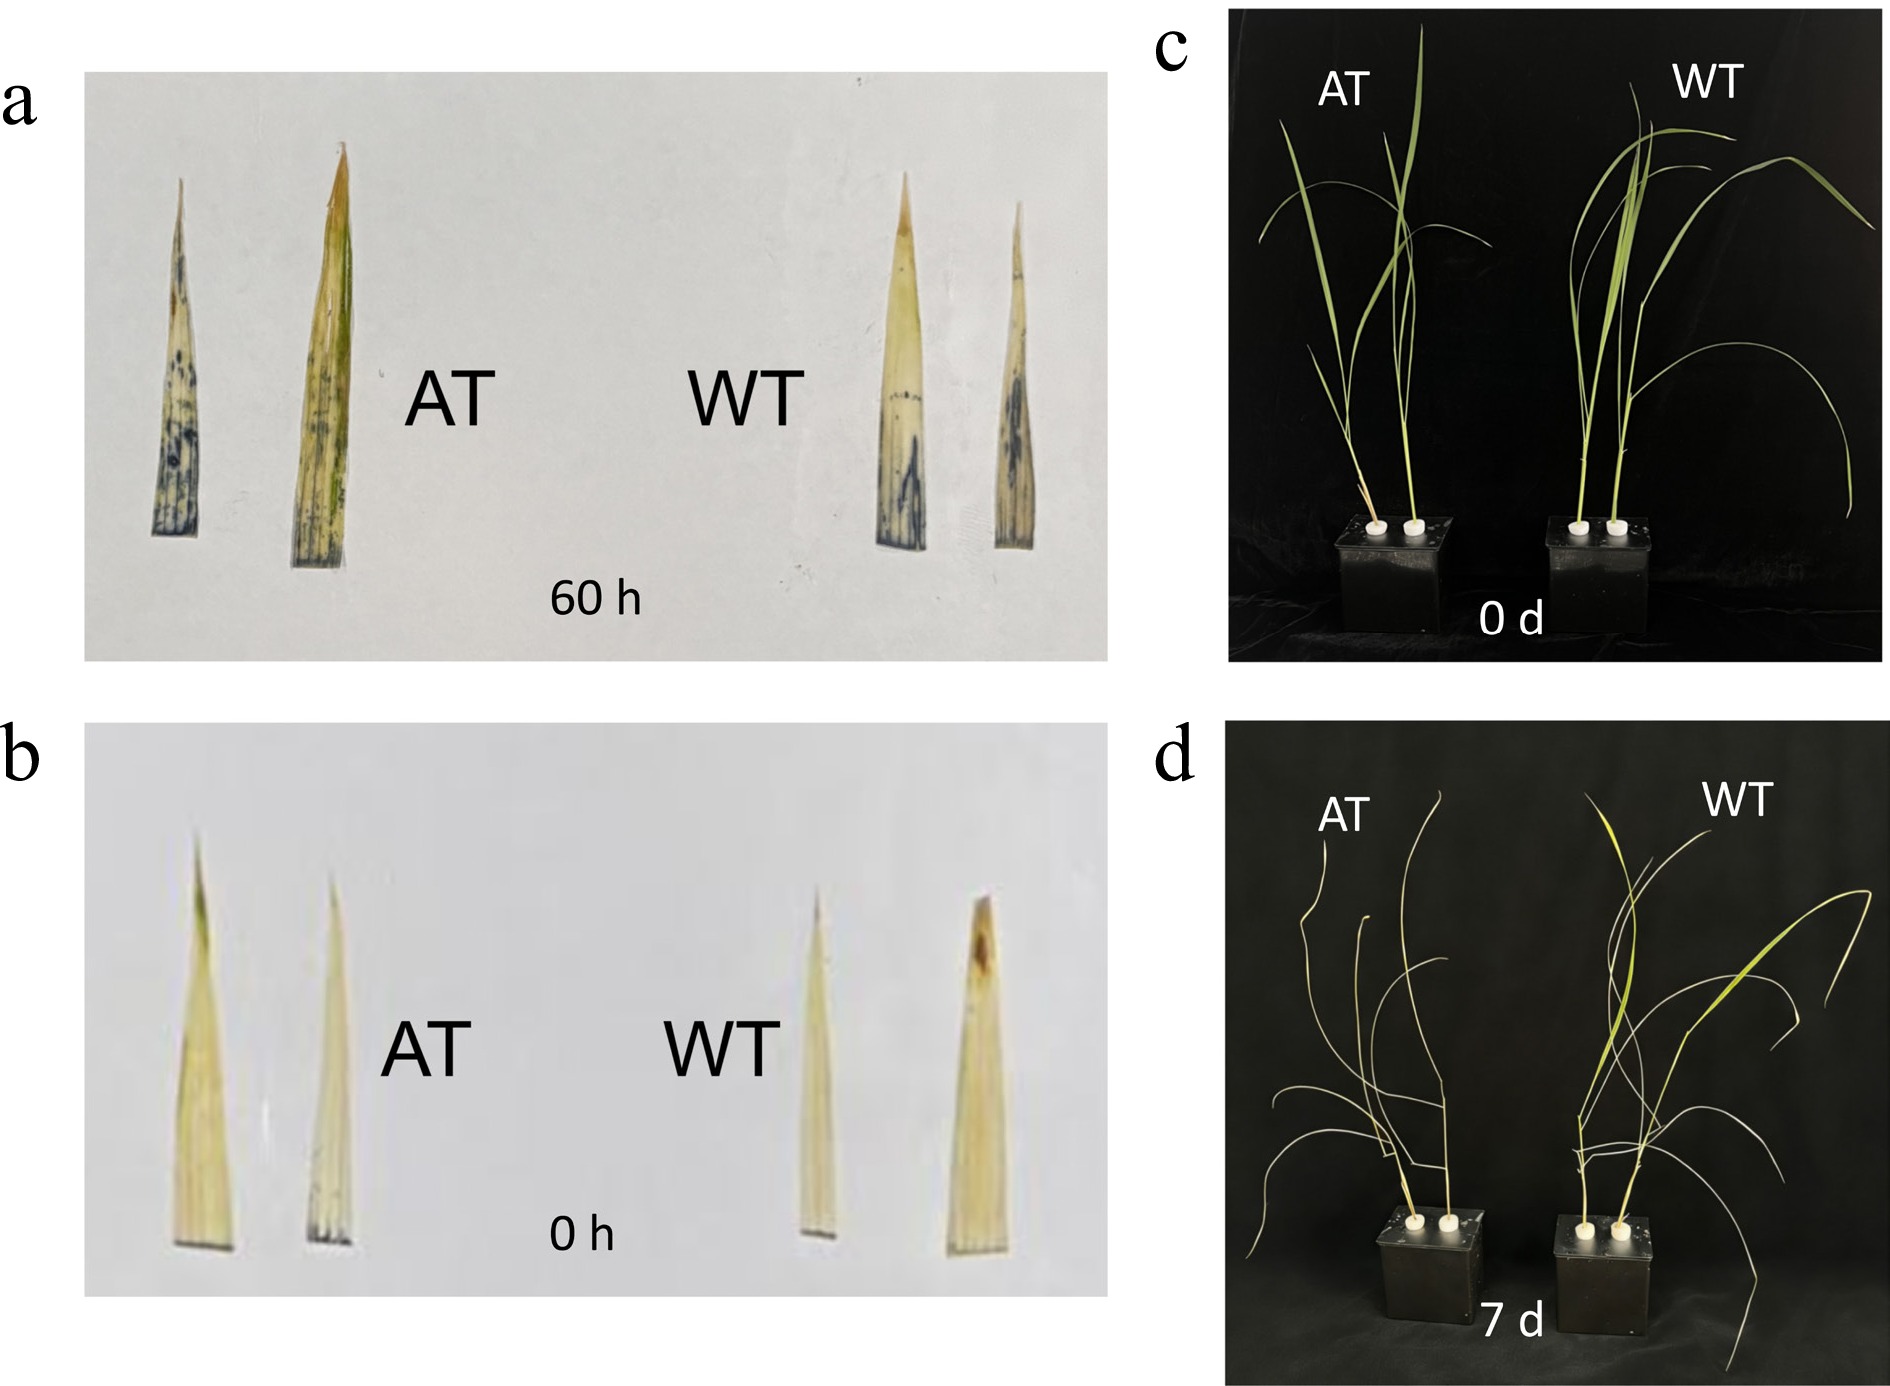
Figure 4.
Superoxide accumulation and phenotypic responses of wild-type and LcAT1-overexpressing rice under alkaline stress. NBT staining of leaves (a) before treatment and (b) after treatment with 75 mmol/L mixed alkali for 60 h. Dark blue coloration indicates superoxide anion (O2−) accumulation. (c) Wild-type (WT) and transgenic rice plants overexpressing LcAT1 before alkaline stress treatment. (d) WT and transgenic rice plants after treatment with 75 mmol/L alkaline solution.
-
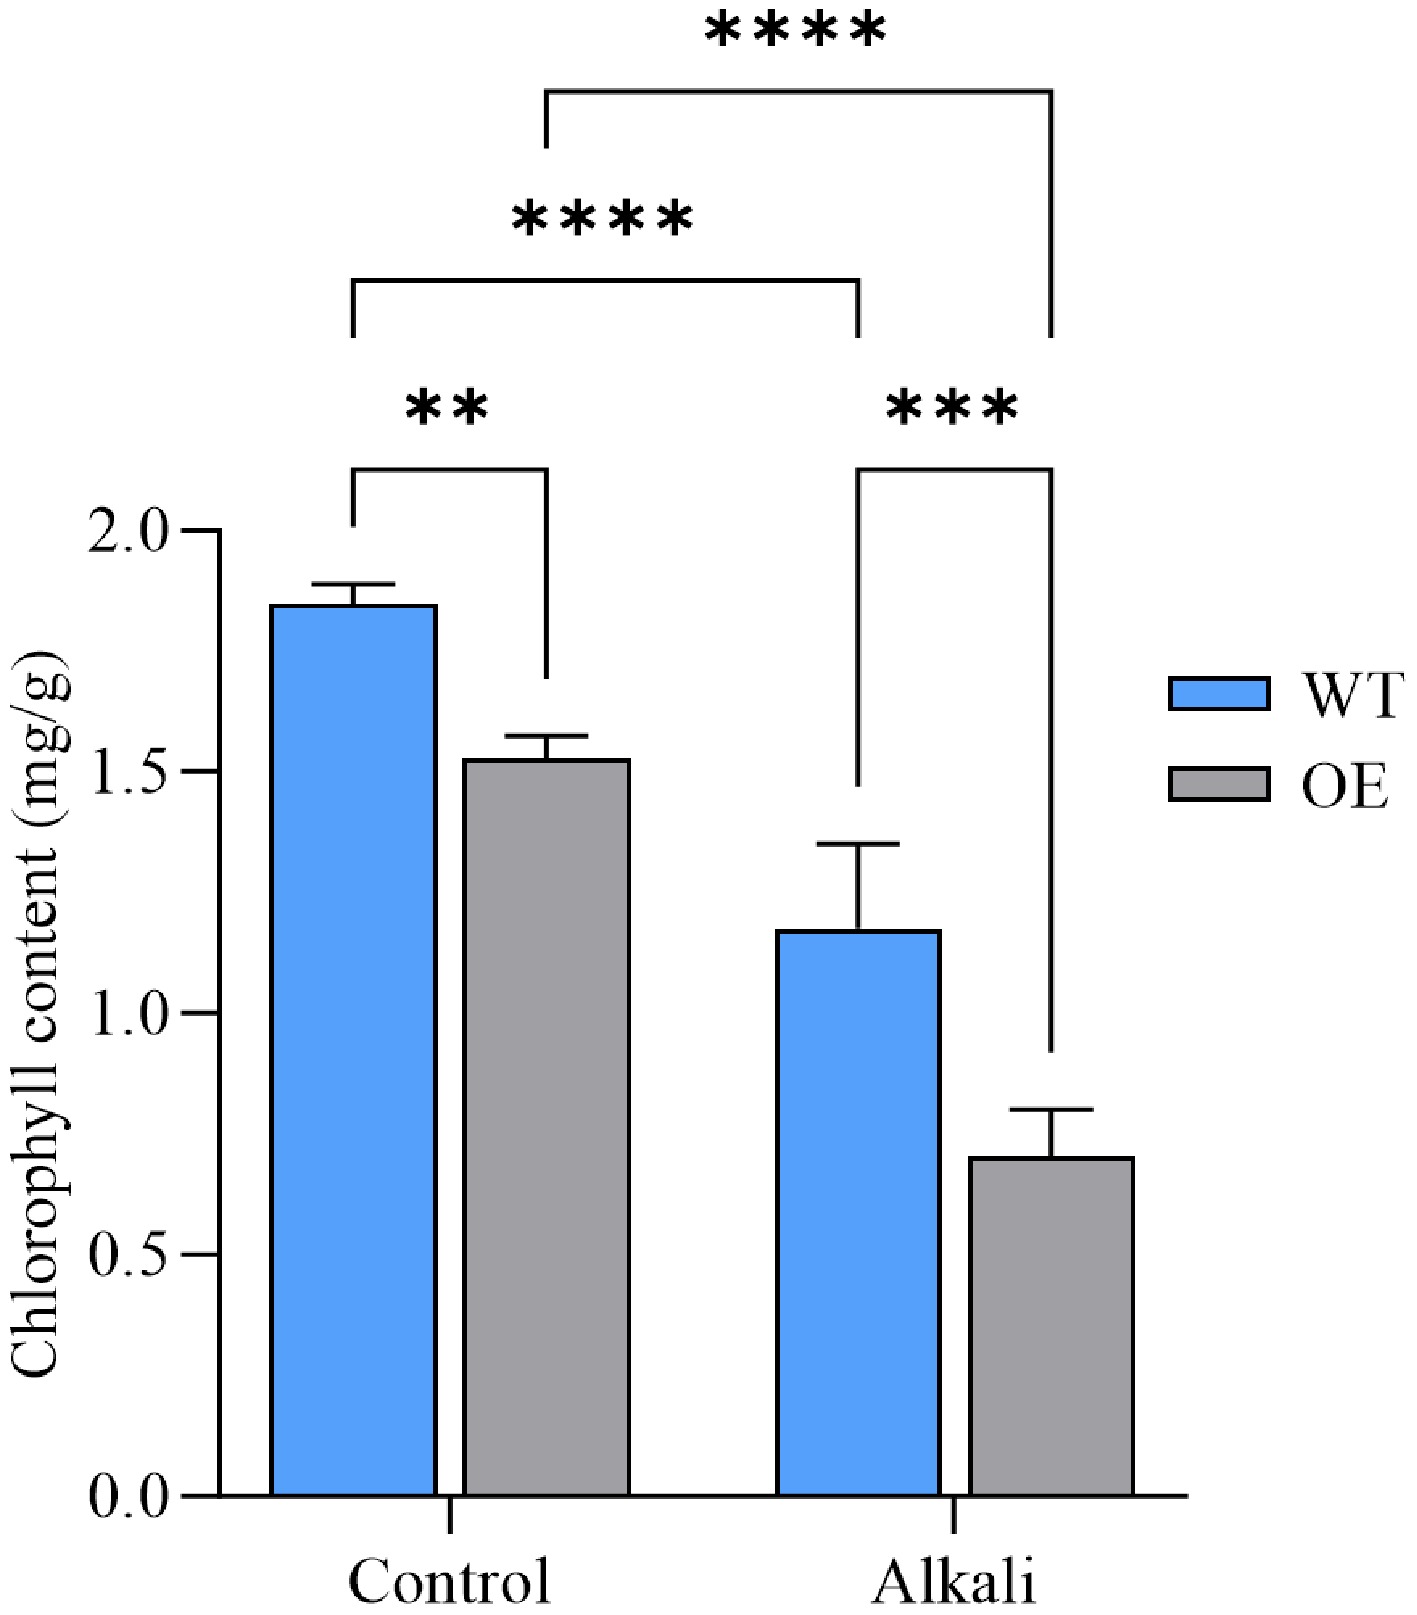
Figure 5.
Chlorophyll content in wild-type and LcAT1-overexpressing transgenic rice under alkaline stress. WT denotes wild-type rice, OE denotes LcAT1-overexpressing rice, and Control and Alkali denote treatment with water and 75 mmol/L alkaline solution, respectively. Data are means ± SD (n = 3). Two-way ANOVA with genotype and treatment as factors. ns, not significant; * p < 0.05; ** p < 0.01; *** p < 0.001; and **** p < 0.0001.
-
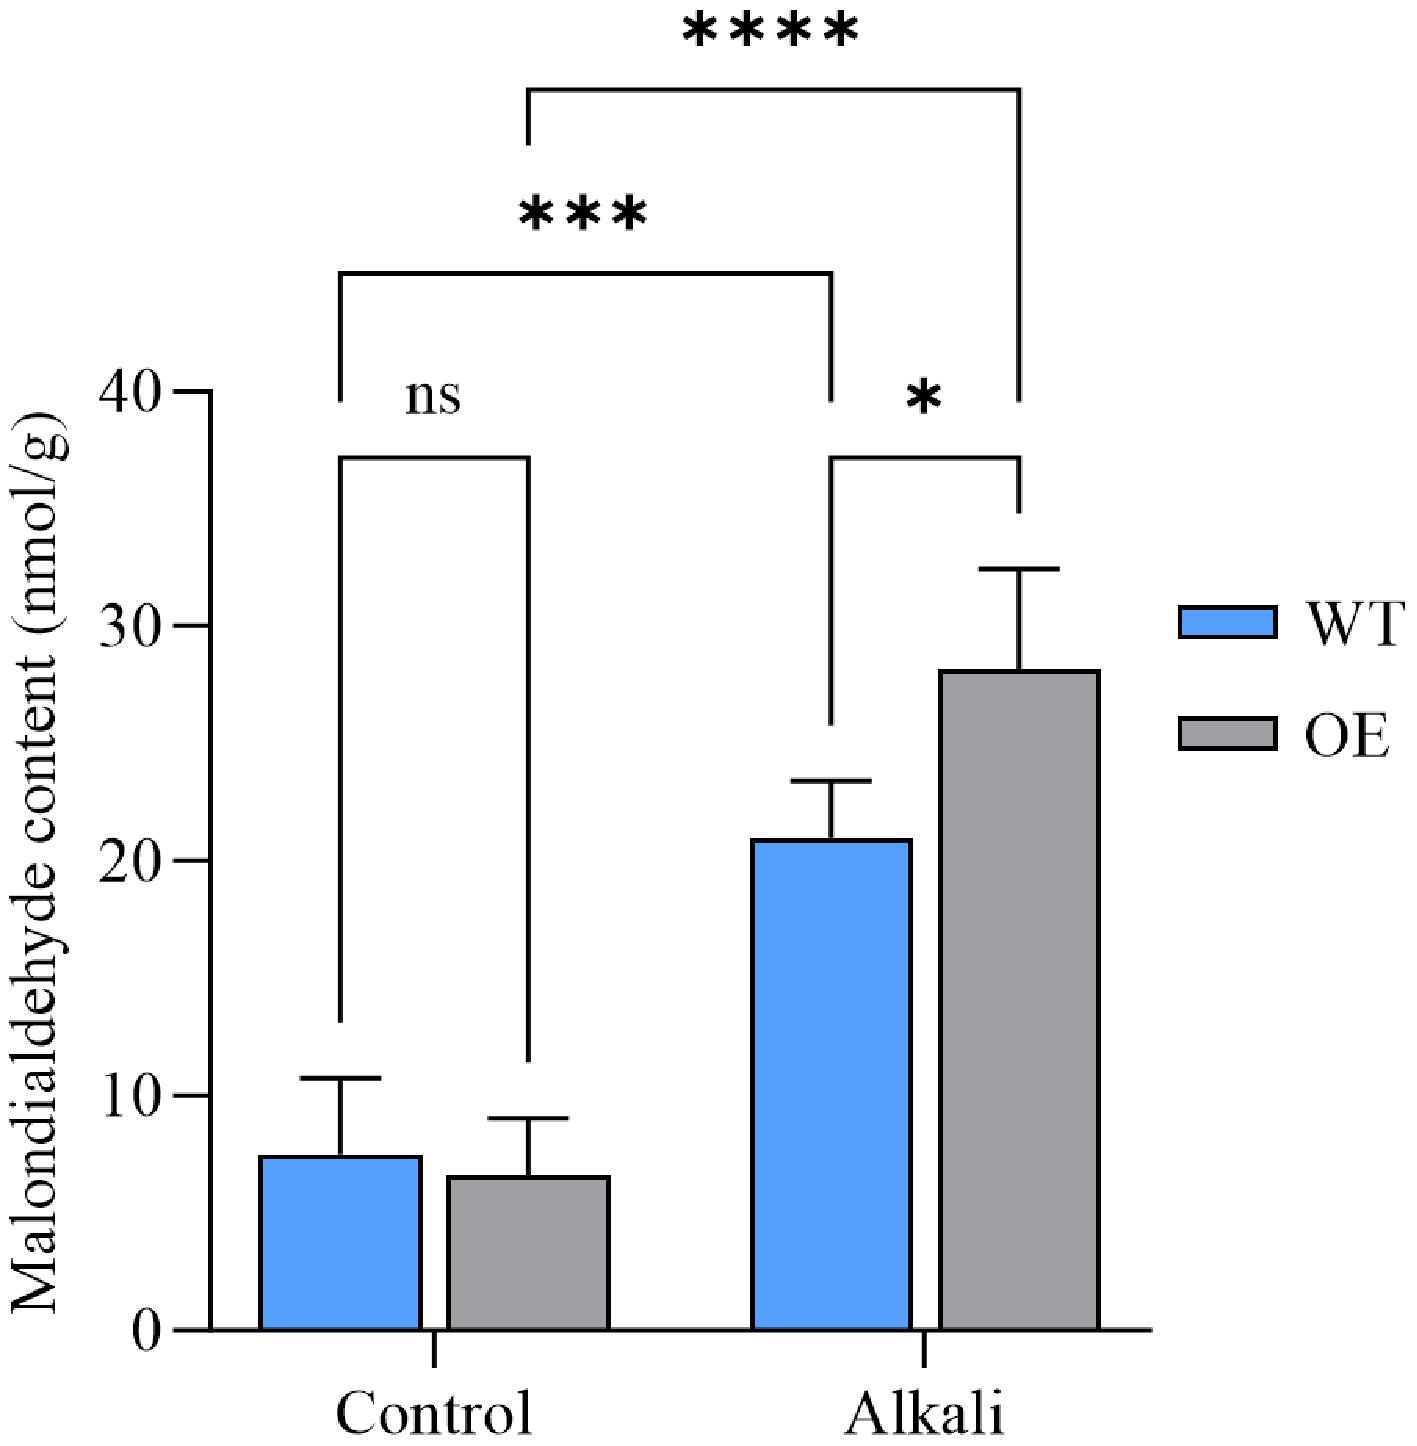
Figure 6.
Malondialdehyde (MDA) content in wild-type and LcAT1-overexpressing transgenic rice under alkaline stress. WT denotes wild-type rice, OE denotes LcAT1-overexpressing rice, and 'Control' and 'Alkali' denote treatment with water and 75 mmol/L alkaline solution, respectively. Data are means ± SD (n = 3). Two-way ANOVA with genotype and treatment as factors. ns, not significant; * p < 0.05; ** p < 0.01; *** p < 0.001; and **** p < 0.0001.
-
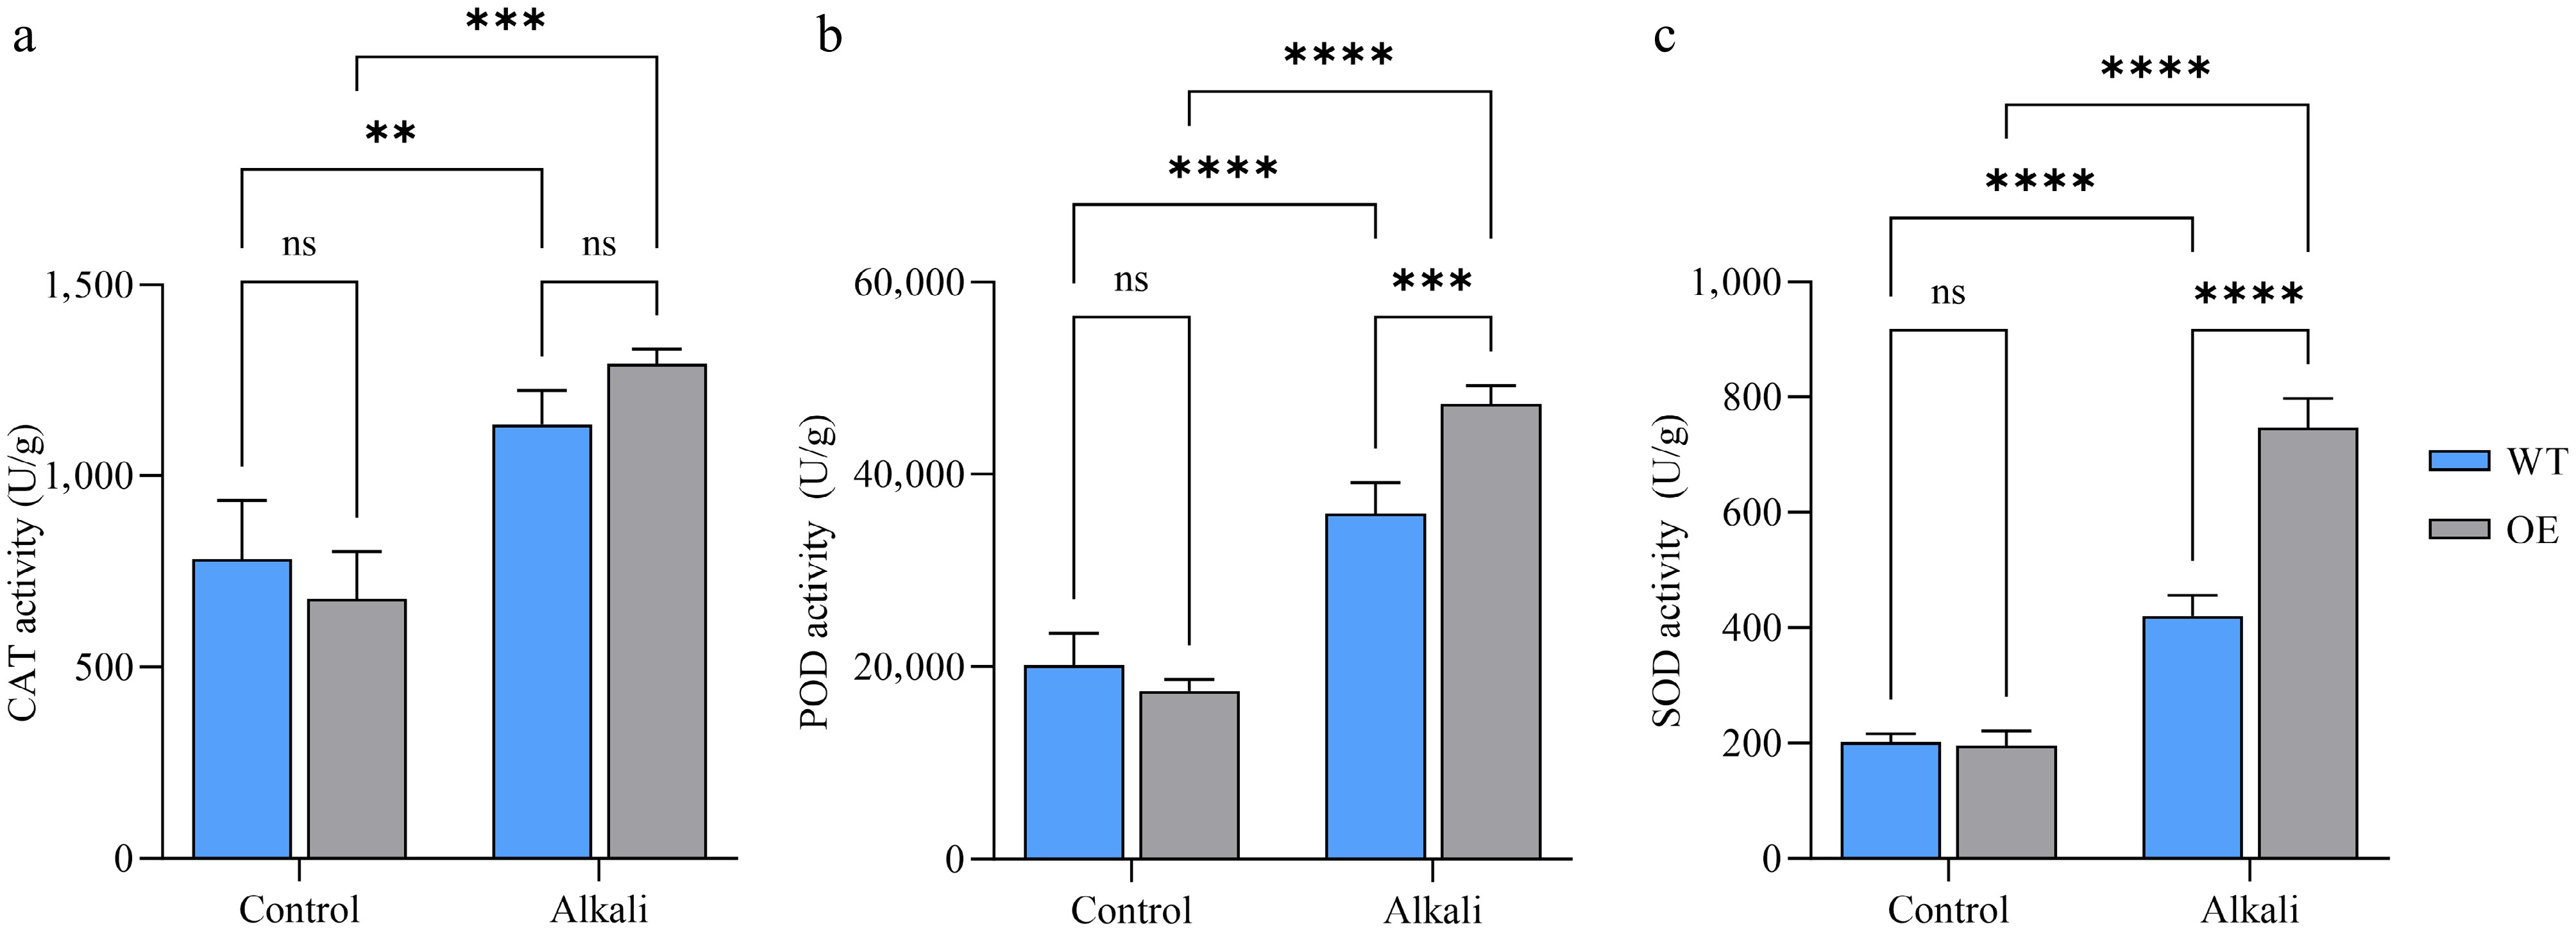
Figure 7.
Changes in antioxidant enzyme activity. (a) Changes in catalase activity. (b) Changes in peroxidase activity. (c) Changes in superoxide dismutase activity. WT denotes wild-type rice, OE denotes LcAT1-overexpressing rice, and 'Control' and 'Alkali' denote treatment with water and 75 mmol/L alkaline solution, respectively. Data are means ± SD (n = 3). Two-way ANOVA with genotype and treatment as factors. ns, not significant; * p < 0.05; ** p < 0.01; *** p < 0.001; and **** p < 0.0001.
-
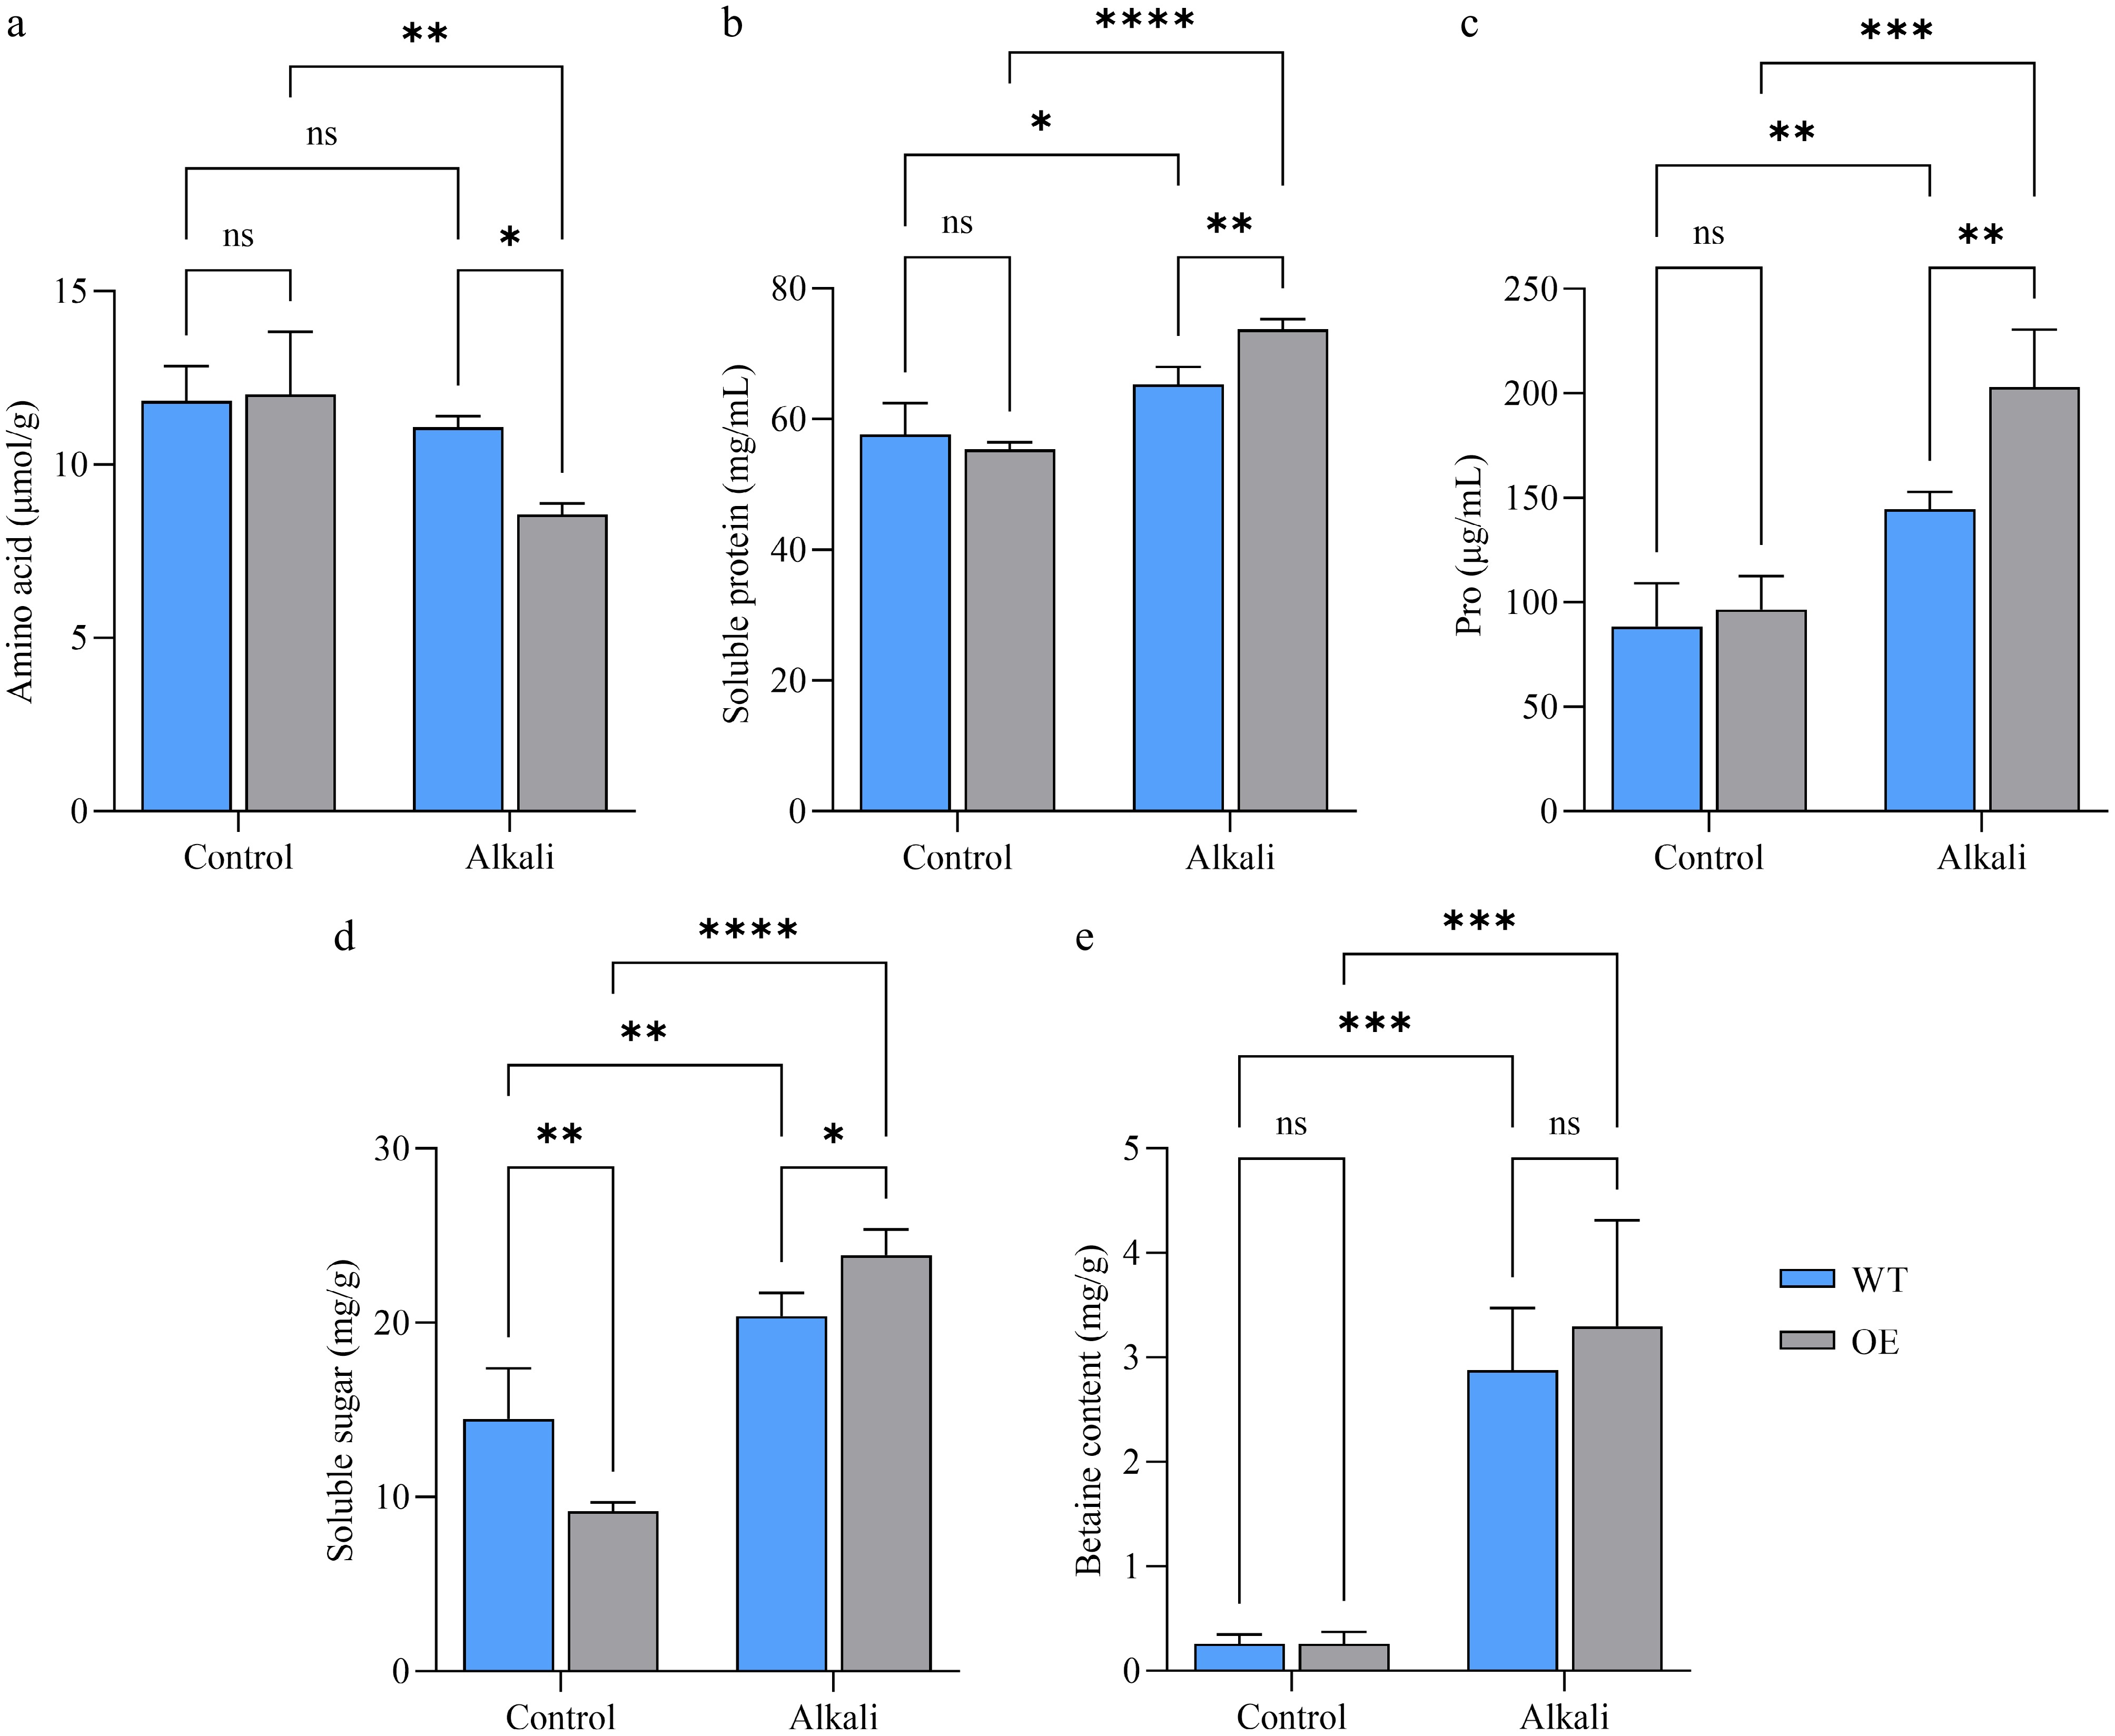
Figure 8.
Changes in osmoregulatory substance content. (a) Changes in amino acid content. (b) Changes in soluble protein content. (c) Changes in proline content. (d) Changes in soluble sugar content. (e) Changes in betaine content. WT denotes wild-type rice, OE denotes LcAT1-overexpressing rice, and 'Control' and 'Alkali' denote treatment with water and 75 mmol/L alkaline solution, respectively. Data are means ± SD (n = 3). Two-way ANOVA with genotype and treatment as factors. ns, not significant; * p < 0.05; ** p < 0.01; *** p < 0.001; and **** p < 0.0001.
Figures
(8)
Tables
(0)