-
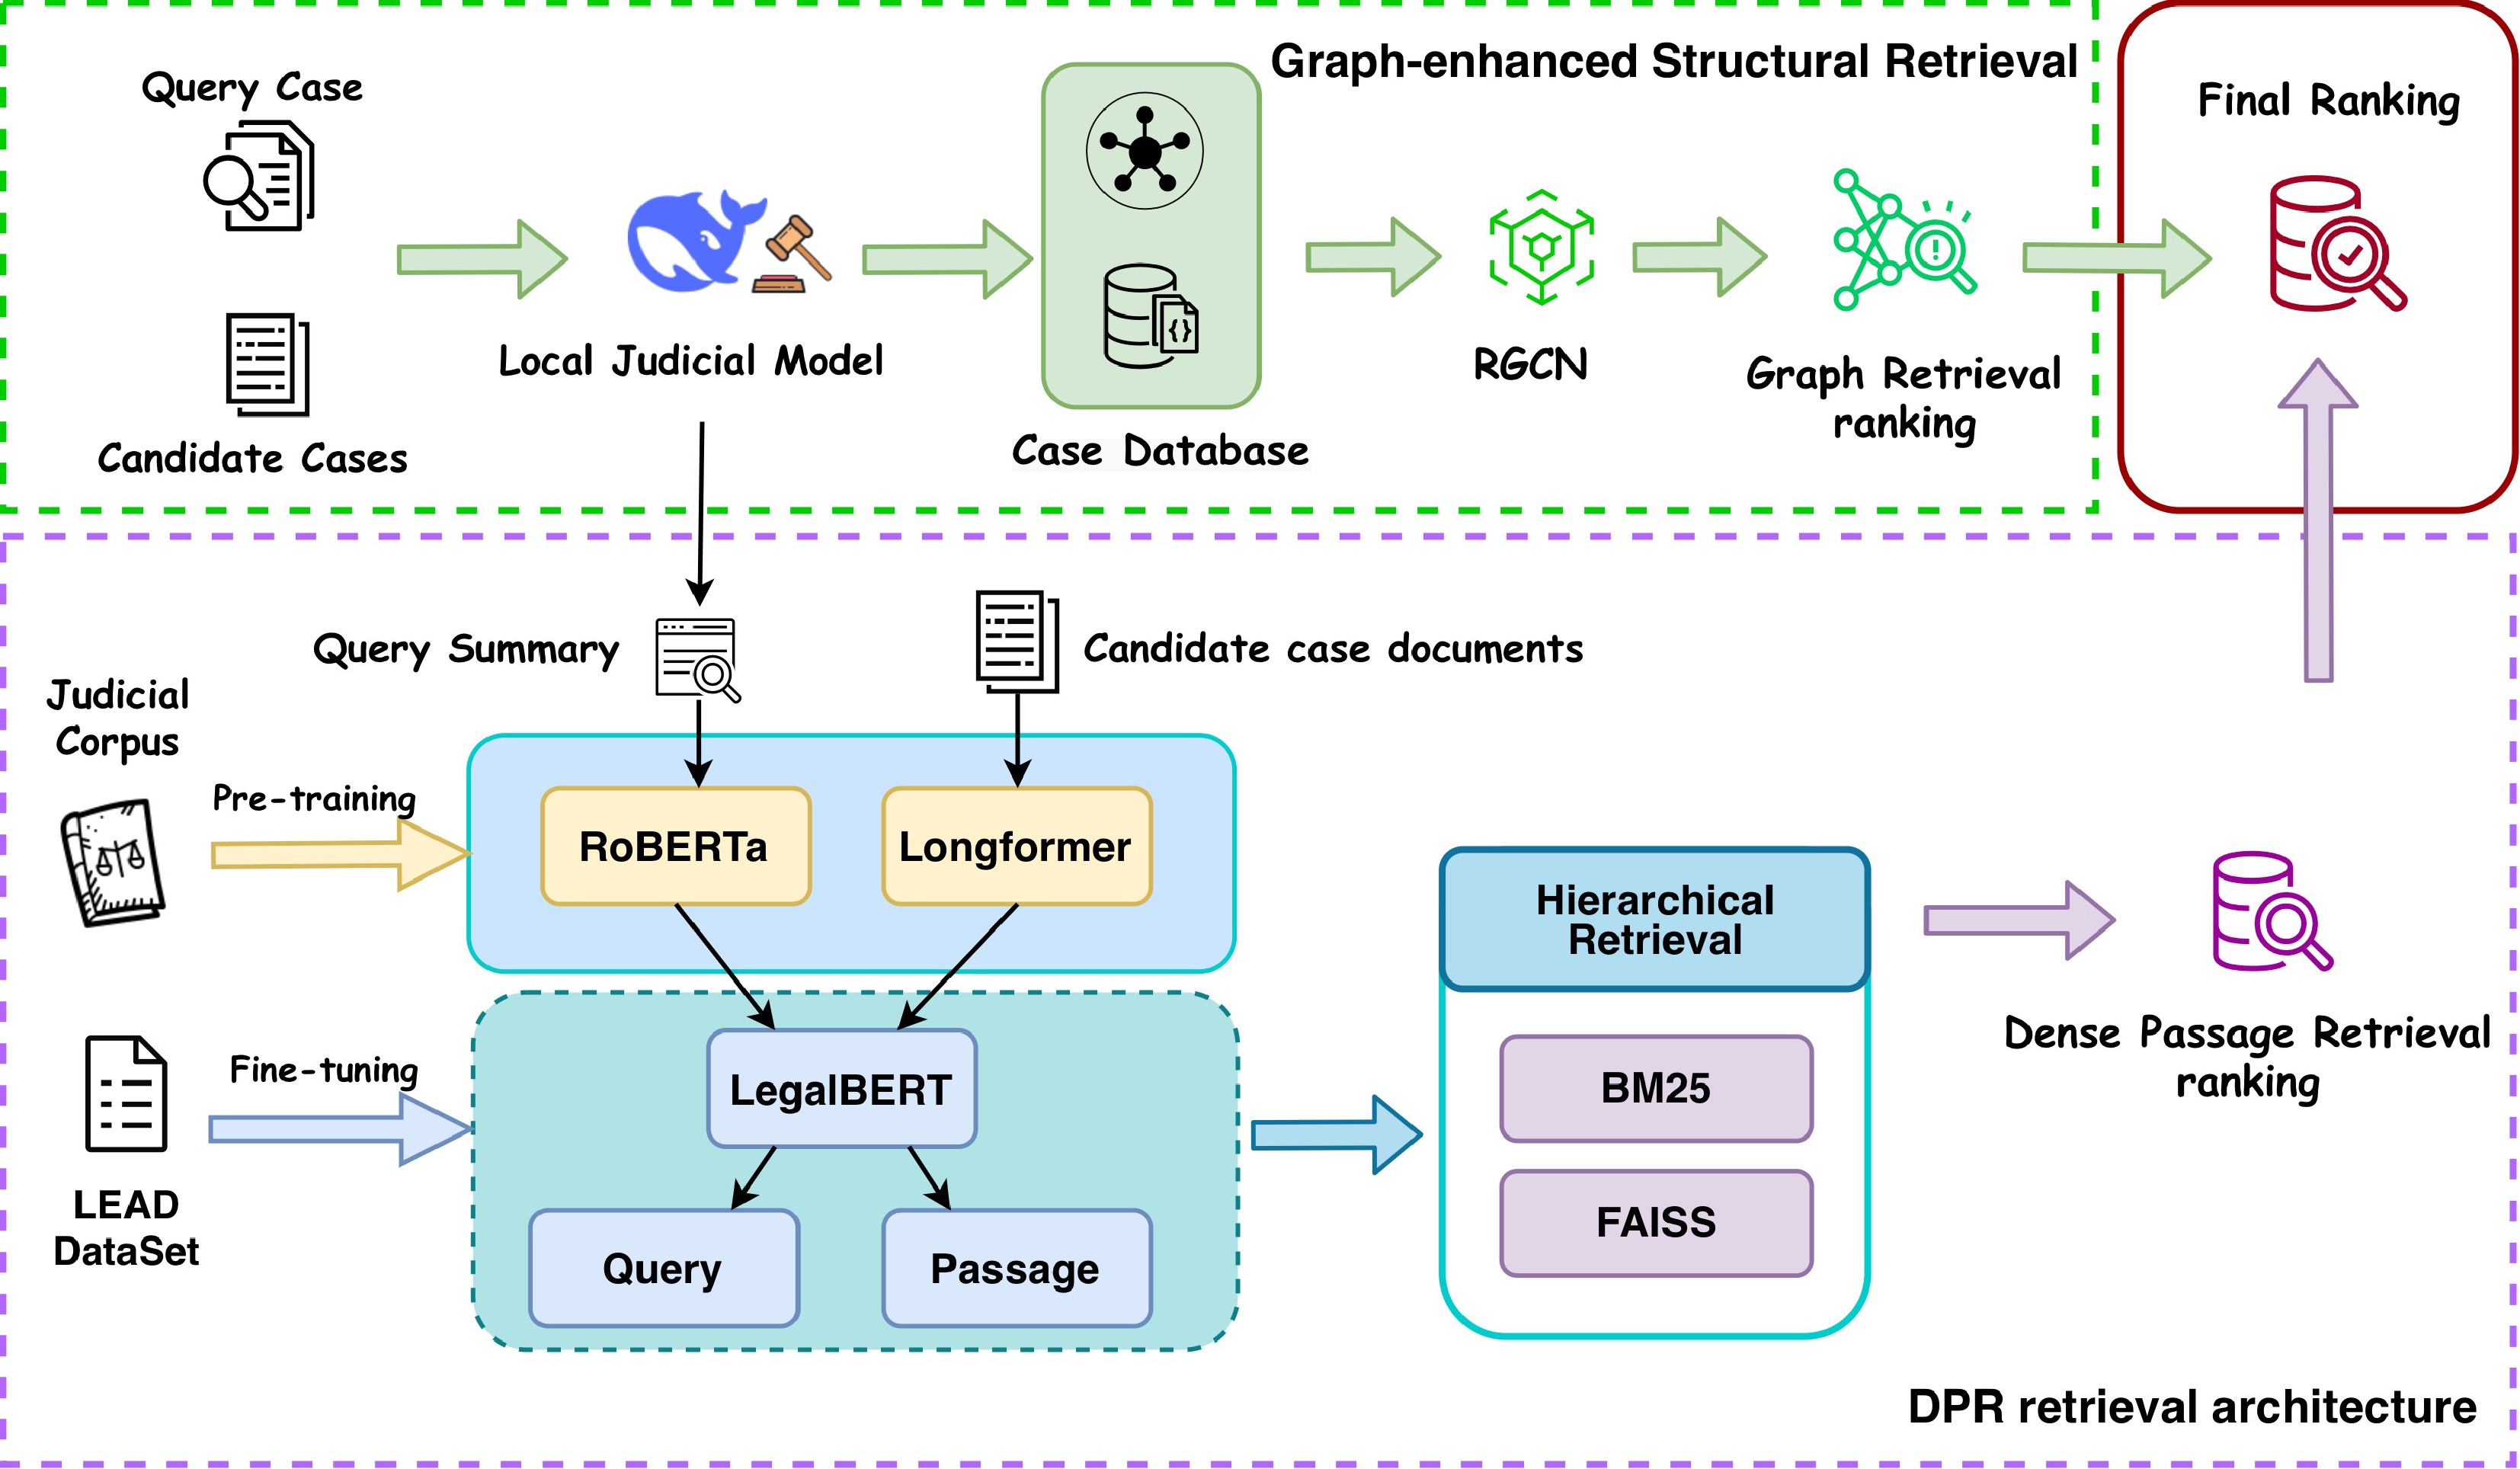
Figure 1.
The proposed architecture of the G-DPR framework.
-
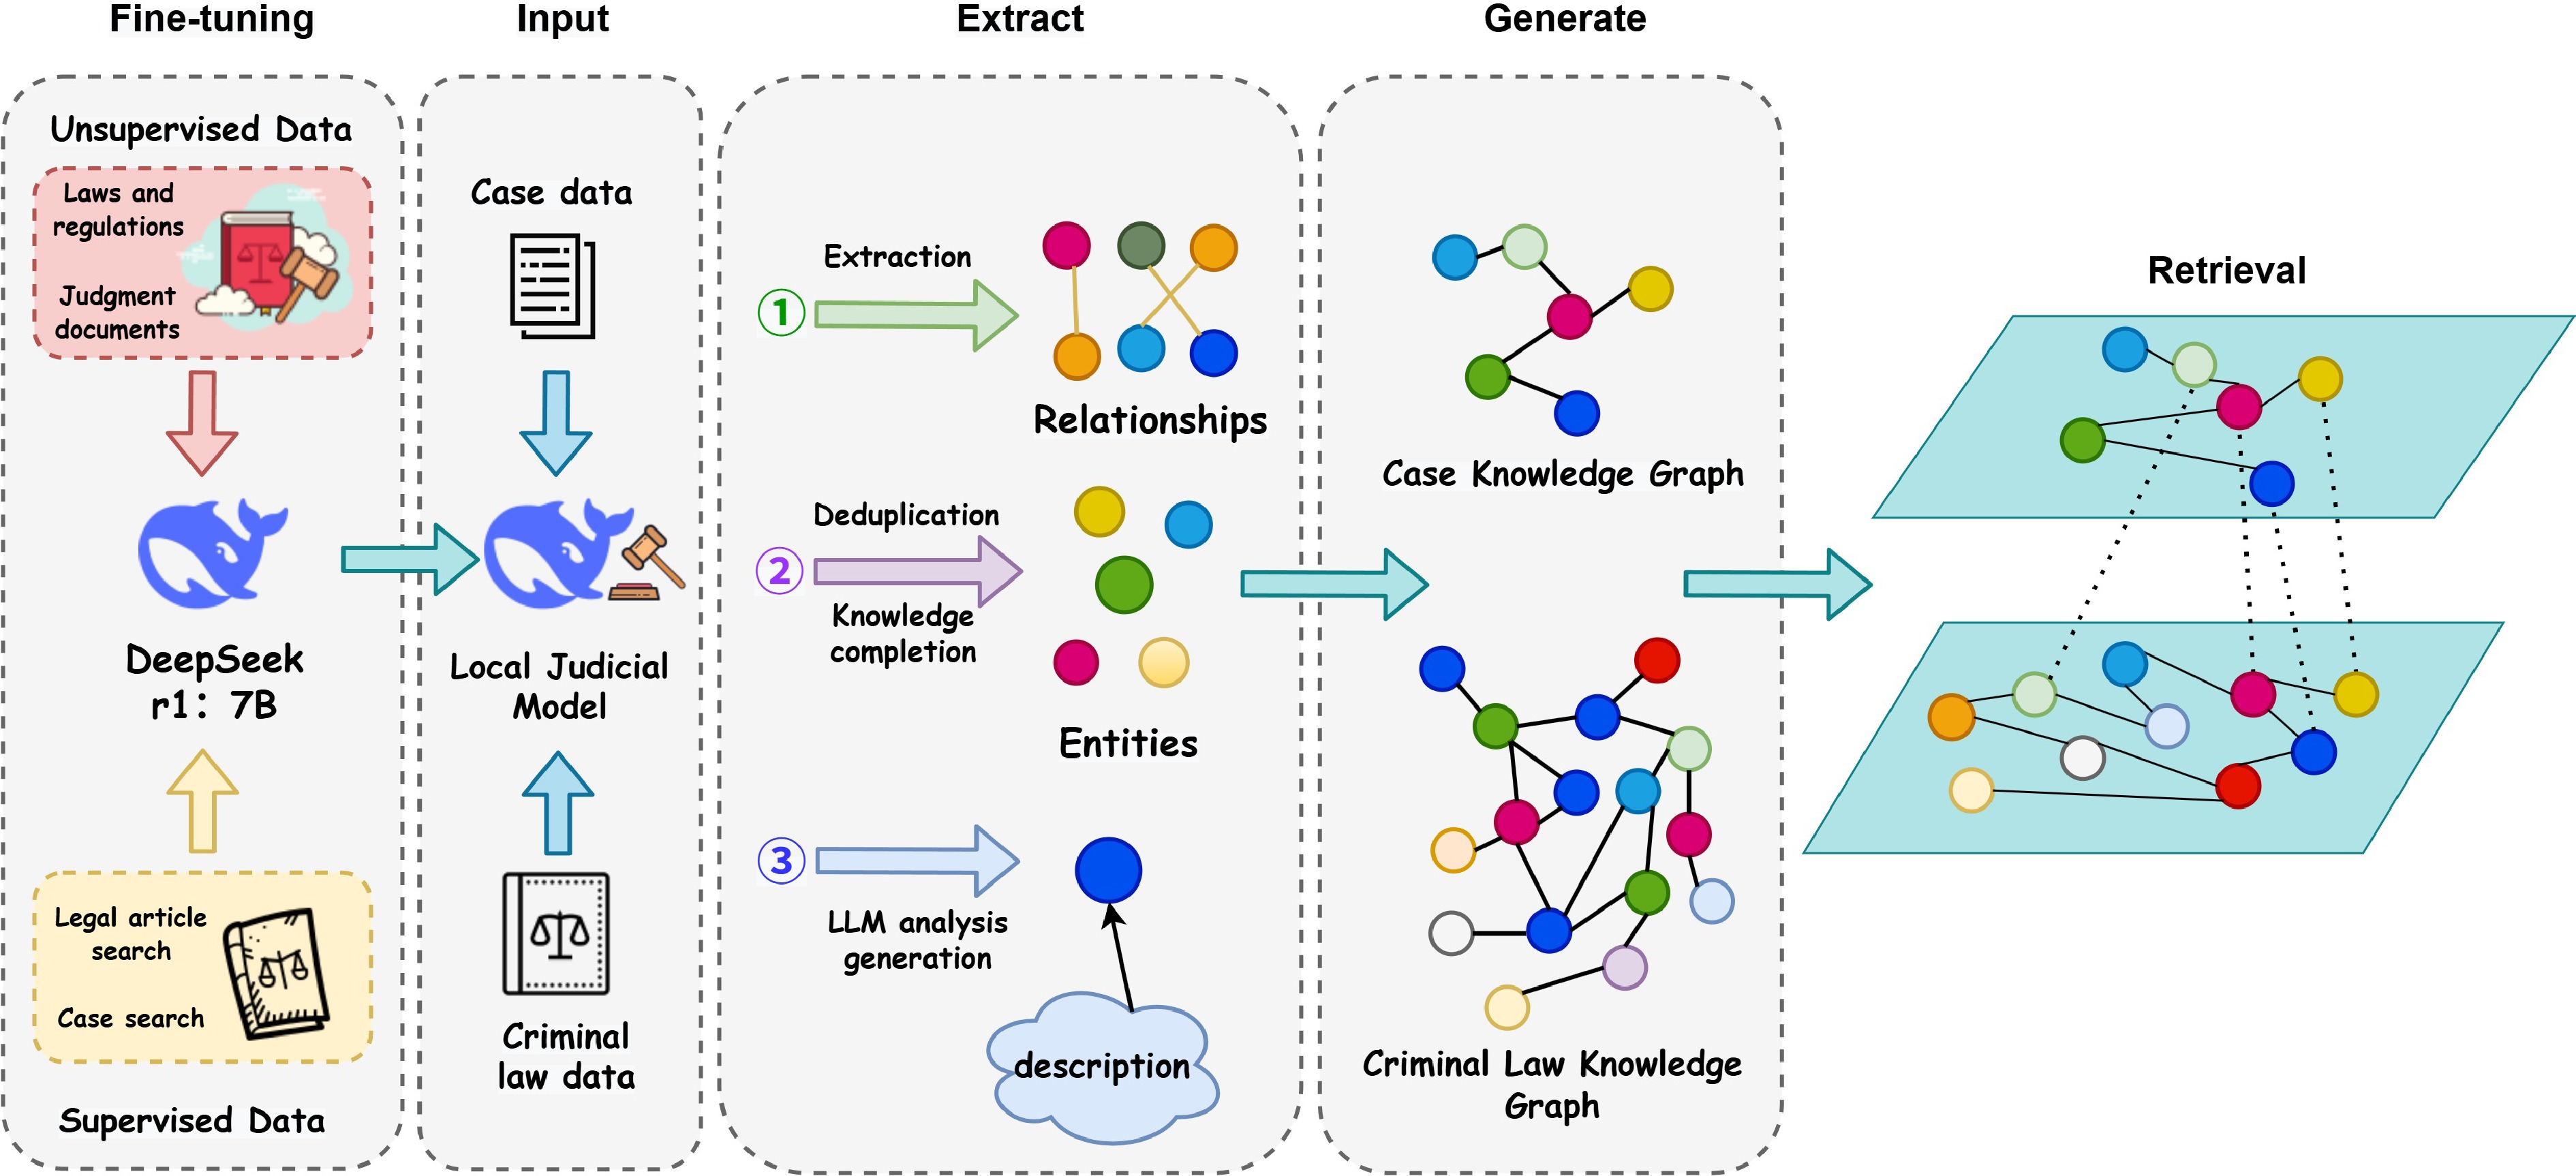
Figure 2.
The procedure of graph similarity retrieval.
-
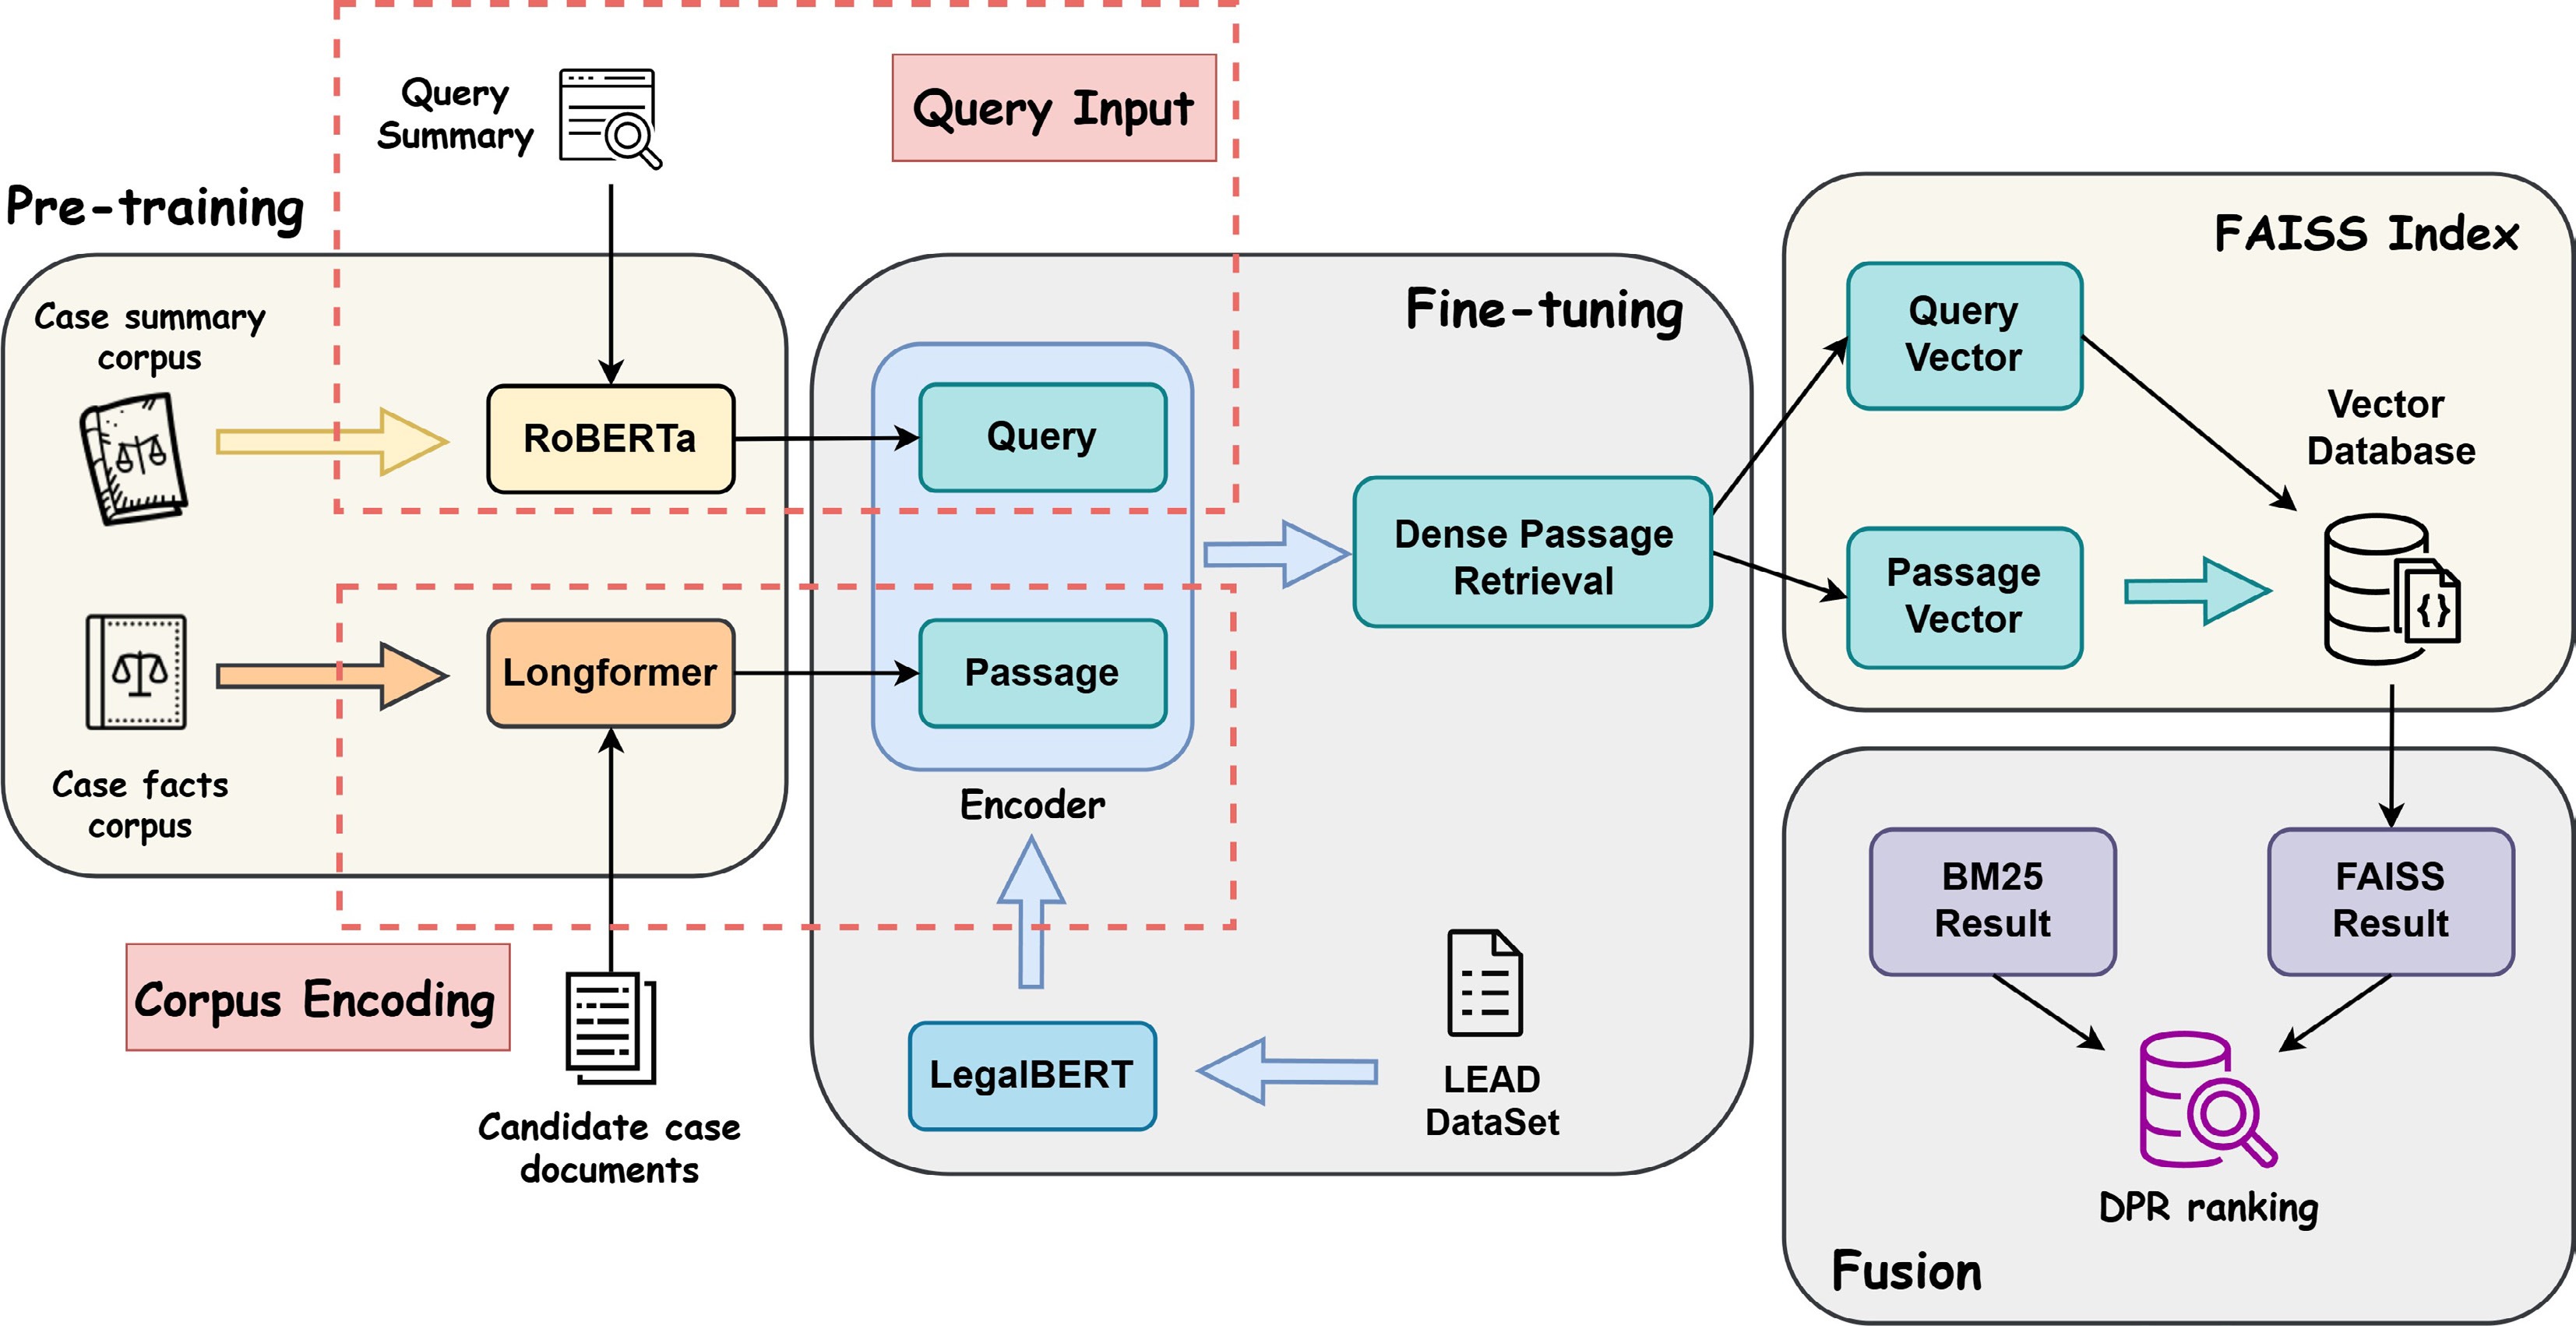
Figure 3.
Architecture of the DPR-based retrieval framework.
-
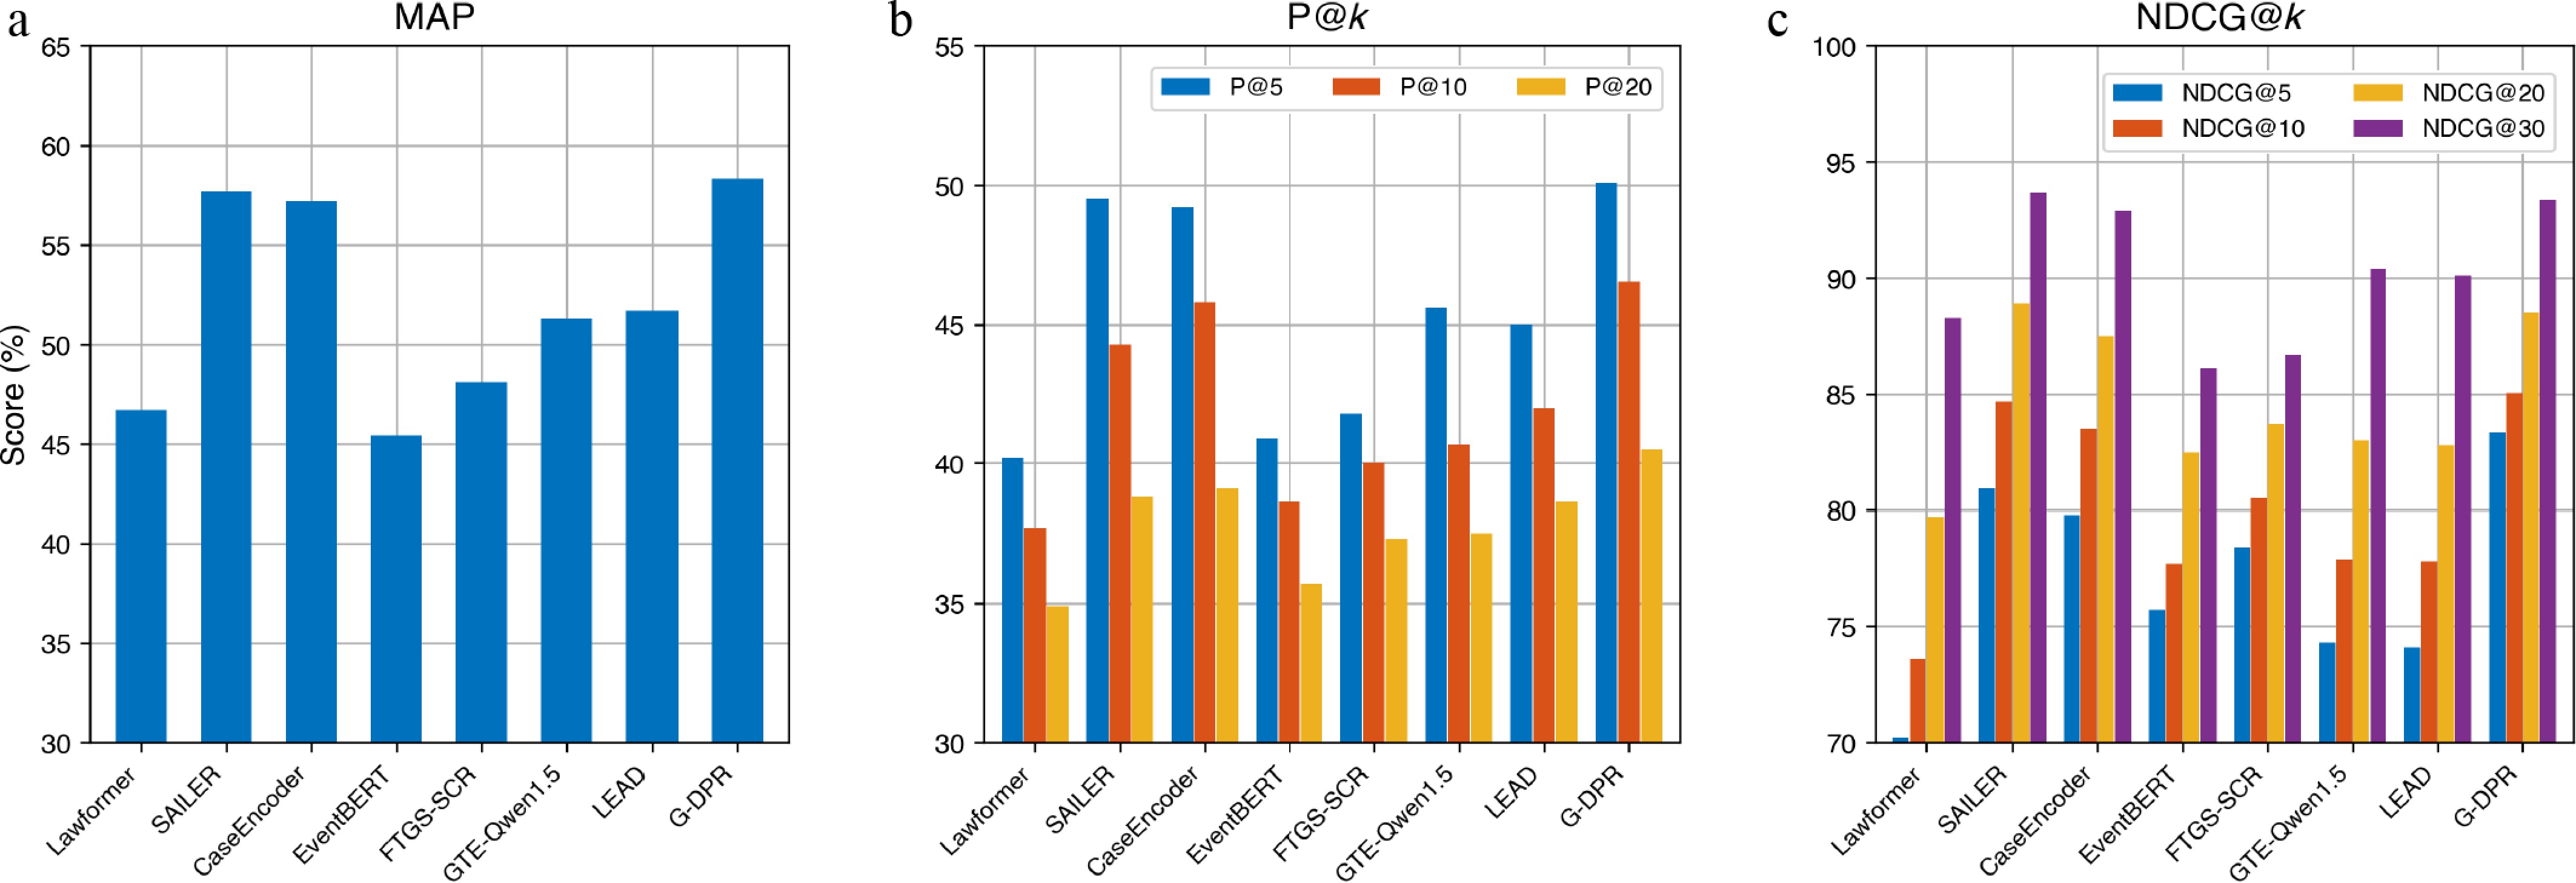
Figure 4.
Performance comparison of G-DPR and baseline models on evaluation metrics: (a) MAP, (b) P@k, and (c) NDCG@k.
-
Input: text: Case or statute document model: Domain-adapted DeepSeek-Law model Output: G: Multi-relational heterogeneous knowledge graph Step1: entities, relations = model.extract_entities_and_relations(text) Step2: G = Graph() for entity in entities: G.add_node(entity) for (head, relation, tail) in relations: G.add_edge(head, tail, relation) Step3: G = remove_redundant_edges_and_nodes(G) G = resolve_semantic_ambiguities(G) Step4: G = complete_missing_links(G) G = enrich_with_hypernyms_and_reasoned_paths(G) Step5: for path in key_paths(G): description = generate_textual_summary(path) attach_description_to_path(G, path, description) return G Table 1.
Build_knowledge_graph.
-
Input: Query set Q, Case document set D, Pre-trained model LegalBERT Output: Optimized DPR model Step1: Initialize query_encoder, document_encoder = LegalBERT (shared parameters) Step2: For each query q in Q: positive_doc = SelectPositiveCase(q, D) candidate_docs = BM25InitialRetrieval(q, D, top_k) negative_docs = SelectHardNegatives(candidate_docs, positive_doc) Step3: q_vector = query_encoder(q) d_positive_vector = document_encoder(positive_doc) d_negative_vectors = document_encoder(negative_docs) Step4: sim_positive = DotProduct(q_vector, d_positive_vector) sim_negatives = [DotProduct(q_vector, d_neg) for d_neg in d_negative_vectors] Step5: loss = InfoNCELoss(sim_positive, sim_negatives) UpdateModelParameters(loss, query_encoder, document_encoder) Return fine-tuned query_encoder, document_encoder Table 2.
LegalBERT-based DPR fine-tuning.
-
Model MAP P@k NDCG@k k = 5 k = 10 k = 20 k = 5 k = 10 k = 20 k = 30 Lawformer 46.7 40.2 37.7 34.9 70.2 73.6 79.7 88.3 SAILER 57.7 49.5 44.3 38.8 80.9 84.7 88.9 93.7 CaseEncoder 57.2 49.2 45.8 39.1 79.8 83.5 87.5 92.9 EventBERT 45.45 40.9 38.6 35.7 75.7 77.7 82.5 86.1 FTGS-SCR 48.12 41.8 40.0 37.3 78.4 80.5 83.7 86.7 GTE-Qwen1.5-7B-instruct 51.3 45.6 40.7 37.5 74.3 77.9 83.0 90.4 LEAD (0%) 51.7 45.0 42.0 38.6 74.1 77.8 82.8 90.1 G-DPR (ours) 58.31 50.09 46.54 40.51 83.34 85.04 88.52 93.35 Bold values represent the best experimental results under each evaluation metric. Table 1.
Performance comparison of G-DPR and baseline models on evaluation metrics.
-
Model MAP P@5 P@10 P@20 NDCG
@5NDCG
@10NDCG
@20NDCG
@30G-DPR 58.31 50.09 46.54 40.51 83.34 85.04 88.52 93.35 w/o Graph 56.02 47.10 45.42 40.42 79.29 82.37 86.58 91.88 w/o DPR 55.35 49.35 44.30 38.04 78.87 80.17 81.91 85.86 Bold values represent the best experimental results under each evaluation metric. Table 2.
Ablation study of G-DPR on the LeCaRD dataset.
Figures
(4)
Tables
(4)