-
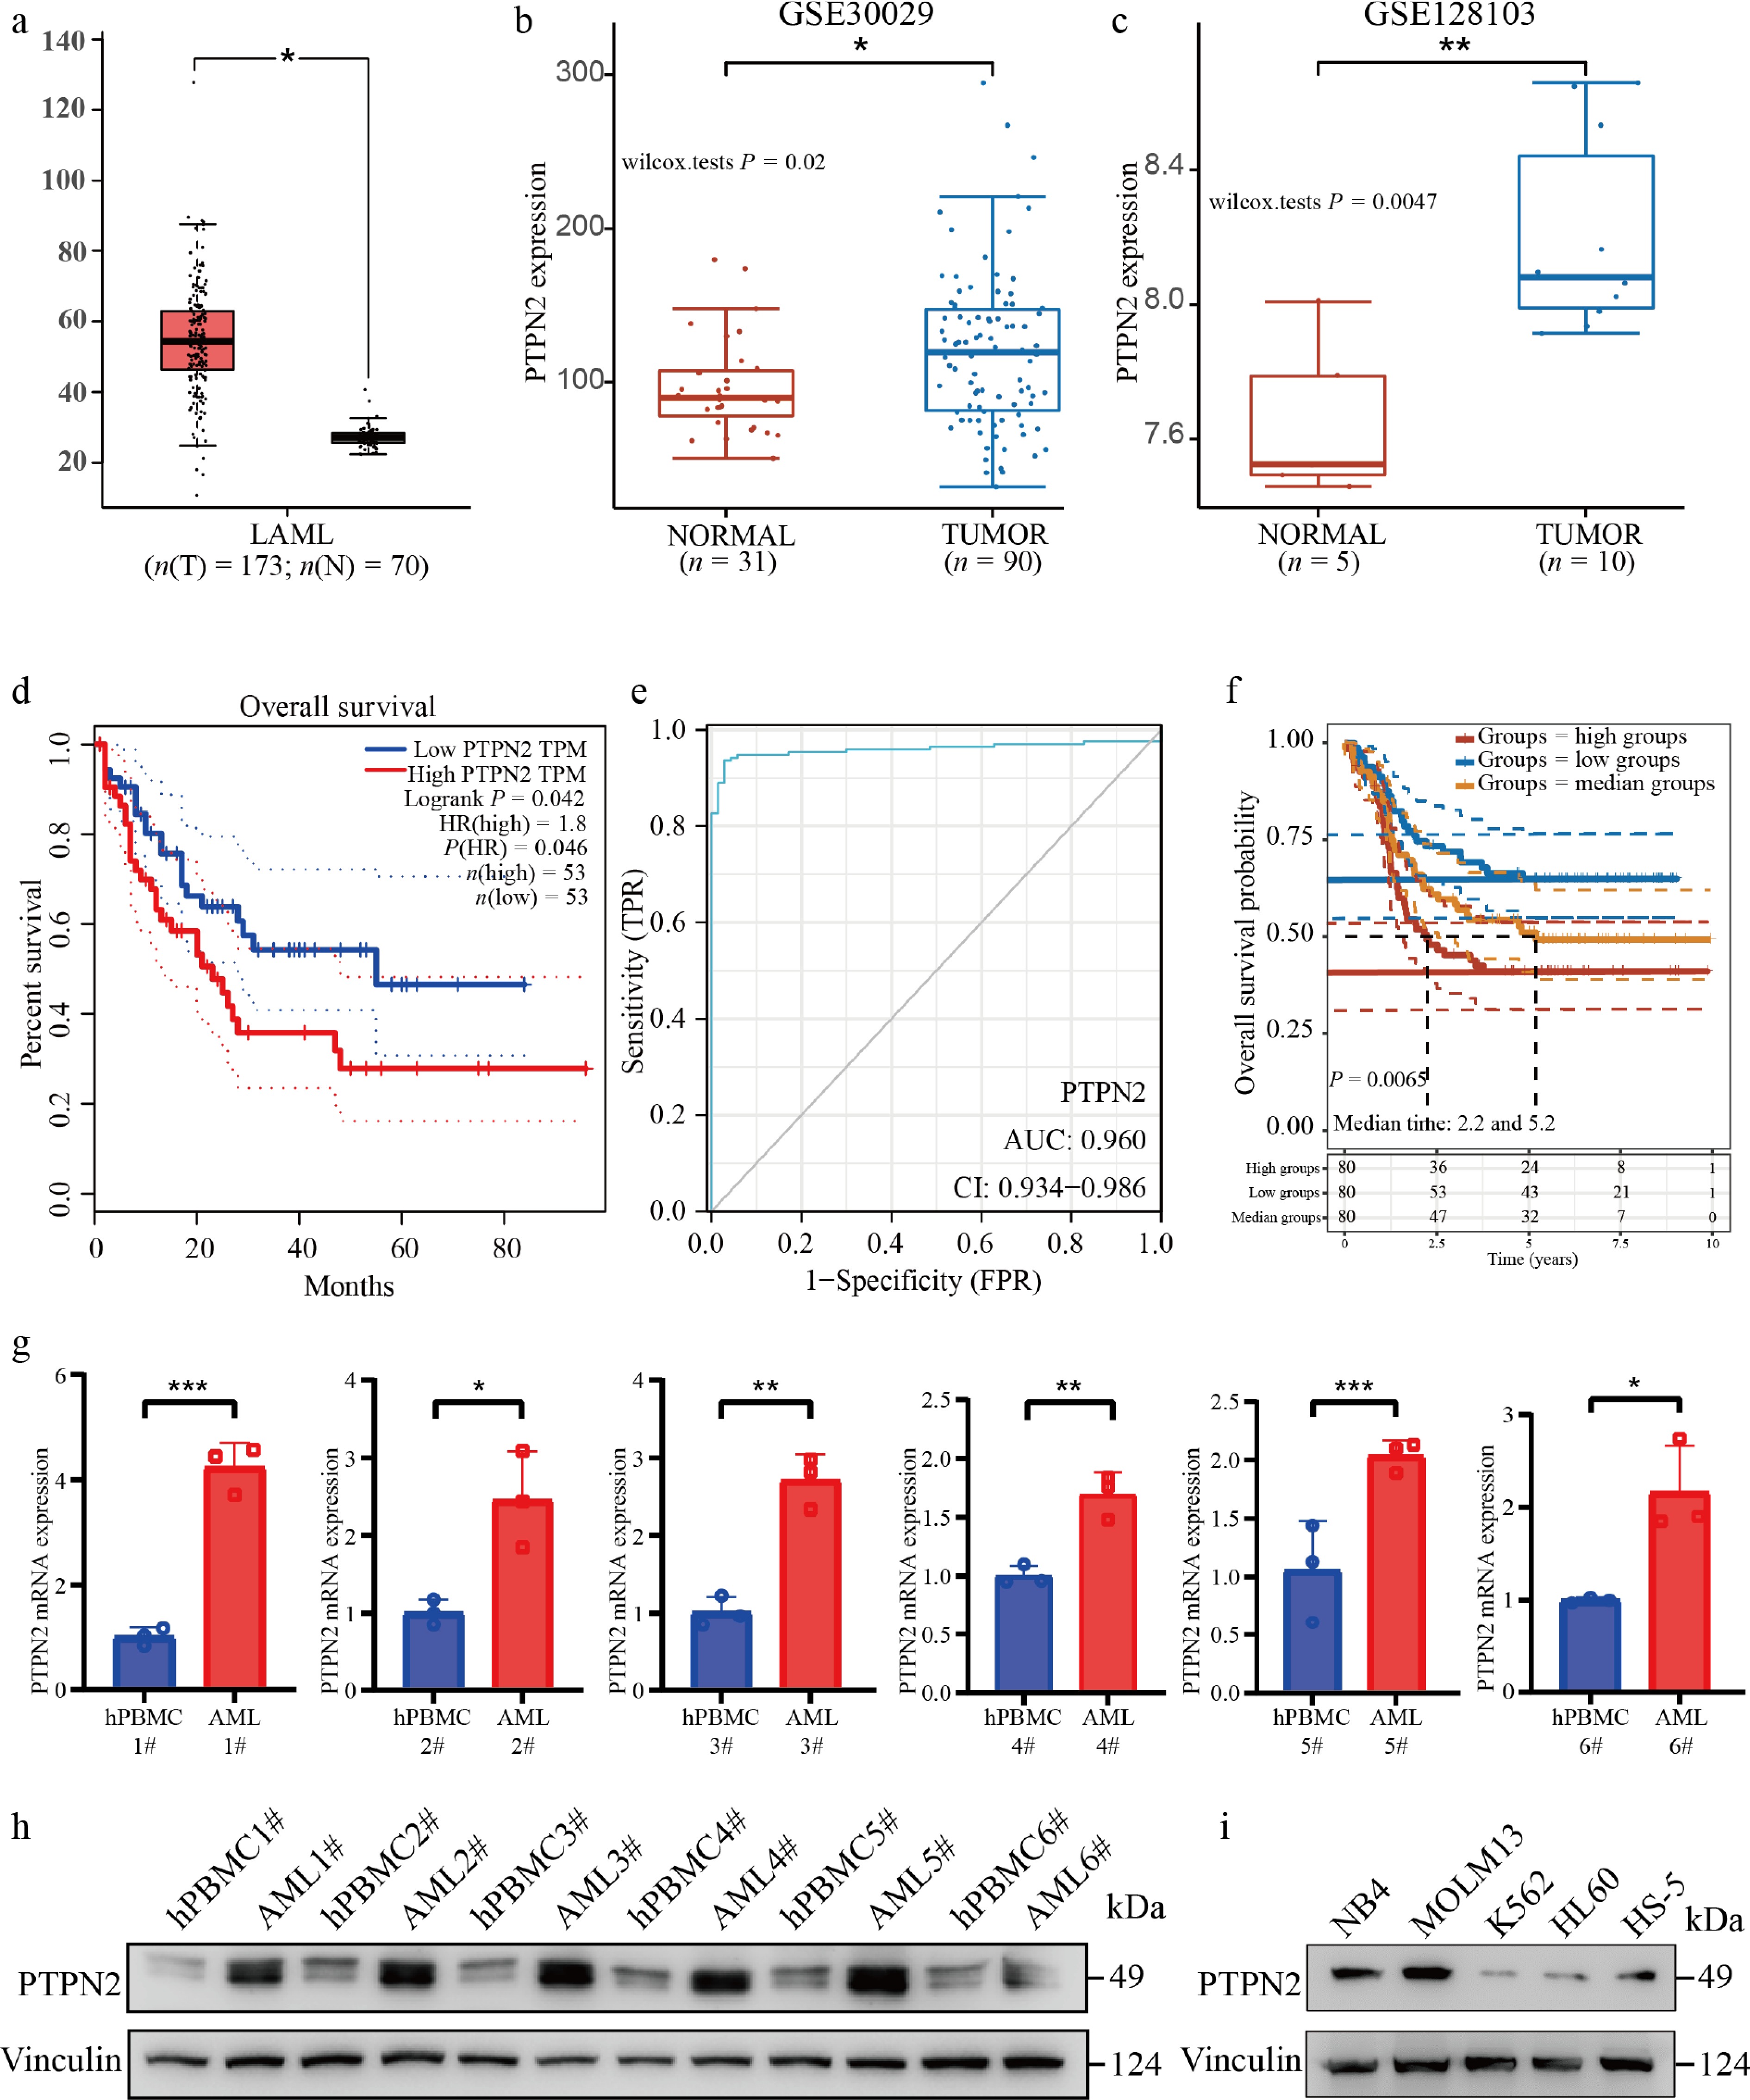
Figure 1.
PTPN2 is highly expressed in AML and associated with poor survival. (a) Comparison of PTPN2 expression between tumors (red, n = 173) and normal (gray, n = 70). (b) PTPN2 expression analysis of monocytes from 31 normal samples and 90 tumor samples from the GSE30029 chip. (c) PTPN2 expression in the sequencing results of five normal umbilical cord blood cell samples and 10 tumor samples' leukemic blasts, leukemic stem cells, and lymphocyte samples from the GSE128103 chip. The quantile percentile is illustrated by the whiskers of the box plot, where minima, 25%, median, 75%, and maxima are displayed from bottom to top, respectively. The application of a two-tailed Student's t-test was conducted without considering adjustments for multiple comparisons, specifically the false discovery rate (FDR). (d) Kaplan–Meier survival plot of high (red line, n = 53) and low (blue line, n = 53) PTPN2 expression AML patients (data from TCGA). Statistical analysis was performed using the log-rank test, P = 0.042. (e) The receiver operating characteristic curve (ROC) predicts the accuracy of PTPN2 as a diagnostic factor for AML. (f) Kaplan–Meier survival plot of high (red line), median (yellow line), and low (blue line) PTPN2 expression AML patients (data from the TARGET database). Statistical analysis was performed using the log-rank test, P = 0.0065. (g) PTPN2 mRNA level in AML patients and healthy control samples. Data represent the mean ± SD. Statistical analysis was performed using a two-tailed unpaired Student's t-test. (h) PTPN2 protein level in AML patients and healthy control samples. (i) PTPN2 protein levels of human bone marrow stromal cell line HS-5 and four different human myeloid leukemia cell lines. * P < 0.05; ** P < 0.01; *** P < 0.001.
-
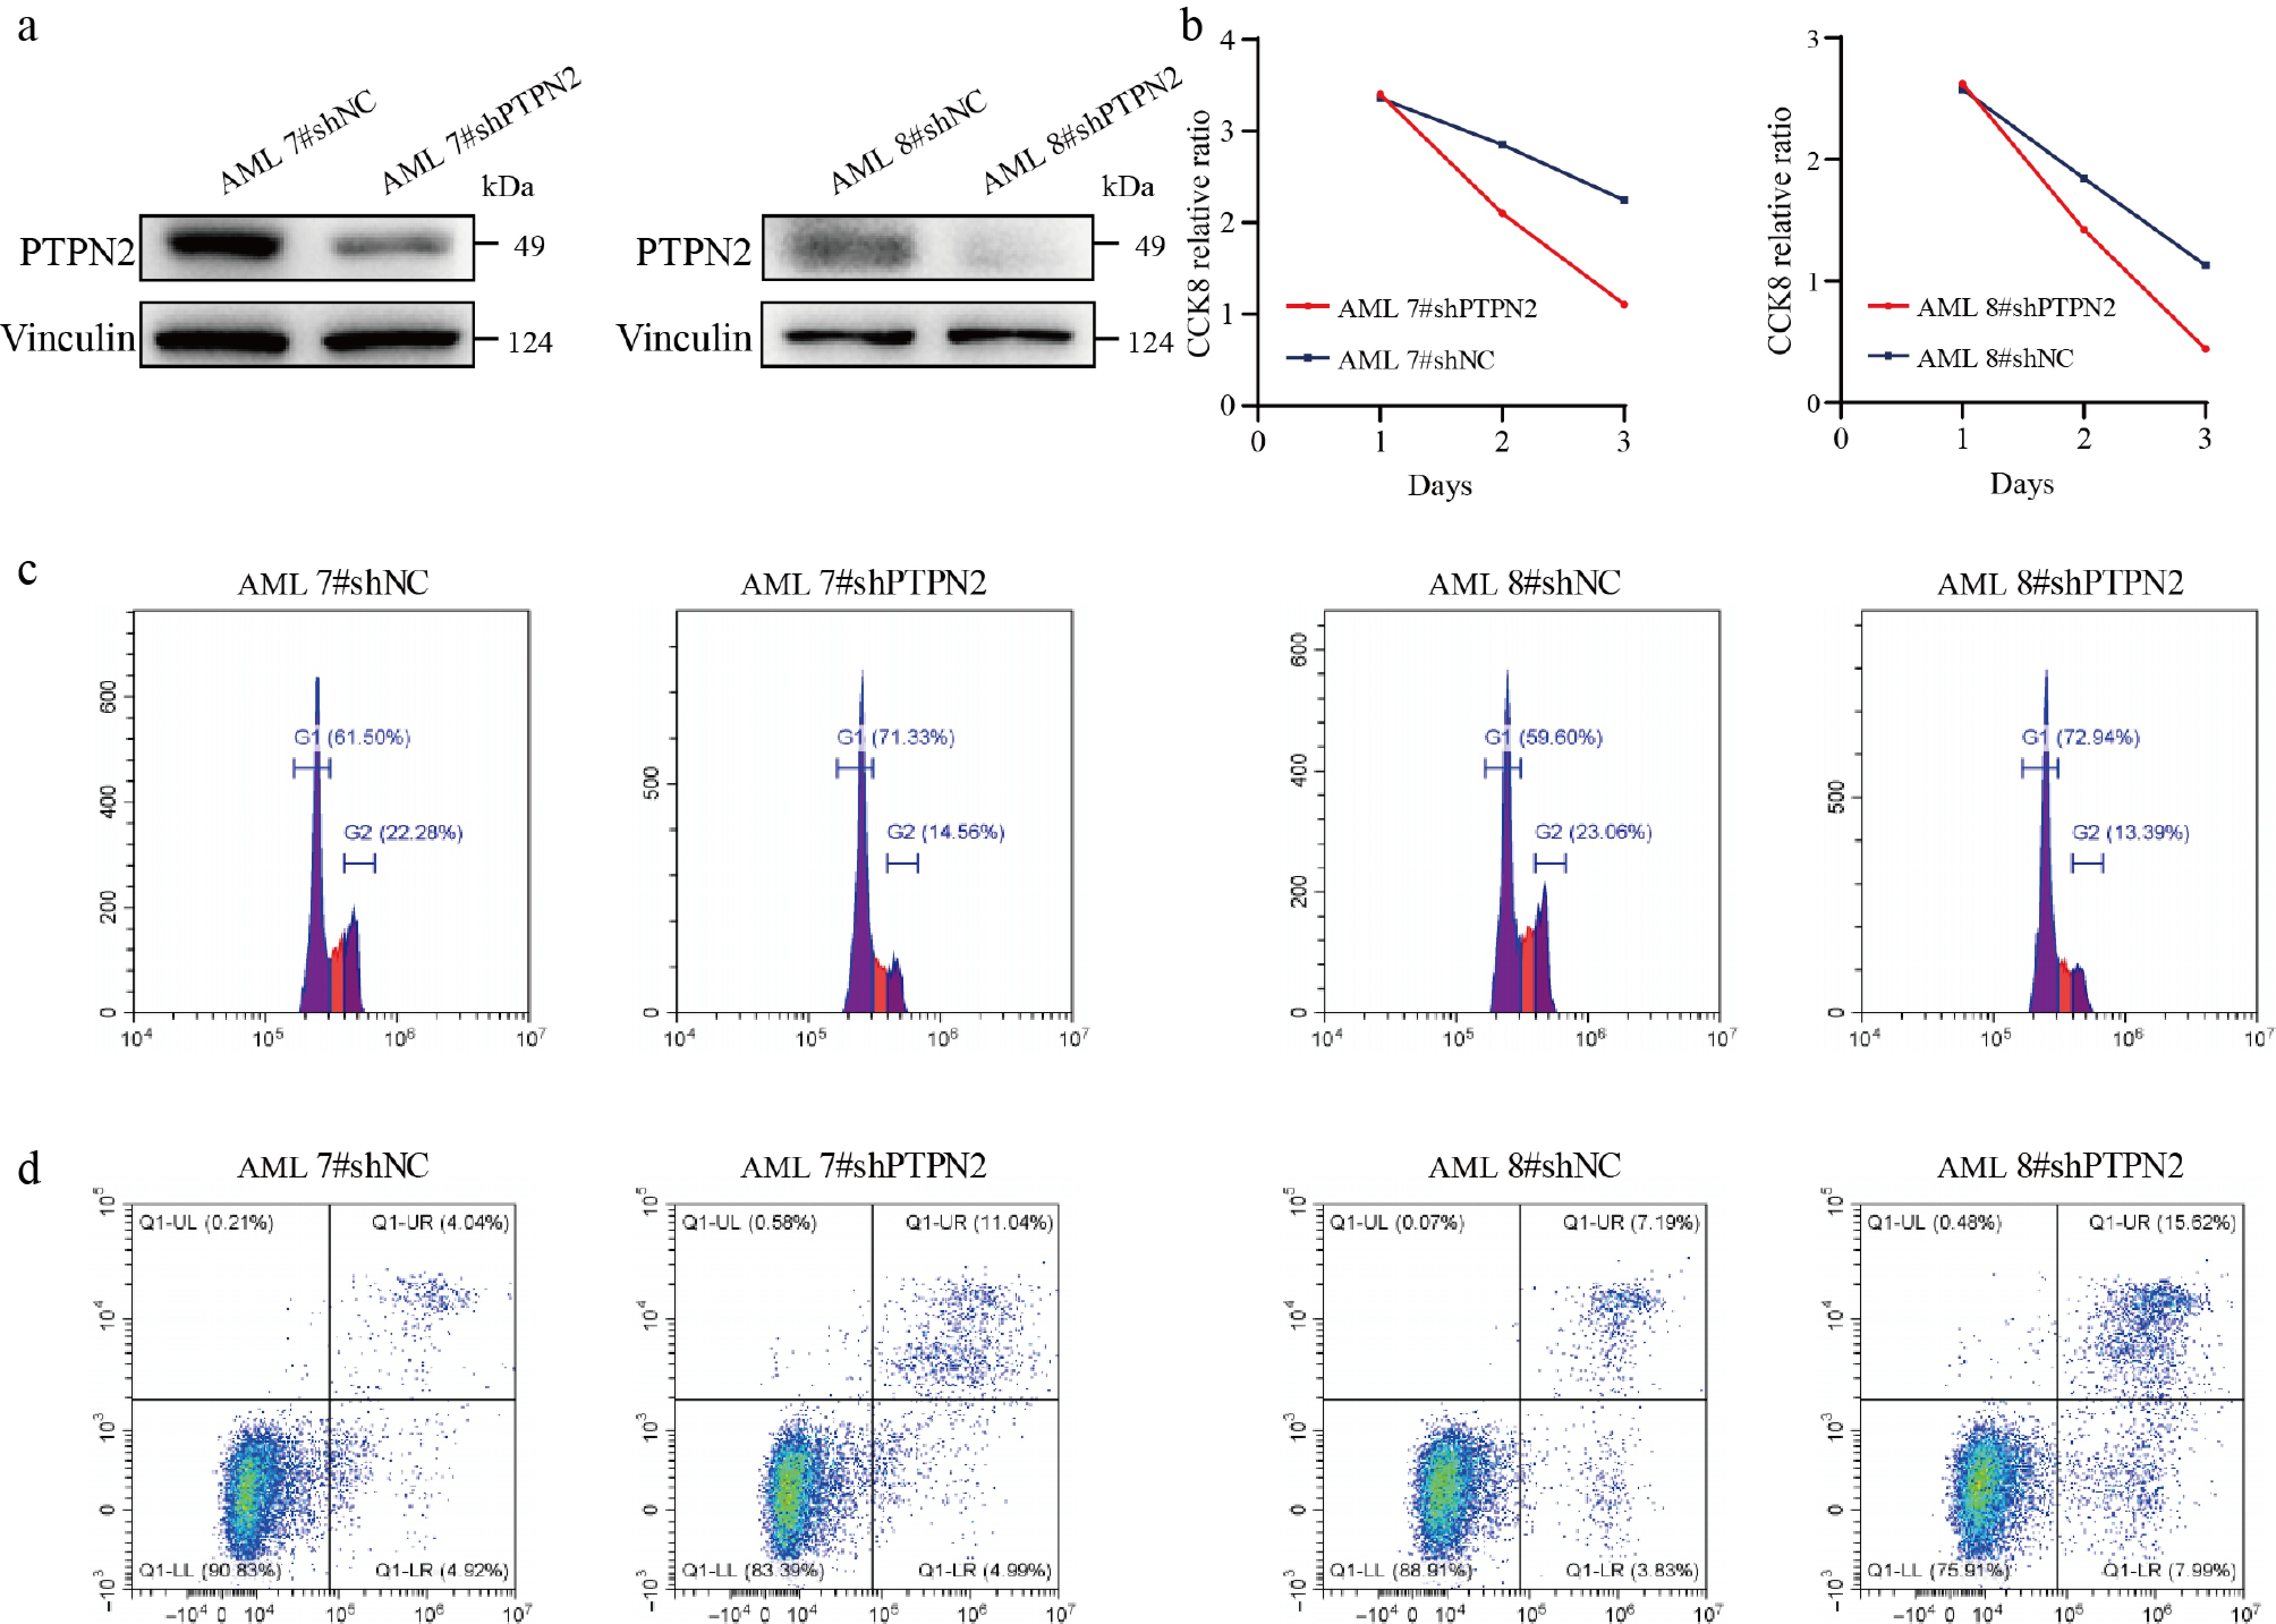
Figure 2.
Knockdown of PTPN2 significantly affects AML primary cell viability, cell cycle, and apoptosis. (a) The protein level of PTPN2 in AML primary cells that were infected with lentiviral shNC and shPTPN2. (b) Cell viability of shNC and shPTPN2 AML primary cells during a 3-d course. (c) Cell cycle phase distribution of shNC and shPTPN2 AML primary cells determined by flow cytometry. (d) Apoptotic rates of shNC and shPTPN2 AML primary cells determined by flow cytometry.
-
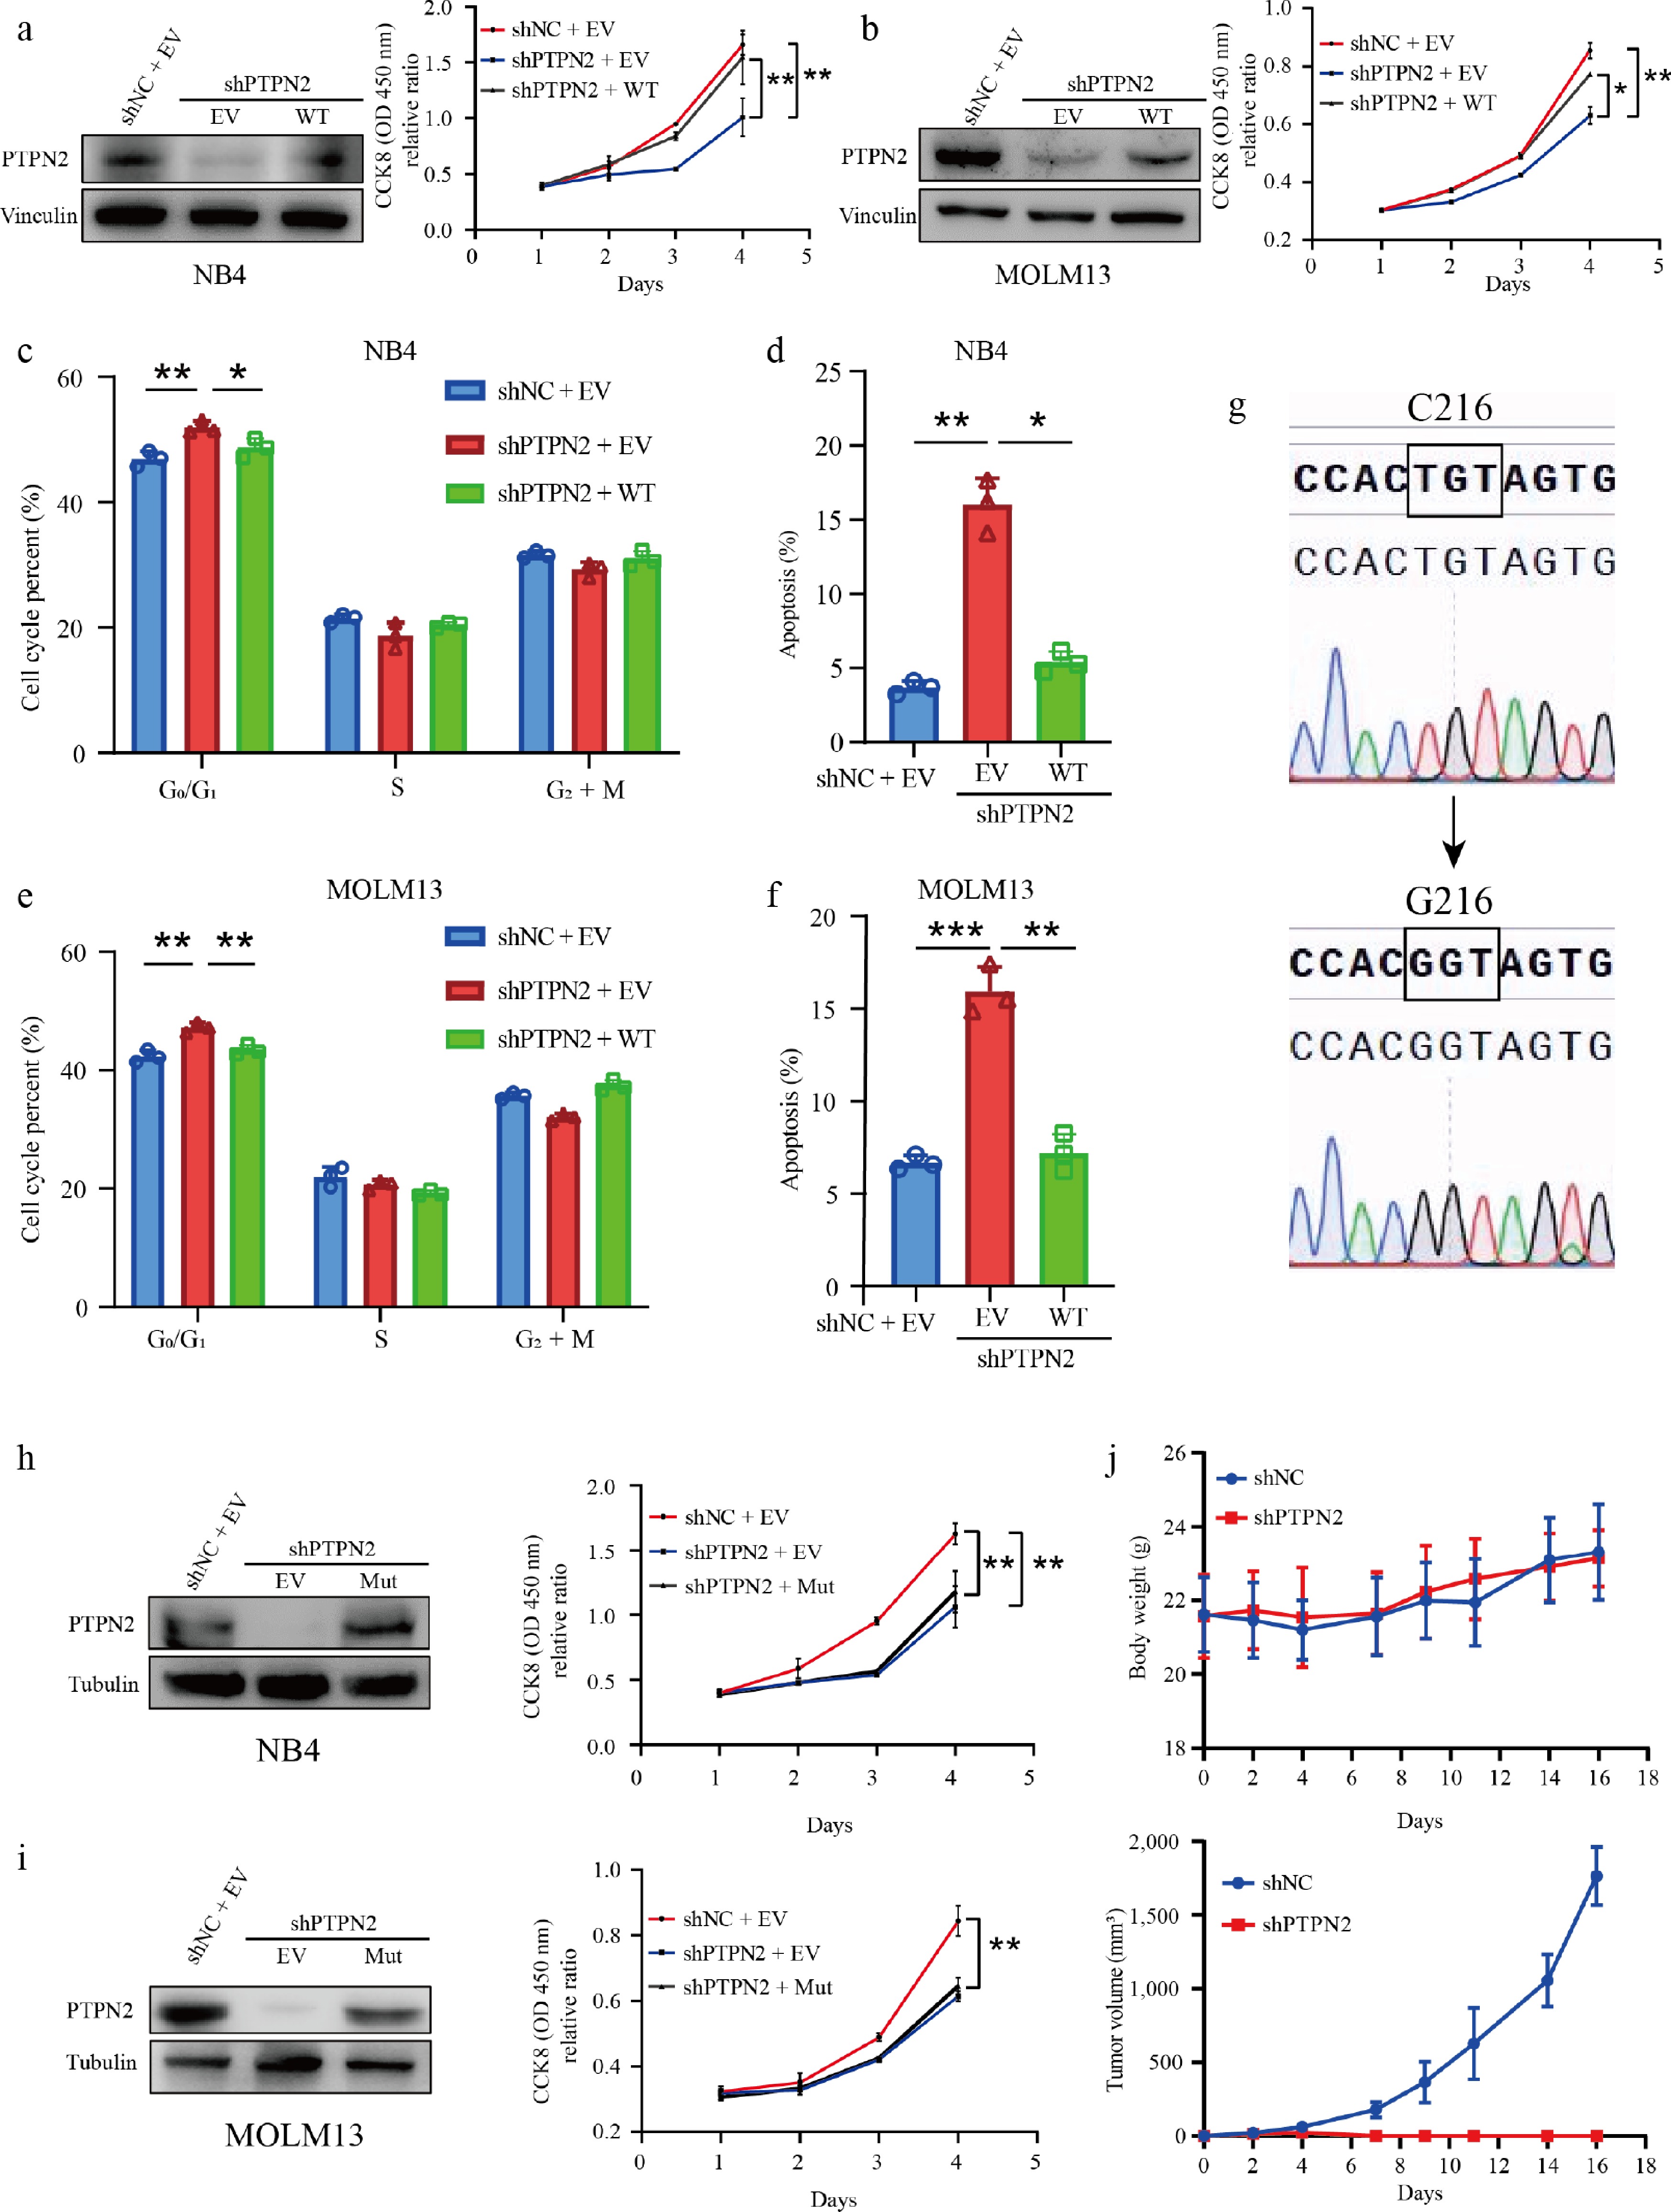
Figure 3.
Depletion of PTPN2 inhibits AML in vitro and in vivo. (a) PTPN2 protein levels in NB4 cells with PTPN2 knockdown and rescue overexpression. Cell viability of NB4 shNC, shPTPN2, and overexpression cells during a 4-d course. Data represent the mean ± SD. Statistical analysis was performed using a two-tailed unpaired Student's t-test. (b) PTPN2 protein levels in Molm13 cells with PTPN2 knockdown and rescue overexpression. Cell viability of MOLM13 shNC, shPTPN2, and overexpression cells during a 4-d course. Data represent the mean ± SD. Statistical analysis was performed using a two-tailed unpaired Student's t-test. (c), (d) Cell cycle phase distribution and apoptotic rates of NB4 shNC, shPTPN2, and overexpression cells were determined by flow cytometry. Data represent the mean ± SD. Statistical analysis was performed using a two-tailed unpaired Student's t-test. (e), (f) Cell cycle phase distribution and apoptotic rates of MOLM13 shNC, shPTPN2, and overexpression cells were analyzed by flow cytometry. Data represent the mean ± SD. Statistical analysis was performed using a two-tailed unpaired Student's t-test. (g) PTPN2 protein with mutation of amino acid 216, detected by Sanger sequencing. (h), (i) Protein level of PTPN2 in NB4 and MOLM13 shNC, shPTPN2, and overexpression PTPN2 C216G mutation (Mut) cells. Cell viability of cells during a 4-d course. Data represent the mean ± SD. Statistical analysis was performed using a two-tailed unpaired Student's t-test. (j) Male BALB/c nude mice were implanted subcutaneously with MOLM13 shNC and shPTPN2 cells (n = 5 in each group). Tumor masses were photographed and weighed after euthanizing mice. Body weights of mice were measured every 2 d. Data represent the mean ± SD. Statistical analysis was performed using a two-tailed unpaired Student's t-test. * P < 0.05; ** P < 0.01; *** P < 0.001.
-
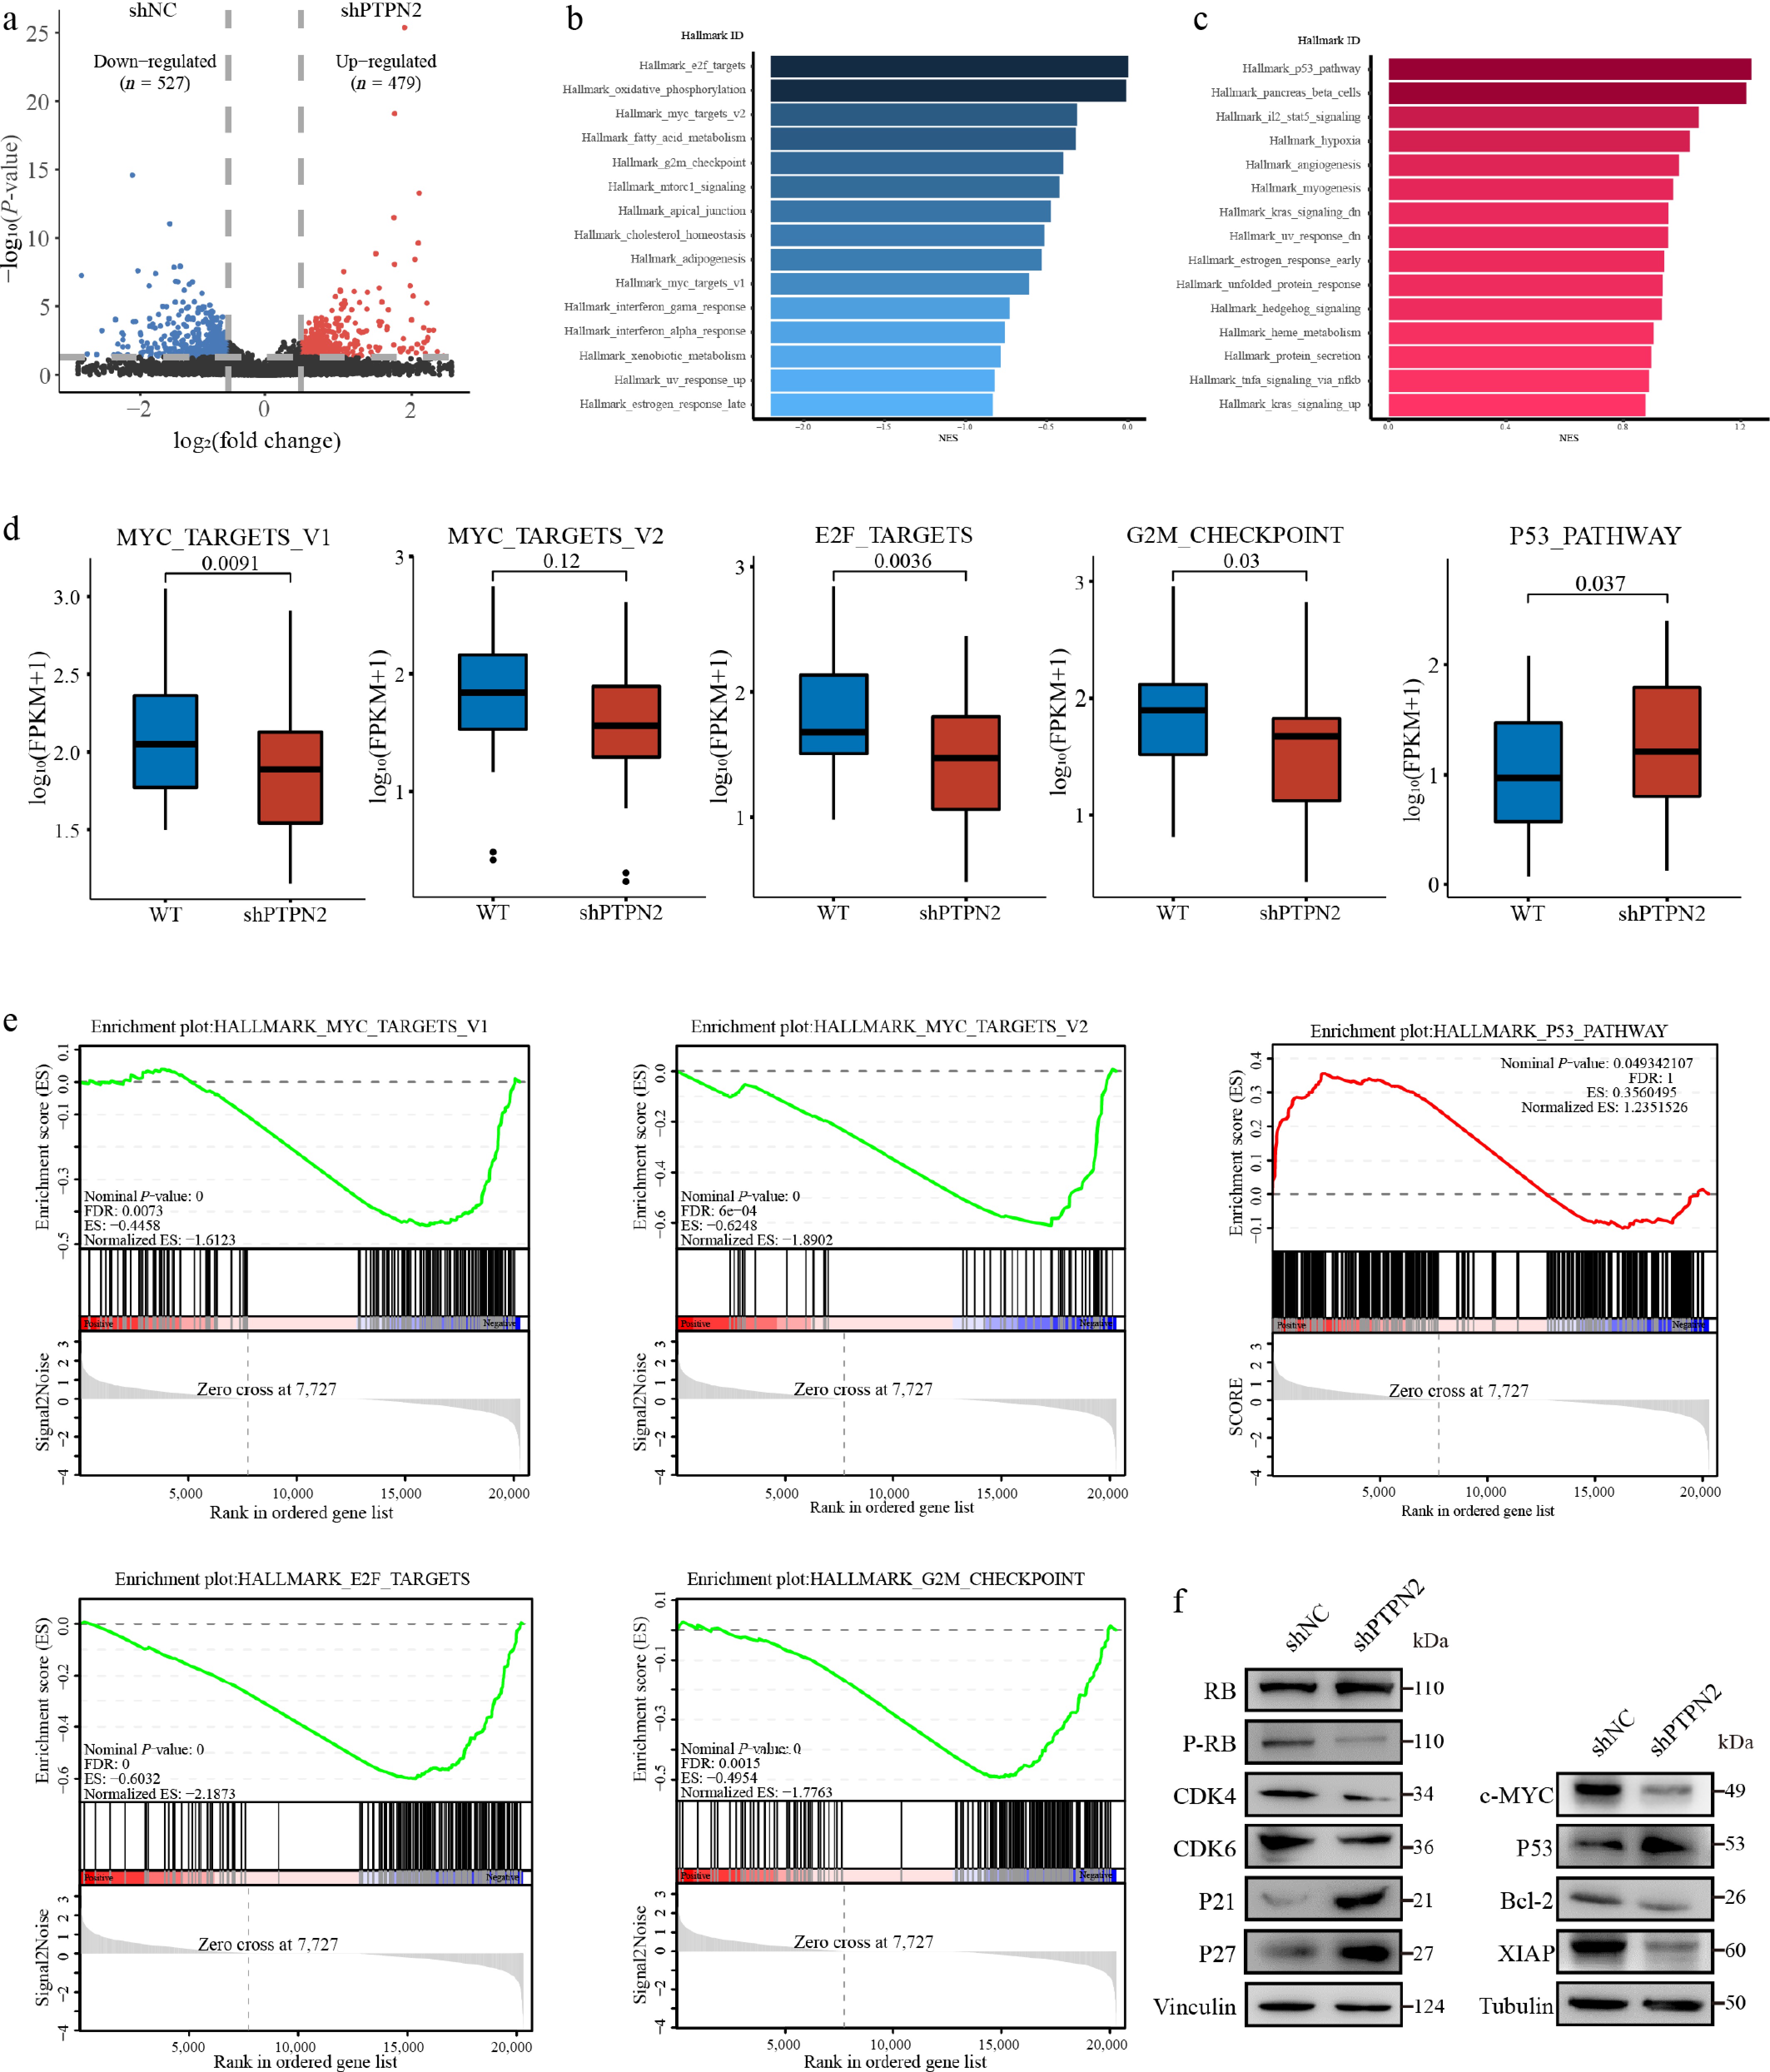
Figure 4.
RNA sequencing combined validation assays to identify affected signaling pathways of PTPN2 loss in AML cells. (a) Volcano plot of significantly affected (absolute fold change > 2, P-value < 0.05) genes in the MOLM13 shPTPN2 group relative to shNC group, as revealed by RNA-seq. P-values were calculated using R v4.0.3 software. (b), (c) Bar graphs show the core-enriched downregulated (blue) and upregulated (red) signaling pathways in shPTPN2 groups when compared with shNC groups, respectively. (d) The relative abundance of genes involved in MYC targets V1, MYC targets V2, E2F targets, G2M checkpoint, and P53 pathway in MOLM13 PTPN2 KD cells. The quantile percentile is illustrated by the whiskers of the box plot, where minima, 25%, median, 75%, and maxima are displayed from bottom to top, respectively. The application of a two-tailed Student's t-test was conducted without considering adjustments for multiple comparisons, specifically the false discovery rate (FDR). (e) The signaling pathways enriched in different groups obtained through Gene Set Enrichment Analysis (GSEA). (f) Immunoblotting analysis of protein in MOLM13 shPTPN2 and shNC cells. The experiments in (f) were repeated three times with similar results.
-
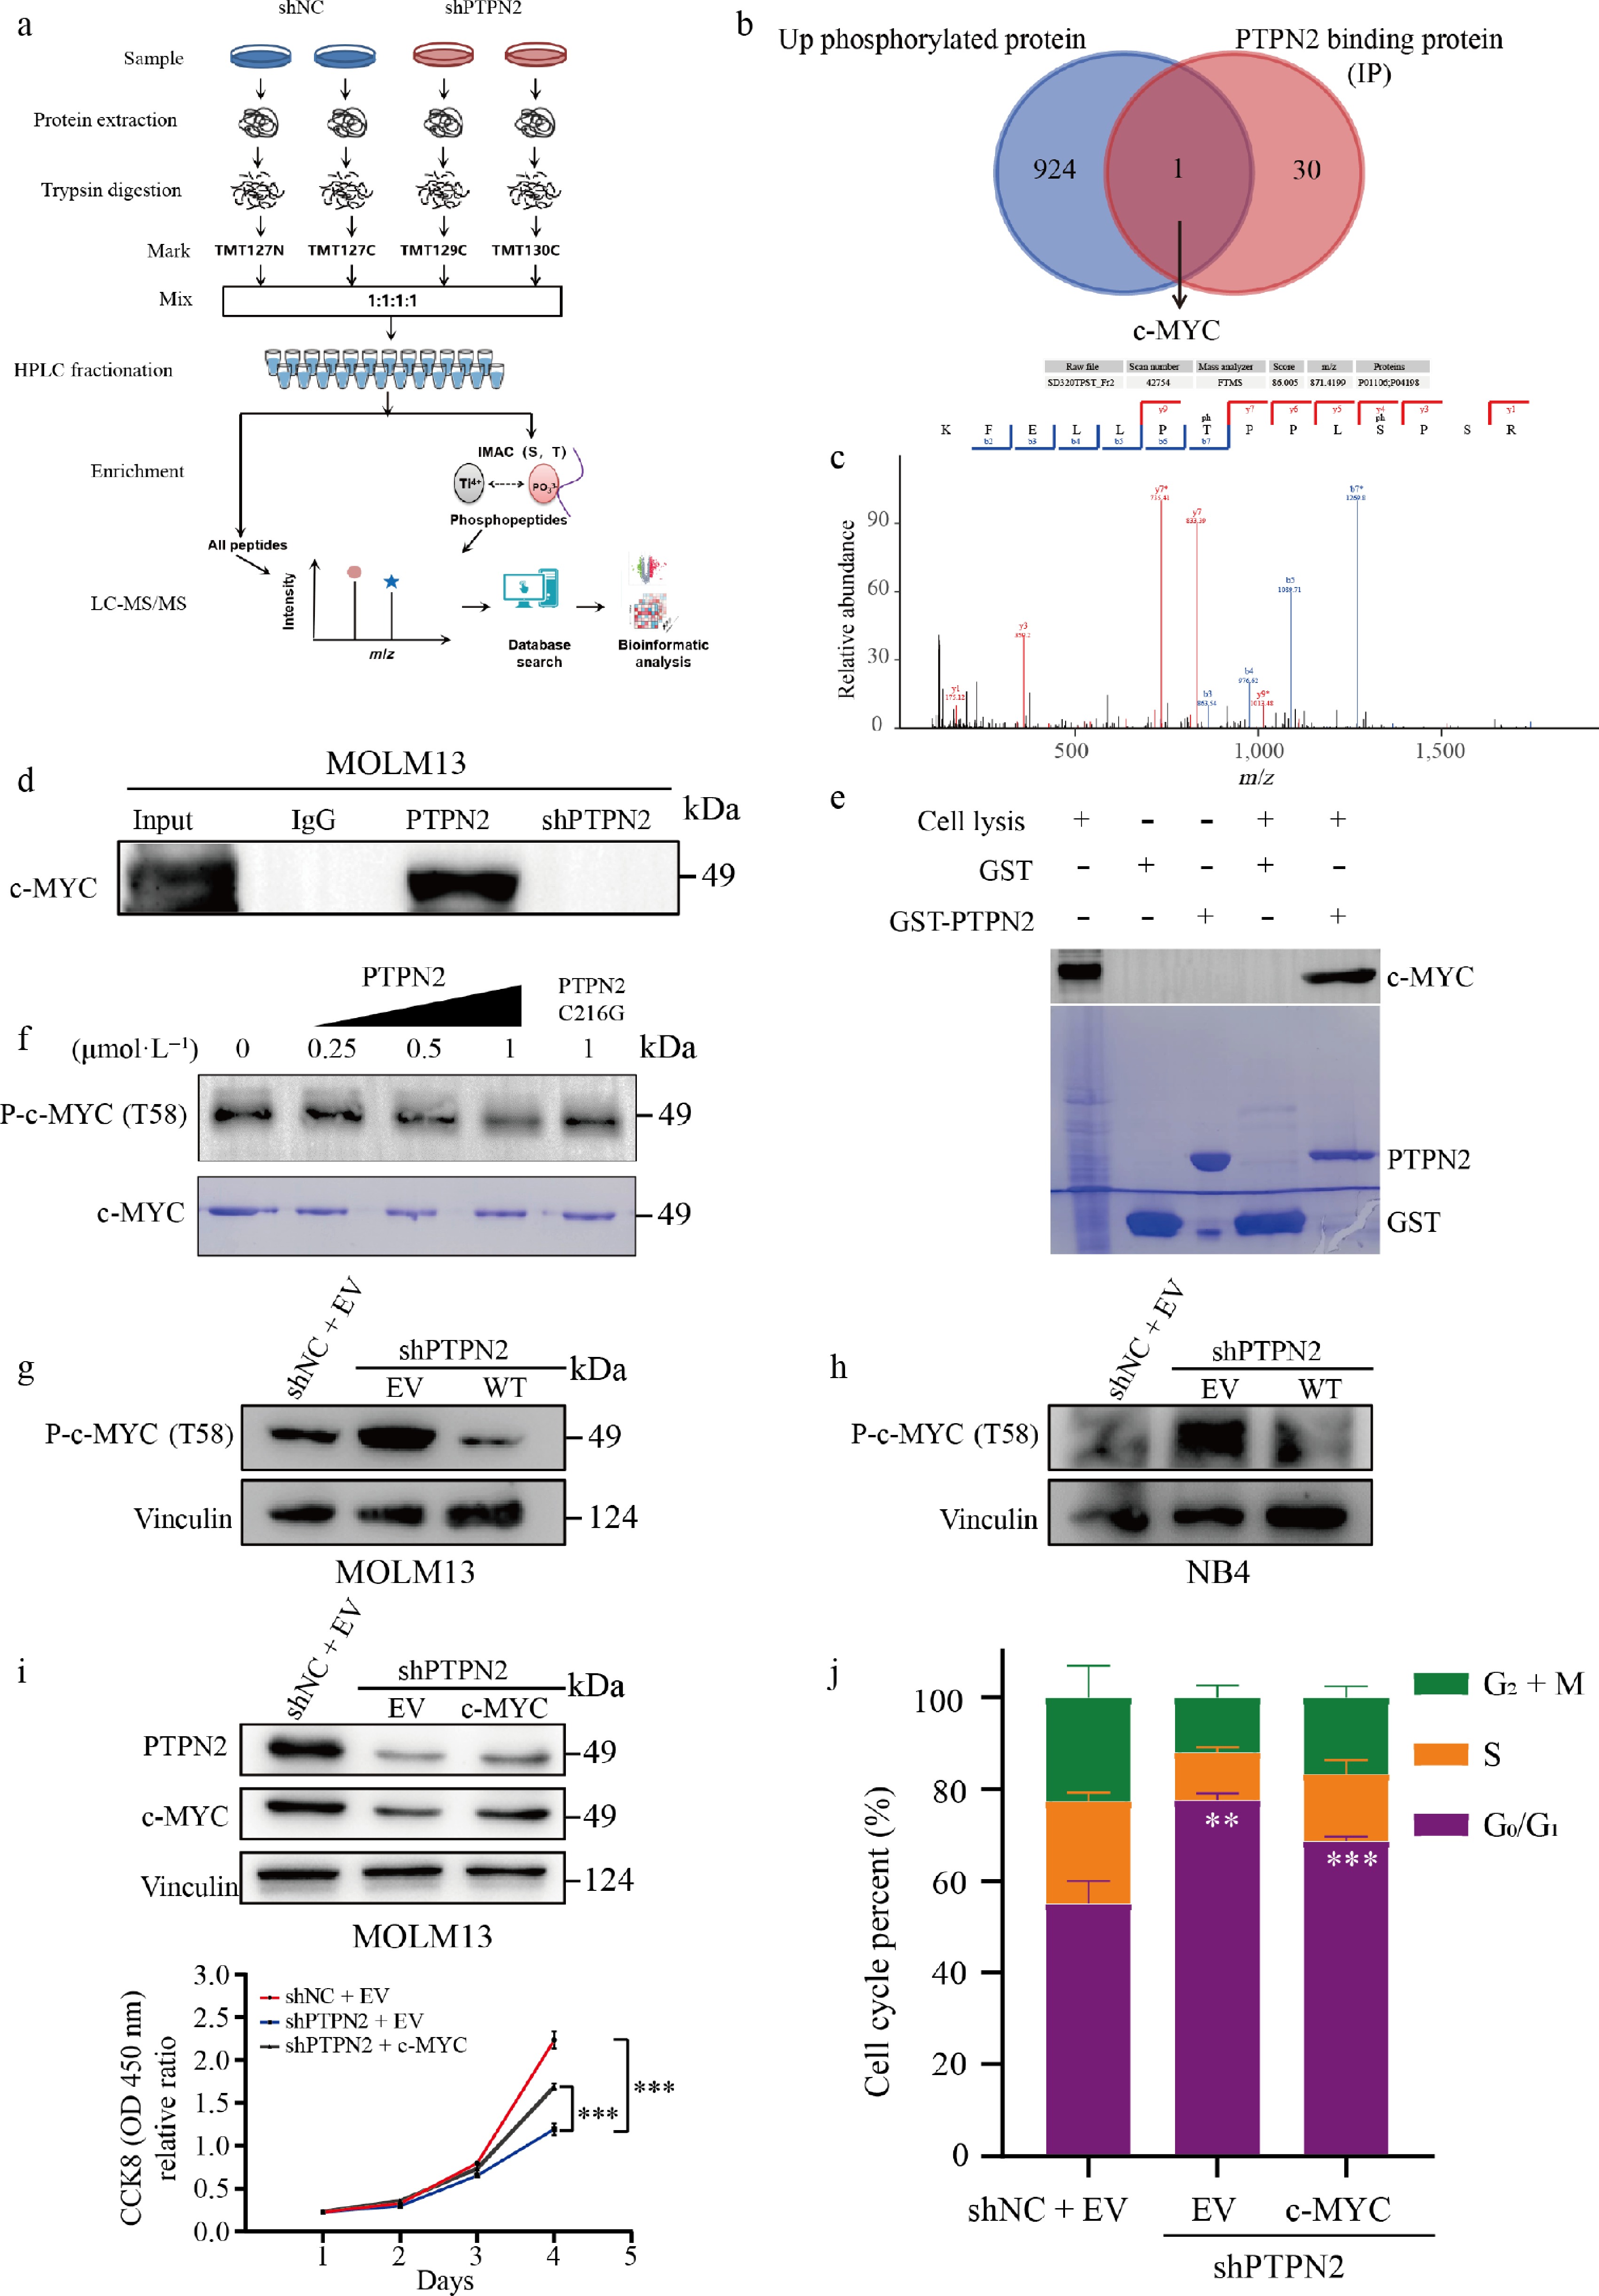
Figure 5.
Quantitative phosphoproteomic analysis of MOLM13 cells with PTPN2 knockdown and validation of PTPN2 substrates. (a) Workflow of the phosphoproteomic approach. Samples were separately lysed, digested, and TMT marked and the phosphorylated peptides were enriched by the IMAC tip and analyzed by LC-MS/MS. (b) Venn diagrams show the overlap of up-phosphorylated proteins and PTPN2-binding proteins (IP). (c) MS/MS spectra of the phosphosites of the potential PTPN2 substrates, pT58 of c-MYC. (d) Validation of interaction of c-MYC with PTPN2 by co-immunoprecipitation assay. (e) Validation of interaction of c-MYC with PTPN2 by GST pull assay. (f) Dephosphorylated c-MYC T58 levels by PTPN2 were assessed by western blot in an in vitro dephosphorylation assay. (g), (h) Protein level of P-c-MYC (T58) in MOLM13 and NB4 cells that were infected with lentiviral shNC, shPTPN2, and overexpression. (i) Protein level of PTPN2 and c-MYC in MOLM13 shNC, shPTPN2 and overexpression c-MYC cells. Cell viability of cells during a 4-d course. Data represent the mean ± SD. Statistical analysis was performed using a two-tailed unpaired Student's t-test. (j) Cell cycle phase distribution of MOLM13 shNC, shPTPN2, and overexpression c-MYC cells analyzed by flow cytometry. Data represent the mean ± SD. Statistical analysis was performed using a two-tailed unpaired Student's t-test. ** P < 0.01; *** P < 0.001.
-
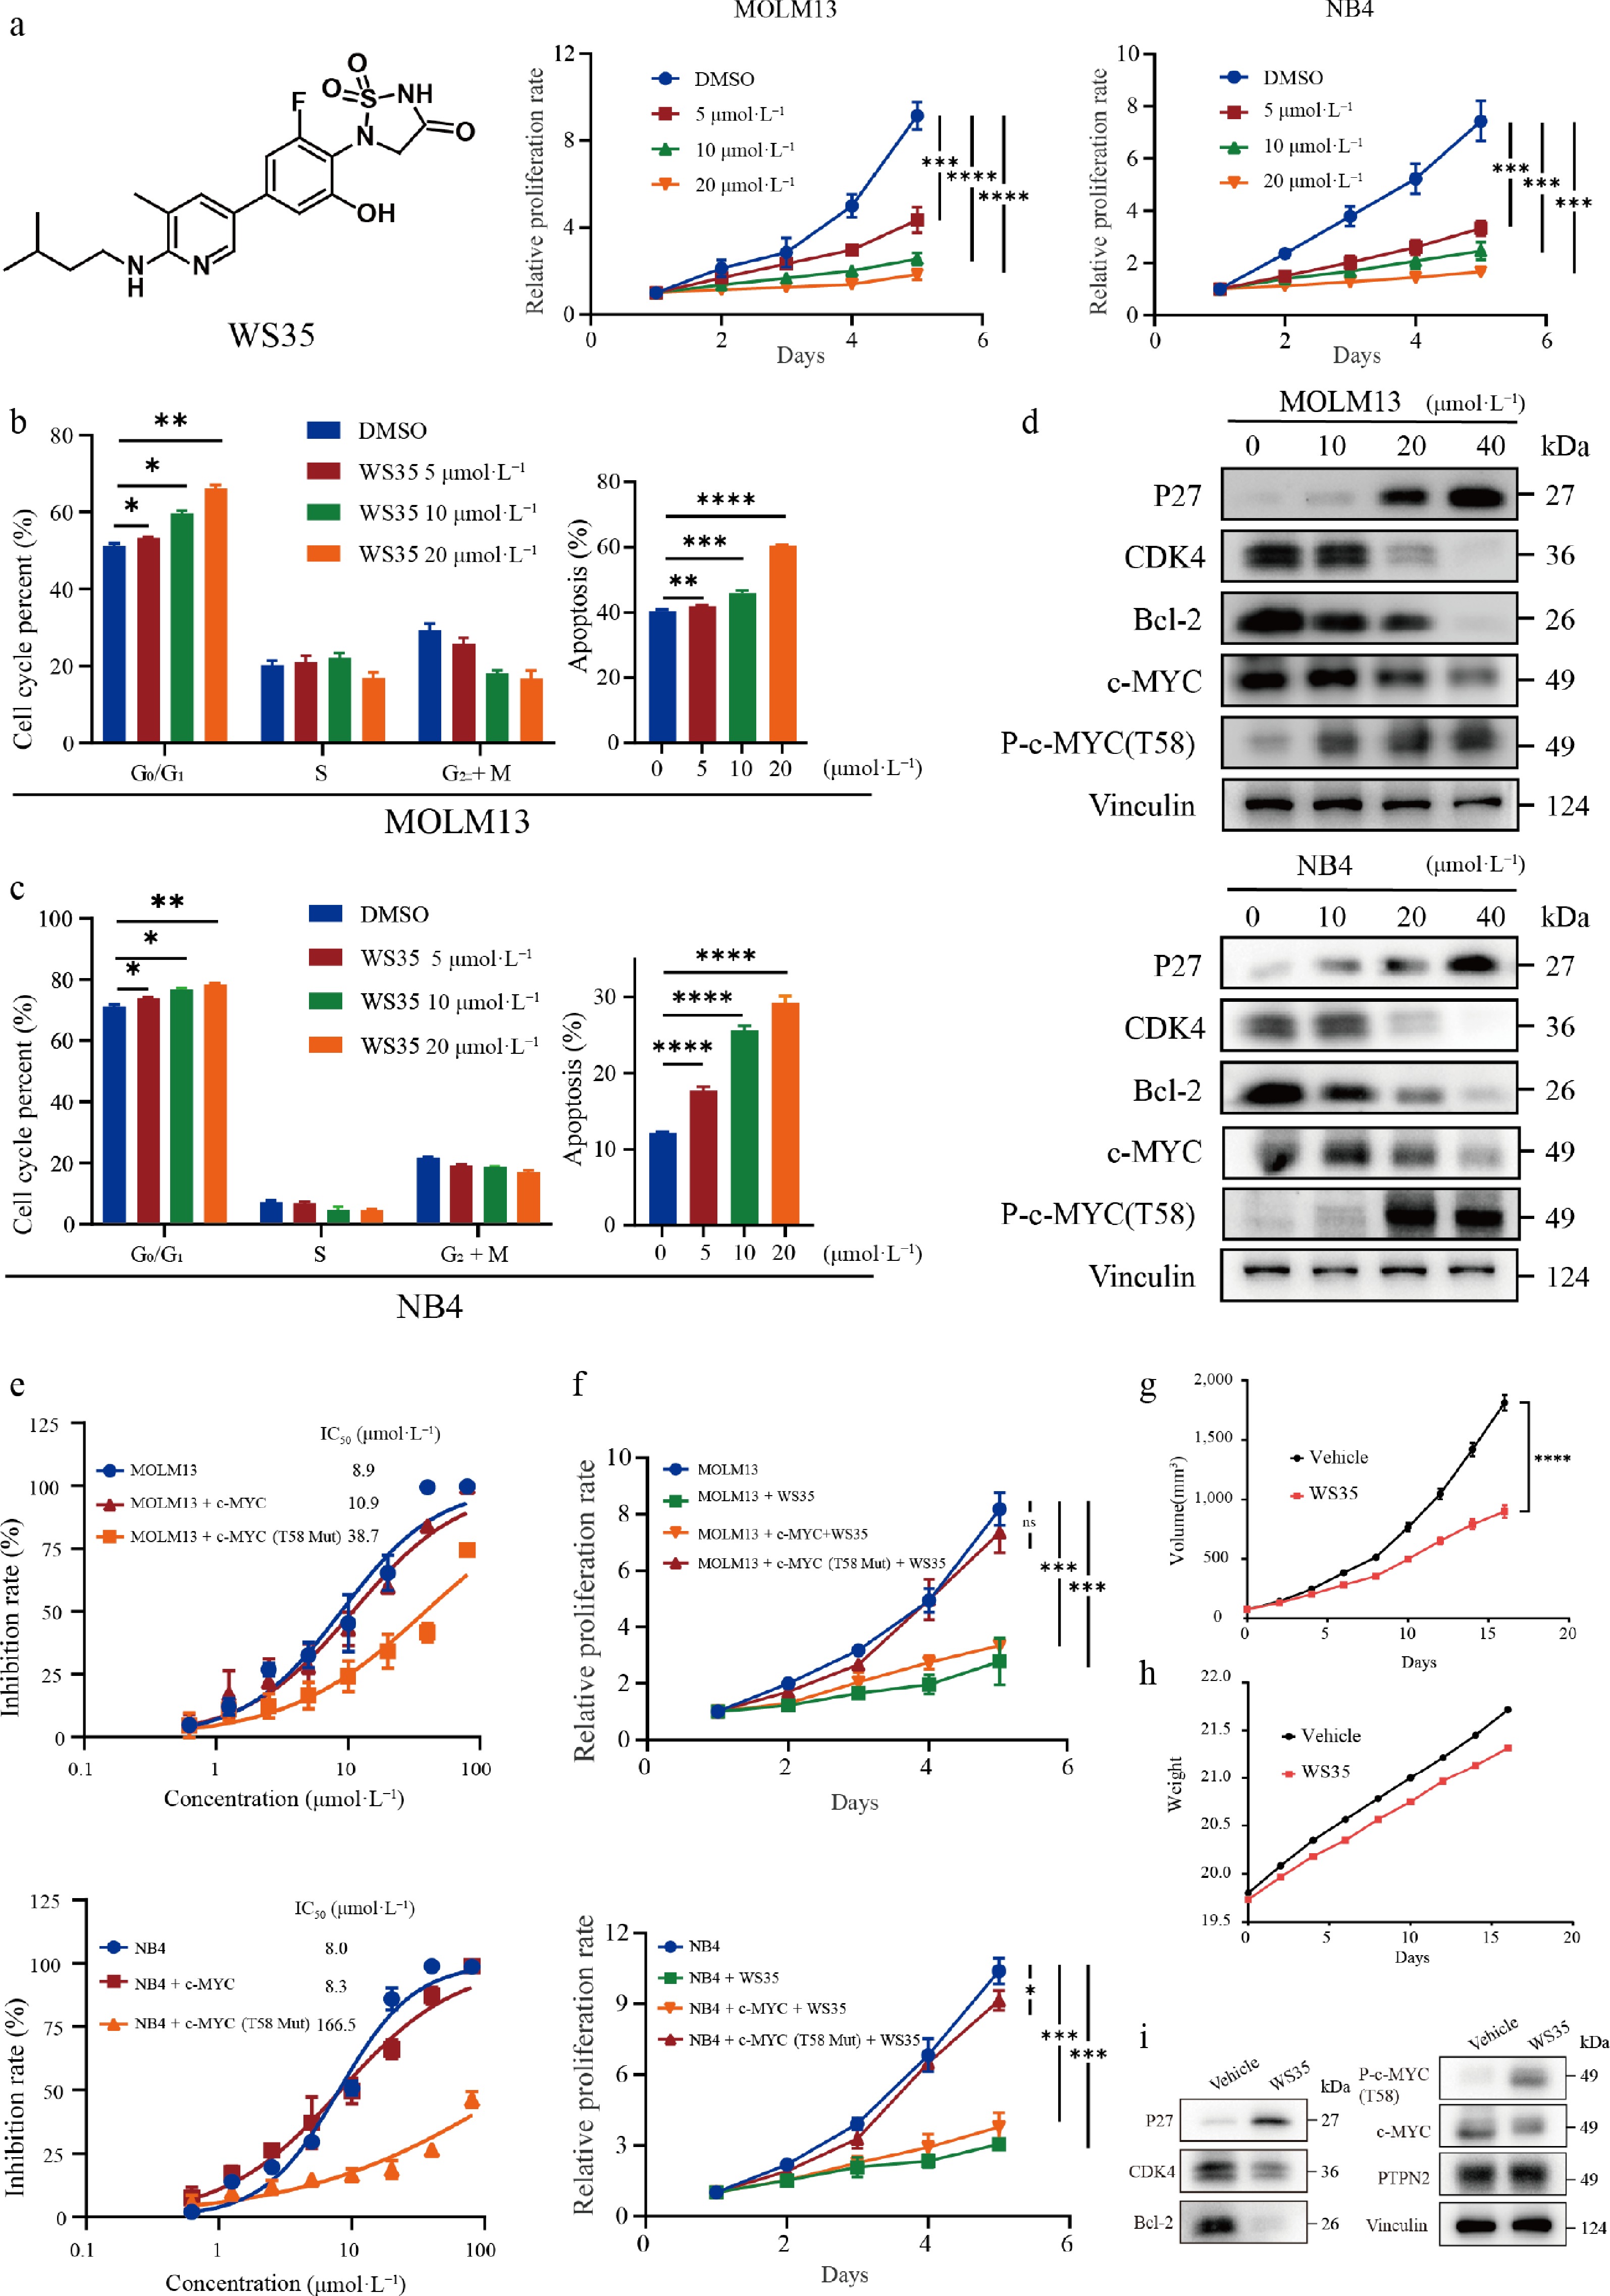
Figure 6.
The PTPN2 inhibitor WS35 suppresses AML cell proliferation both in vitro and in vivo. (a) Structure of the PTPN2 inhibitor WS35 and cell viability of MOLM13 and NB4 cells treated with DMSO or 5, 10, or 20 μmol·L−1 WS35 during a 5-d course. Data represent the mean ± SD. Statistical analysis was performed using a two-tailed unpaired Student's t-test. (b) Cell cycle phase distribution and apoptotic rates of MOLM13 cells after treatment with DMSO, WS35 (5, 10, 20 μmol·L−1) for 24 h were determined by flow cytometry. Data represent the mean ± SD. Statistical analysis was performed using a two-tailed unpaired Student's t-test. (c) Cell cycle phase distribution and apoptotic rates of NB4 cells after treatment with DMSO, WS35 (5, 10, 20 μmol·L−1) for 24 h were determined by flow cytometry. Data represent the mean ± SD. Statistical analysis was performed using a two-tailed unpaired Student's t-test. (d) The total proteins in MOLM13 and NB4 cells were extracted and used in the western blotting analysis of indicated proteins. (e) IC50 values of WS35 against the viability of MOLM13 and NB4 cells and overexpressed c-MYC and c-MYC T58 mutant proteins in MOLM13 and NB4 cells. Data represent the mean ± SD, n = 3 biological replicates. (f) Cell viability of in MOLM13 and NB4 cells and overexpressed the c-MYC and c-MYC T58 mutant proteins in MOLM13 and NB4 cells treated with 10 μmol·L−1 WS35 during a 5-d course. Data represent the mean ± SD. Statistical analysis was performed using a two-tailed unpaired Student's t-test. (g) Male BALB/c nude mice were implanted subcutaneously with NB4 cells, and they were divided into a control group and a treatment group (n = 6 in each group). Tumor volume of mice in each group. (h) Body weight of mice in each group. (i) The total proteins in tumor tissue were extracted and used in the western blotting analysis of the indicated proteins. Data represent the mean ± SD. Statistical analysis was performed using a two-tailed unpaired Student's t-test. * P < 0.05; ** P < 0.01; *** P < 0.001; **** P < 0.0001; ns, not significant.
-
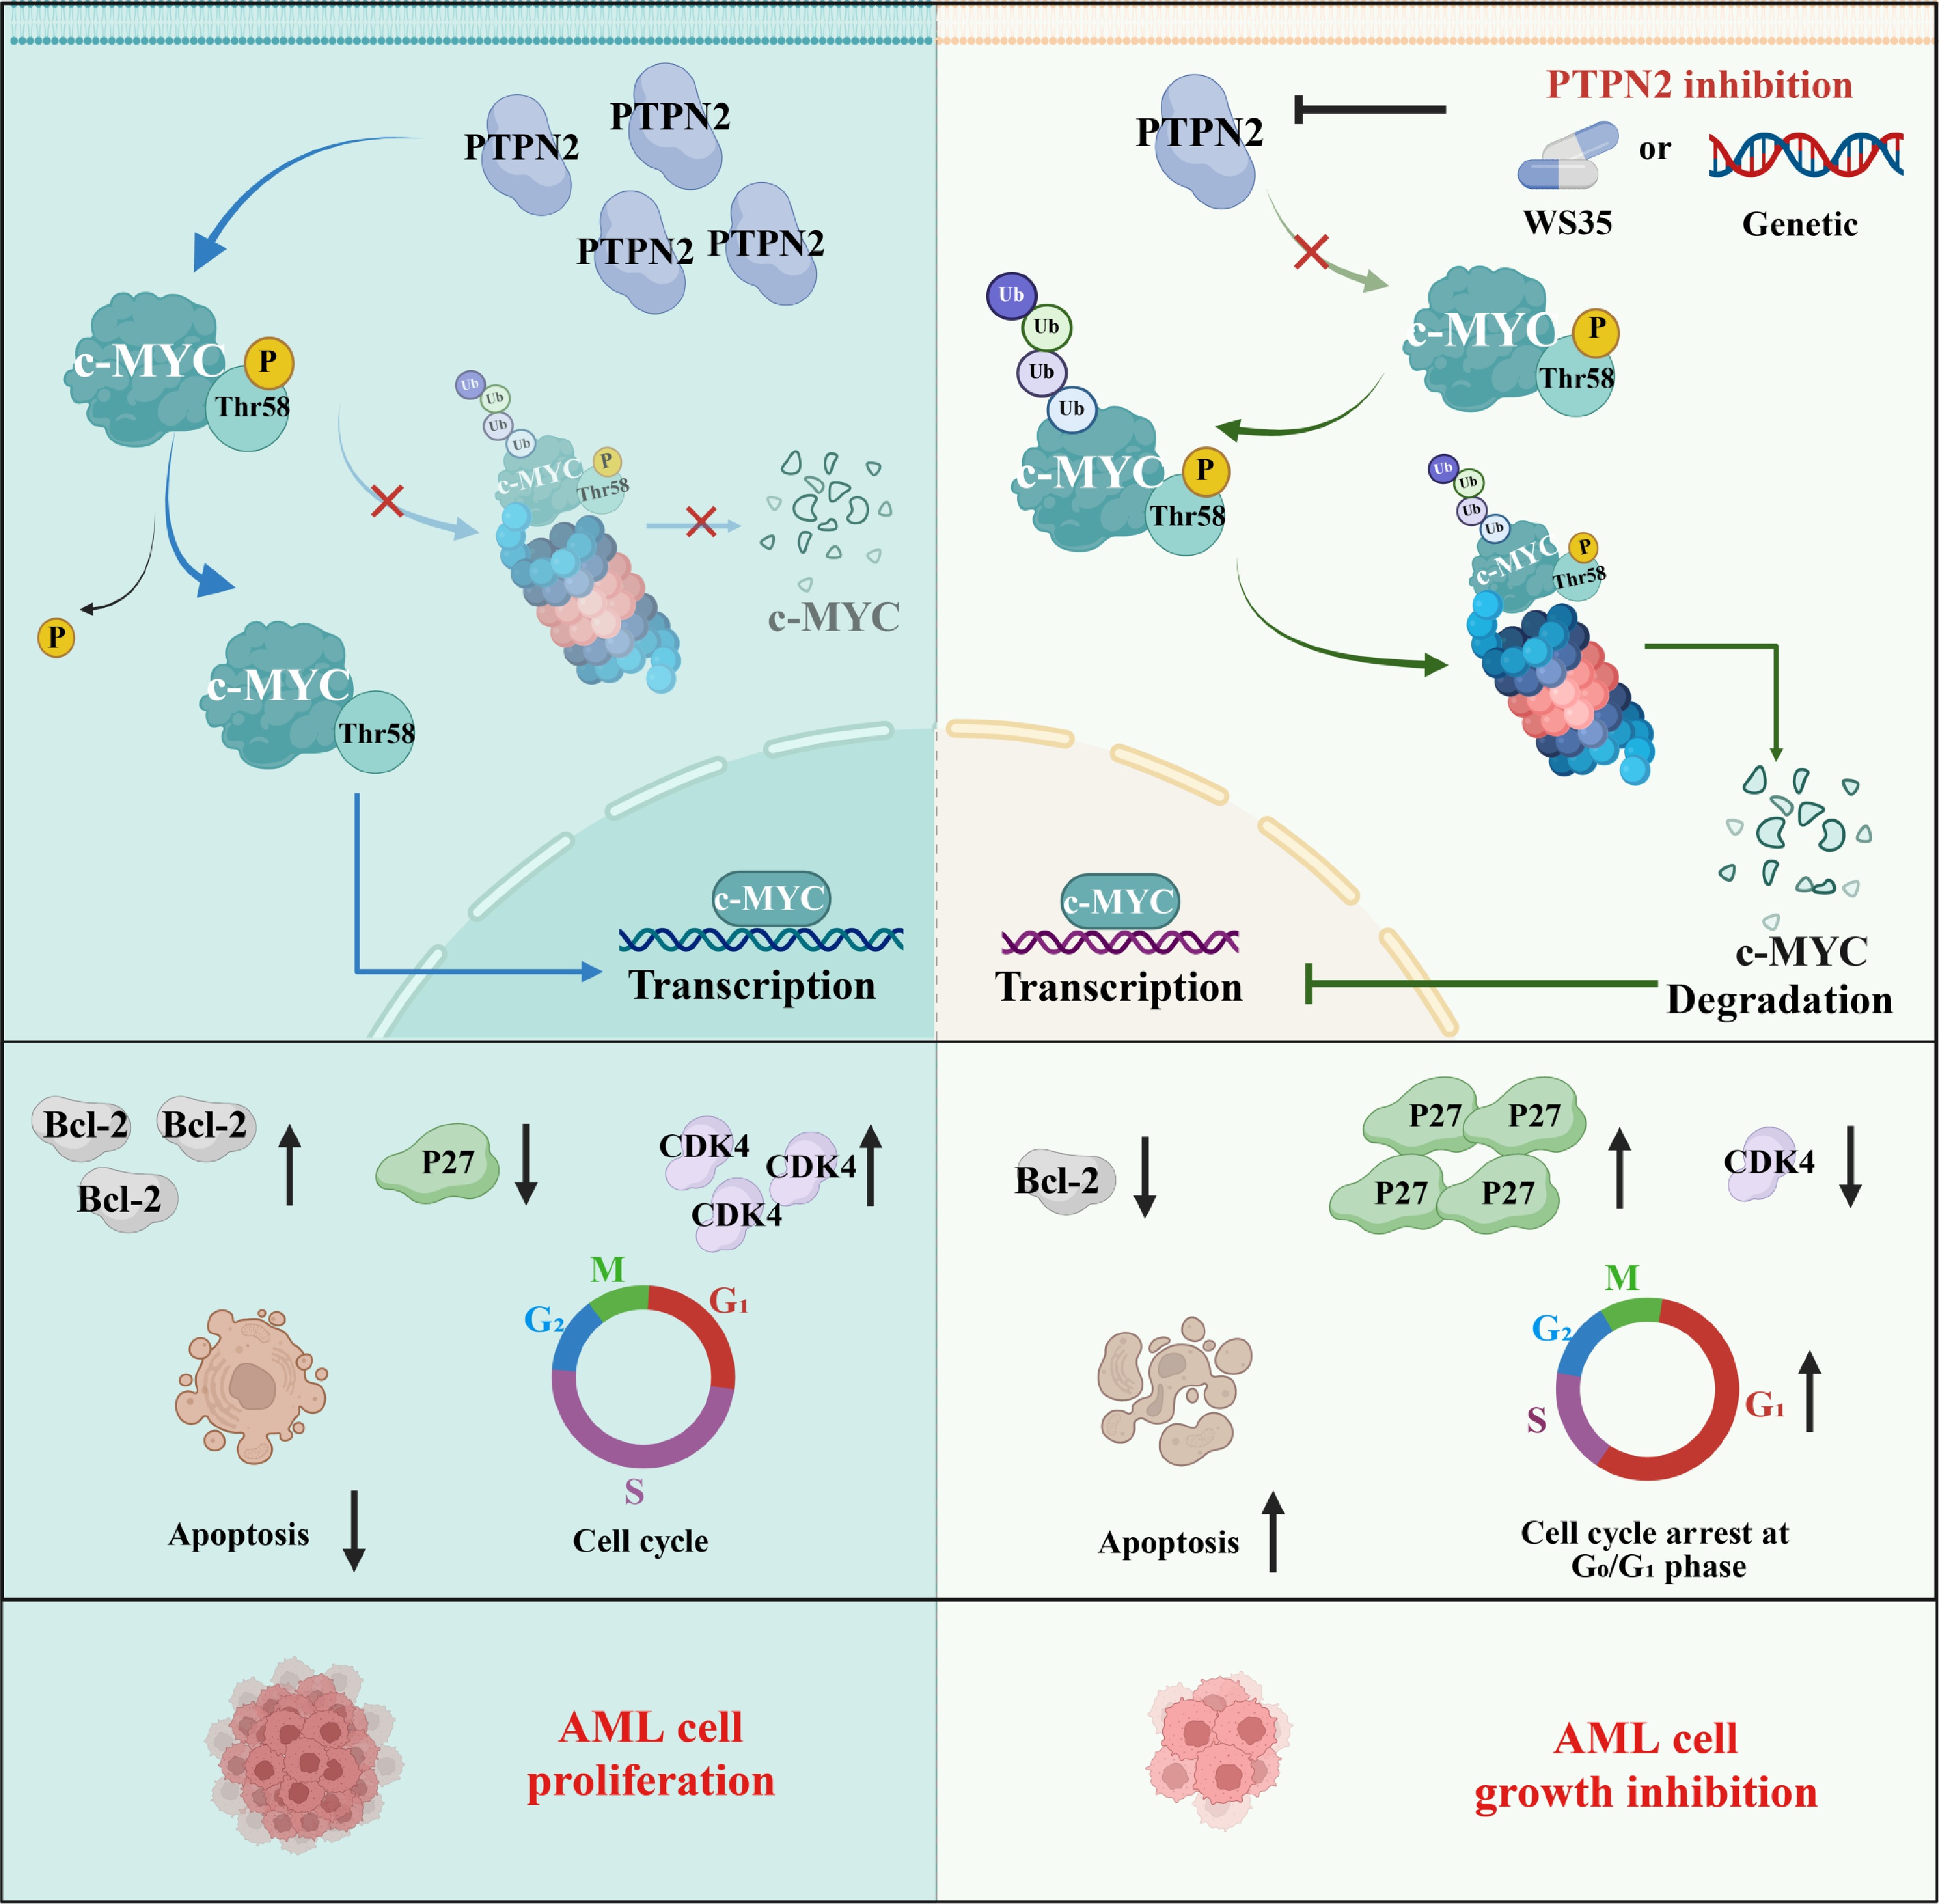
Figure 7.
A proposed working model showing the PTPN2/c-MYC/CDK4 signaling axis and its roles in contributing to AML proliferation.
Figures
(7)
Tables
(0)