-
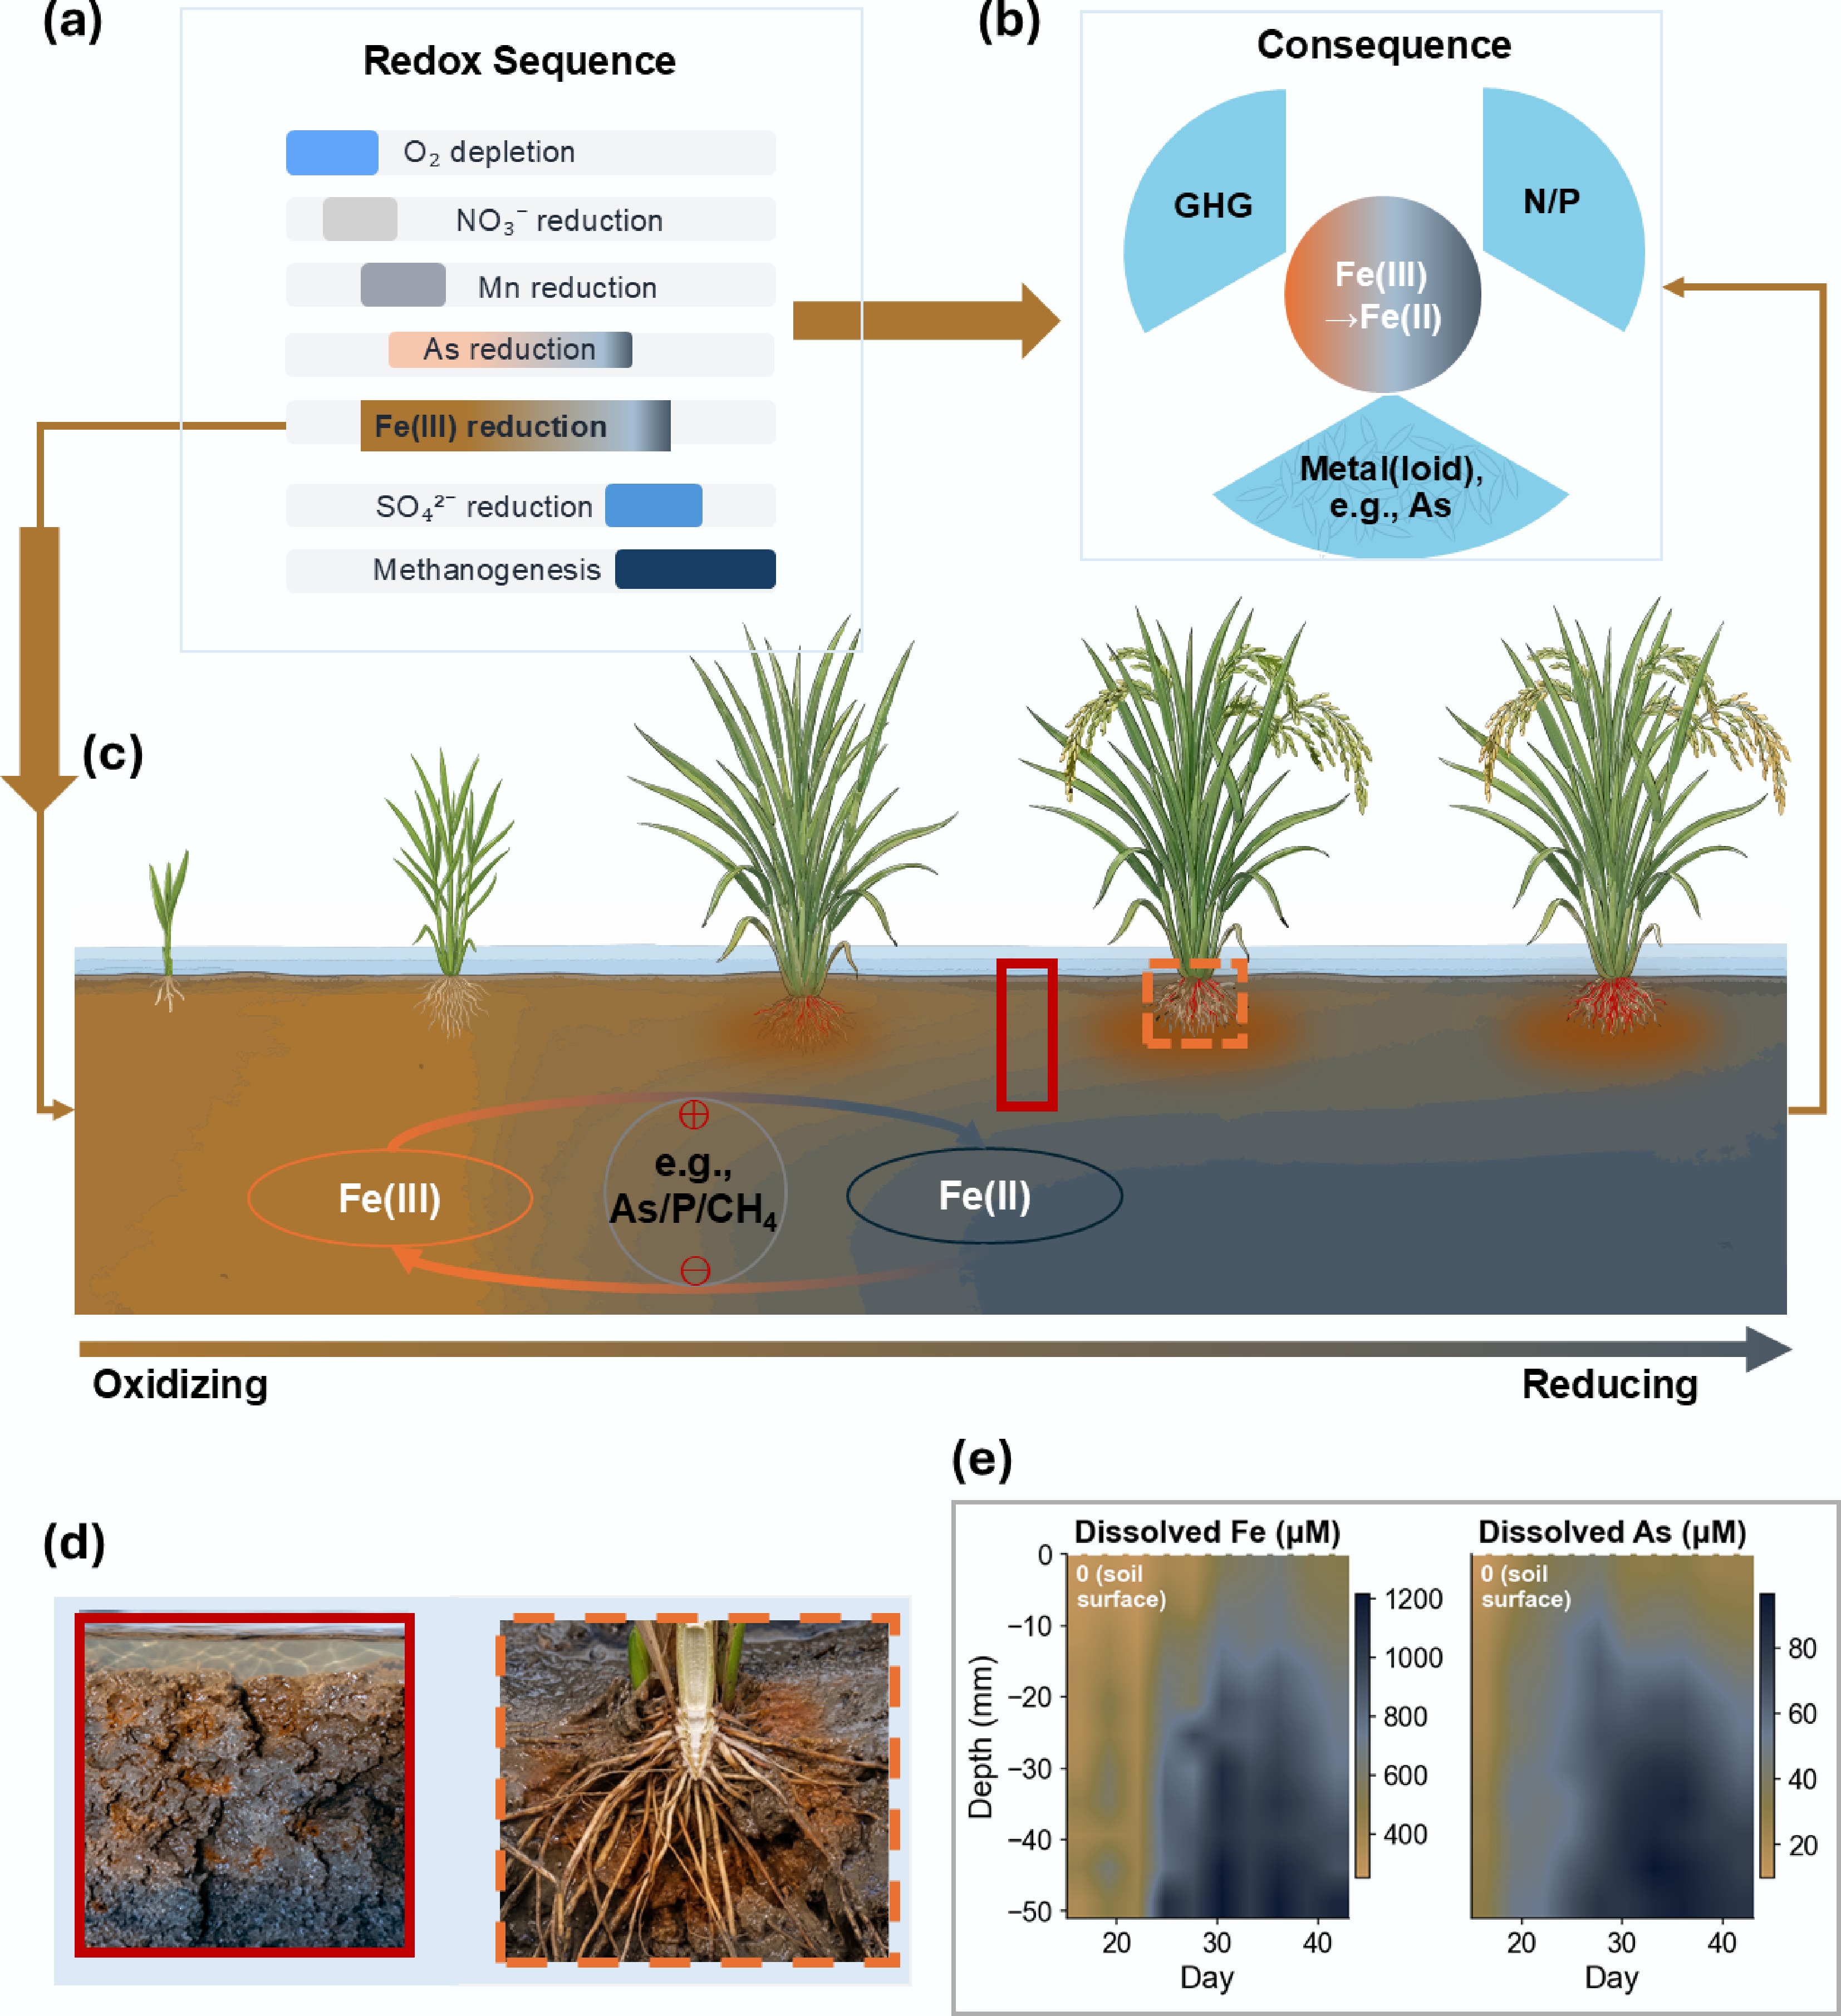
Figure 1.
Iron cycling as a redox hub linking greenhouse gas (GHG) emissions, nutrient availability, and metal(loid) dynamics in paddy soils. (a) Thermodynamically constrained redox succession of major electron acceptors during soil-based reduction. (b) Iron cycling functions as a biogeochemical control point regulating GHG emissions, nutrient transformations (e.g., N and P), and metal(loid) mobility, particularly As. (c) Progressive color transitions across the soil–water interface (SWI) reflect Fe mineral transformation during reduction, whereas the rust-colored rhizosphere indicates the formation of Fe plaques through oxygen-mediated oxidation of ferrous Fe(II). (d) Photographs illustrating spatial variations in iron-associated color development across the SWI and the rhizosphere. (e) Spatiotemporal distributions of dissolved Fe and As at the SWI during flooding, reconstructed from replicate-averaged concentrations reported in a previous study (note that depth-resolved pH ranges from 3.42 to 6.07)[18].
-
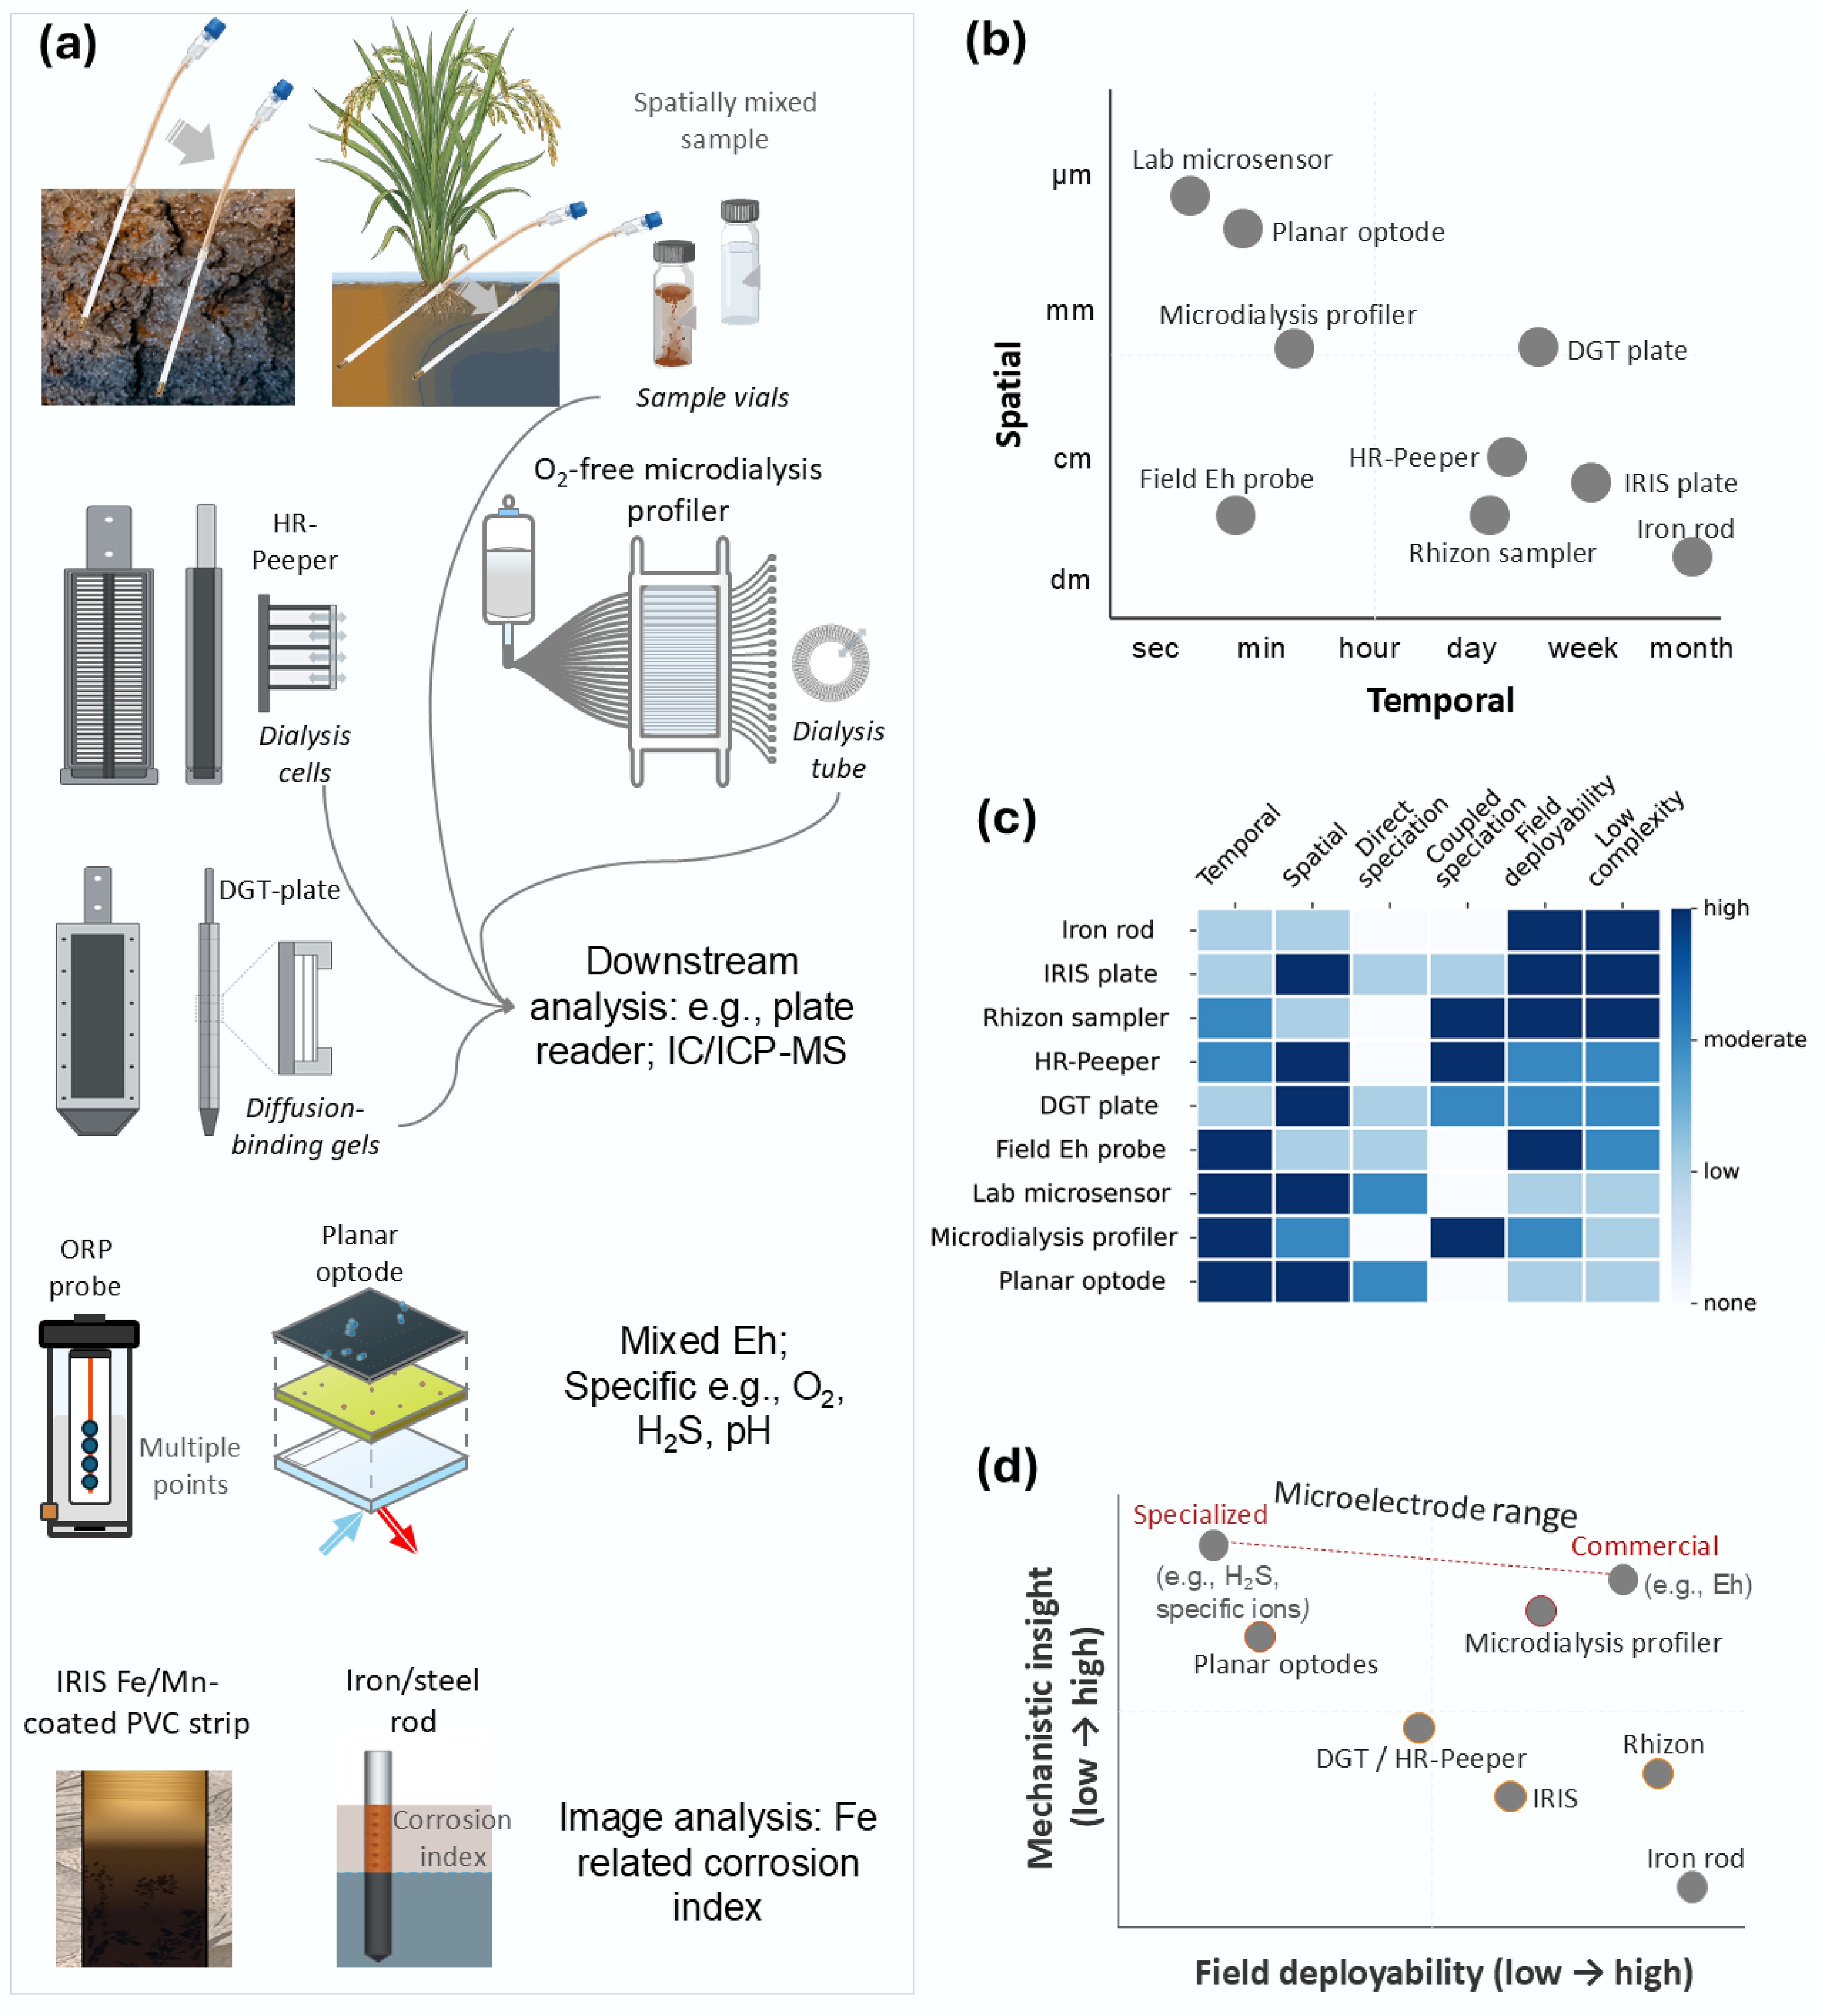
Figure 2.
Methods for tracking redox dynamics in paddy soils. (a) Overview of representative approaches, including porewater samplers (Rhizon, HR-Peeper, and O2-free microdialysis profilers), DGT-based chemical imaging, direct sensors (oxidation–reduction potential [ORP or Eh] probes and planar optodes), and Fe-based indicators (IRIS and Fe/steel rods). Chemical speciation from sampling-based approaches generally requires coupling with complementary techniques (e.g., spectroscopy, IC, or inductively coupled plasma – mass spectroscopy [ICP-MS]). (b) Comparison of the spatial and temporal resolution domains covered by different approaches. (c) Relative evaluation of analytical capabilities, including spatiotemporal resolution, speciation potential, field deployability, and technical complexity. (d) Conceptual trade-off between process interpretation potential and field applicability.
-
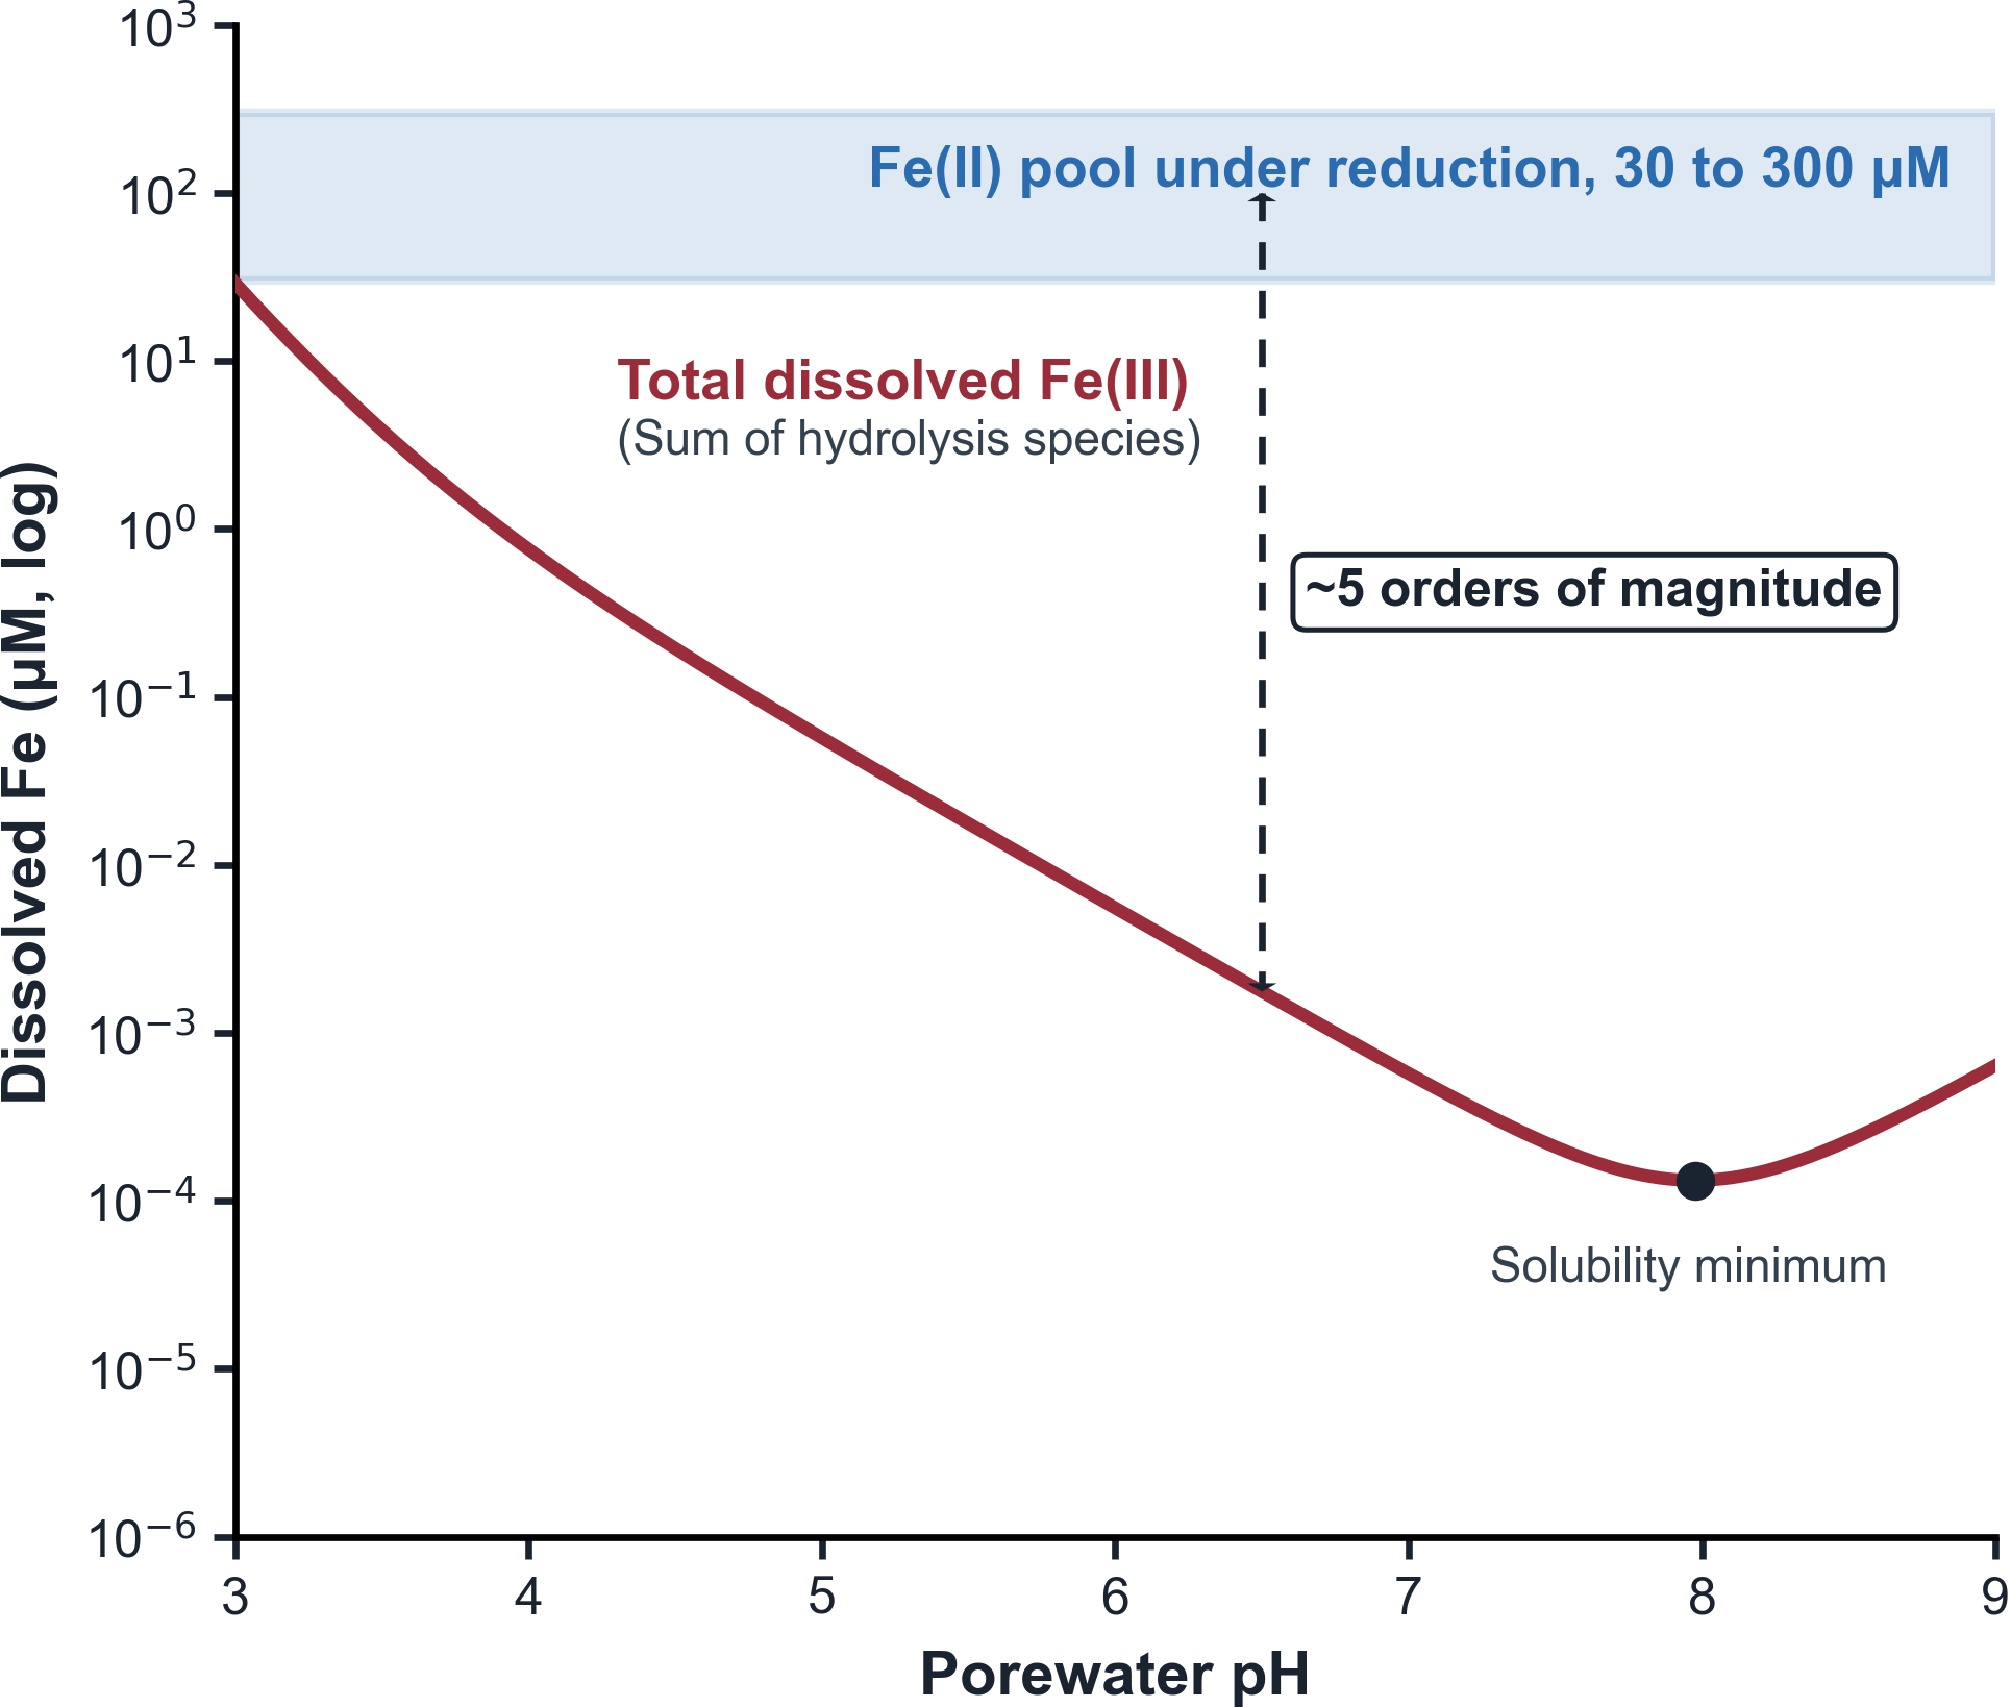
Figure 3.
Thermodynamic and kinetic basis for TDFe's accumulation under flooded paddy conditions. The red curve represents the theoretical upper constraint of dissolved inorganic Fe(III) concentrations imposed by ferric hydroxide's solubility across pH gradients (calculated from cumulative hydrolysis equilibria). The blue region represents the expected dissolved Fe(II) accumulation range under reducing paddy conditions based on reaction–transport simulations and independent field observations, assuming typical paddy parameters (reduction intensity
$ \mathrm{r}\in \left[0.05,~1\right] $ -
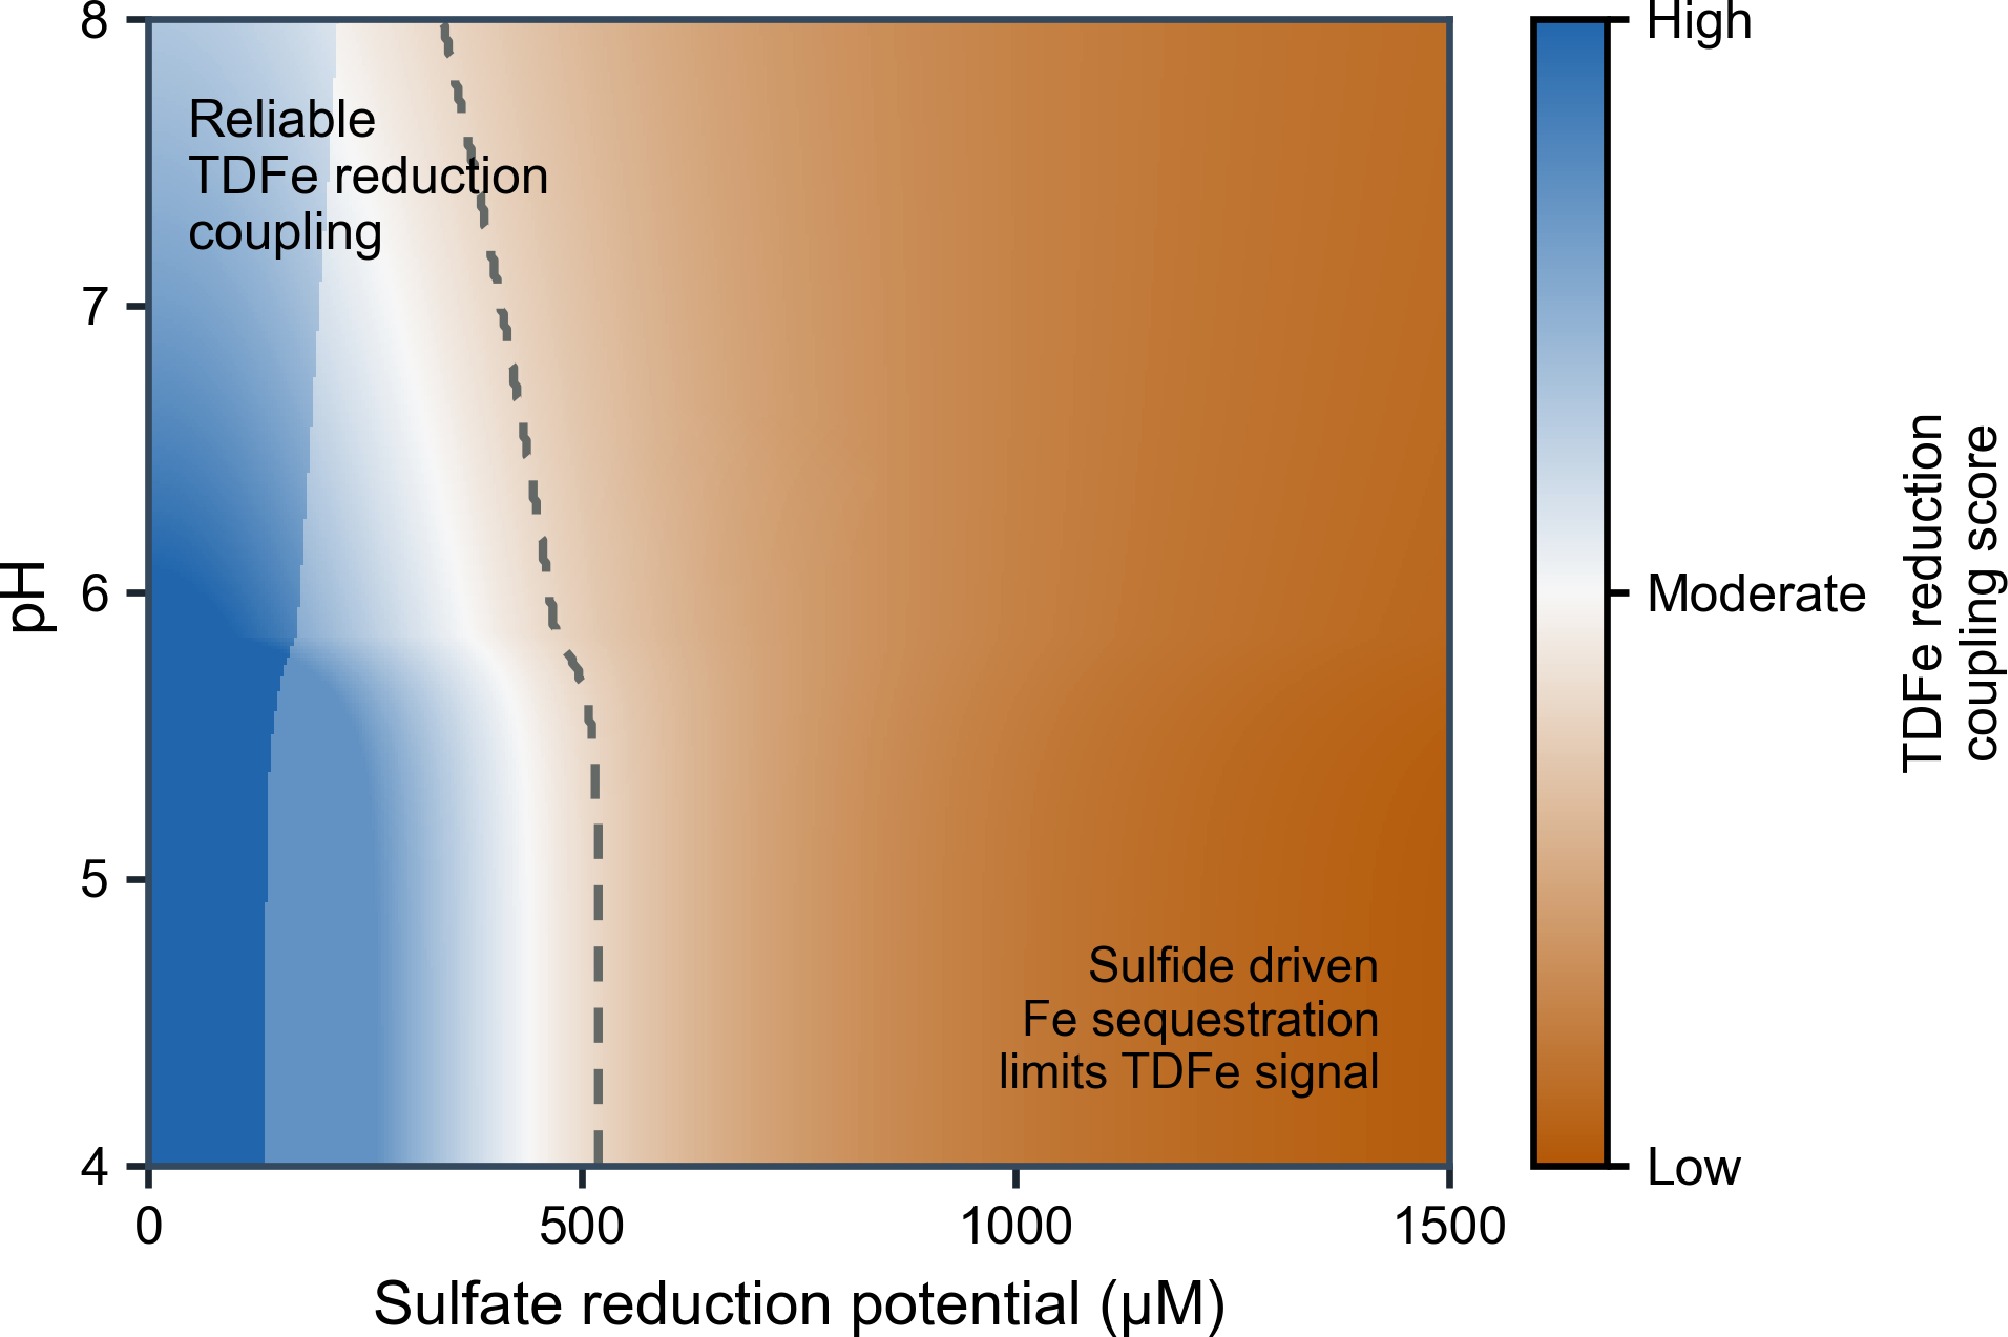
Figure 4.
Conceptual applicability domain of TDFe as a process-window indicator of Fe reduction, shown as a reaction–transport-based evaluation of TDFe–reduction coupling across sulfate reduction potential and pH gradients. Blue regions represent conditions where dissolved Fe provides a monotonic and sensitive signal of Fe reduction, whereas orange regions indicate decoupling caused by competing Fe sequestration or limited accumulation of dissolved Fe. The transition zone is conditional on reactive Fe's availability, the organic carbon supply, and the sulfate reduction kinetics rather than being defined by a universal threshold.
-
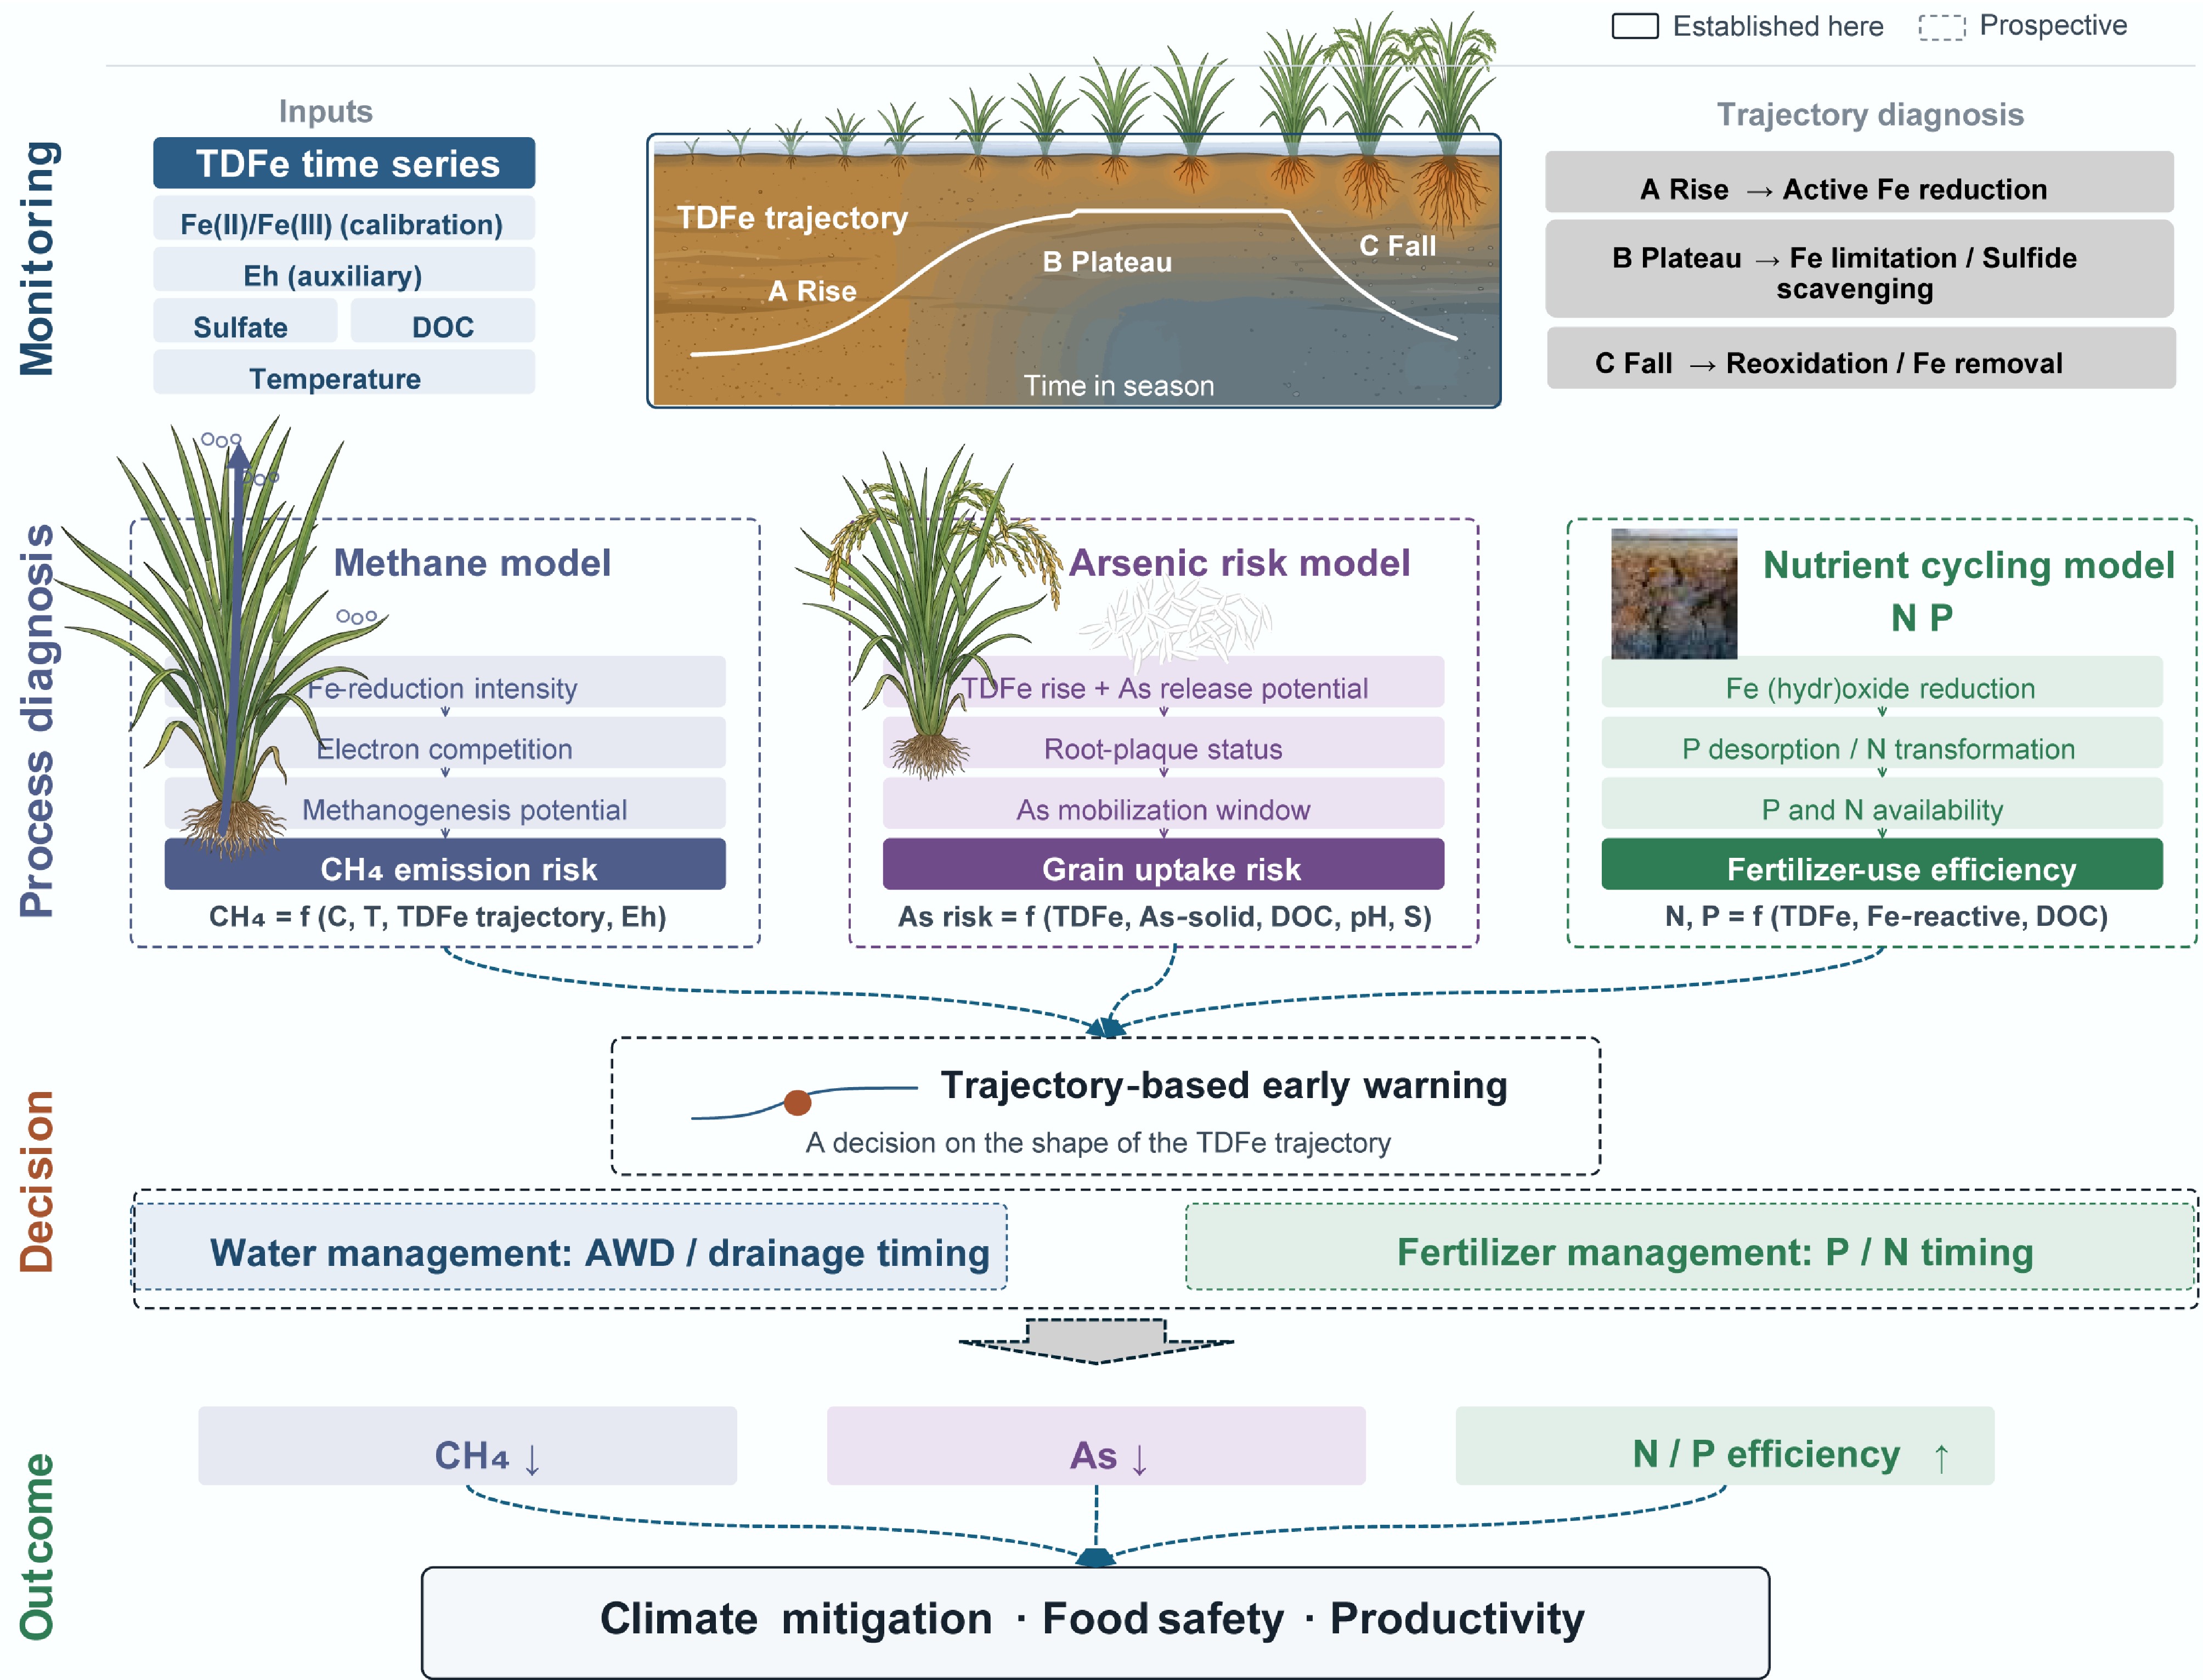
Figure 5.
From TDFe monitoring to process-informed environmental management in flooded soils. A prospective framework in which TDFe serves as a process variable rather than an endpoint measurement. A temporally resolved TDFe trajectory is interpreted to identify the distinct phases of Fe-mediated reduction dynamics, including increased accumulation of dissolved Fe, constrained Fe mobilization or sulfide-related attenuation, and oxidative recovery (Layer 1). These trajectories can inform coupled process models describing methane emissions, mobilization of As, and nutrient (e.g., N and P) dynamics (Layer 2), enabling trajectory-based early warning frameworks to support adaptive water and fertilizer management (Layer 3). The ultimate goal is to integrate redox process monitoring with climate mitigation, food safety, and nutrient use efficiency objectives (Layer 4). Solid outlines denote concepts established in this Perspective; dashed outlines indicate prospective developments. All trajectories are schematic.
Figures
(5)
Tables
(0)