-
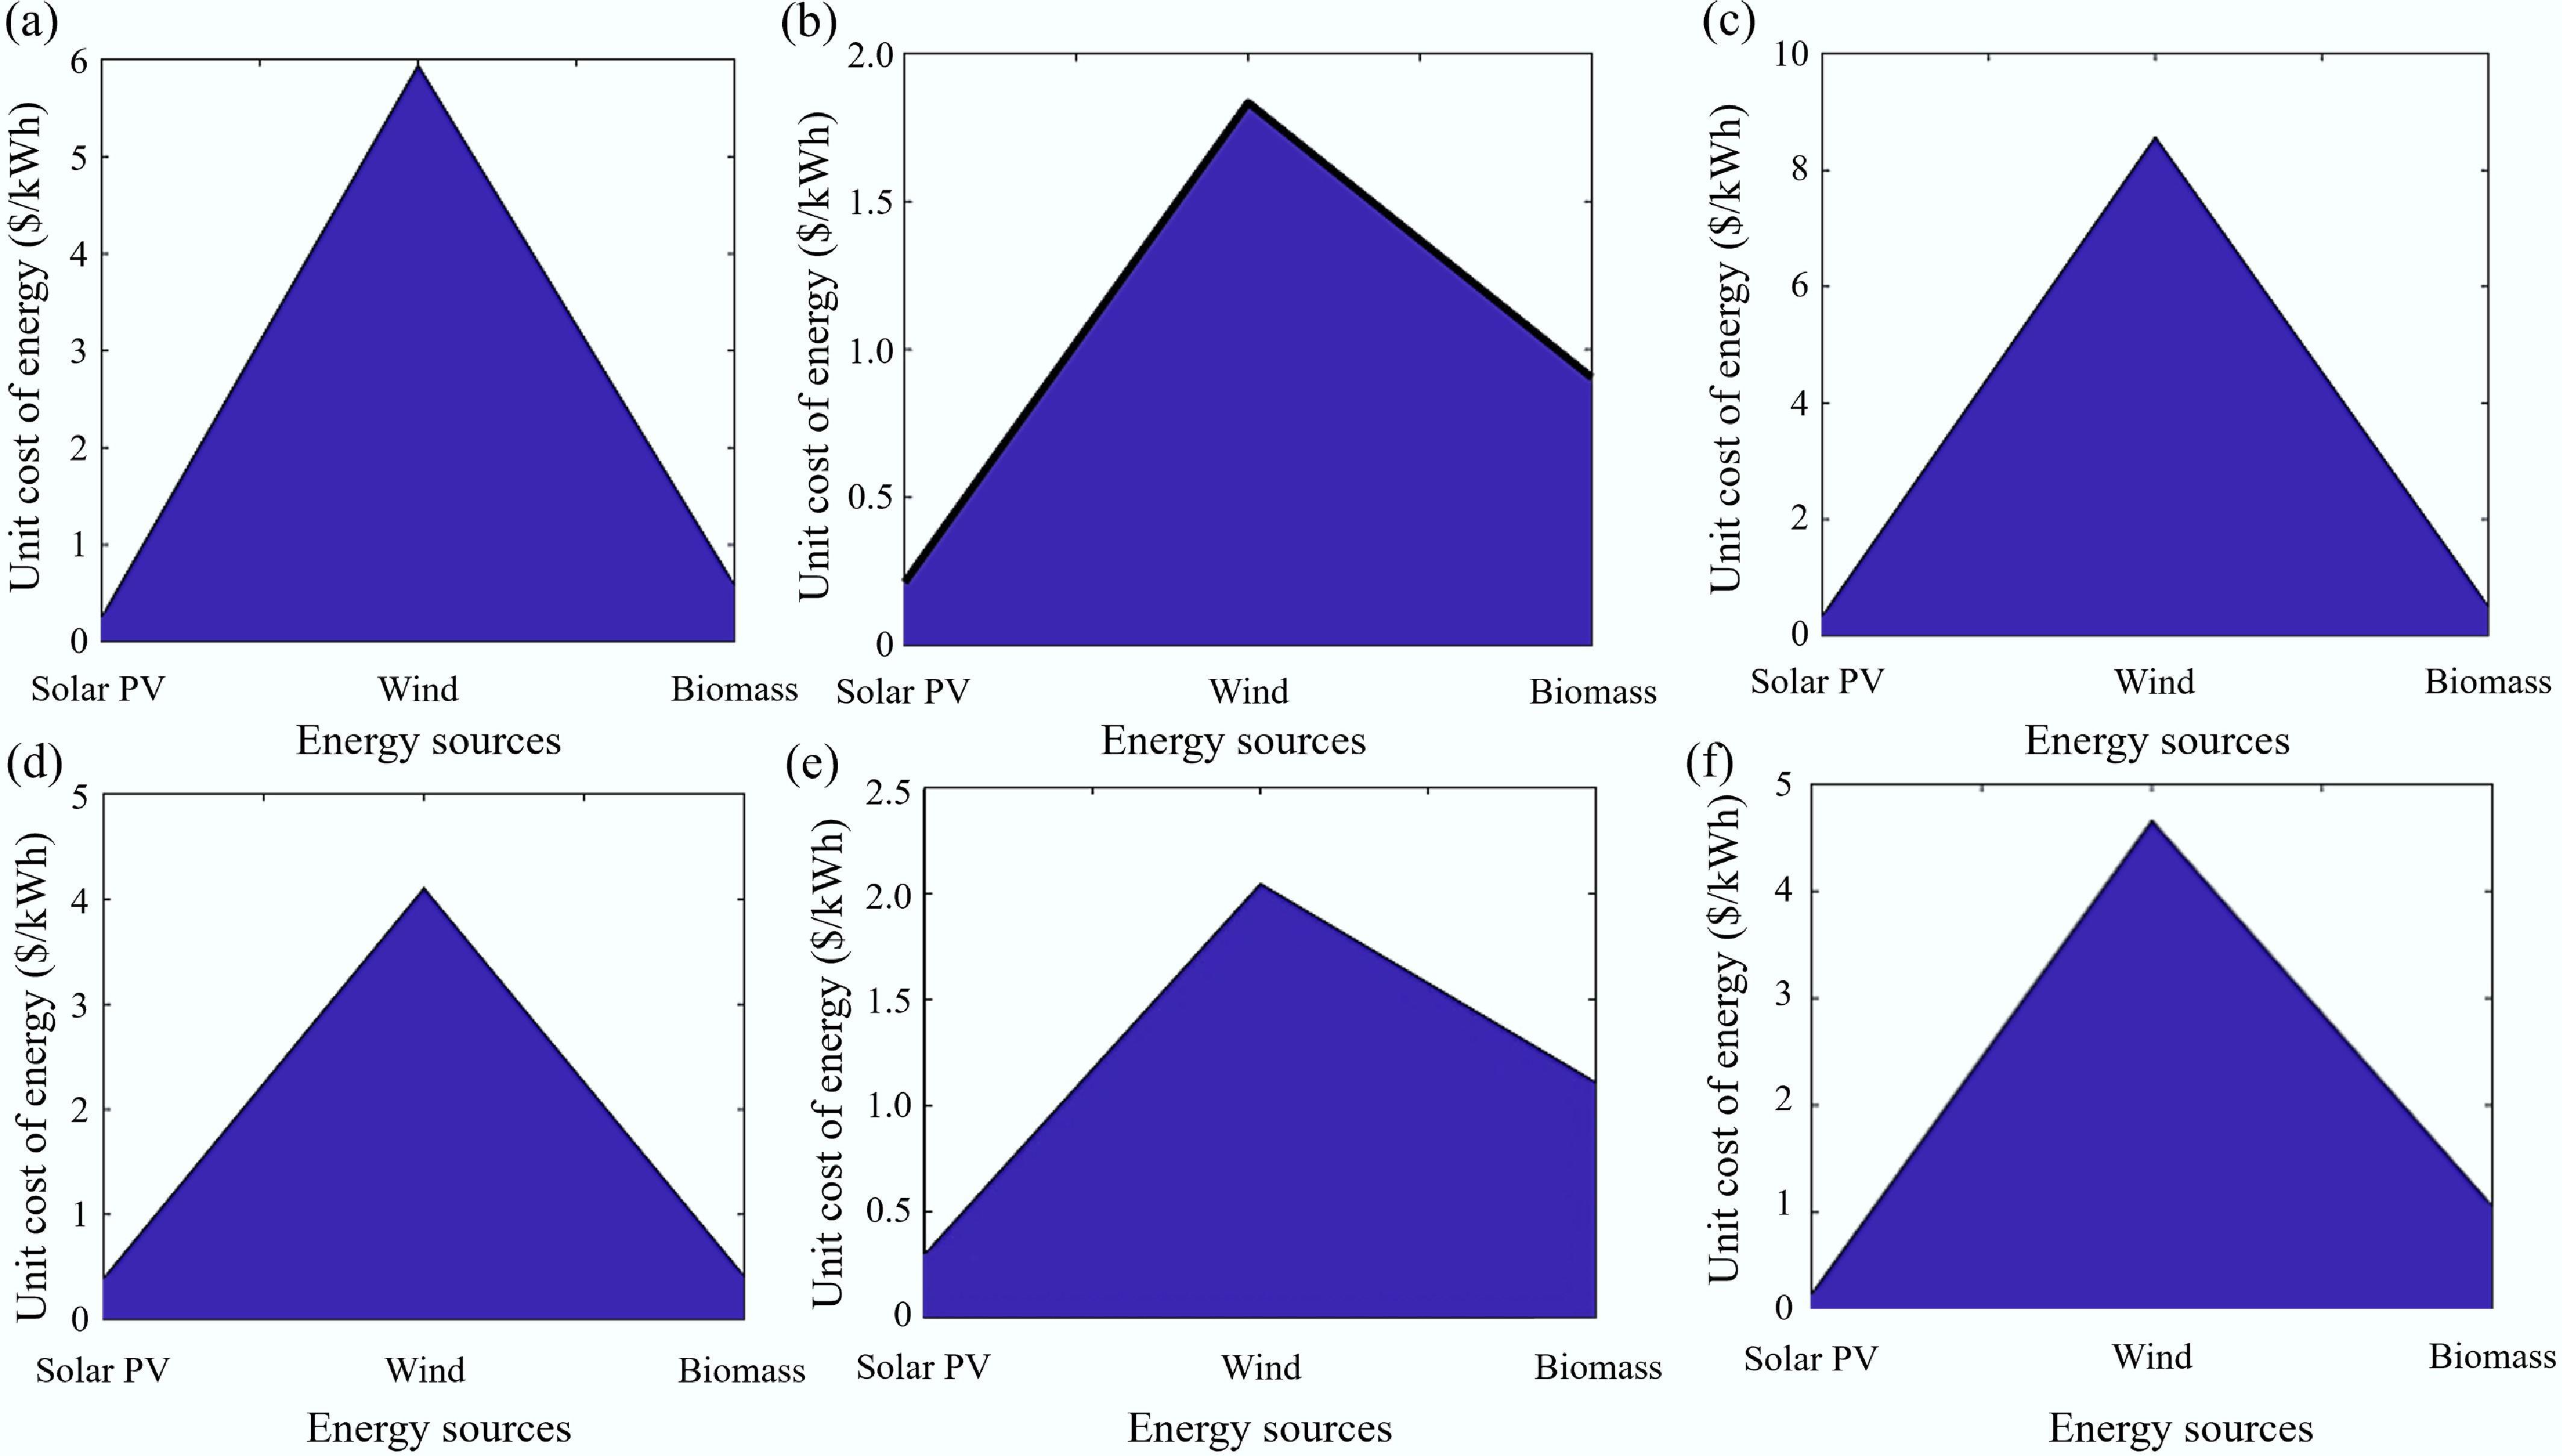
Figure 1.
Unit cost of energy for solar, wind, and biomass in sites S1 to S6.
-
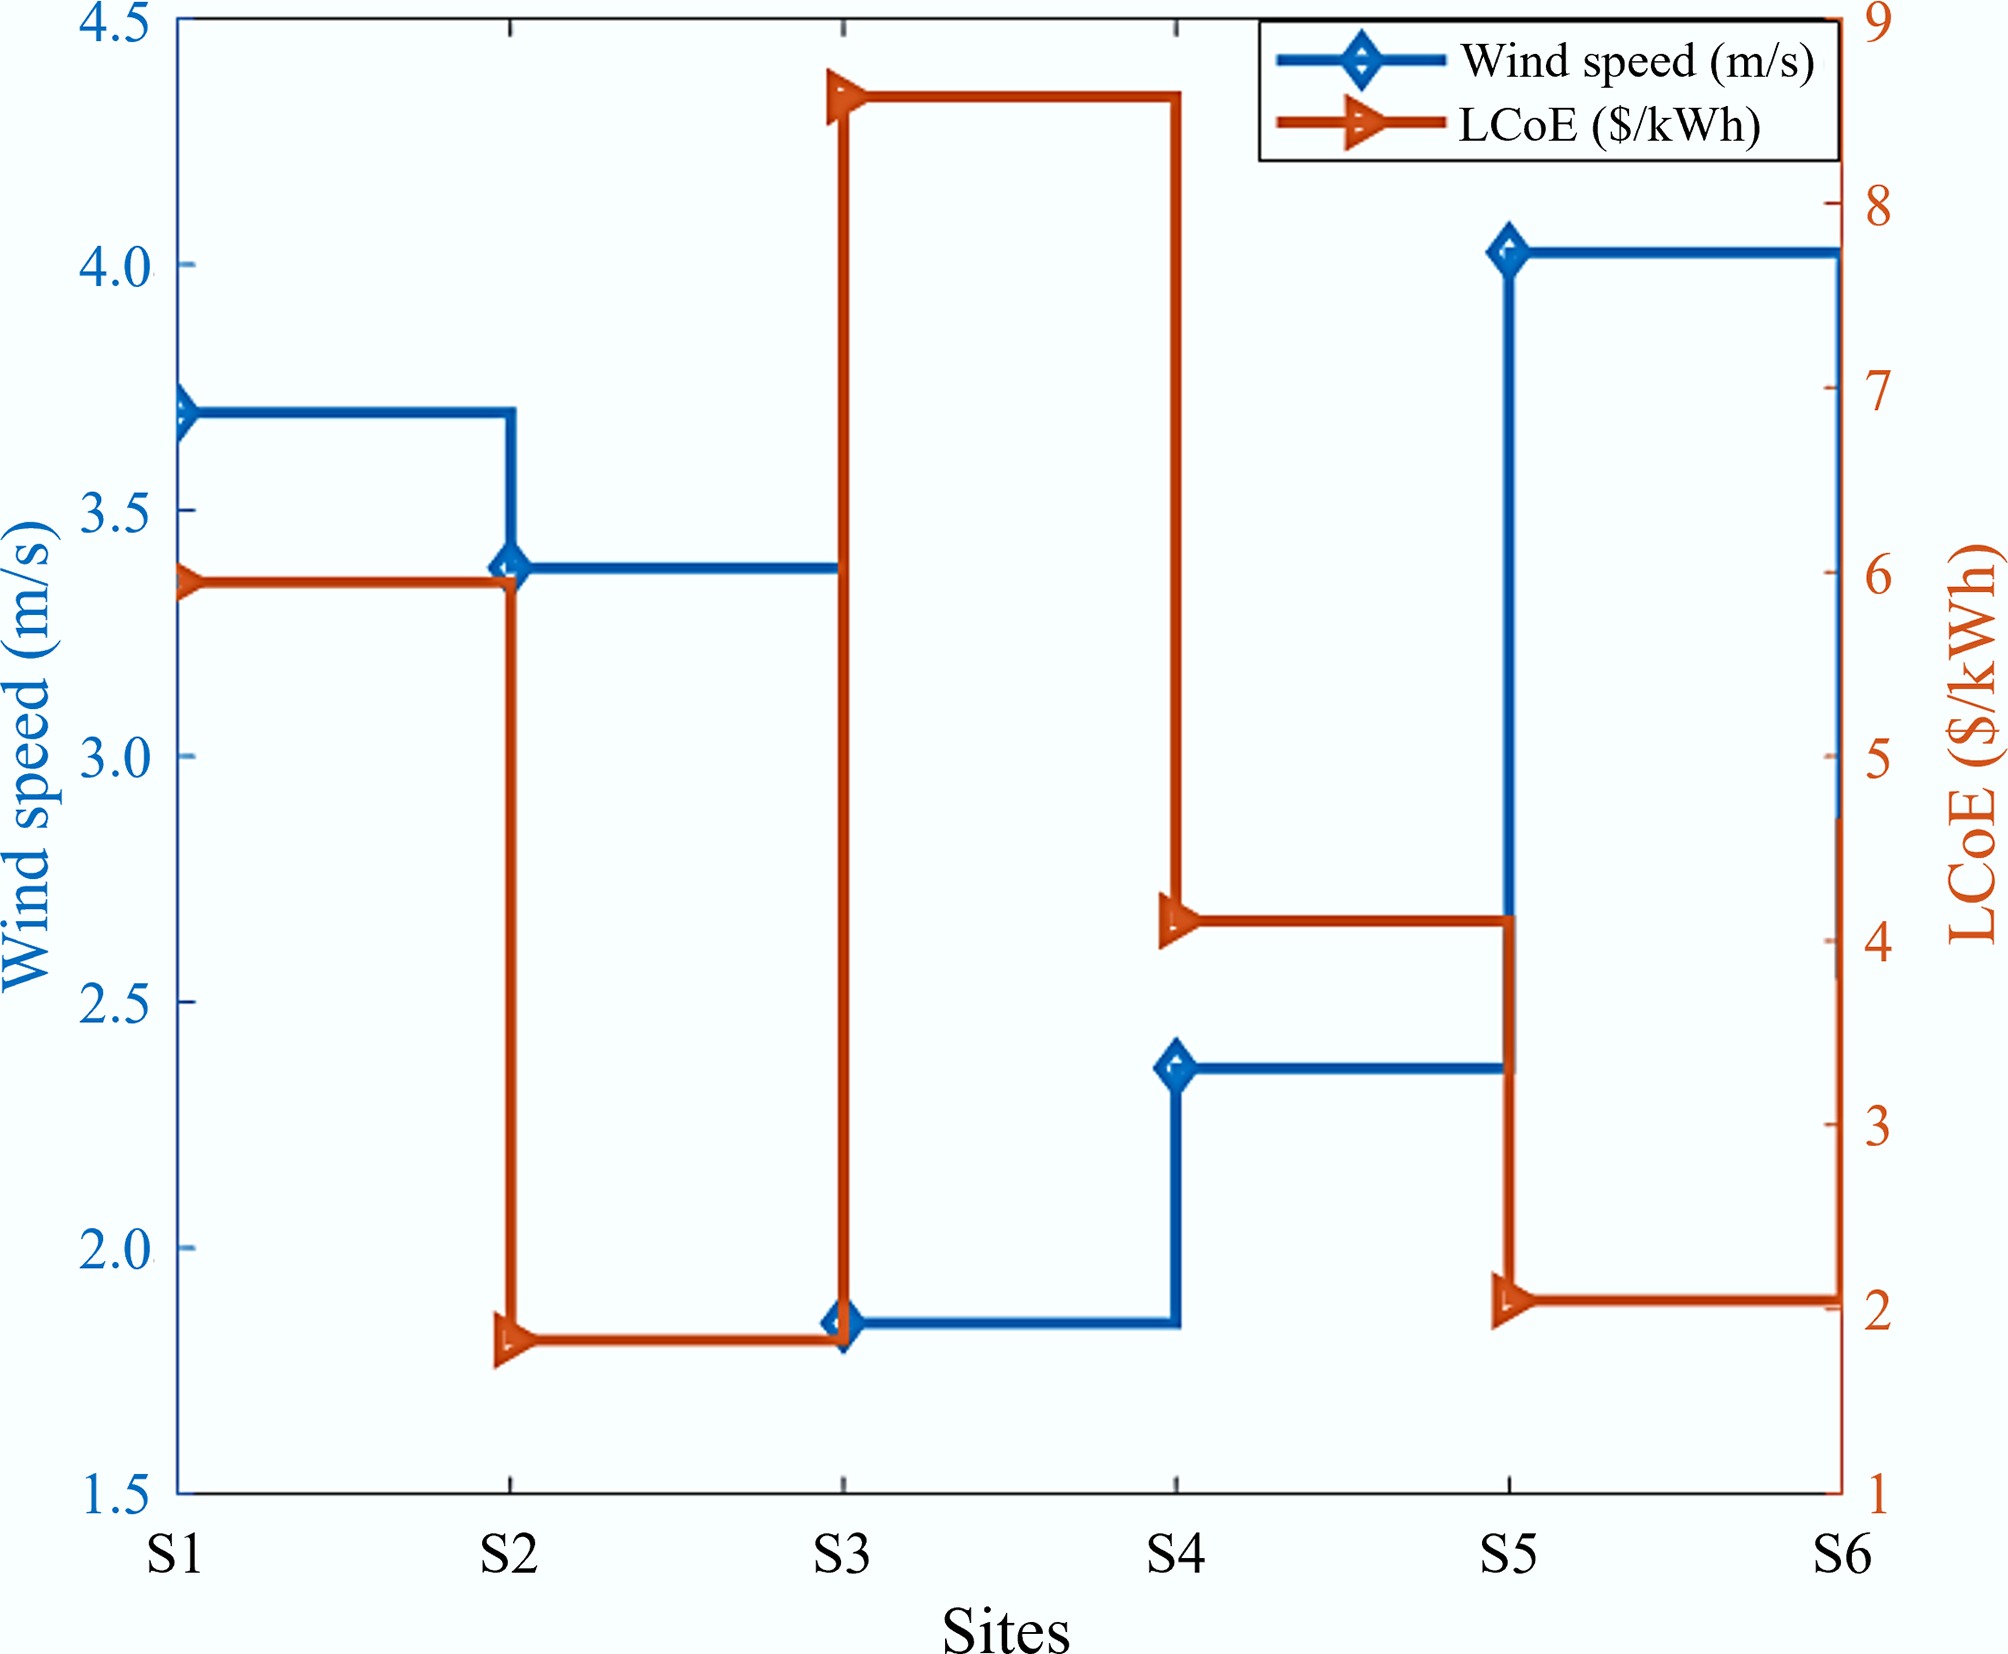
Figure 2.
Relationship between wind speed and LCoE.
-
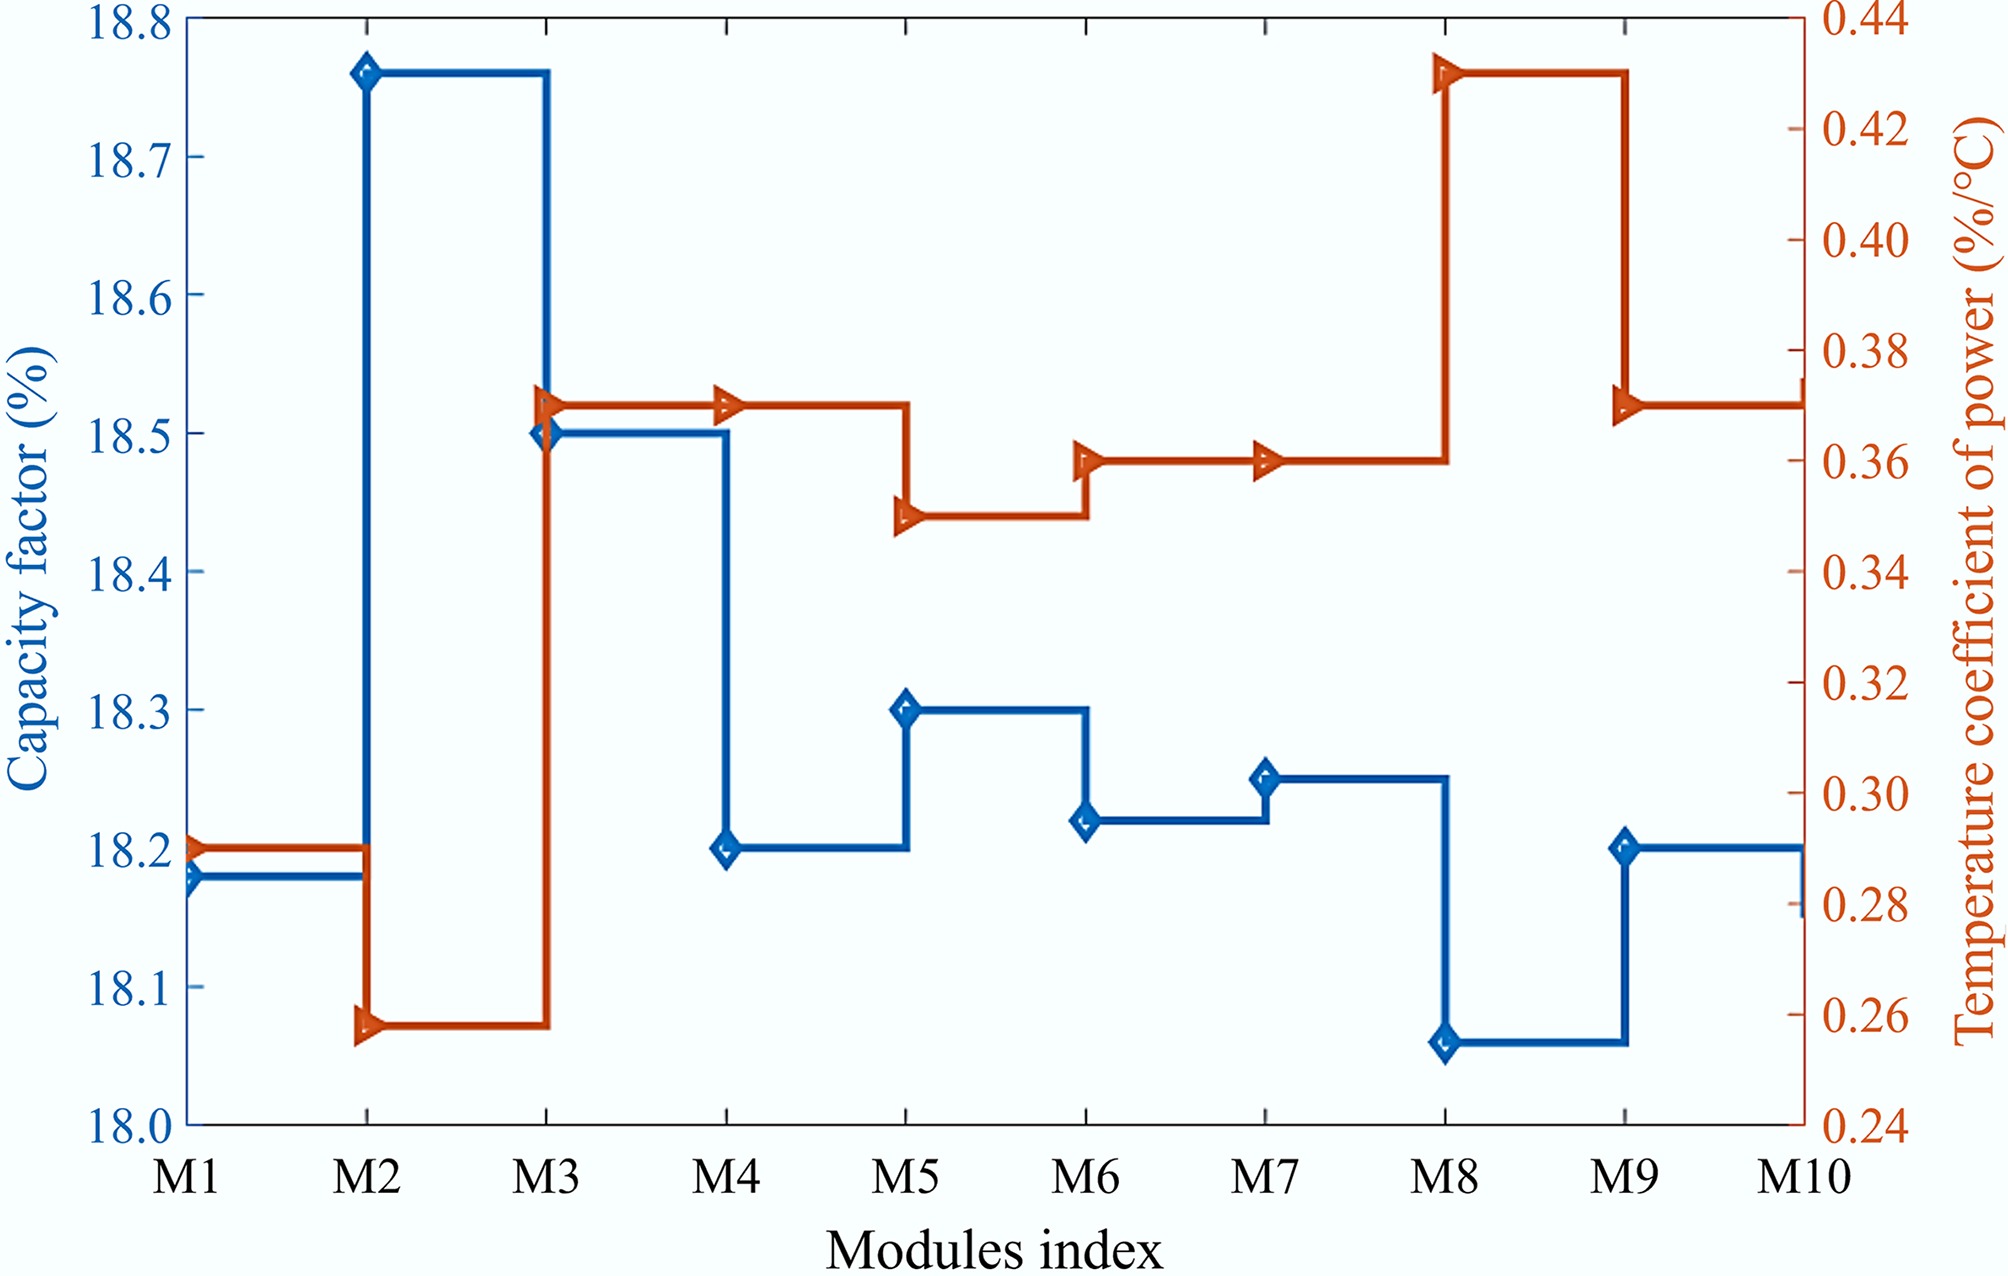
Figure 3.
Relationship between modules temperature coefficient of power and capacity factor.
-
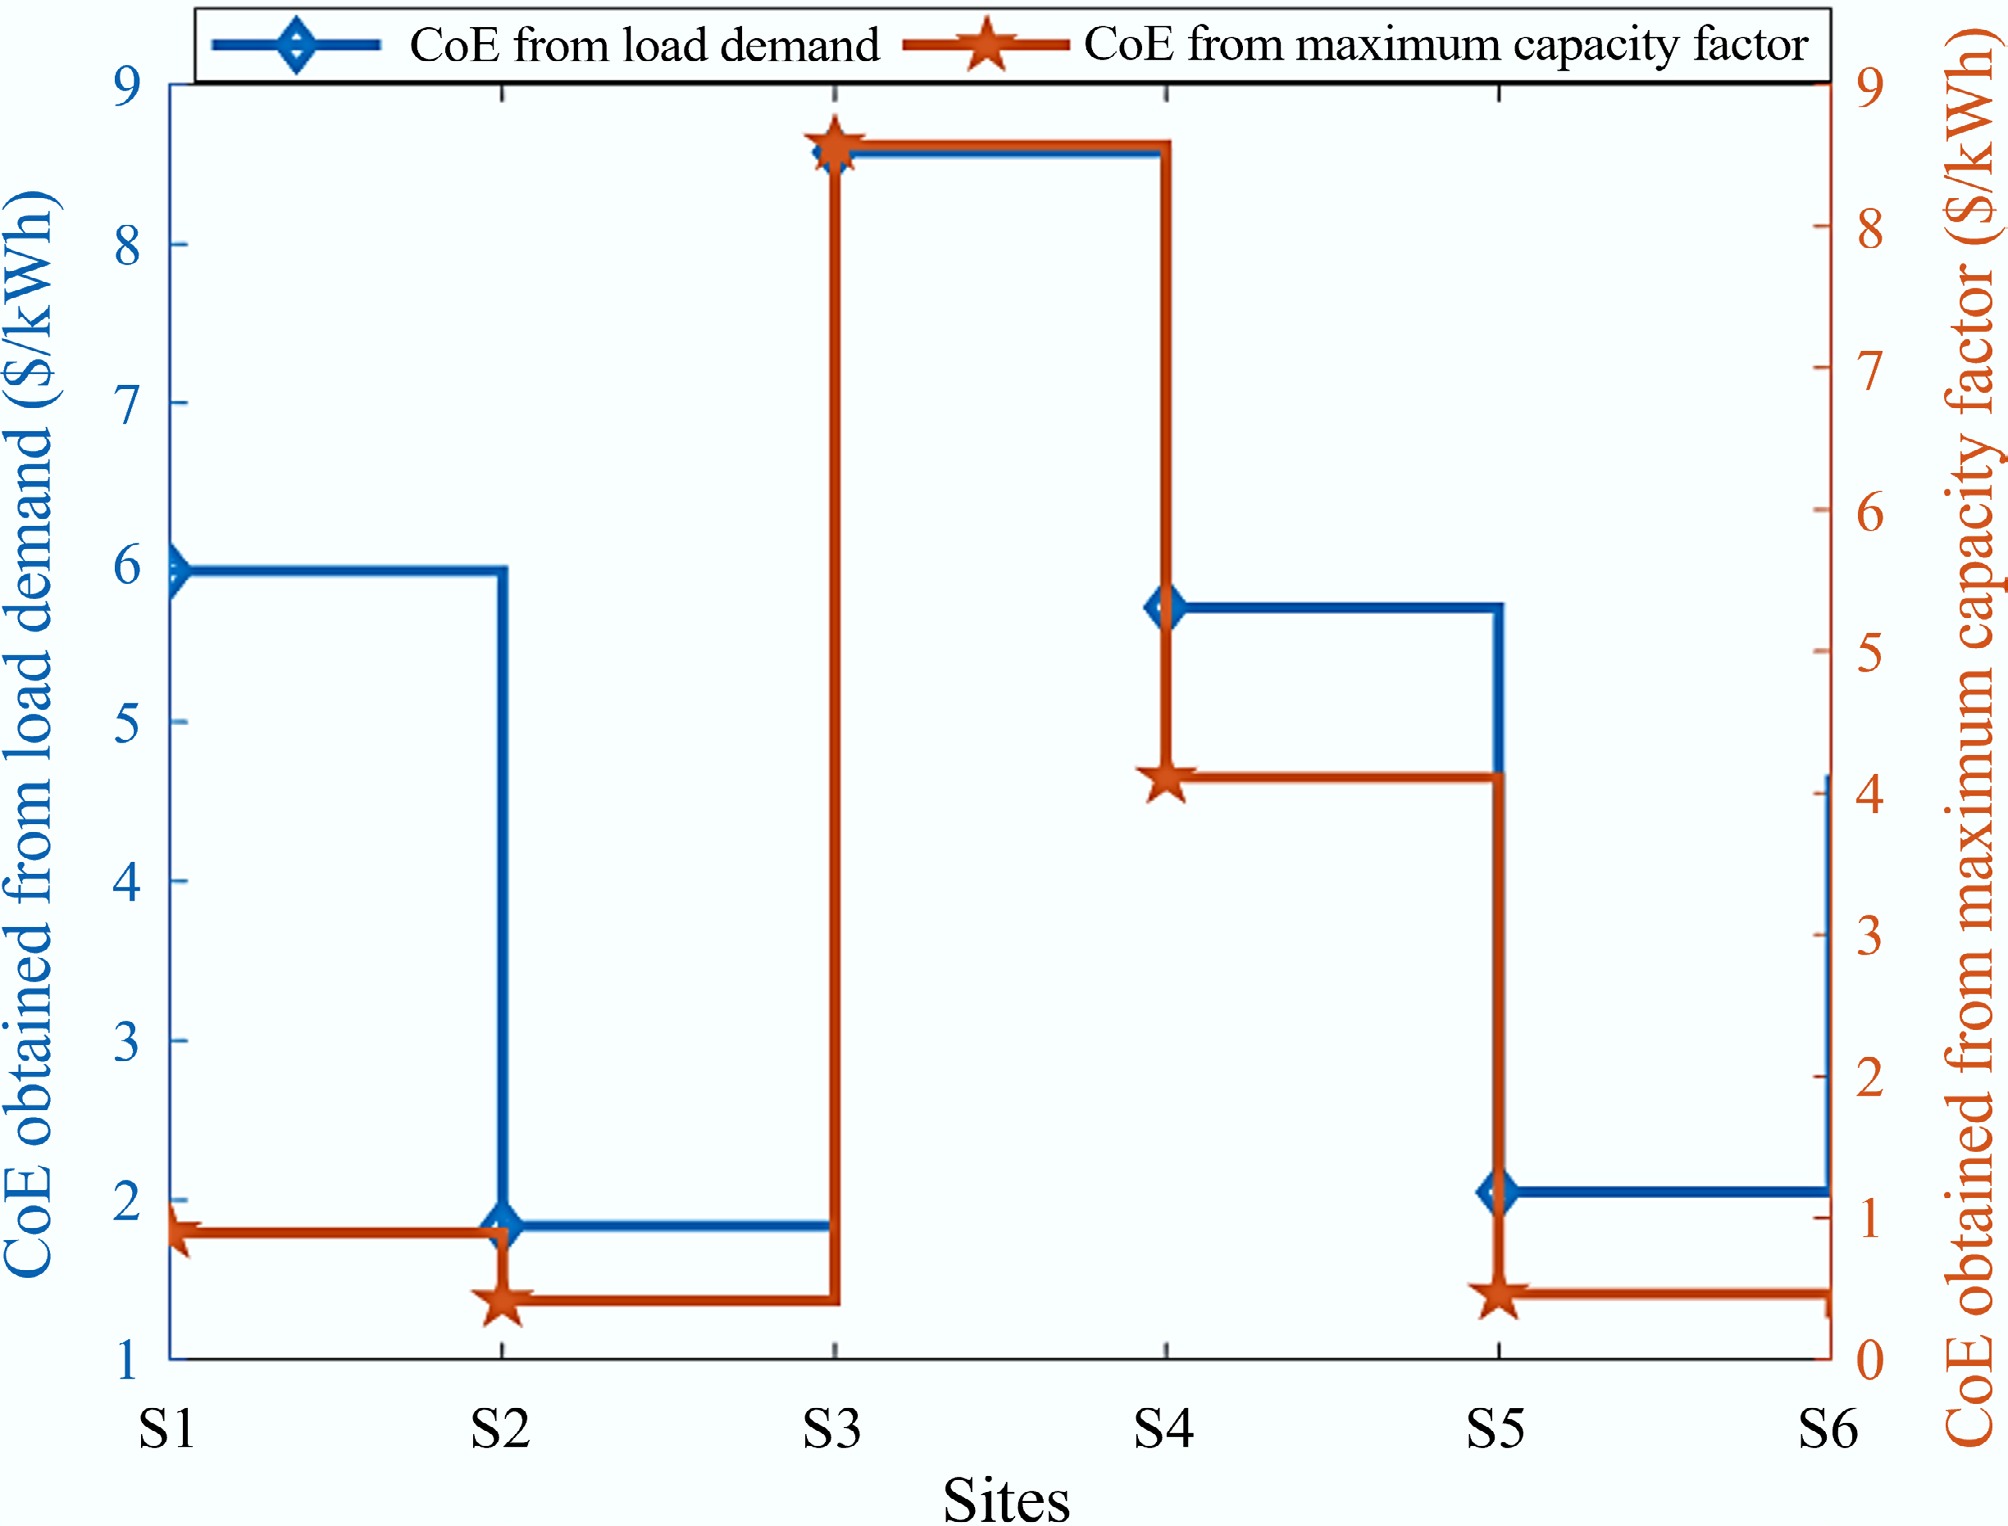
Figure 4.
Cost of energy (CoE) with maximum load demand and CoE with maximum capacity factor at different sites under study.
-
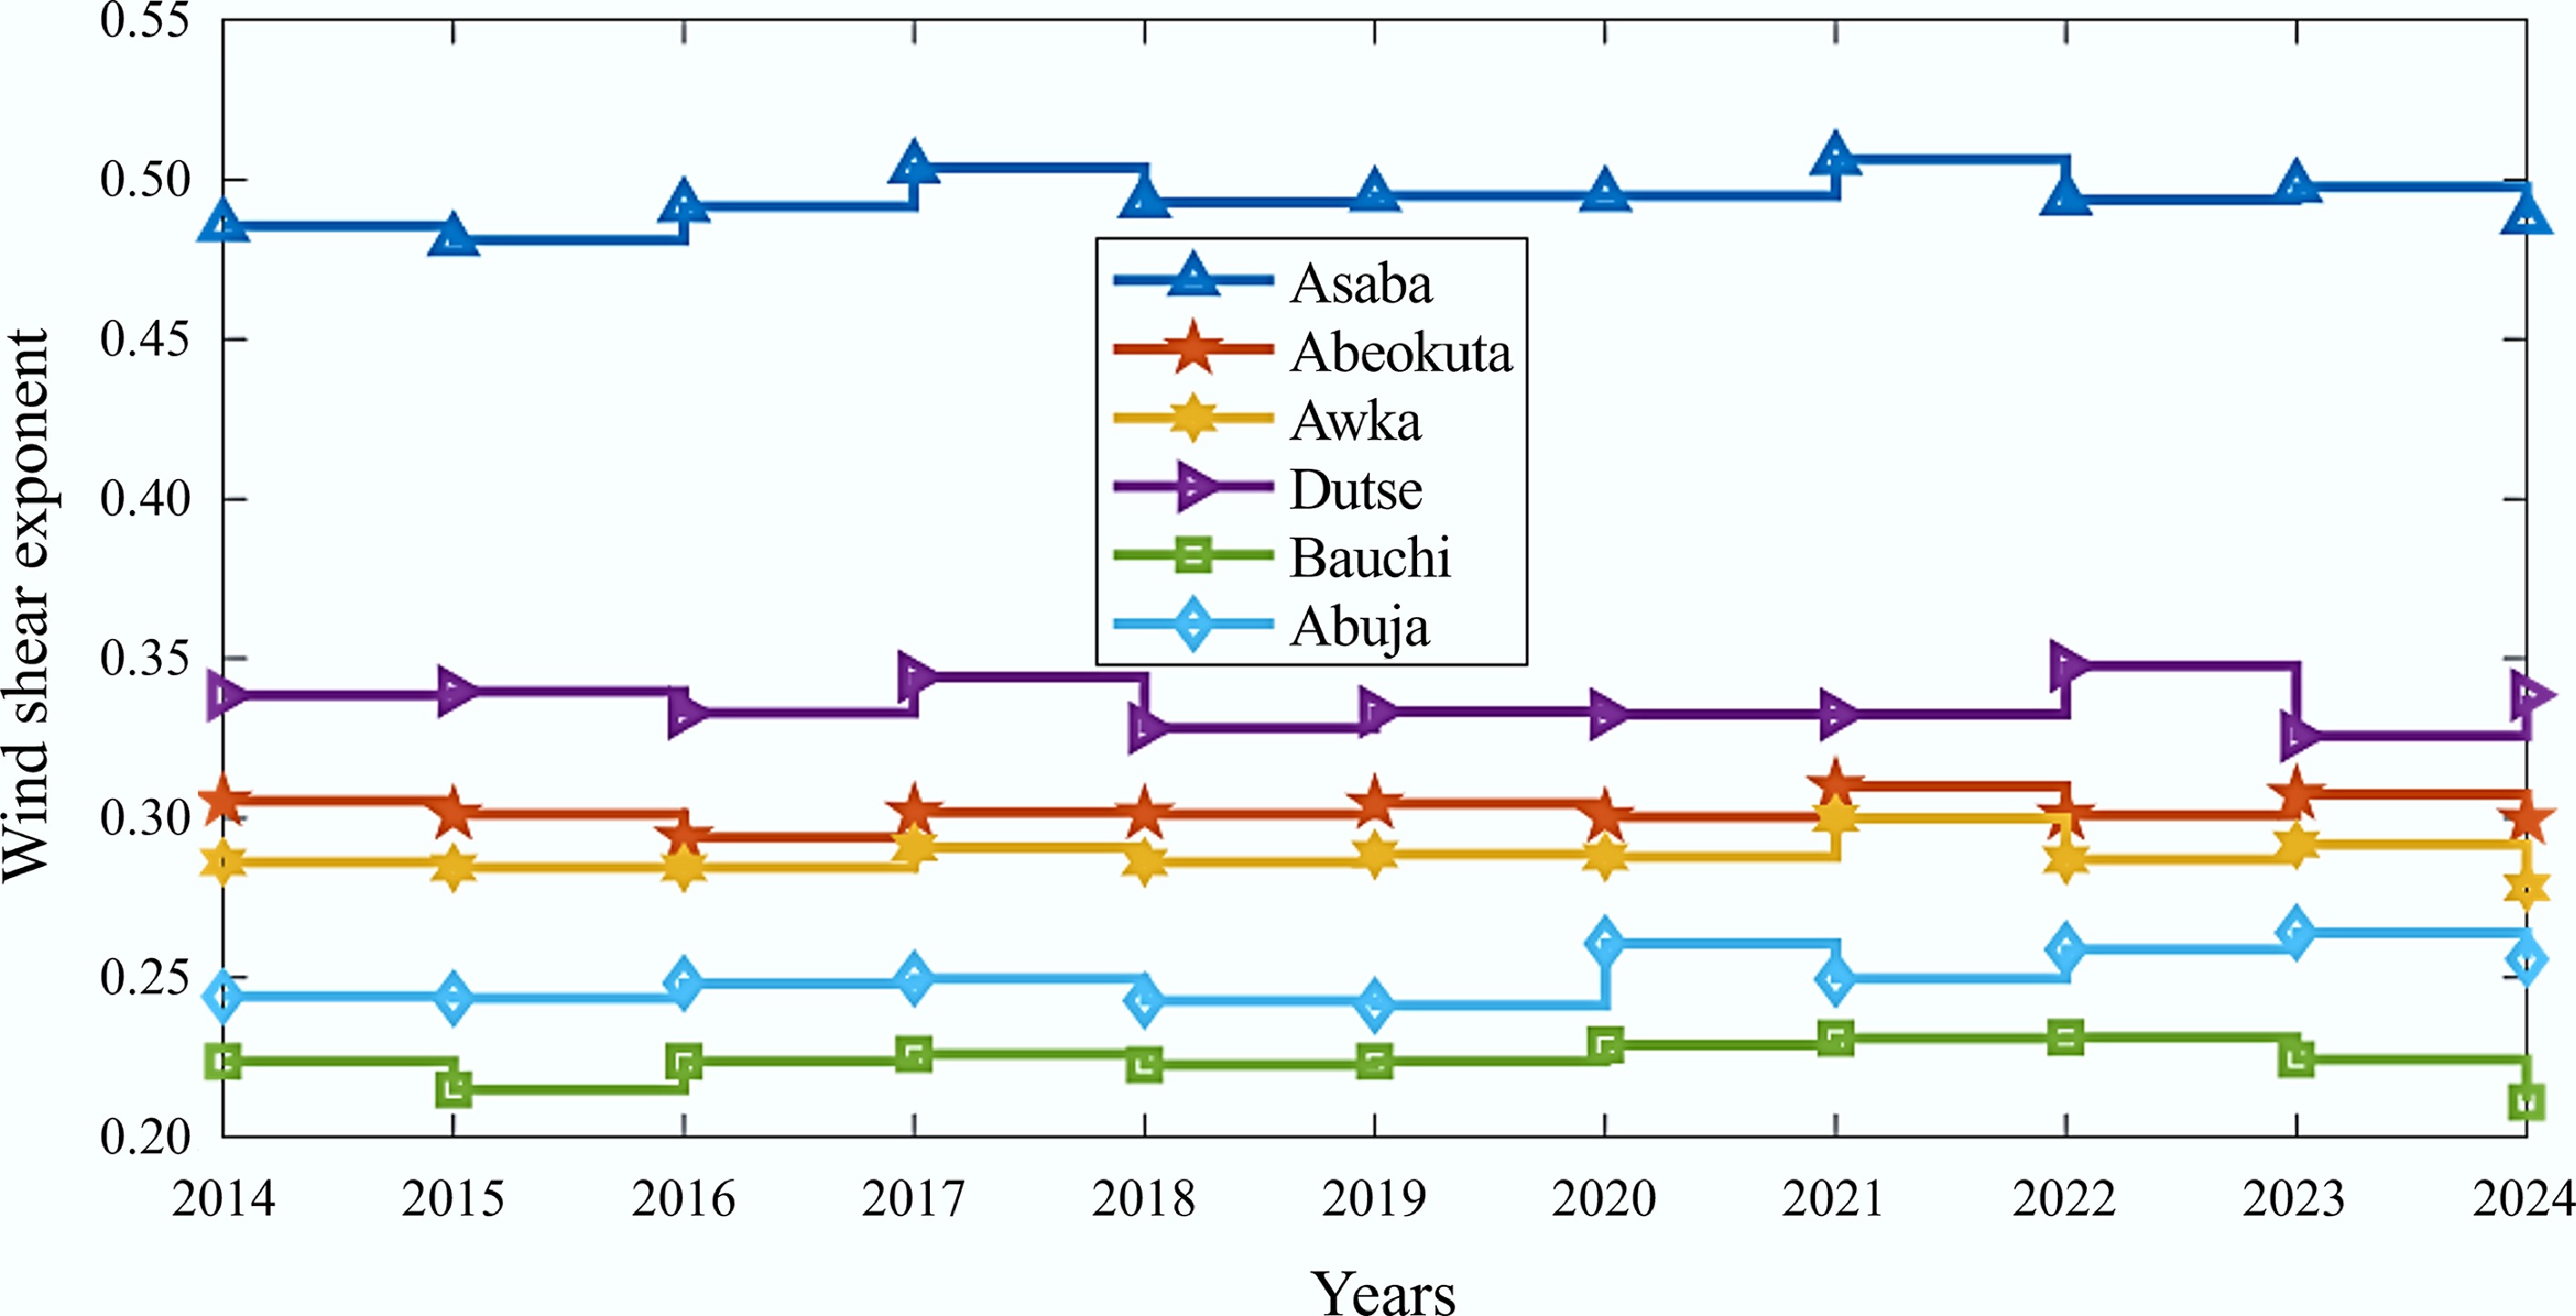
Figure 5.
Yearly variation in wind shear exponent.
-
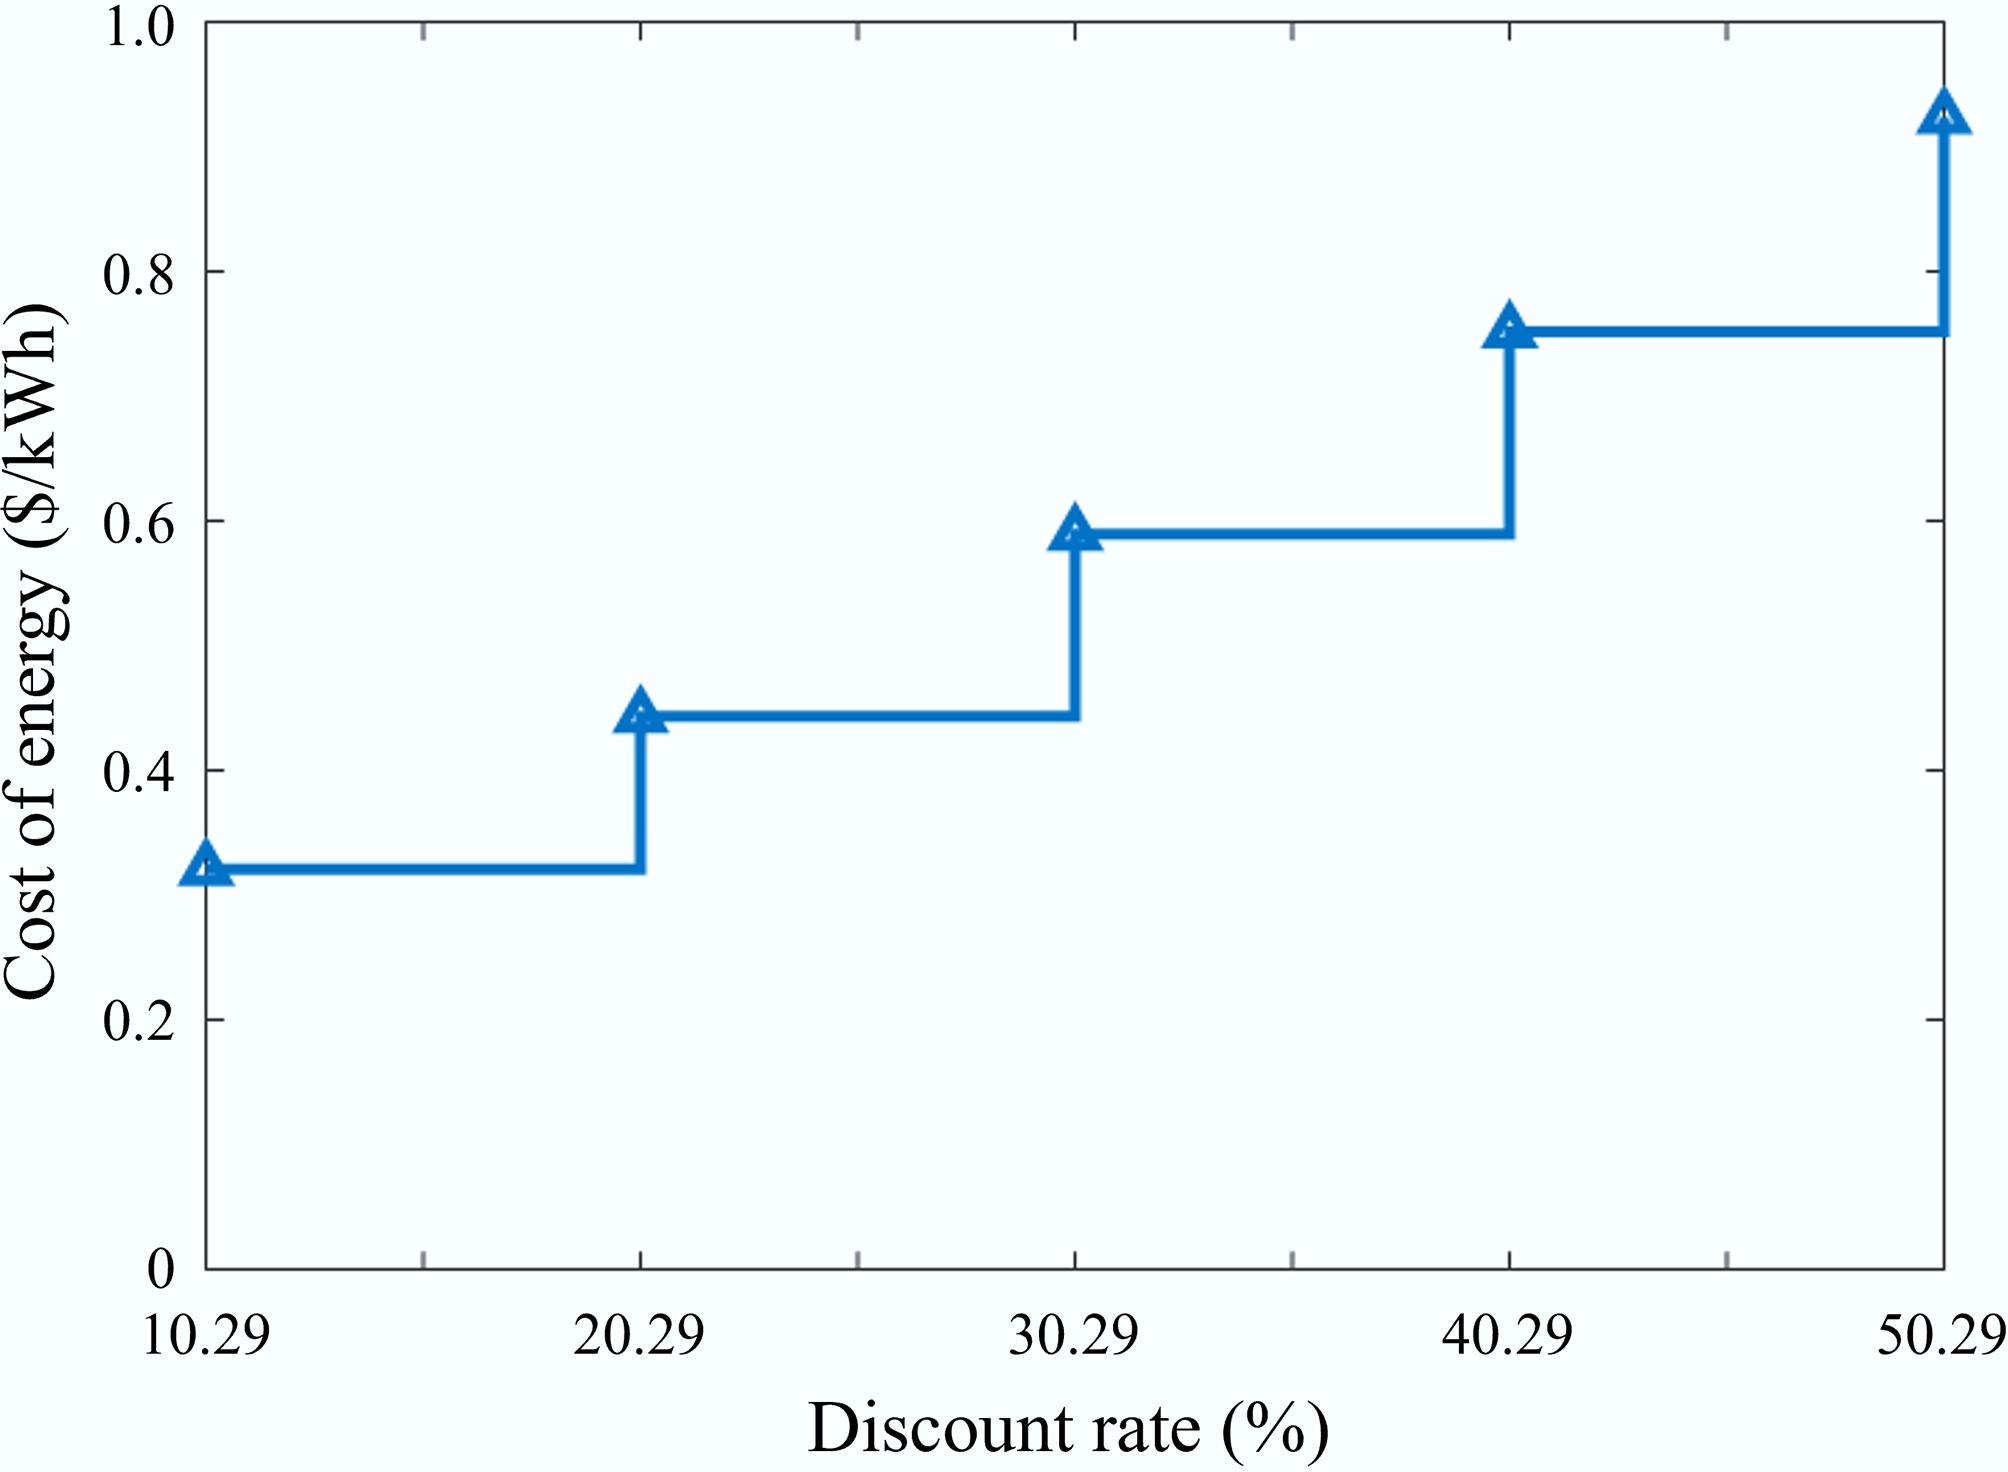
Figure 6.
Influence of increase in discount rate on the cost of energy.
-
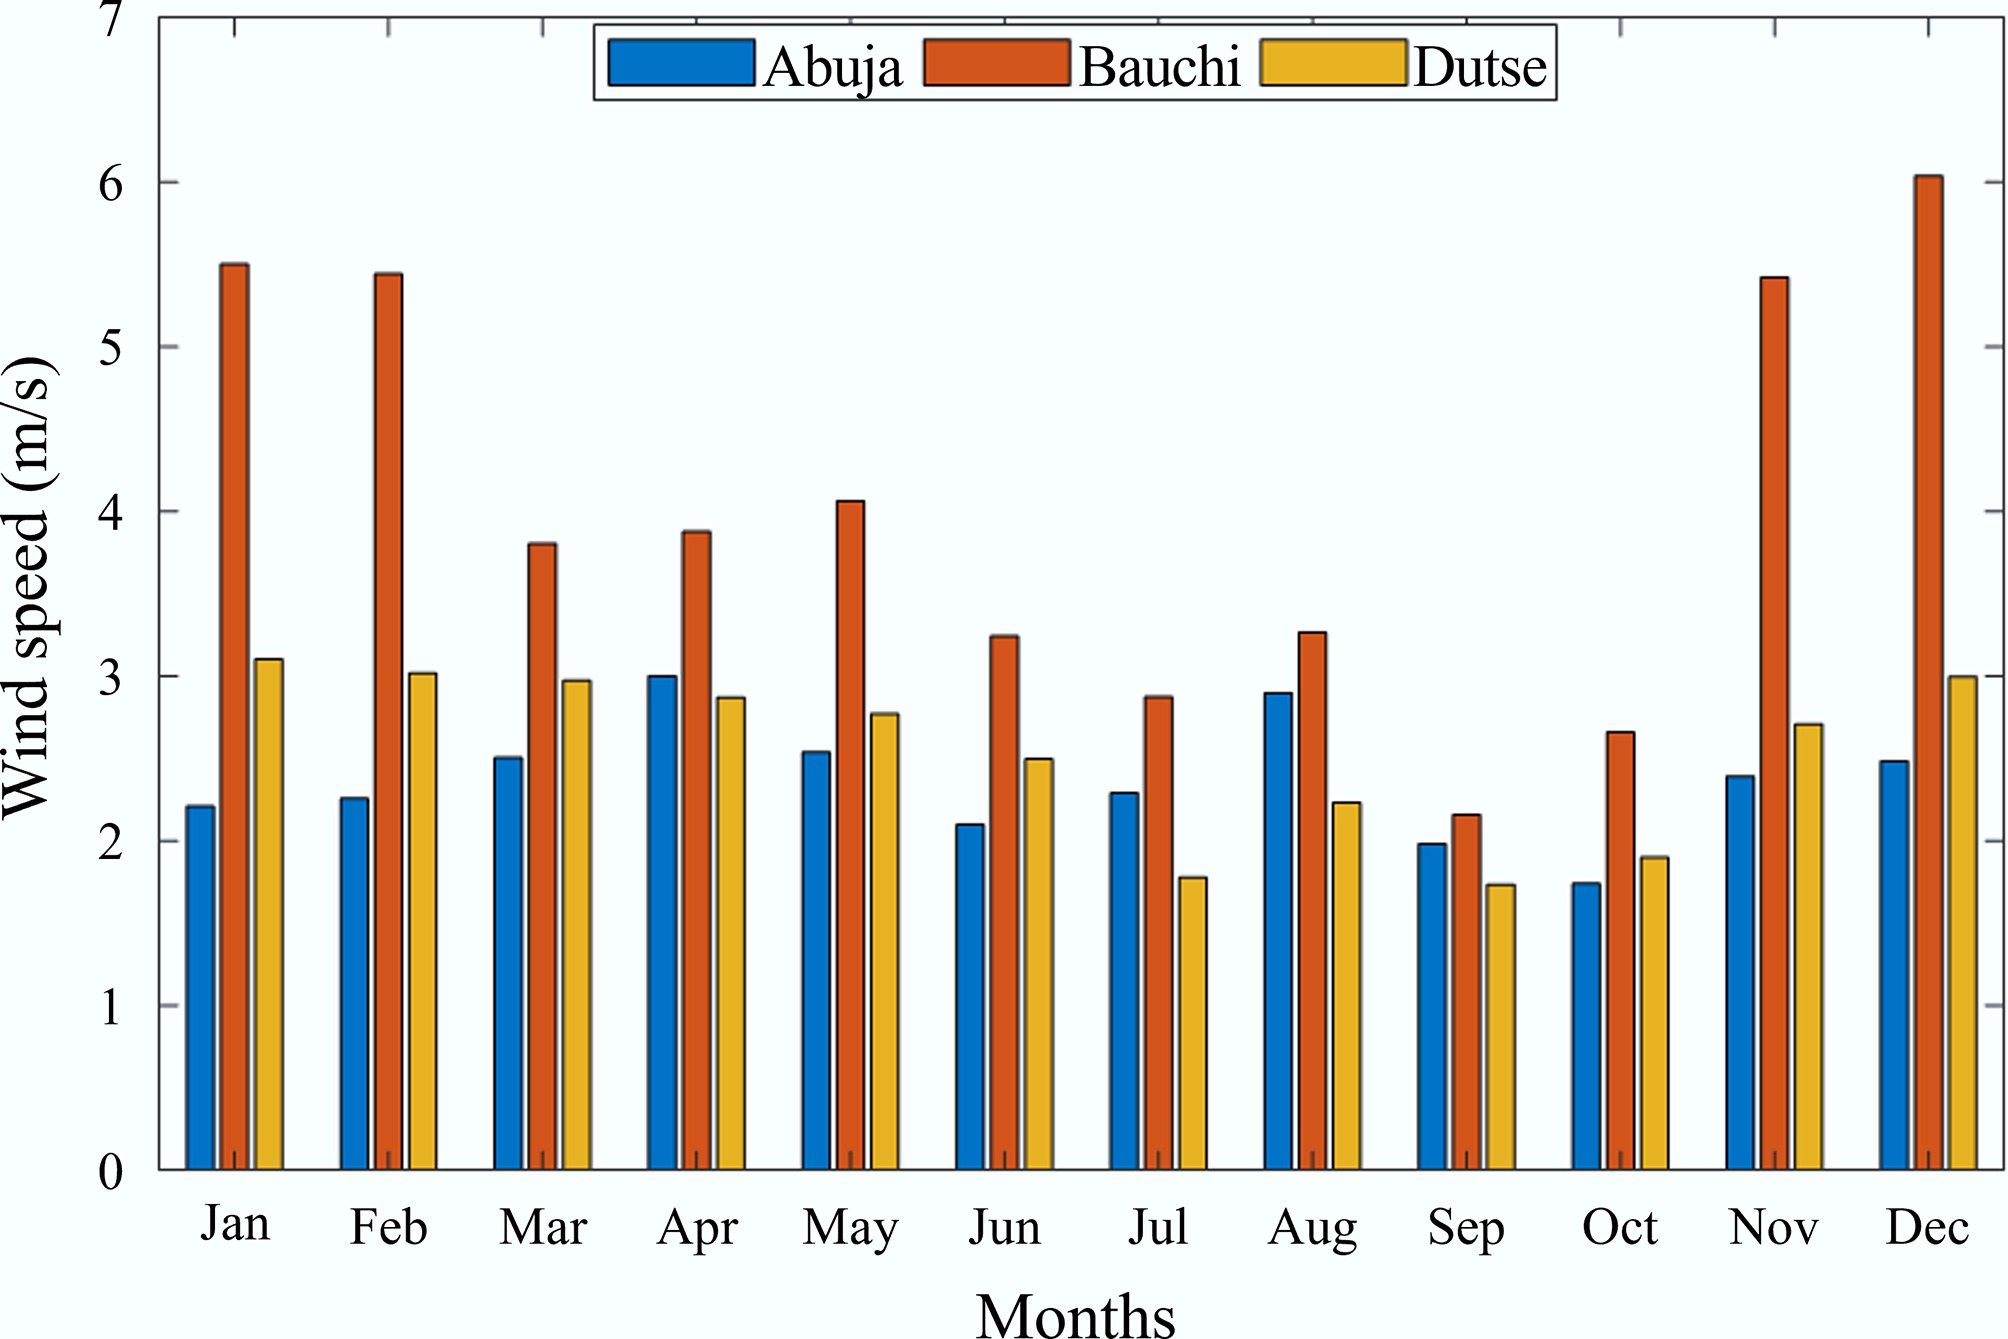
Figure 7.
Wind speed resource variability in the northern regions.
-
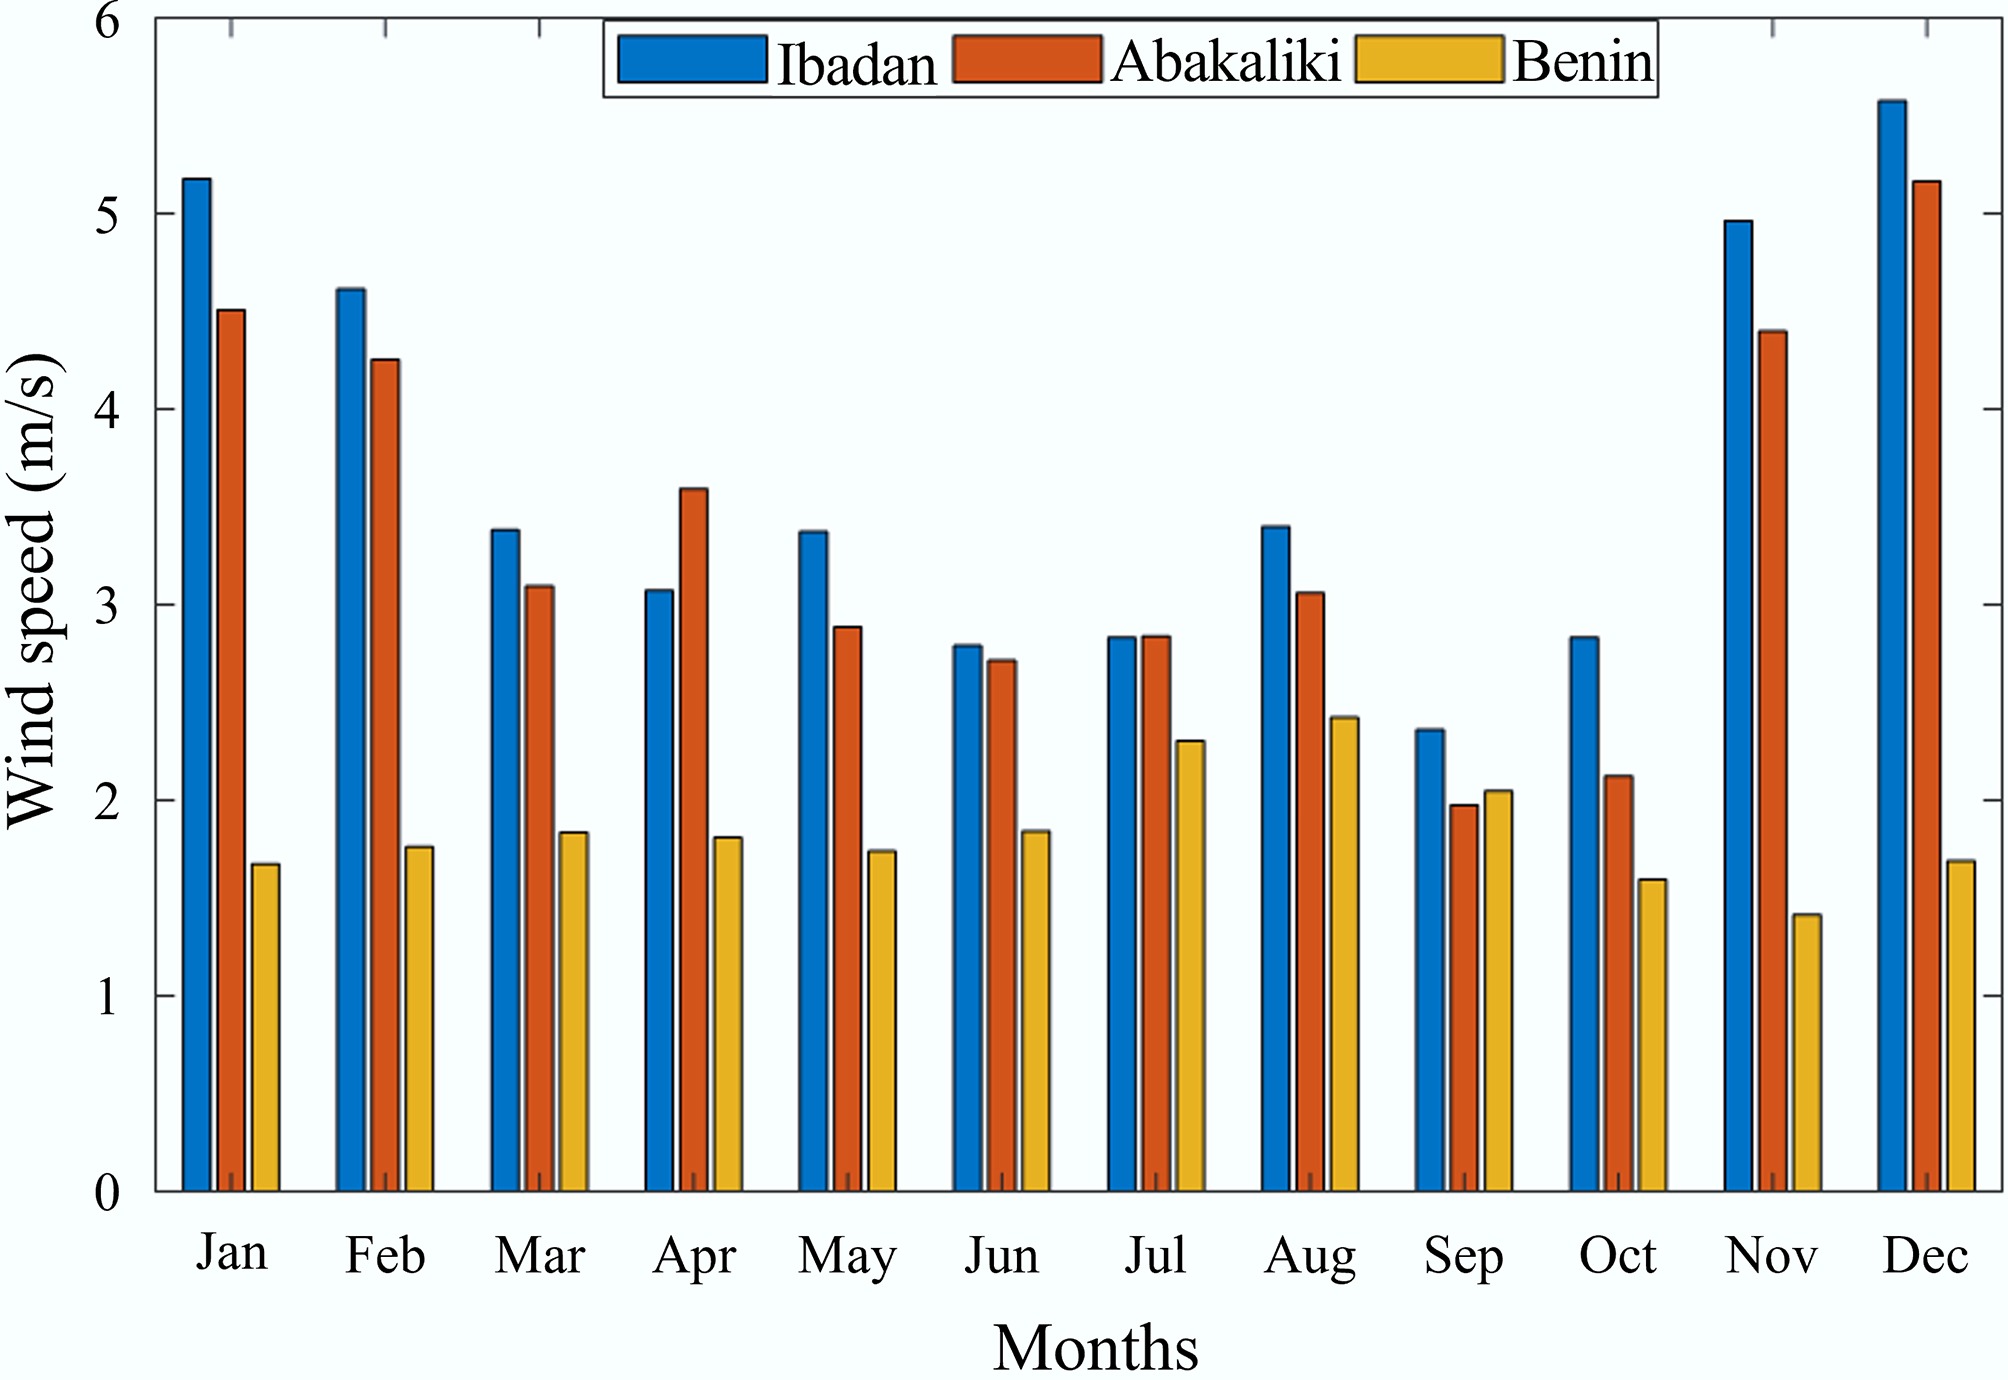
Figure 8.
Wind speed resource variability in the southern regions.
-
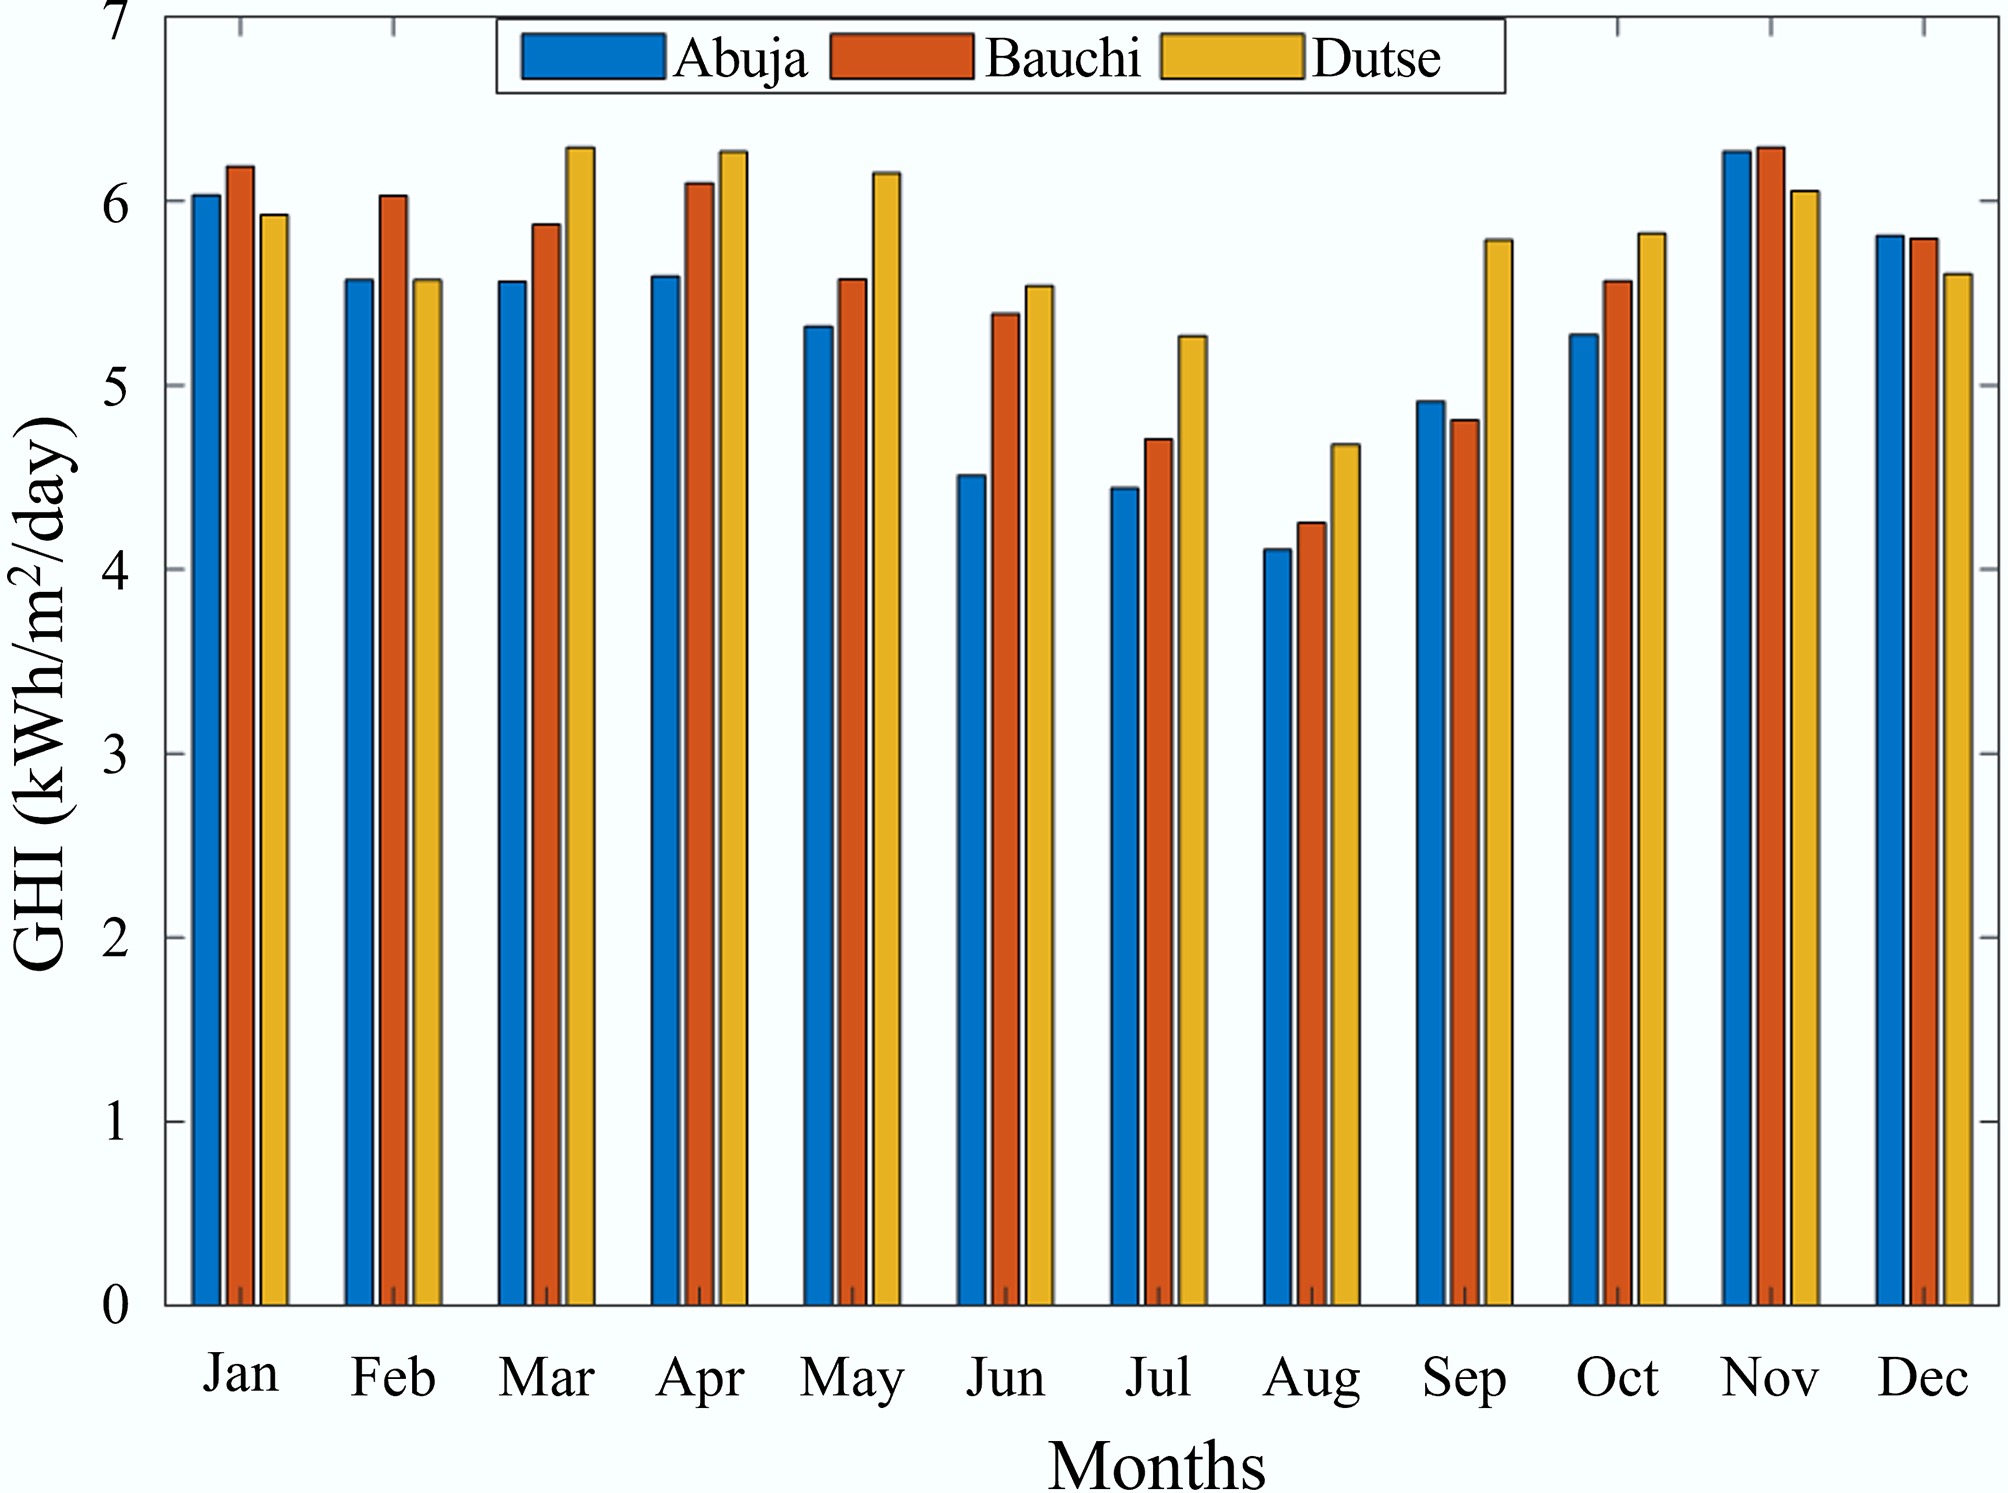
Figure 9.
GHI resource variability in the northern regions.
-
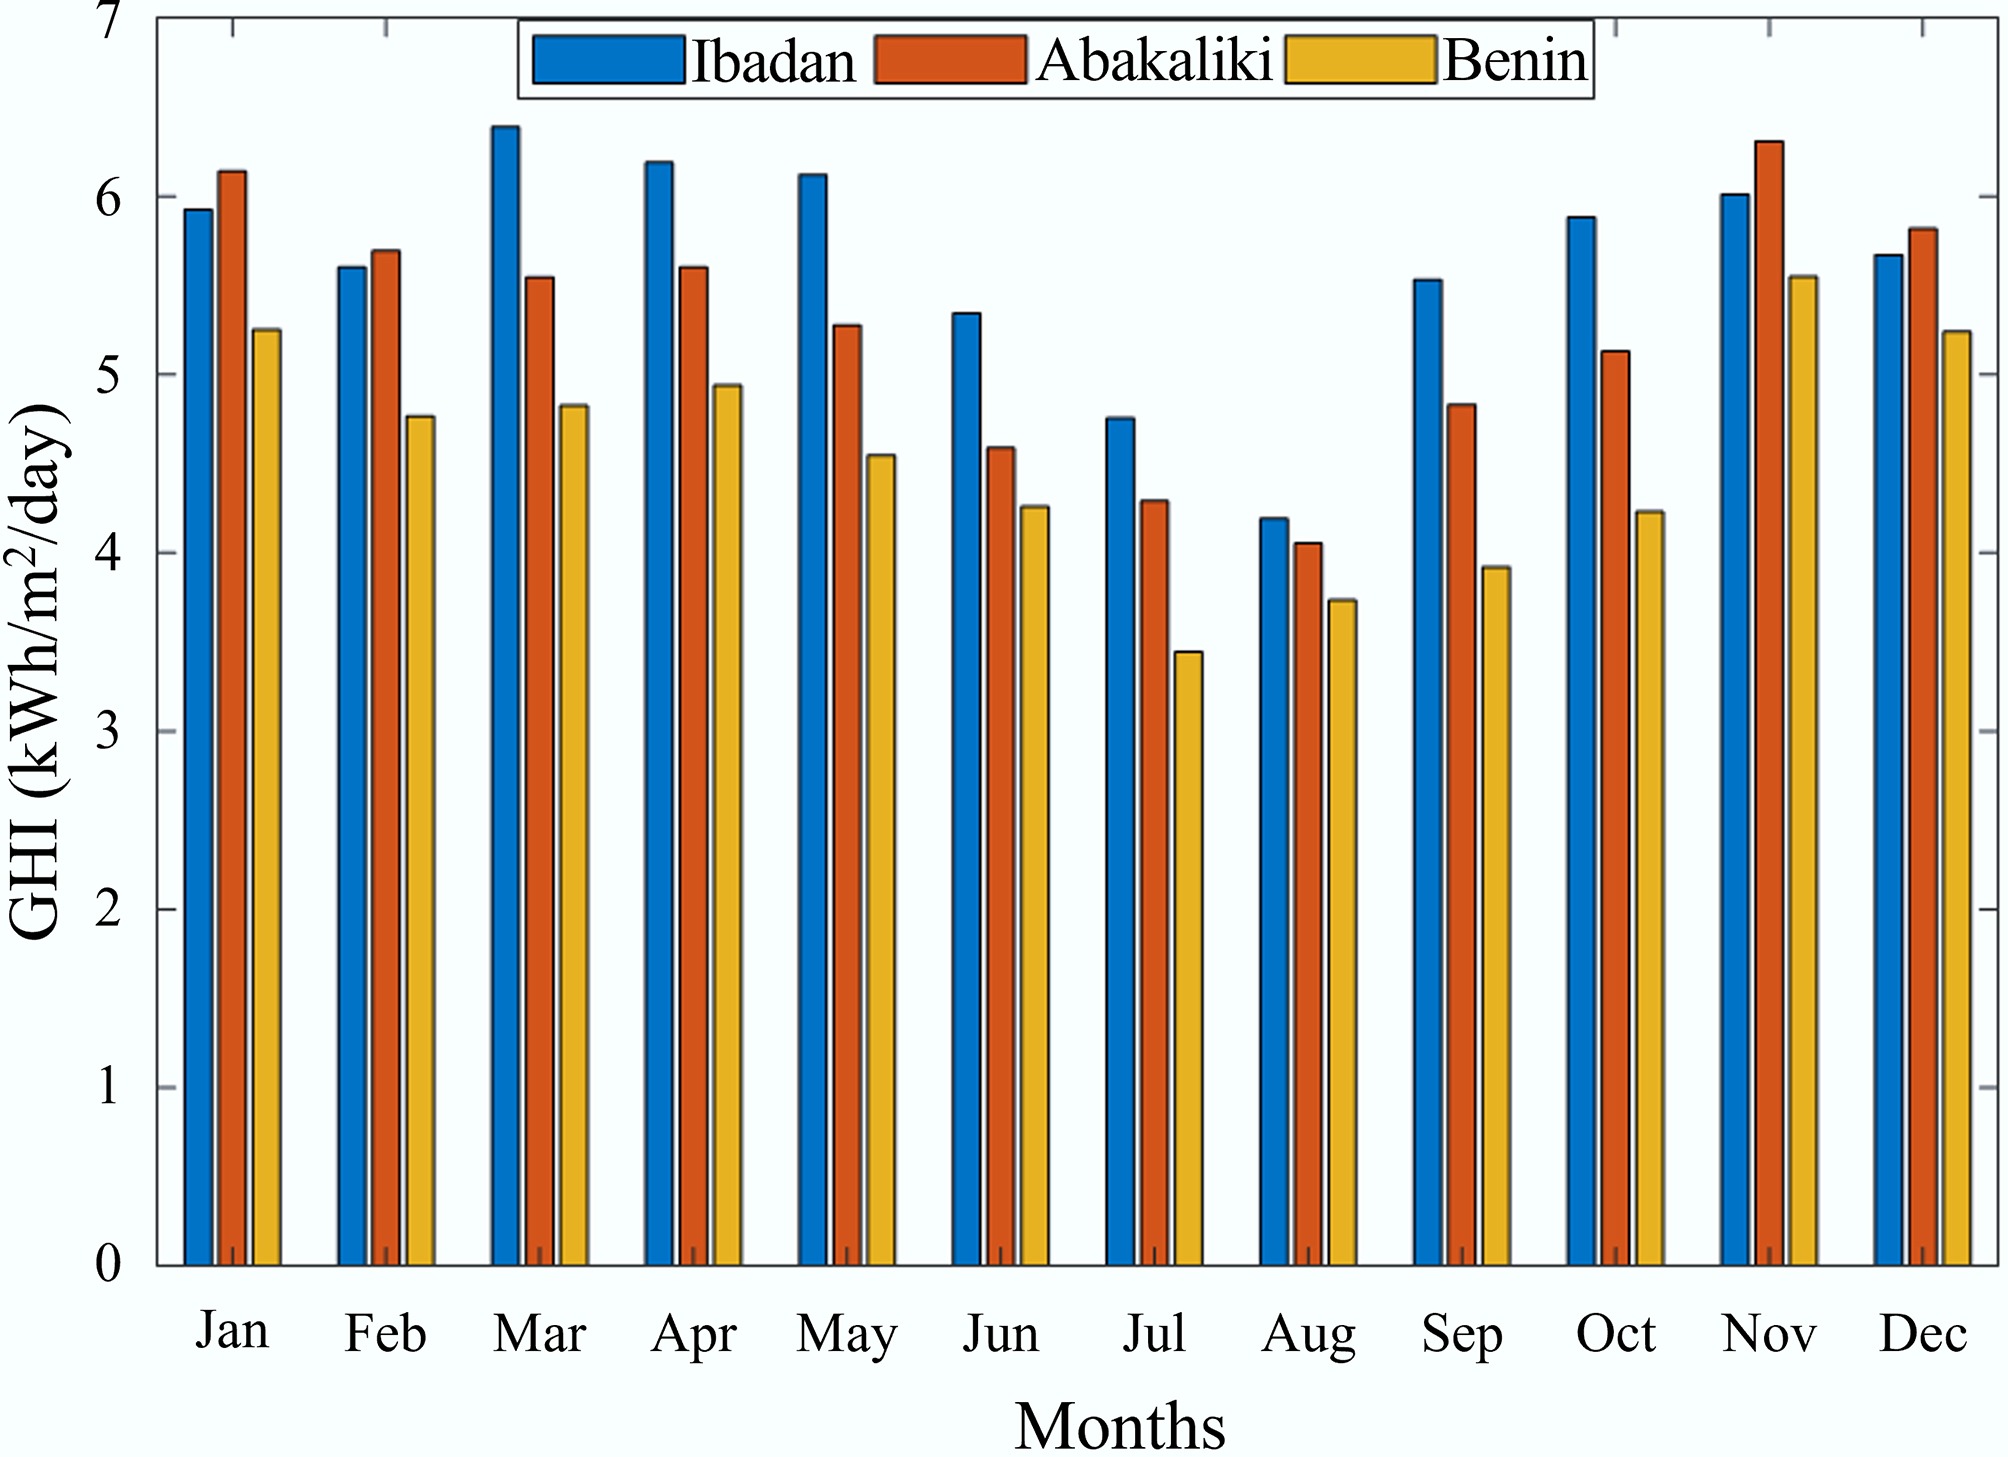
Figure 10.
GHI resource variability in the southern regions.
-
S/N Research objective Methods Evaluation metrics 1 Wind energy potential in Yamoussoukro Statistical and analytical method[10] RMSE, MAE, COE, MAPE, R2 2 Economic analysis and capacity configuration of integrated wind-solar-thermal-storage generation system Net profit economic model based on adaptive weight particle swarm algorithm[11] LCoE, Net profit 3 Techno-enviro-economic viability of wind farms in Palestine Numerical and statistical method[12] Power density and average wind speed, capacity factor, wind turbine output energy 4 Wind energy resource potential Statistical and analytical method[14] Wind speed characteristics, power density, Weibull parameters 5 Evaluation of wind shear, roughness coefficient Statistical and analytical method[15] Wind shear coefficients and roughness length 6 Determination of conditions of atmospheric stability and
wind shear coefficient determinationAnalytical method[16] Wind shear coefficient, stability class 7 Surface roughness parameter and wind shear exponent determination Analytical and statistical method[17] Wind shear exponent, Weibull shape (k) and scale (c) parameters 8 Technical-economic analysis of hybrid solar-wind-biomass Statistical and analytical[3] Weibull parameters, LCoE, CO2 saved 9 Assessment of proposed grid-integrated solar Analytical[2] Yr, Ya, Yf, CF, PR, PBP, LCoE 10 Techno-economic analysis of the viability of two standalone water pumping systems Analytical[7] Energy saving ratio, TLCC, NPV, LCoE, CO2 saving, CO2 cost saving Table 1.
Research objective, methods, and evaluation metrics in the literature
-
S/N Geographical region Sites Population Waste (kg/capital/d) Lat. (°N) Long. (°E) S1 Southwest University of Ibadan 33,000 0.51 7.42 3.93 S2 Southeast Alex Ekweme Federal University (Abakaliki) 12,230 0.53 8.29 8.62 S3 South-south University of Benin 45,000 0.50 6.20 5.36 S4 North-central University of Abuja 55,364 0.66 8.58 7.10 S5 Northeast Abubakar Tafawa Balewa University (Bauchi) 18,685 0.22 9.39 10.04 S6 Northwest Federal University, Dutse 4,532 1.00 11.42 9.22 Table 2.
Location of study with their geographical location
-
Pumps Vertical pump
rating (kW)Unit Total (kW) Booster station A $ \left({P}_{A}\right) $ 7.50 4 30.00 5.50 2 11.00 3.00 4 12.00 Booster station B $ \left({P}_{B}\right) $ 2.32 1 2.32 2.29 2 4.58 Submersible pump rating 5.00 2 10.00 Total Power $ \left({P}_{A}+{P}_{B}\right) $ 69.90 Excess for future expansion 30% of $ \left({P}_{A}\;+\;{P}_{B}\right) $ Overall power requirement 91.00 Power requirement for site S1 165.00 Power requirement for site S2 61.00 Power requirement for site S3 226.00 Power requirement for site S4 278.00 Power requirement for site S5 93.00 Power requirement for site S6 23.00 Table 3.
Water pump requirements for each site
-
Turbine index Turbine manufacturers Turbine operating speed range (m/s) Rotor diameter (m) Rated power (kW) Hub height (m) $ \boldsymbol{V}_{\boldsymbol {ci}} $ $ \boldsymbol {V}_{\boldsymbol r} $ $ \boldsymbol{V}_{\boldsymbol {co}} $ $ {T}_{1} $ MICON 4.0 14.0 25.0 30.0 200.0 30.0 $ {T}_{2} $ MEPC-MICON 4.0 15.0 25.0 31.0 400.0 30.5 $ {T}_{3} $ ENERCON E-40 2.5 13.0 25.0 44.0 600.0 46.0 $ {T}_{4} $ VESTAS V-47 5.0 15.0 25.0 35.0 660.0 45.0 $ {T}_{5} $ VESTAS V-52 4.0 17.0 25.0 52.0 850.0 55.0 $ {T}_{6} $ MITSUBISHI MWT 4.5 14.4 24.0 29.0 300.0 30.0 $ {T}_{7} $ DW 54 EWT 2.5 7.5 25.0 54.0 250.0 35.0 $ {T}_{8} $ Aeolos-H 100 2.5 10.0 16.0 24.5 100.0 30.0 $ {T}_{9} $ Aeolos-H 30 3.0 9.0 16.0 15.6 30.0 24.0 -
S/N SPV module parameters Rating 1 Nominal maximum power (Pmax) 335.00 Wp 2 Opt. operating voltage (Vmp) 59.90 V 3 Opt. operating current (Imp) 5.60 A 4 Open-circuit voltage (Voc) 71.50 V 5 Short-circuit current (Isc) 6.05 A 6 Module efficiency (M%) 20.00% 7 Operating temperature $ ({T}_{\text{op}}(-),{T}_{\text{op}}(+)) $ −40 °C ~ +85 °C 8 Maximum system voltage $ \left({V}_{\text{ms}}\right) $ 1,000 V 9 Max. Series fuse rating $ \left({I}_{\text{msf}}\right) $ 15 A 10 Power tolerance $ \left({P}_{\text{tol}}\right) $ ± 3.00% 11 Cell type Monocrystalline silicon 12 Temperature coefficient (Pmax) $ \left(\gamma \right) $ −0.26%/°C 13 Temperature coefficient (Voc) $ \left(\beta \right) $ −0.24%/°C 14 Temperature coefficient (Isc) $ \left(\alpha \right) $ +0.06%/°C 15 Model number $ \left({N}_{\text{md}}\right) $ VBHN335KJ01 16 Degradation rate 3.00% (first year), 0.45%/year Table 5.
Technical specifications of the best (Panasonic solar) SPV module[27]
-
Parameter SPV Wind Biomass Interest rate $ \left(i\right) $ 0.27 0.27 Inflation rate $ \left(f\right) $ 0.22 0.22 0.22 Discount rate $ \left({d}_{n}\right) $ 0.30 O&M cost (Com) $ 0.02{C}_{ok} $ 0.25 I Eq. (29) Lifetime $ \left(n\right) $ 25 25 15 Installation and civil work $ \left({C}_{ci}\right) $ 0.04 I Battery and inverter $ \left({C}_{ib}\right) $ 0.13 I I shows that operation and maintenance cost of a wind turbine system is 25% of the investment and installation cost. Table 6.
Economic parameters of the renewable resources
-
Sites Parameters Solar module performance M1 M2 M3 M4 M5 M6 M7 M8 M9 M10 S1 Cf (%) 18.18 18.76 18.50 18.20 18.30 18.22 18.25 18.06 18.20 18.15 S2 Cf (%) 16.83 17.38 17.06 16.81 16.92 16.81 16.86 16.61 16.82 16.76 S3 Cf (%) 14.63 15.08 14.85 14.59 14.68 14.63 14.65 14.48 14.61 14.58 S4 Cf (%) 14.09 17.43 17.15 16.86 14.17 16.90 16.91 16.71 16.87 16.83 S5 Cf (%) 17.75 18.33 18.02 17.76 17.86 17.75 17.80 17.56 17.76 17.70 S6 Cf (%) 18.43 19.09 18.72 18.40 18.72 18.44 18.81 18.25 18.25 18.53 The bolded data shows that Solar module M2 gives the highest capacity factor in all the sites. Table 7.
Solar PV capacity factor for different modules and sites under study
-
Sites Parameters Wind turbine performance T1 T2 T3 T4 T5 T6 T7 T8 T9 S1 Cf/% 7.56 6.51 17.19 4.44 4.98 5.94 40.08 22.72 25.88 S2 Cf/% 5.42 4.66 13.88 2.99 3.57 4.11 32.17 18.10 20.00 S3 Cf/% 0.01 0.01 2.39 0.00 0.01 0.00 3.72 1.98 0.99 S4 Cf/% 0.38 0.33 4.41 0.05 0.25 0.14 9.55 5.09 4.09 S5 Cf/% 8.58 7.39 17.77 5.13 5.65 6.84 43.85 24.42 28.62 S6 Cf/% 1.33 1.14 8.25 0.20 0.87 0.58 17.26 9.21 8.94 The bolded data shows that Wind turbine T7 gives the highest capacity factor in all the sites. Table 8.
Capacity factor of different turbines
-
Country/location LCoE South Africa[3] Wind $ {\$} $ $ {\$} $ SPV $ {\$} $ $ {\$} $ Biomass $ {\$} $ $ {\$} $ Nigeria Biomass (AD)[22] $ {\$} $ Biomass (LFG) $ {\$} $ Wind[36] $ {\$} $ SPV[2] $ {\$} $ Chad[7] ORC $ {\$} $ SPV $ {\$} $ Table 9.
Cost of energy in the literature compared with this study
-
Parameters Sites S1 S2 S3 S4 S5 S6 CO2 saved (tonnes) 55,911.0 20,721.0 76,243.0 93,802.0 31,658.0 7,678.5 Table 10.
Environmental effect of replacing coal with SPV
-
Region Wind shear exponent (a) North-central region Minna 0.24 Lokoja 0.24 Makurdi 0.26 Jos 0.23 Lafia 0.25 Ilorin 0.24 Abuja 0.25 (b) Northeast region Bauchi 0.21 Maiduguri 0.25 Jalingo 0.25 Yola 0.22 Gombe 0.22 Damaturu 0.25 (c) Northwest region Gusau 0.23 Sokoto 0.23 Kaduna 0.27 Birnin kebbi 0.27 Katsina 0.30 Kano 0.24 Dutse 0.33 (d) Southeast region Enugu 0.24 Owerri 0.30 Abakaliki 0.26 Umuahia 0.30 Awka 0.27 (e) South-south region Yenagoa 0.38 Uyo 0.36 Benin City 0.33 Port Harcourt 0.28 Calabar 0.10 Asaba 0.48 (f) Southwest region Ibadan 0.28 Ado Ekiti 0.29 Oshogbo 0.35 Akure 0.41 Ikeja 0.18 Abeokuta 0.30 Table 11.
Wind shear exponent for different regions
Figures
(10)
Tables
(11)