-
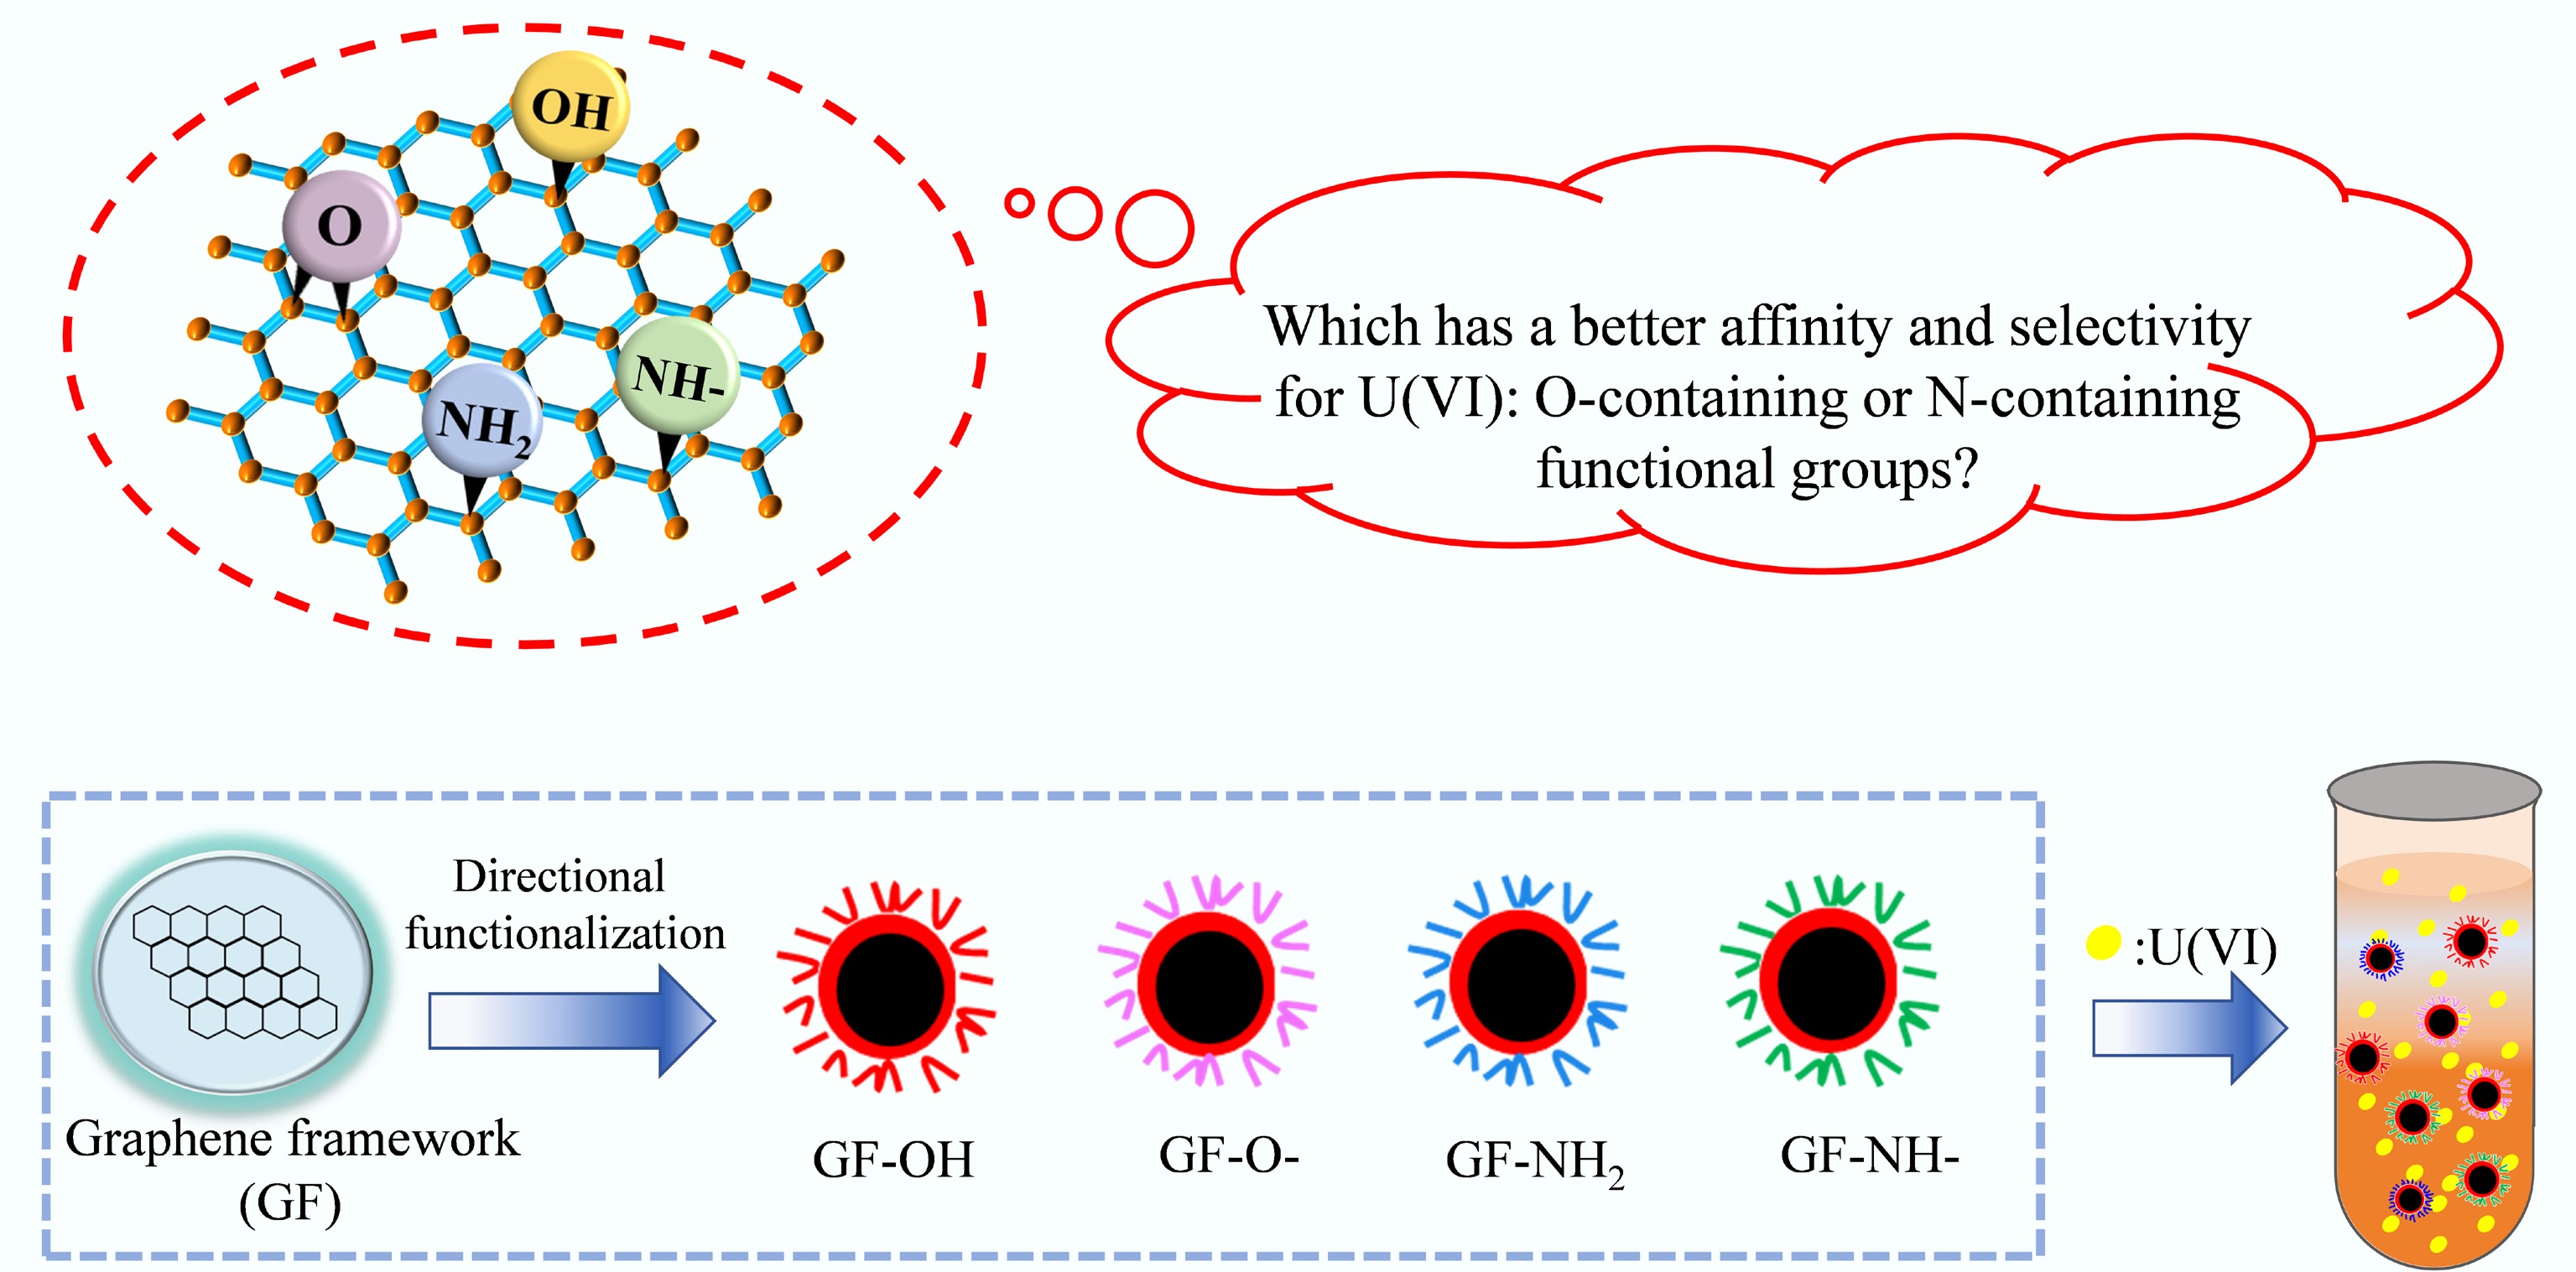
Figure 1.
Schematic illustration of this research approach.
-
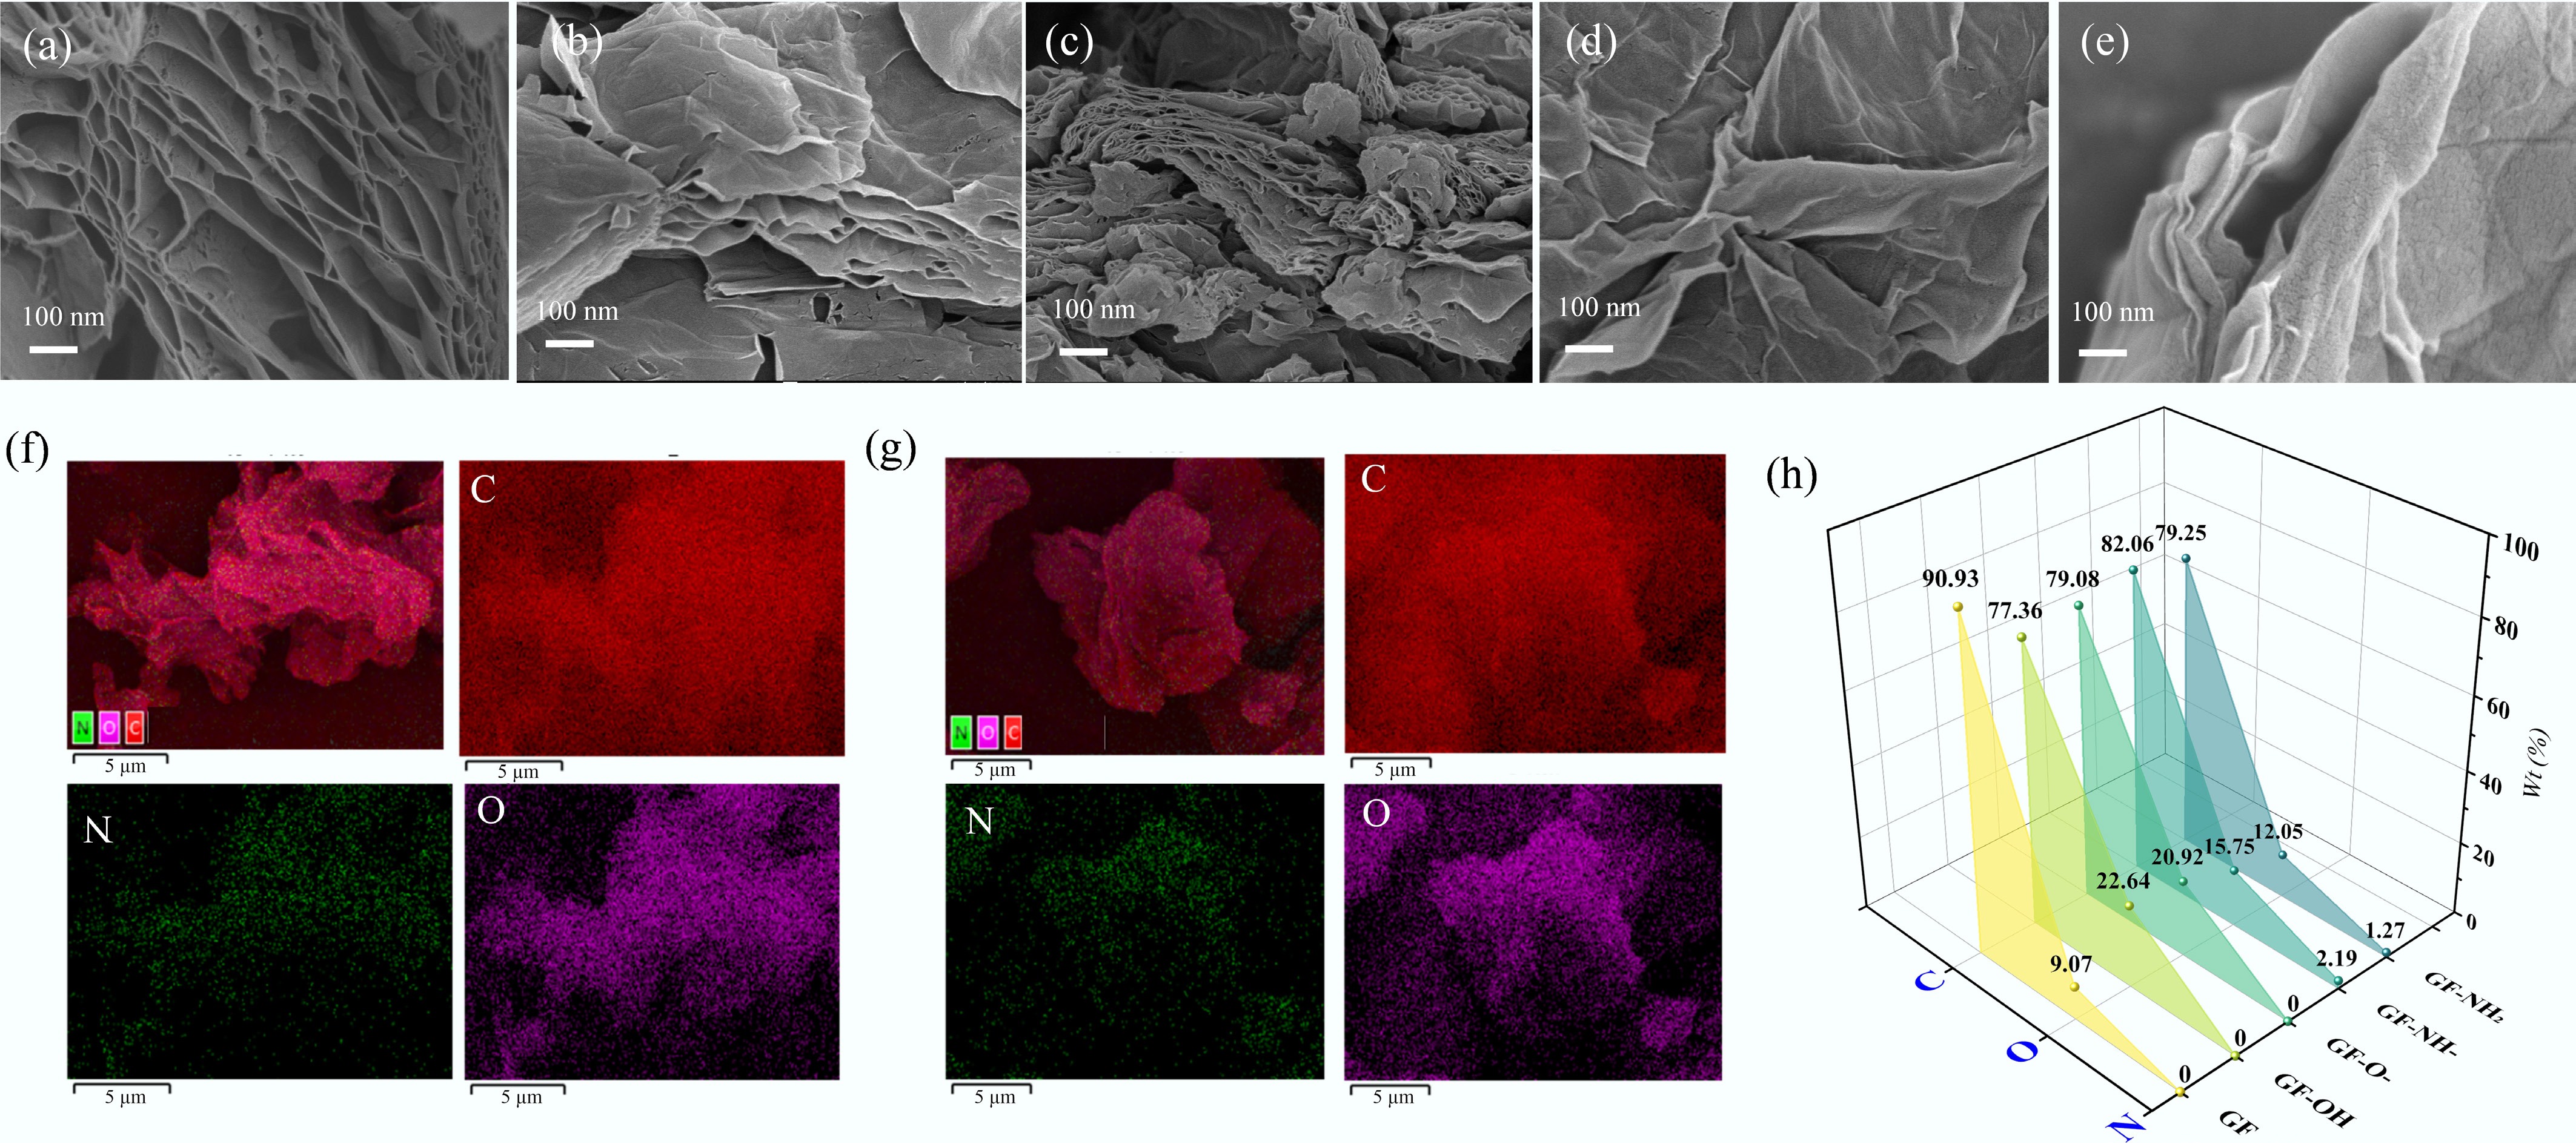
Figure 2.
SEM images of (a) GF, (b) GF-OH, (c) GF-O-, (d) GF-NH-, and (e) GF-NH2. EDS mapping of (f) GF-NH2, (g) GF-NH-, and (h) energy-dispersive X-ray spectroscopy (EDS) spectra of element content ratios of different composites.
-
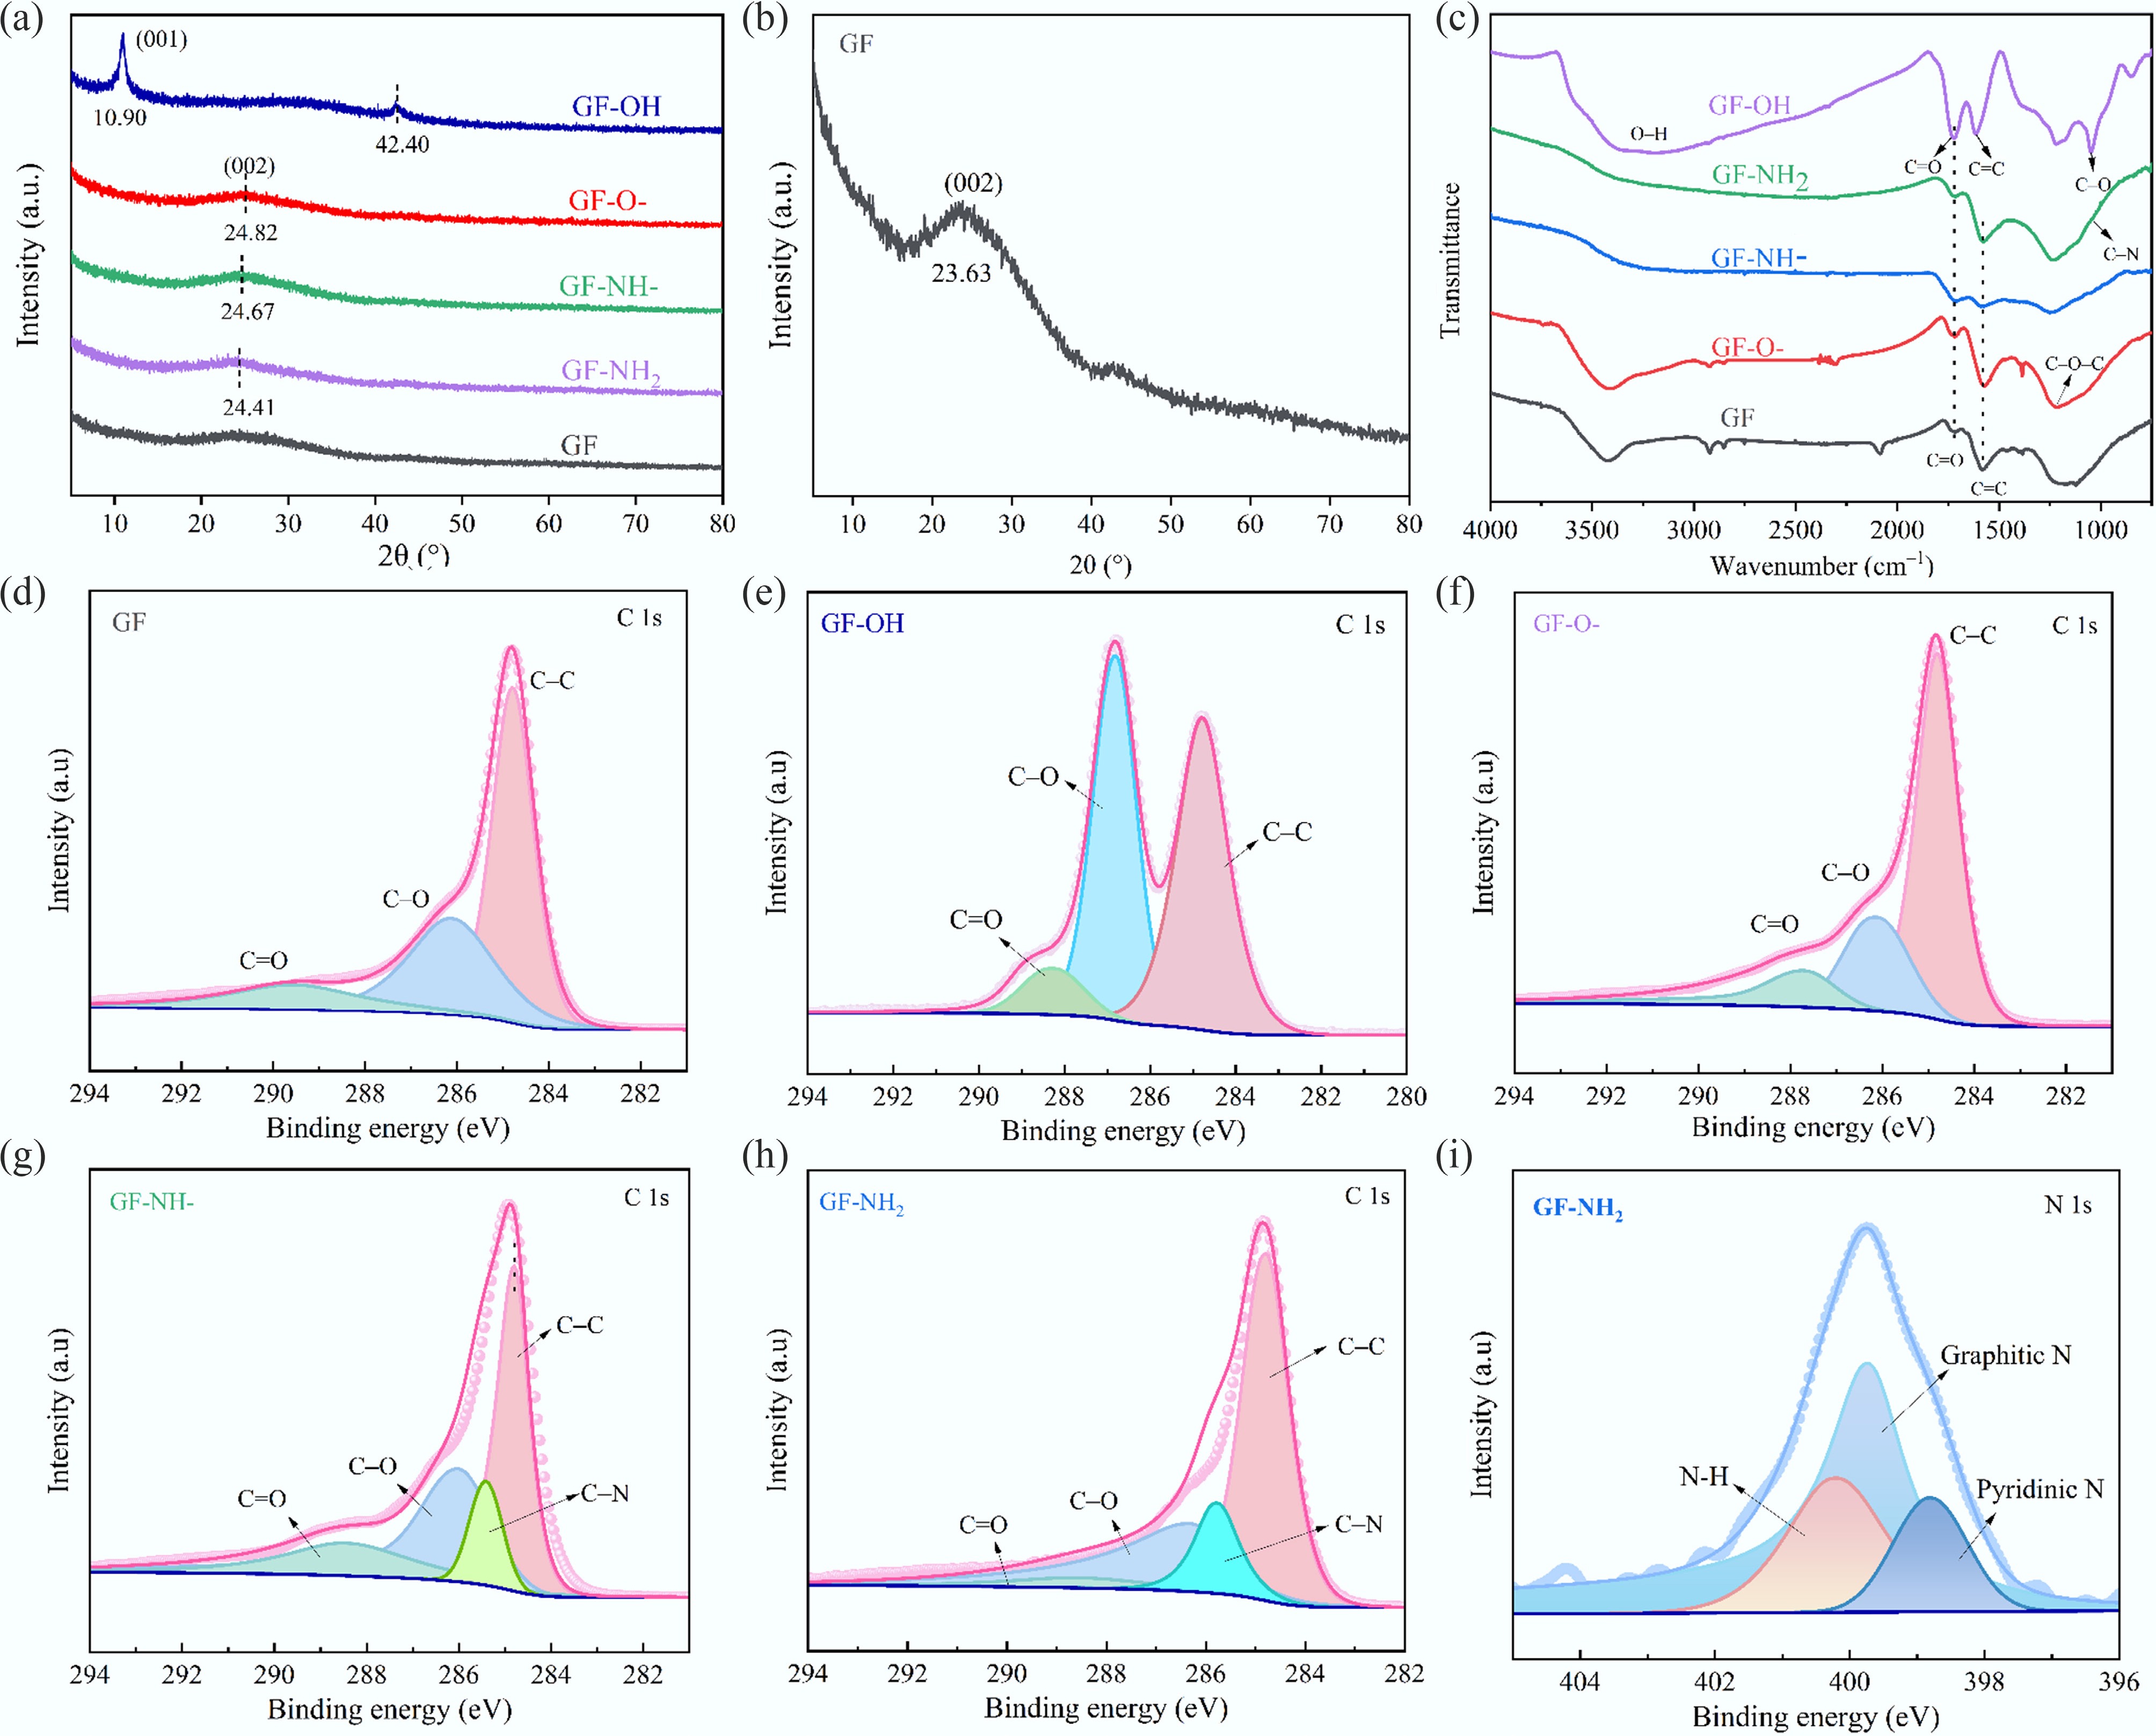
Figure 3.
(a, b) XRD patterns, (c) FT-IR spectra, (d–h) XPS C 1s, and (i) N 1s of GFs.
-
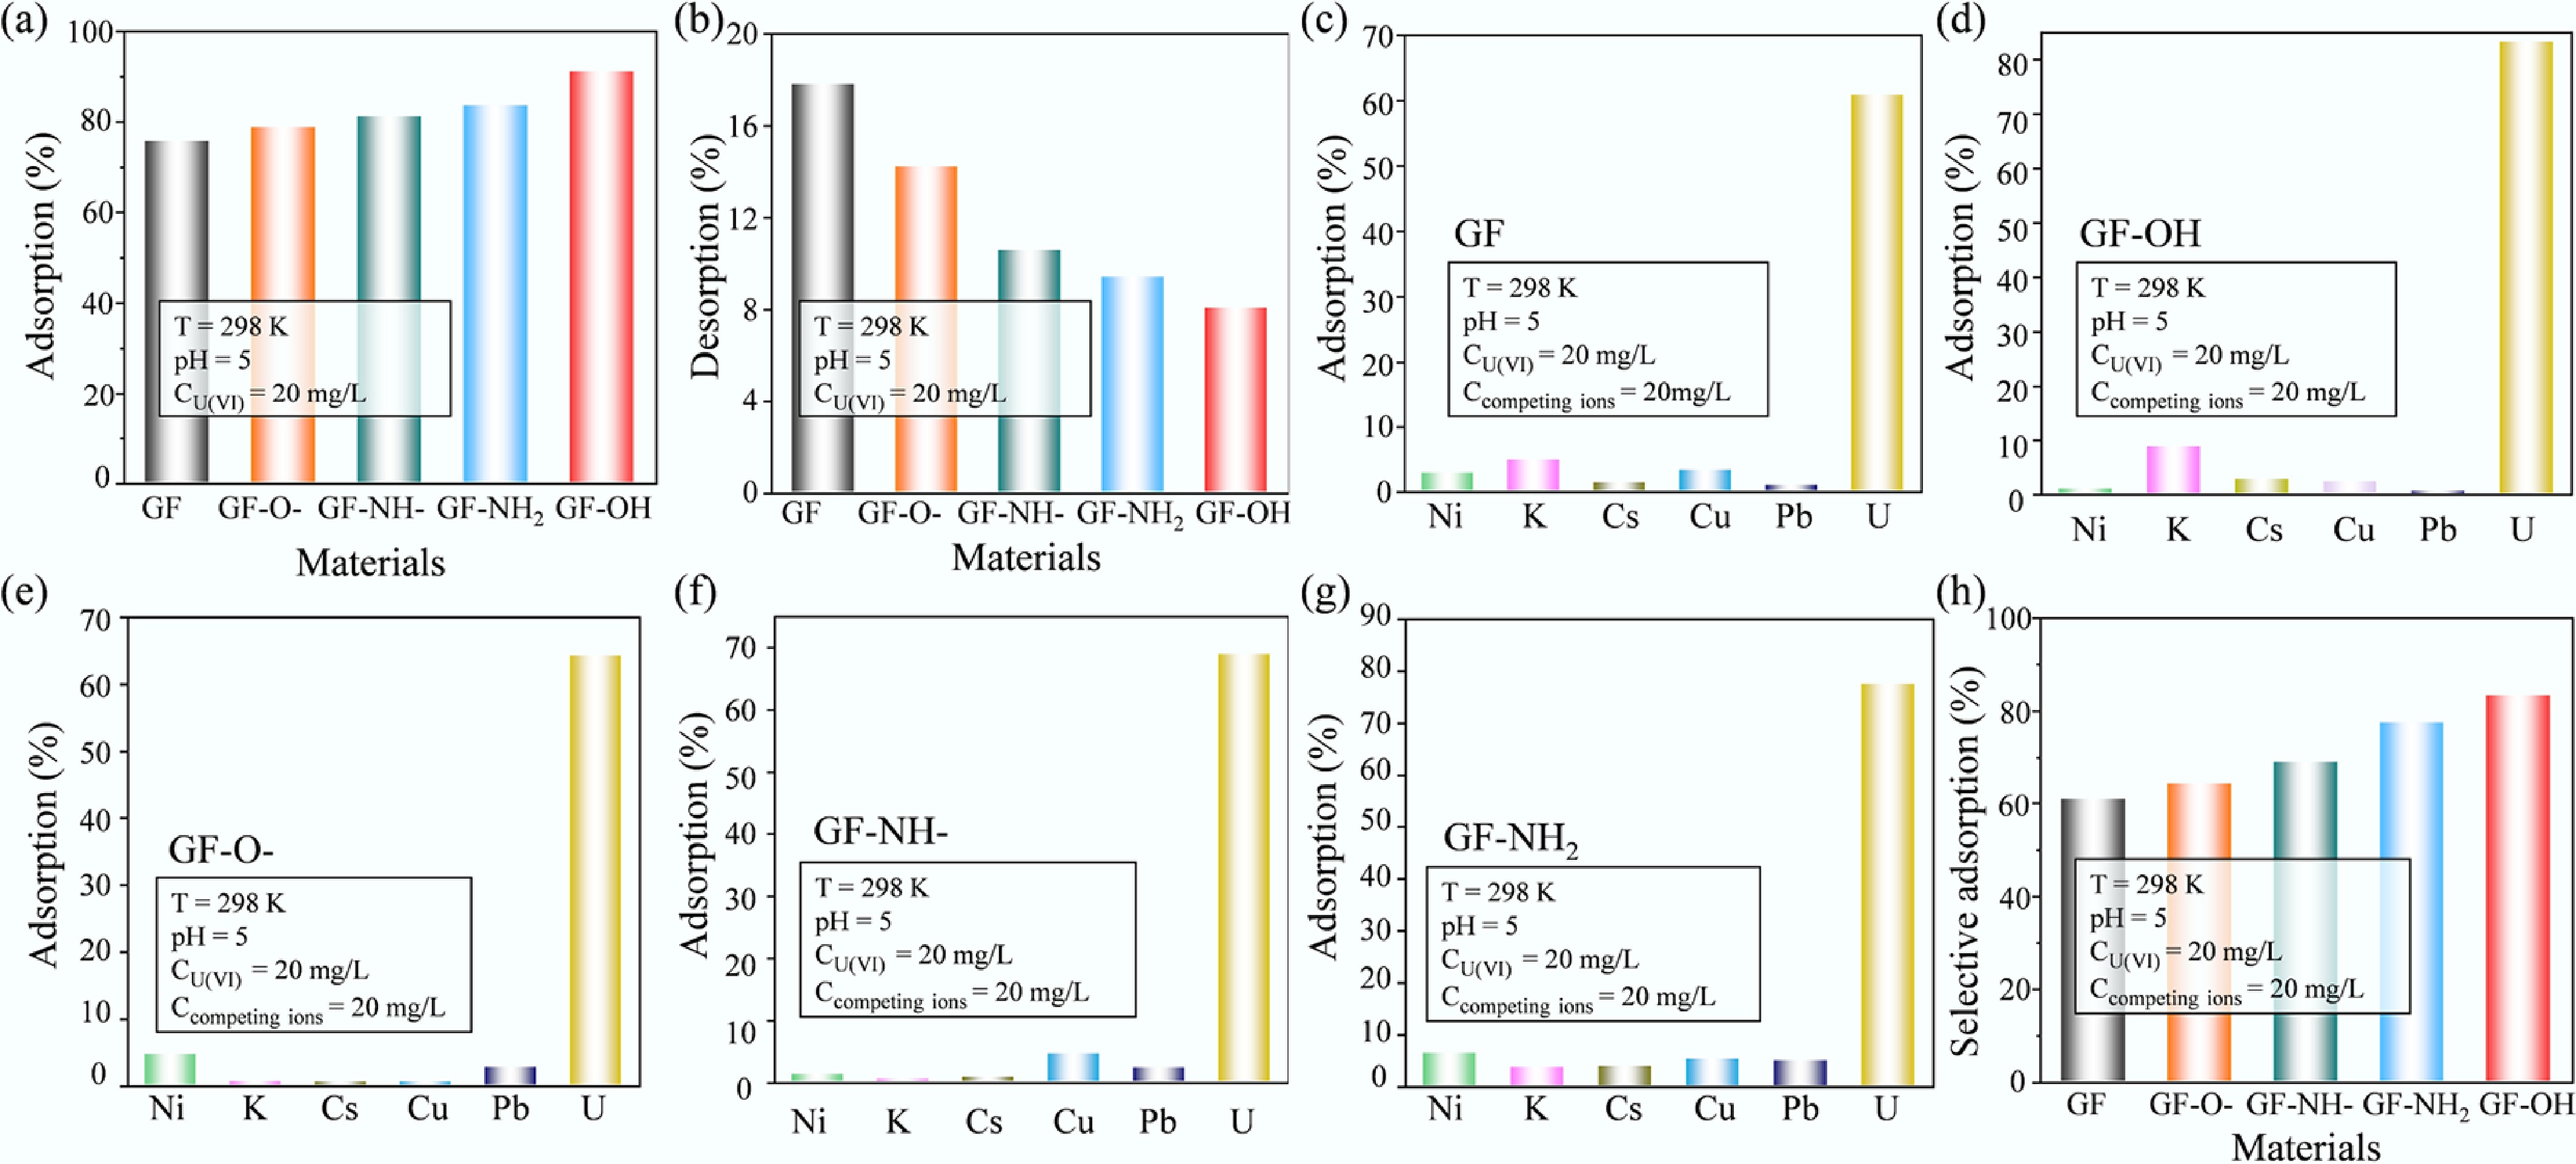
Figure 4.
(a) Adsorption, (b) desorption, and (c–h) selective adsorption of U(VI) onto GFs.
-
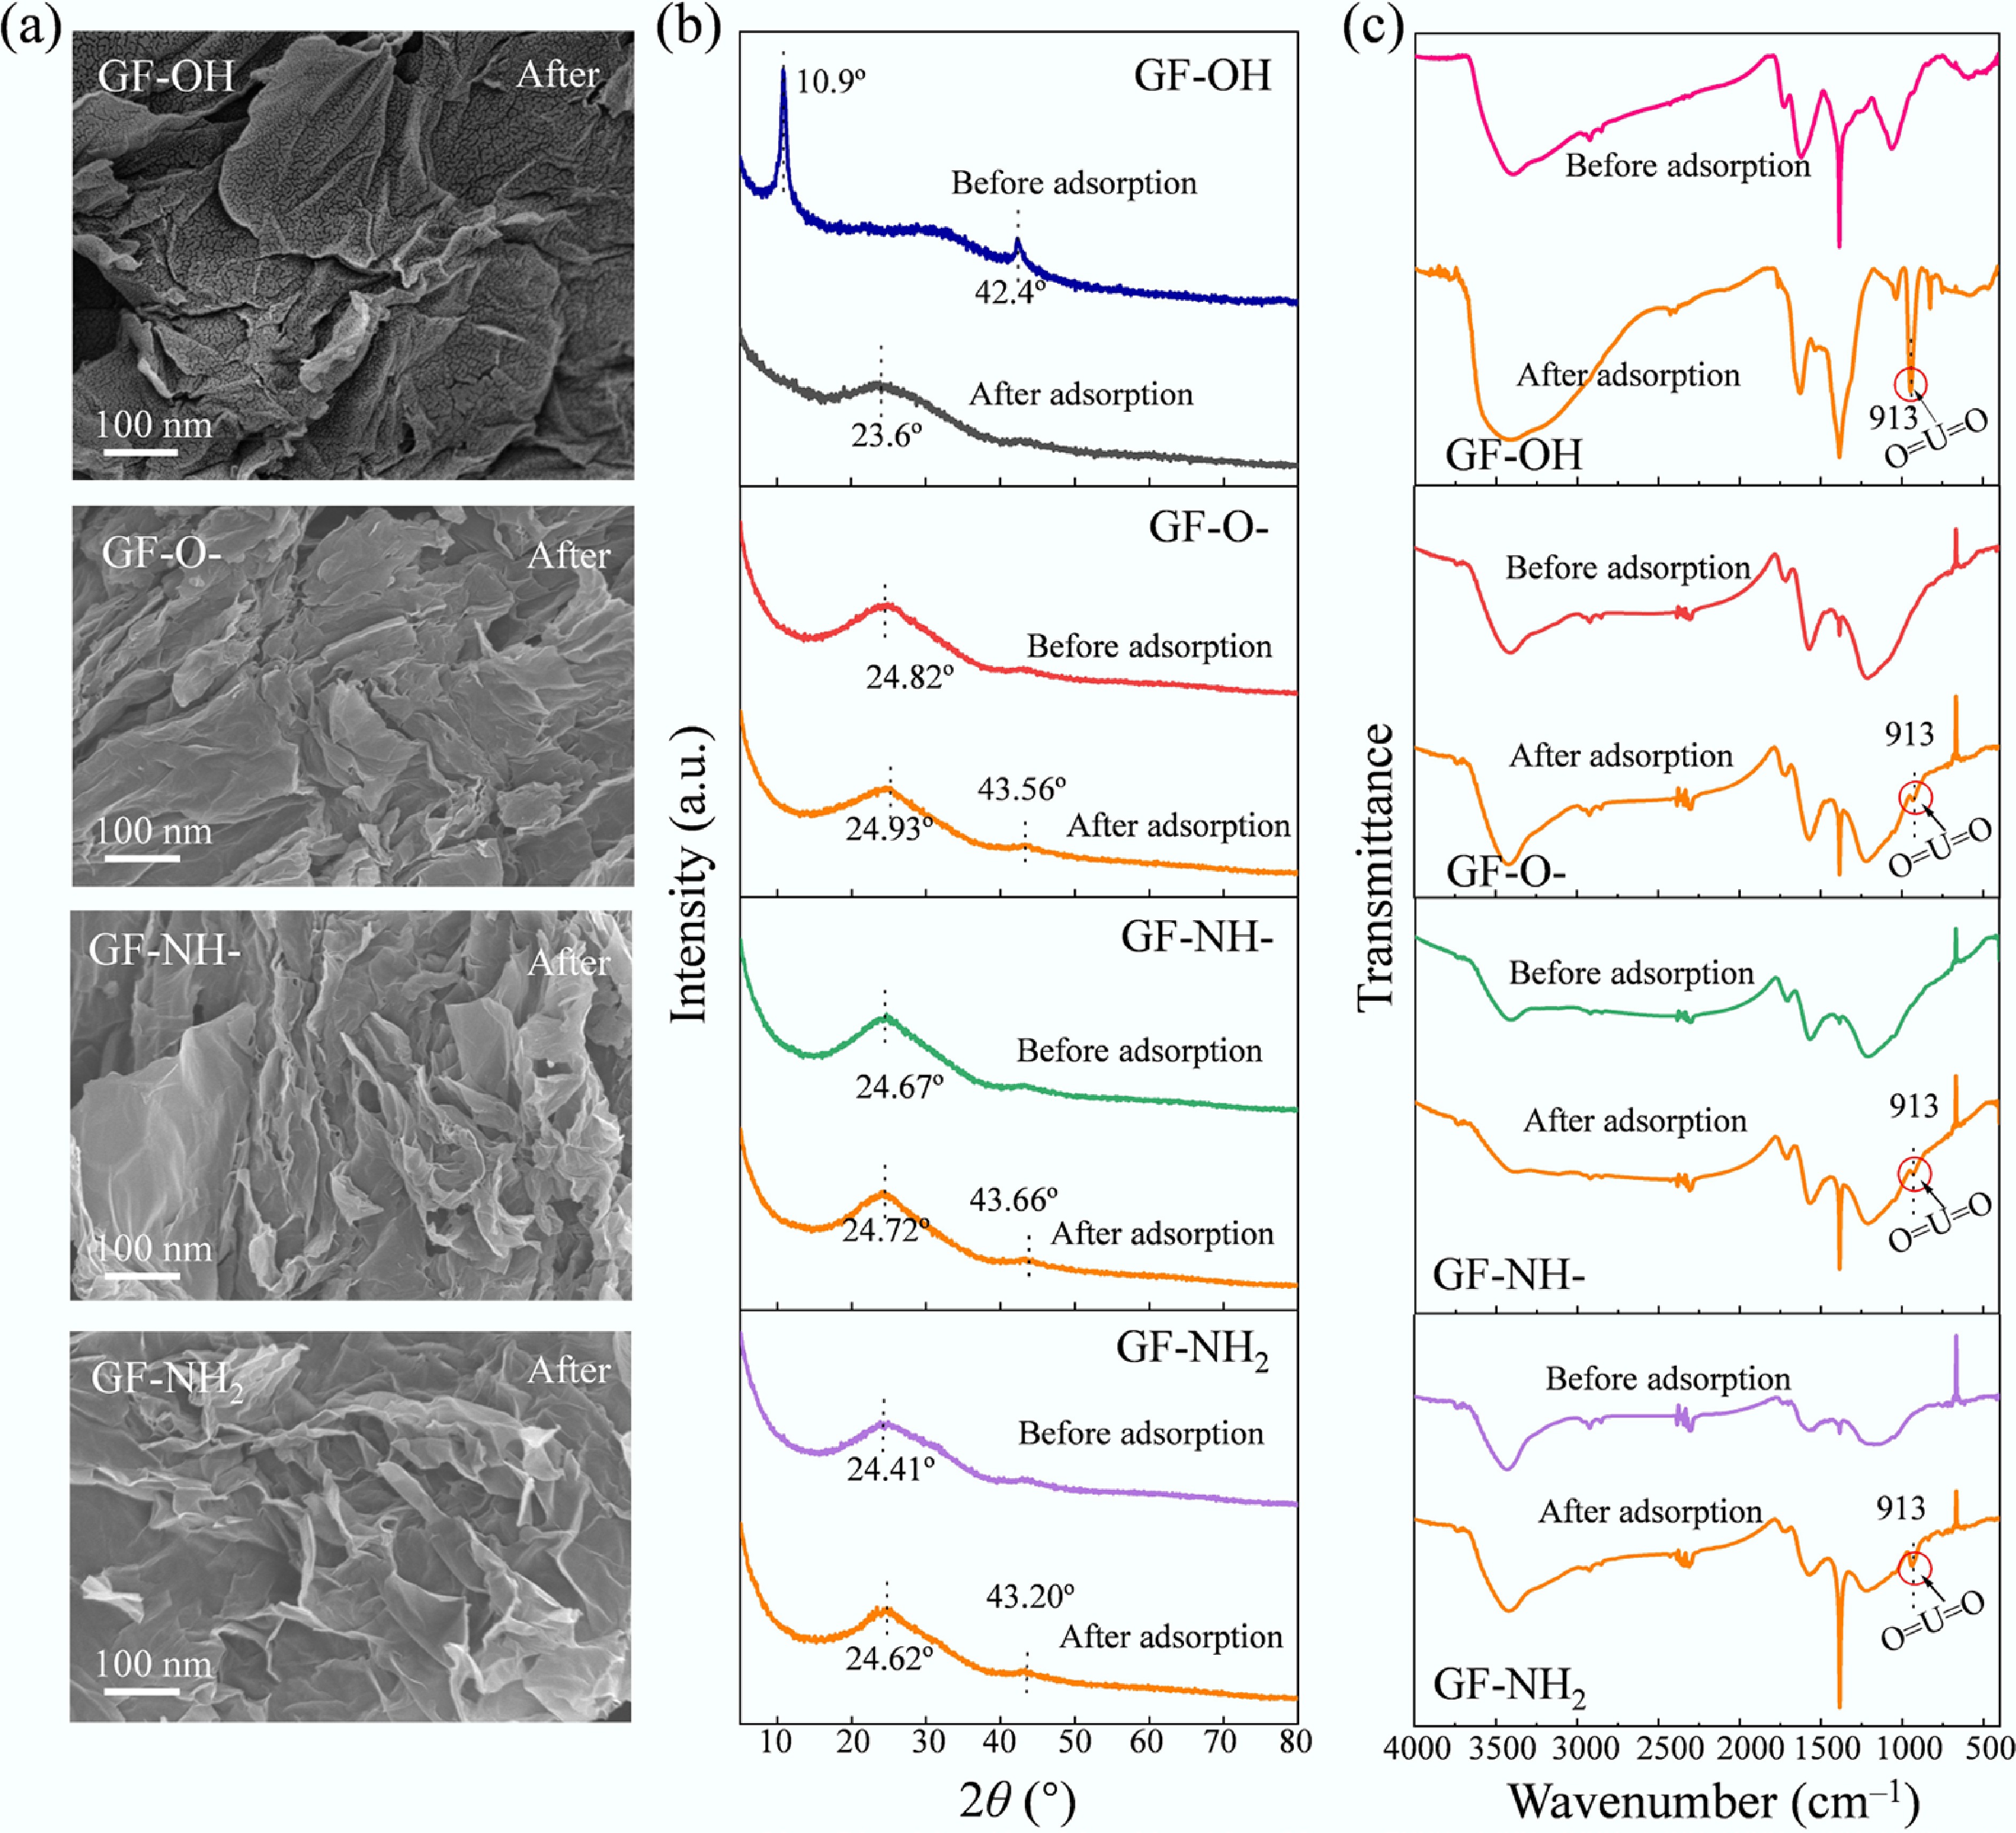
Figure 5.
Characterization of GFs after U(VI) adsorption: (a) SEM images, (b) XRD patterns, and (c) FT-IR spectra.
-
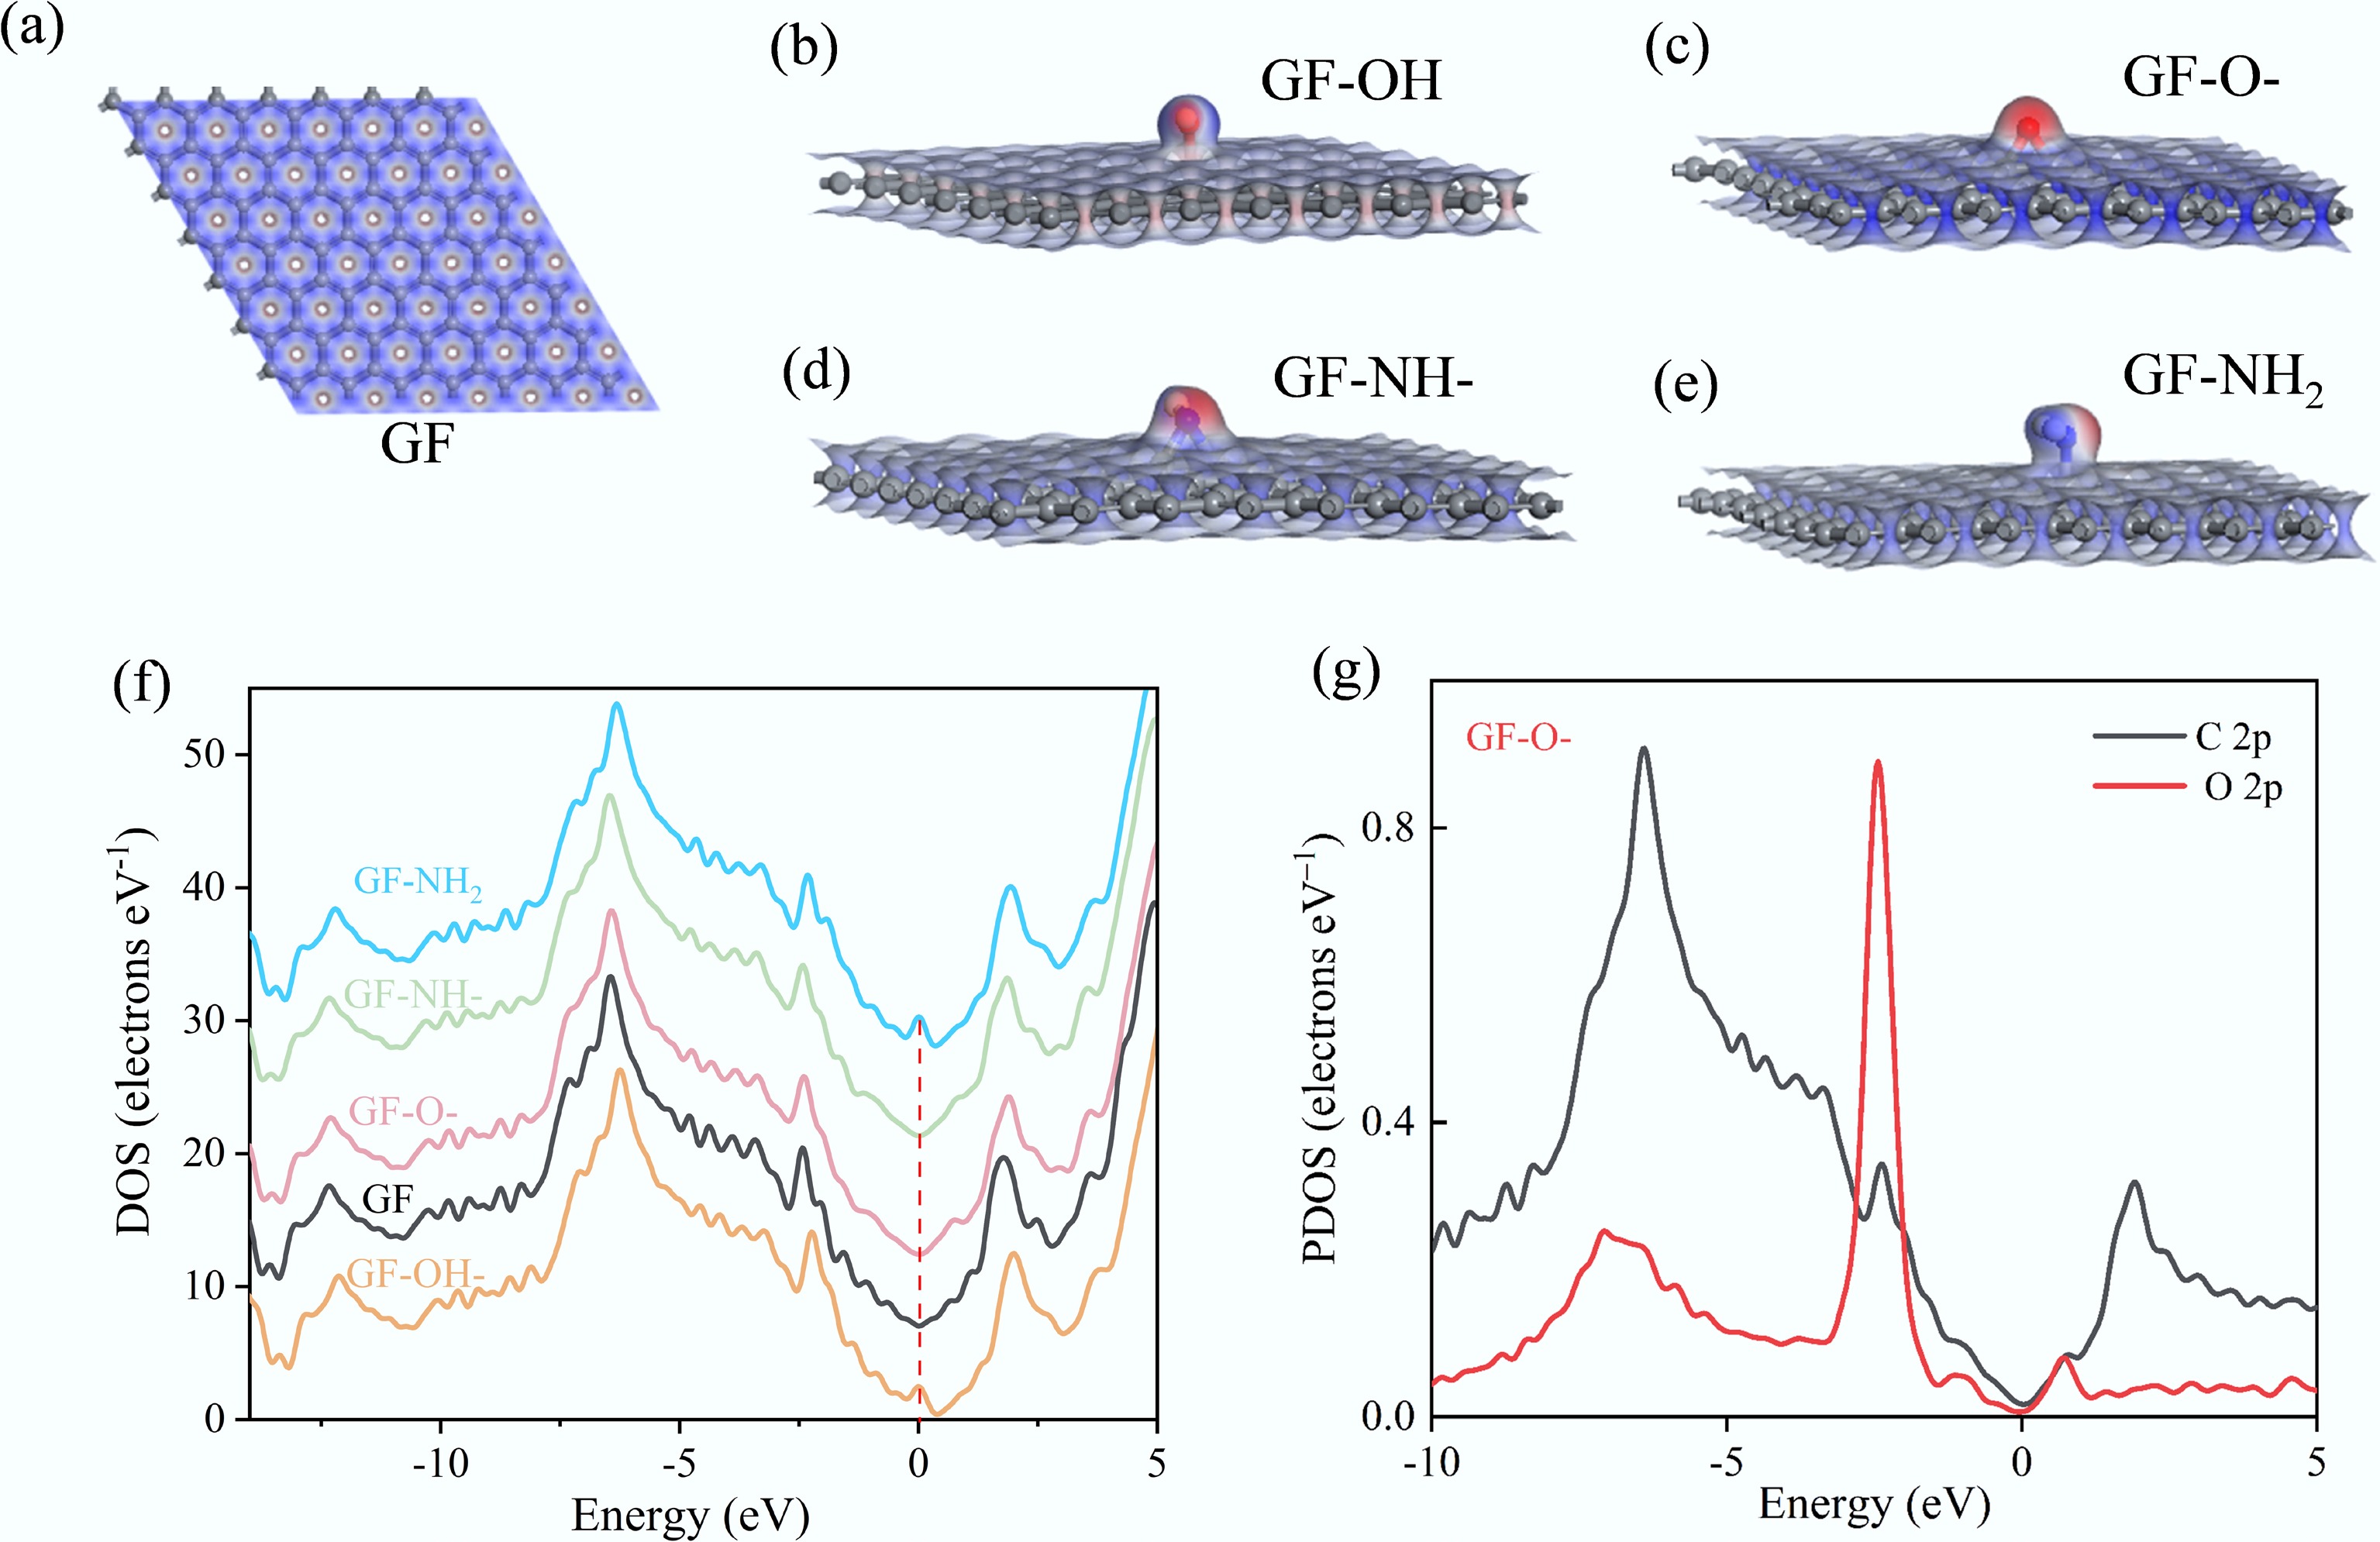
Figure 6.
(a–e) The ESP distribution of GFs, (f) the calculated total density of states (DOS) for GFs, and (g) the partial density of states (PDOS) for the labeled C atoms (2p orbital) and O atoms (2p orbital) in GF-O-.
-
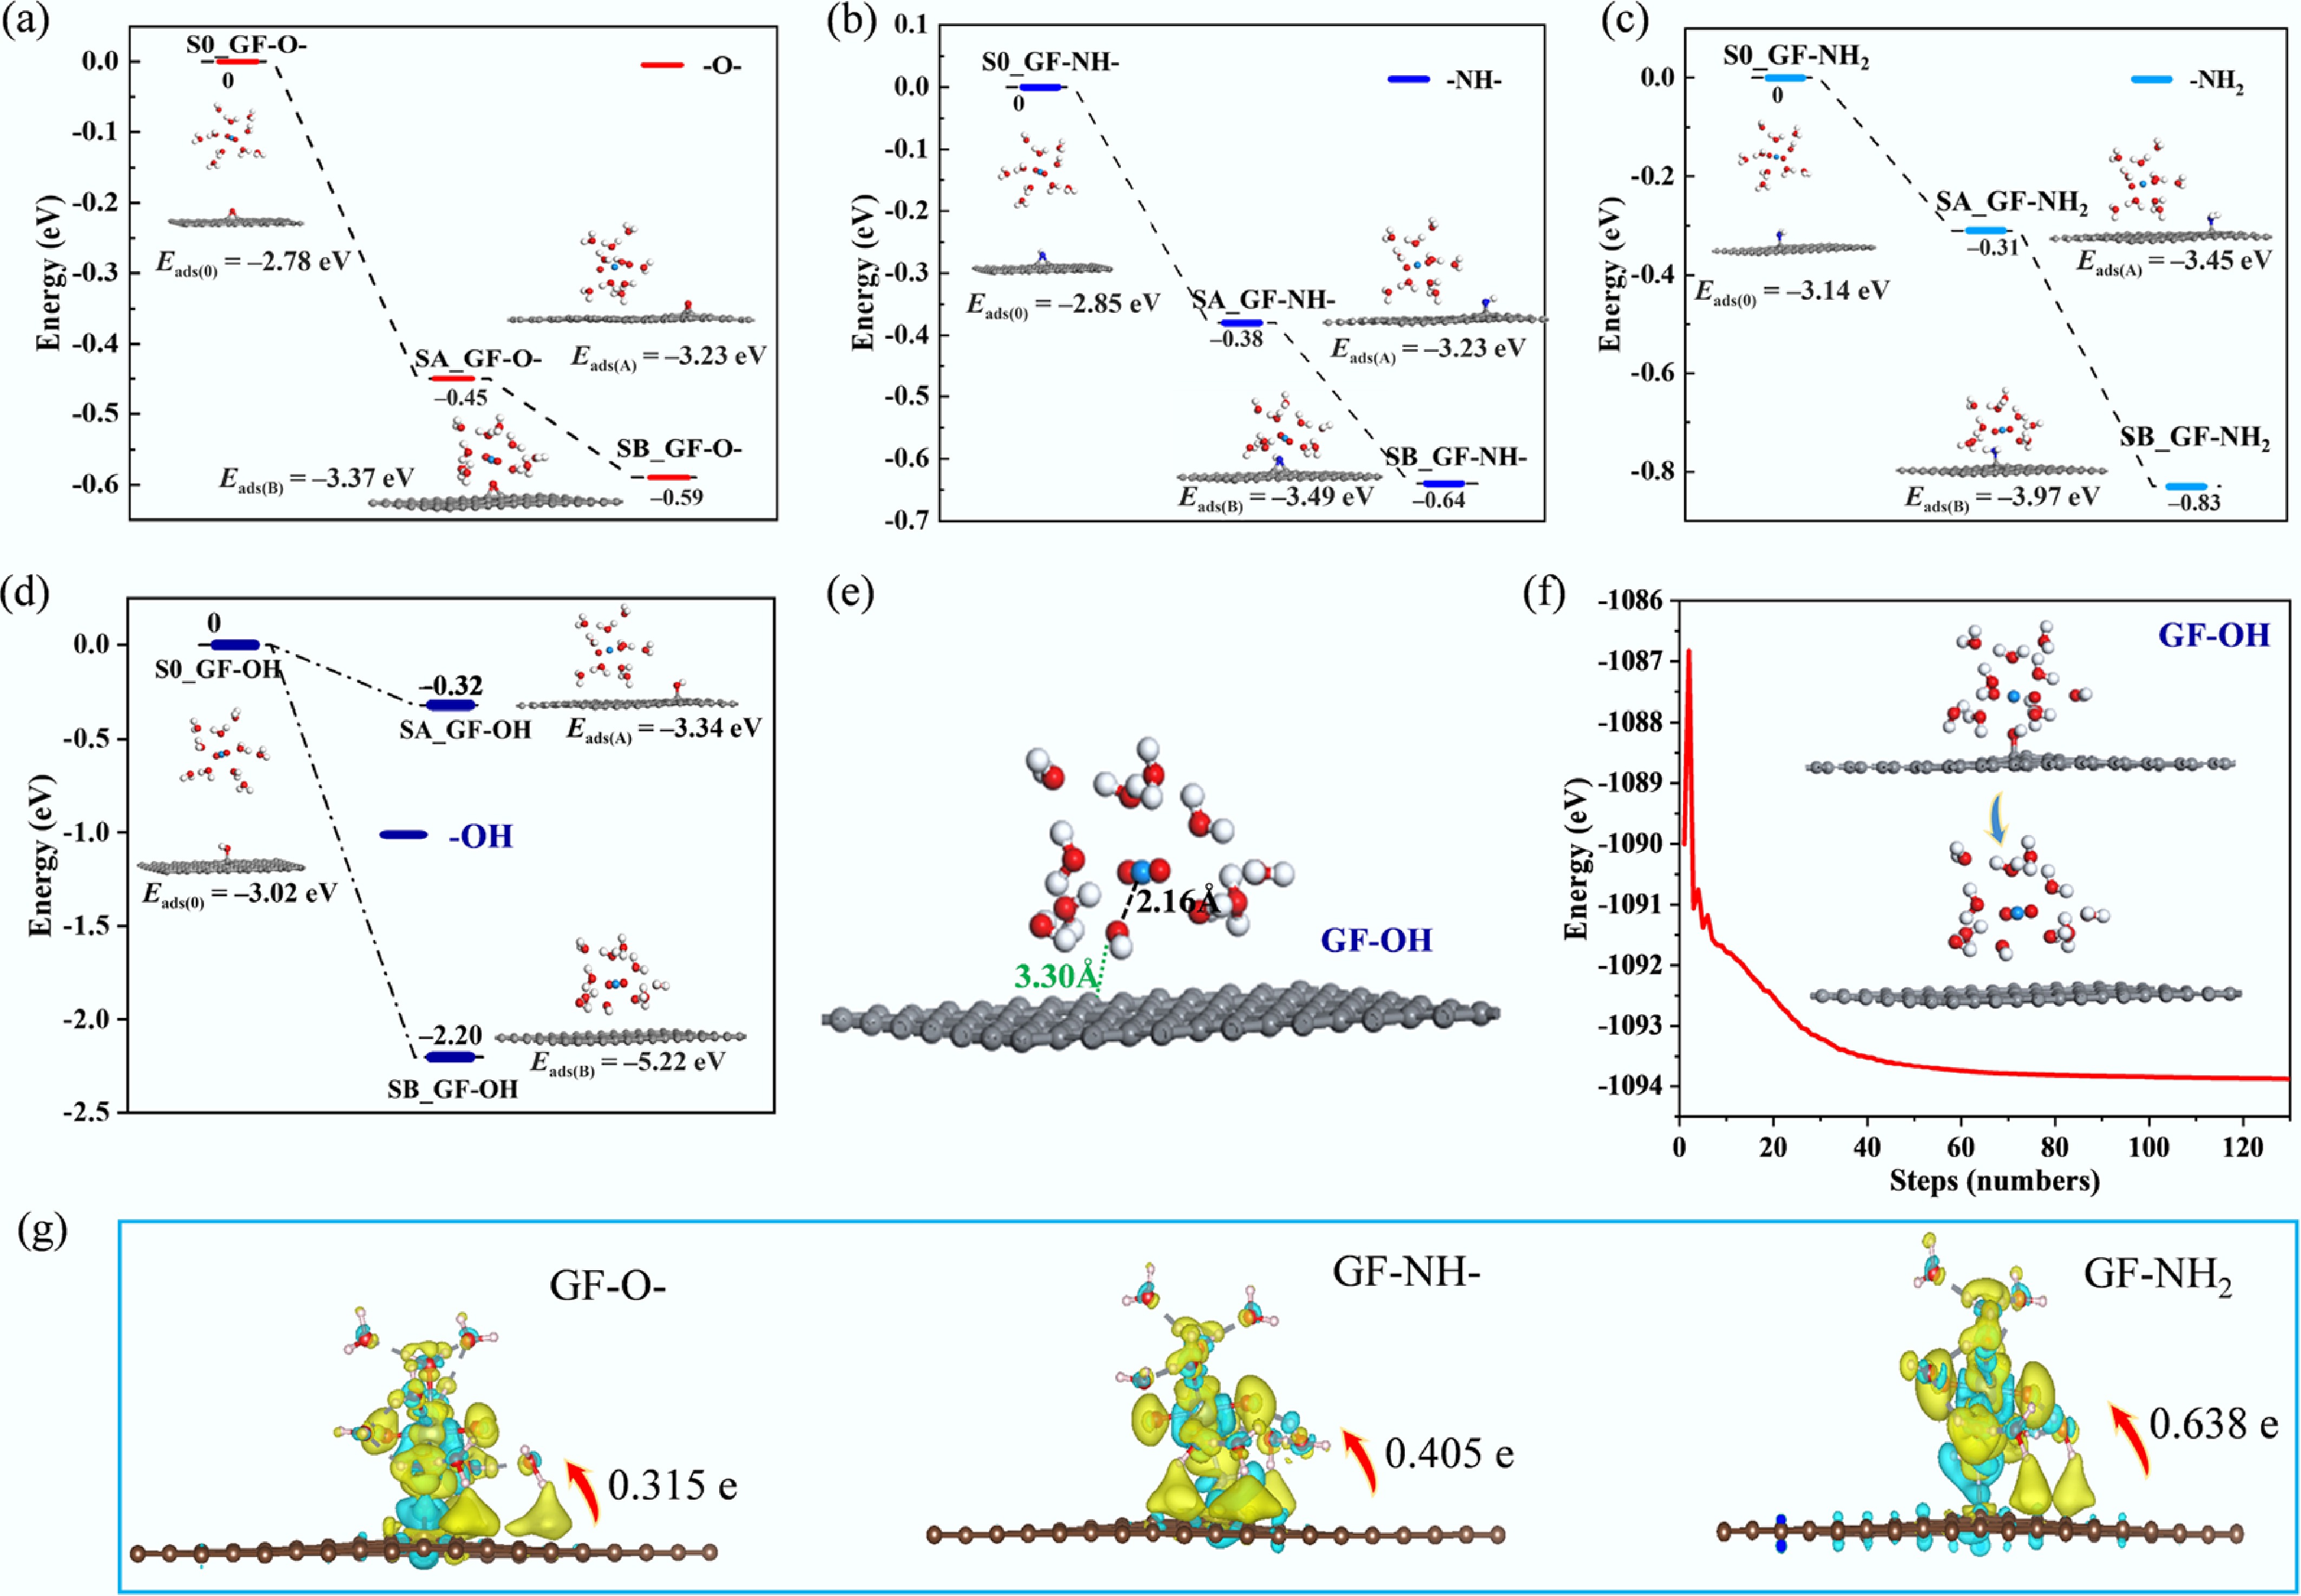
Figure 7.
(a) Charge density differences of GF-O-, GF-NH-, and GF-NH2 for U(VI) adsorption. (b−e) Energy changes during U(VI) adsorption: (b) GF-O-, (c) GF-NH-, (d) GF-NH2, and (e) GF-OH. (f) The structure of GF-OH after U(VI) sorption. (g) Energy profile of the optimized adsorption process of U(VI) on GF-OH.
-
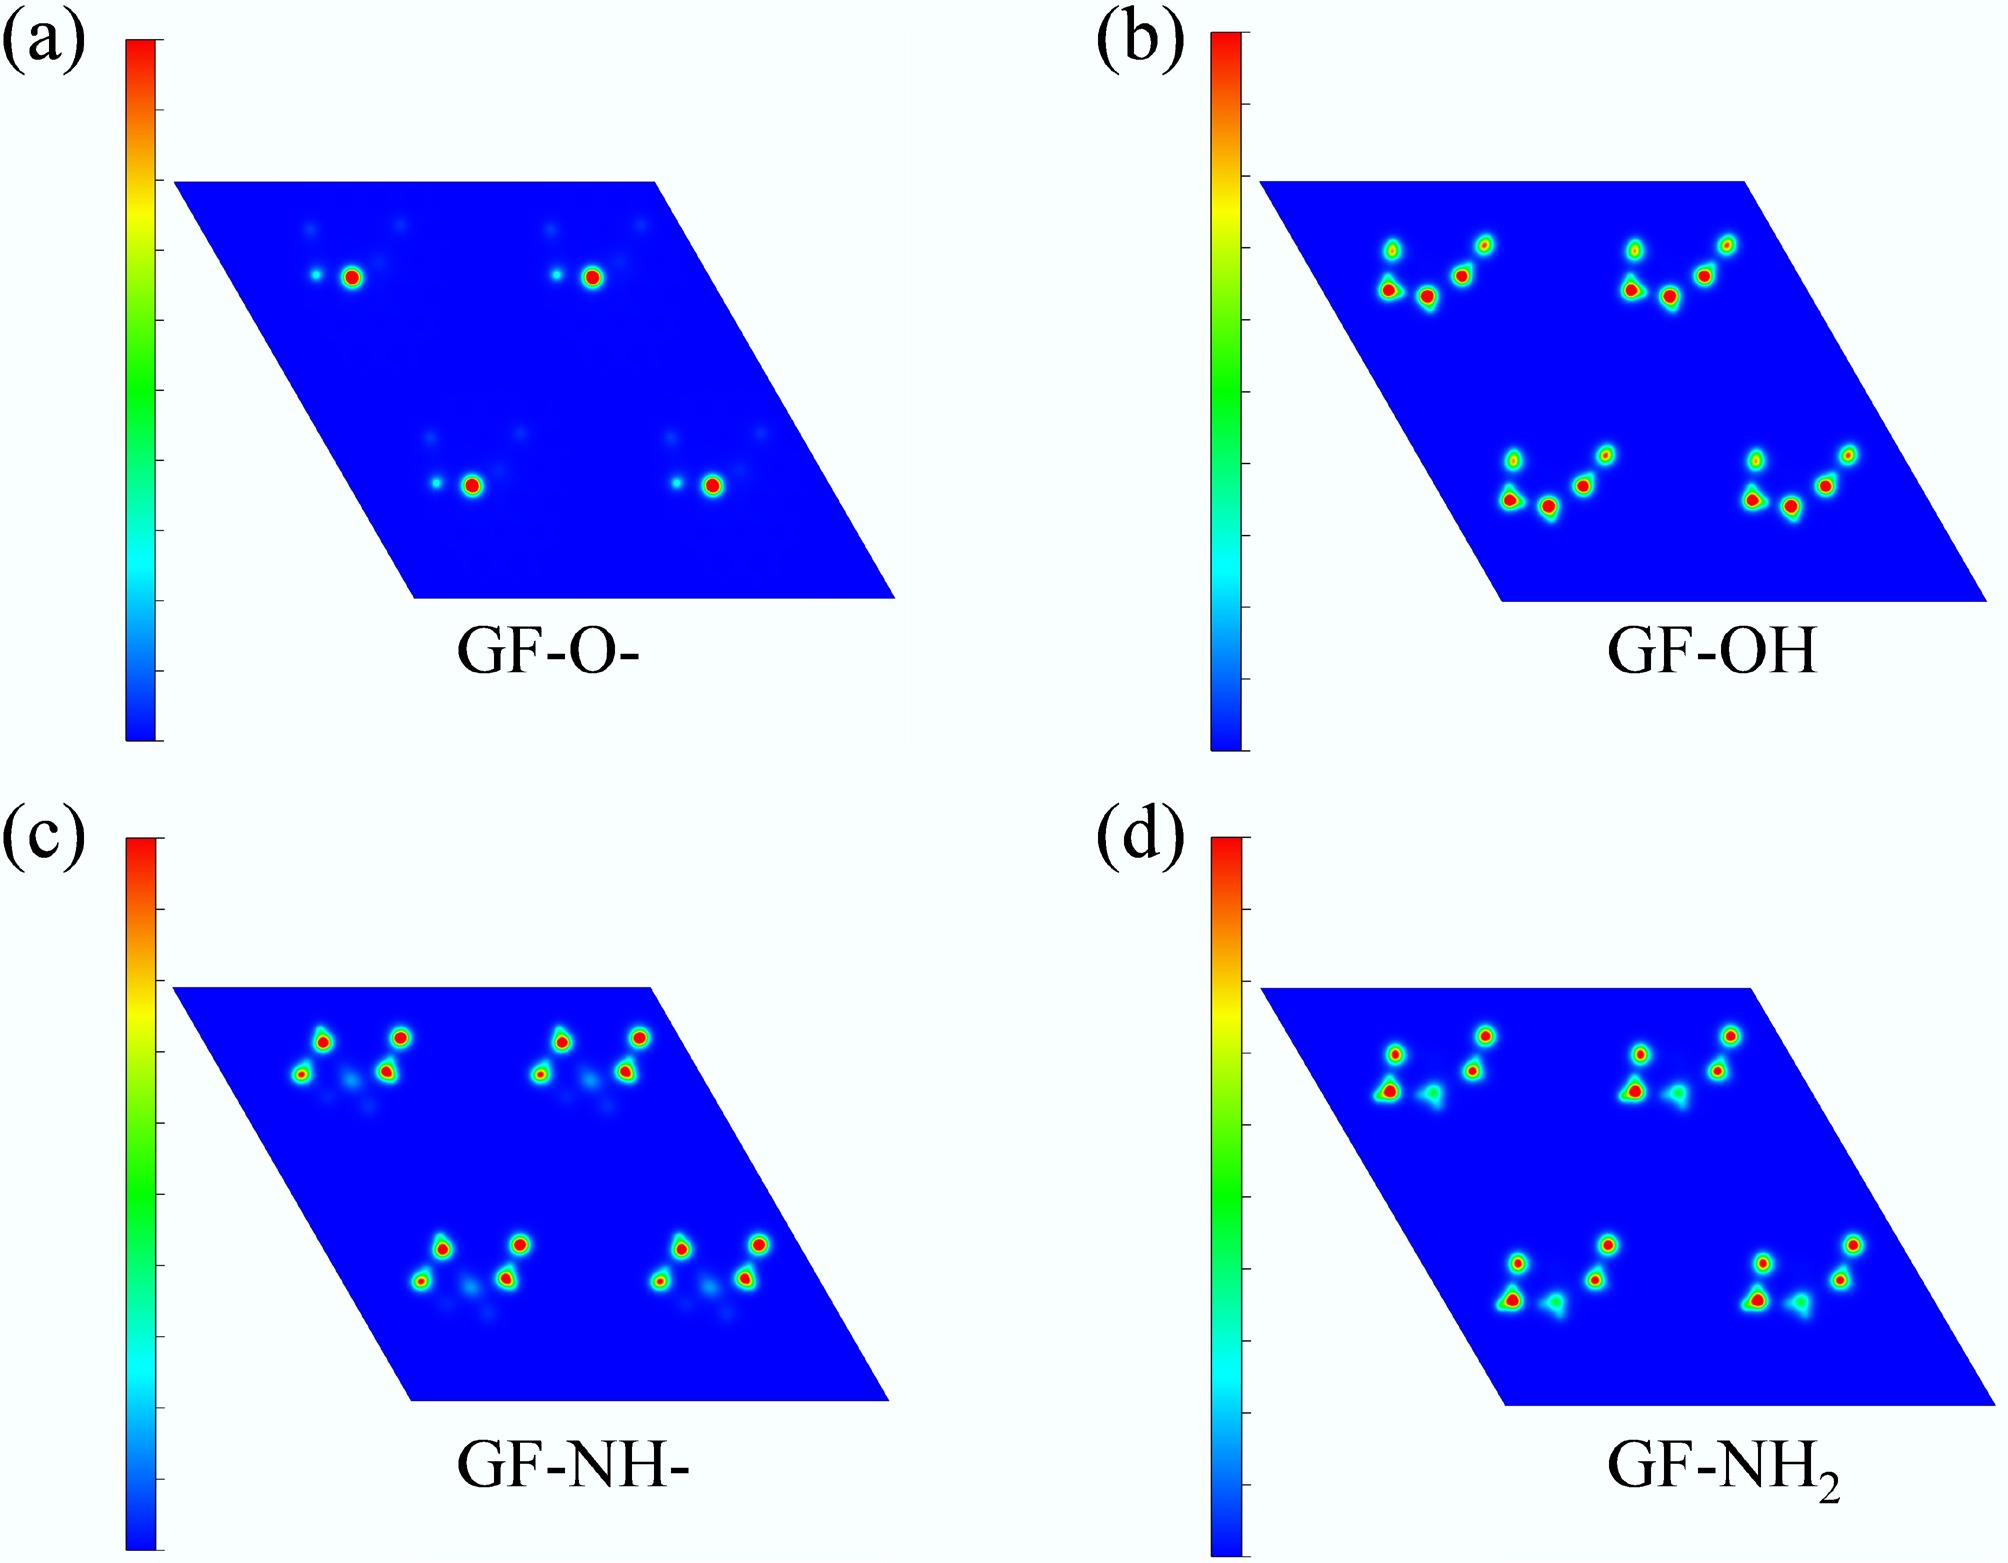
Figure 8.
Planar colored contour maps of charge density difference for (a) GF-O-, (b) GF-OH, (c) GF-NH-, and (d) GF-NH2.
Figures
(8)
Tables
(0)