-
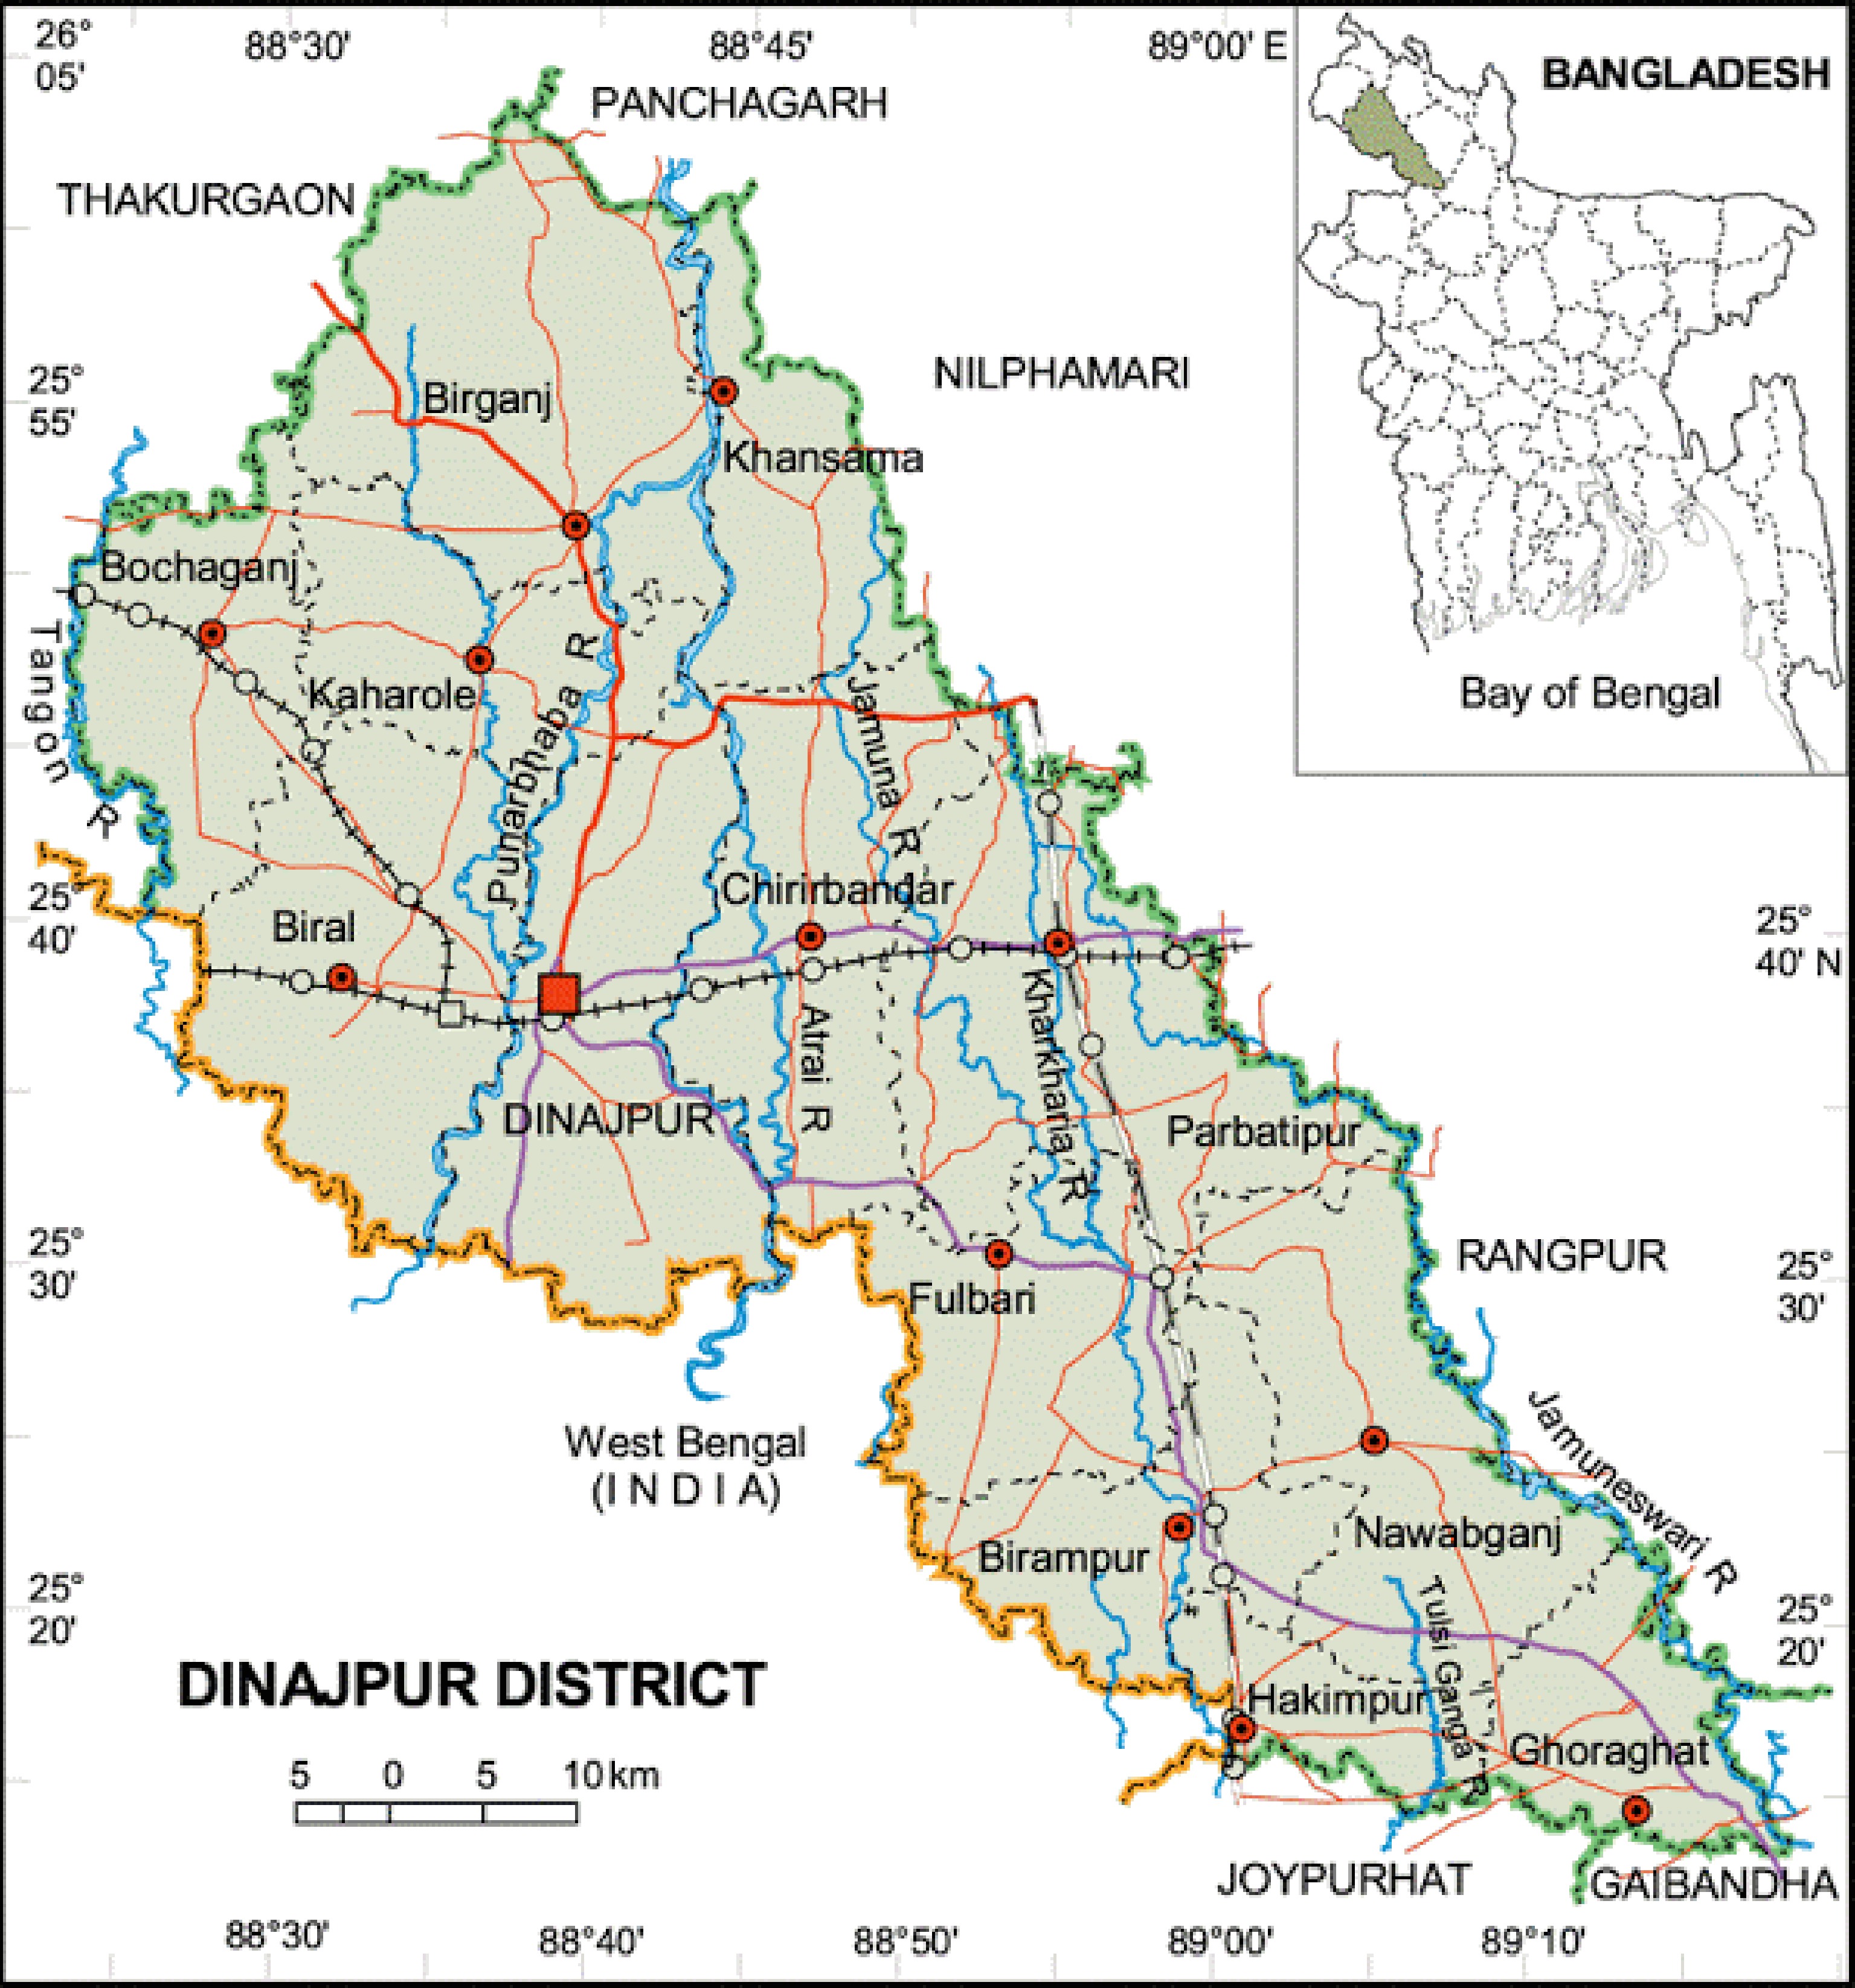
Figure 1.
District map of Dinajpur. Map source: Office of Dinajpur Sadar Upazila (
https://bangladesh-map-all.blogspot.com/p/blog-page_11.html ). -
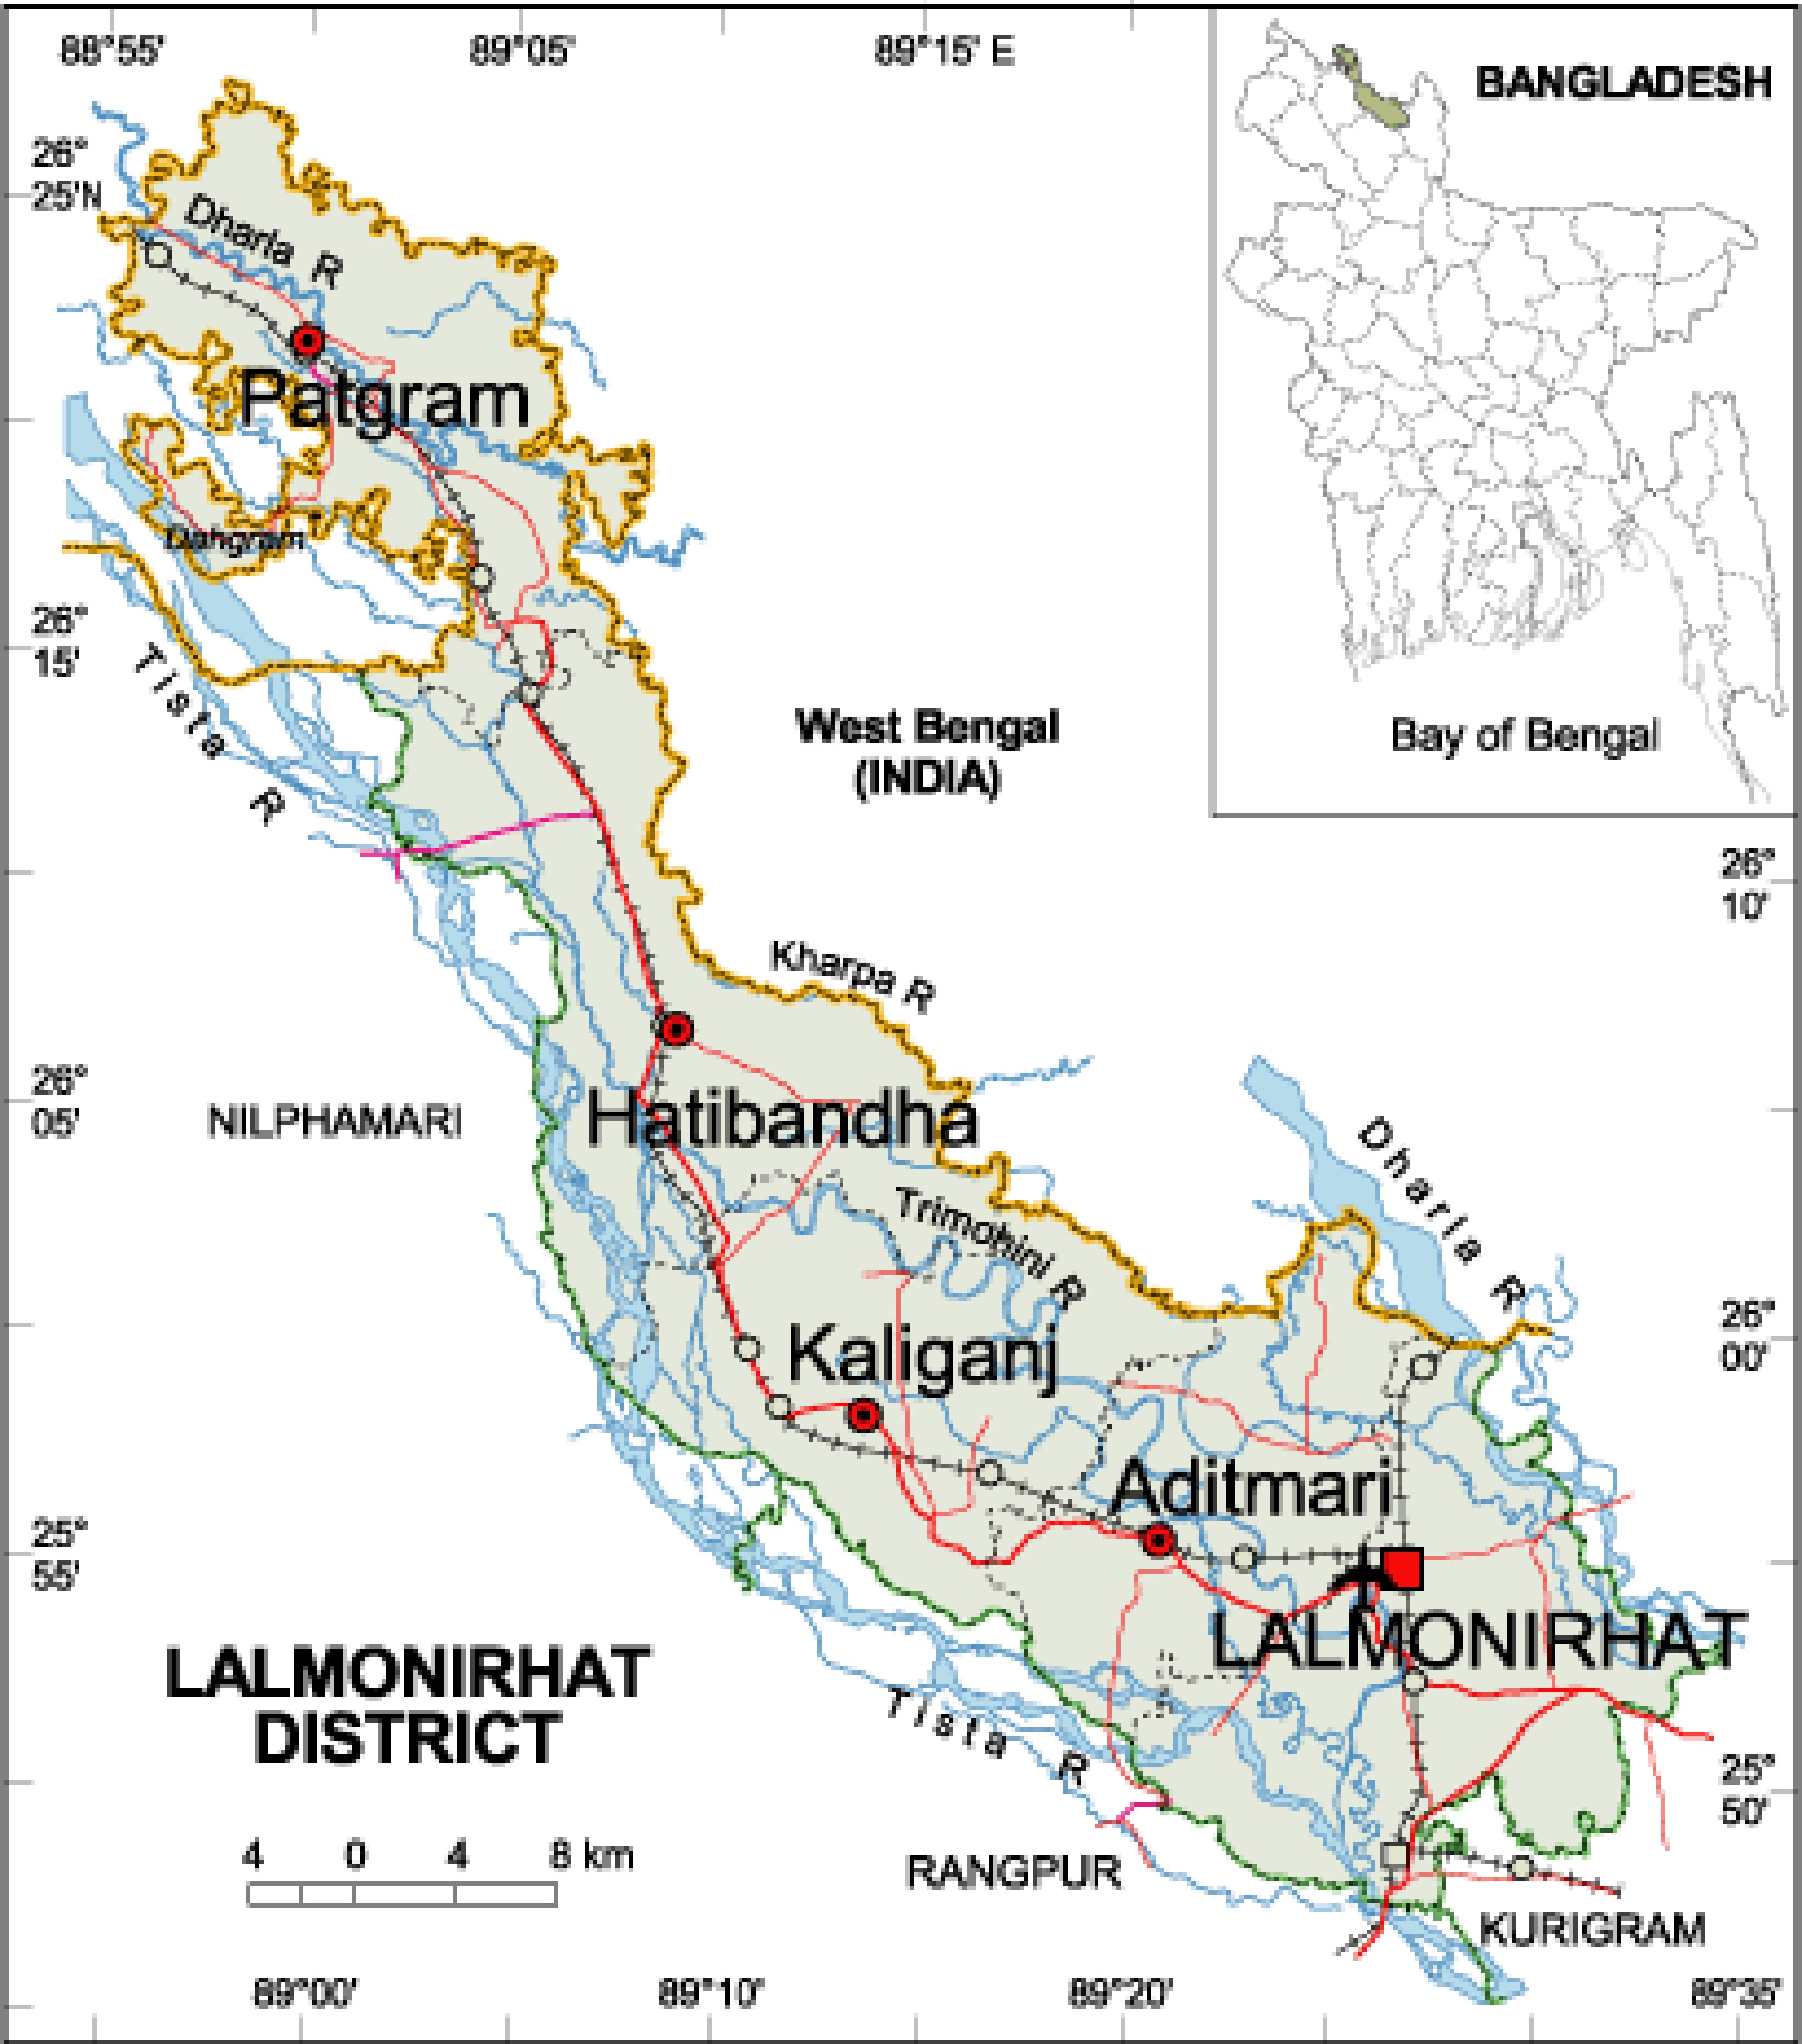
Figure 2.
District map of Lalmonirhat. Map source: Office of Dinajpur Sadar Upazila (
www.bangla2000.com/bangladesh/Districts/lalmonirhat.shtm ). -
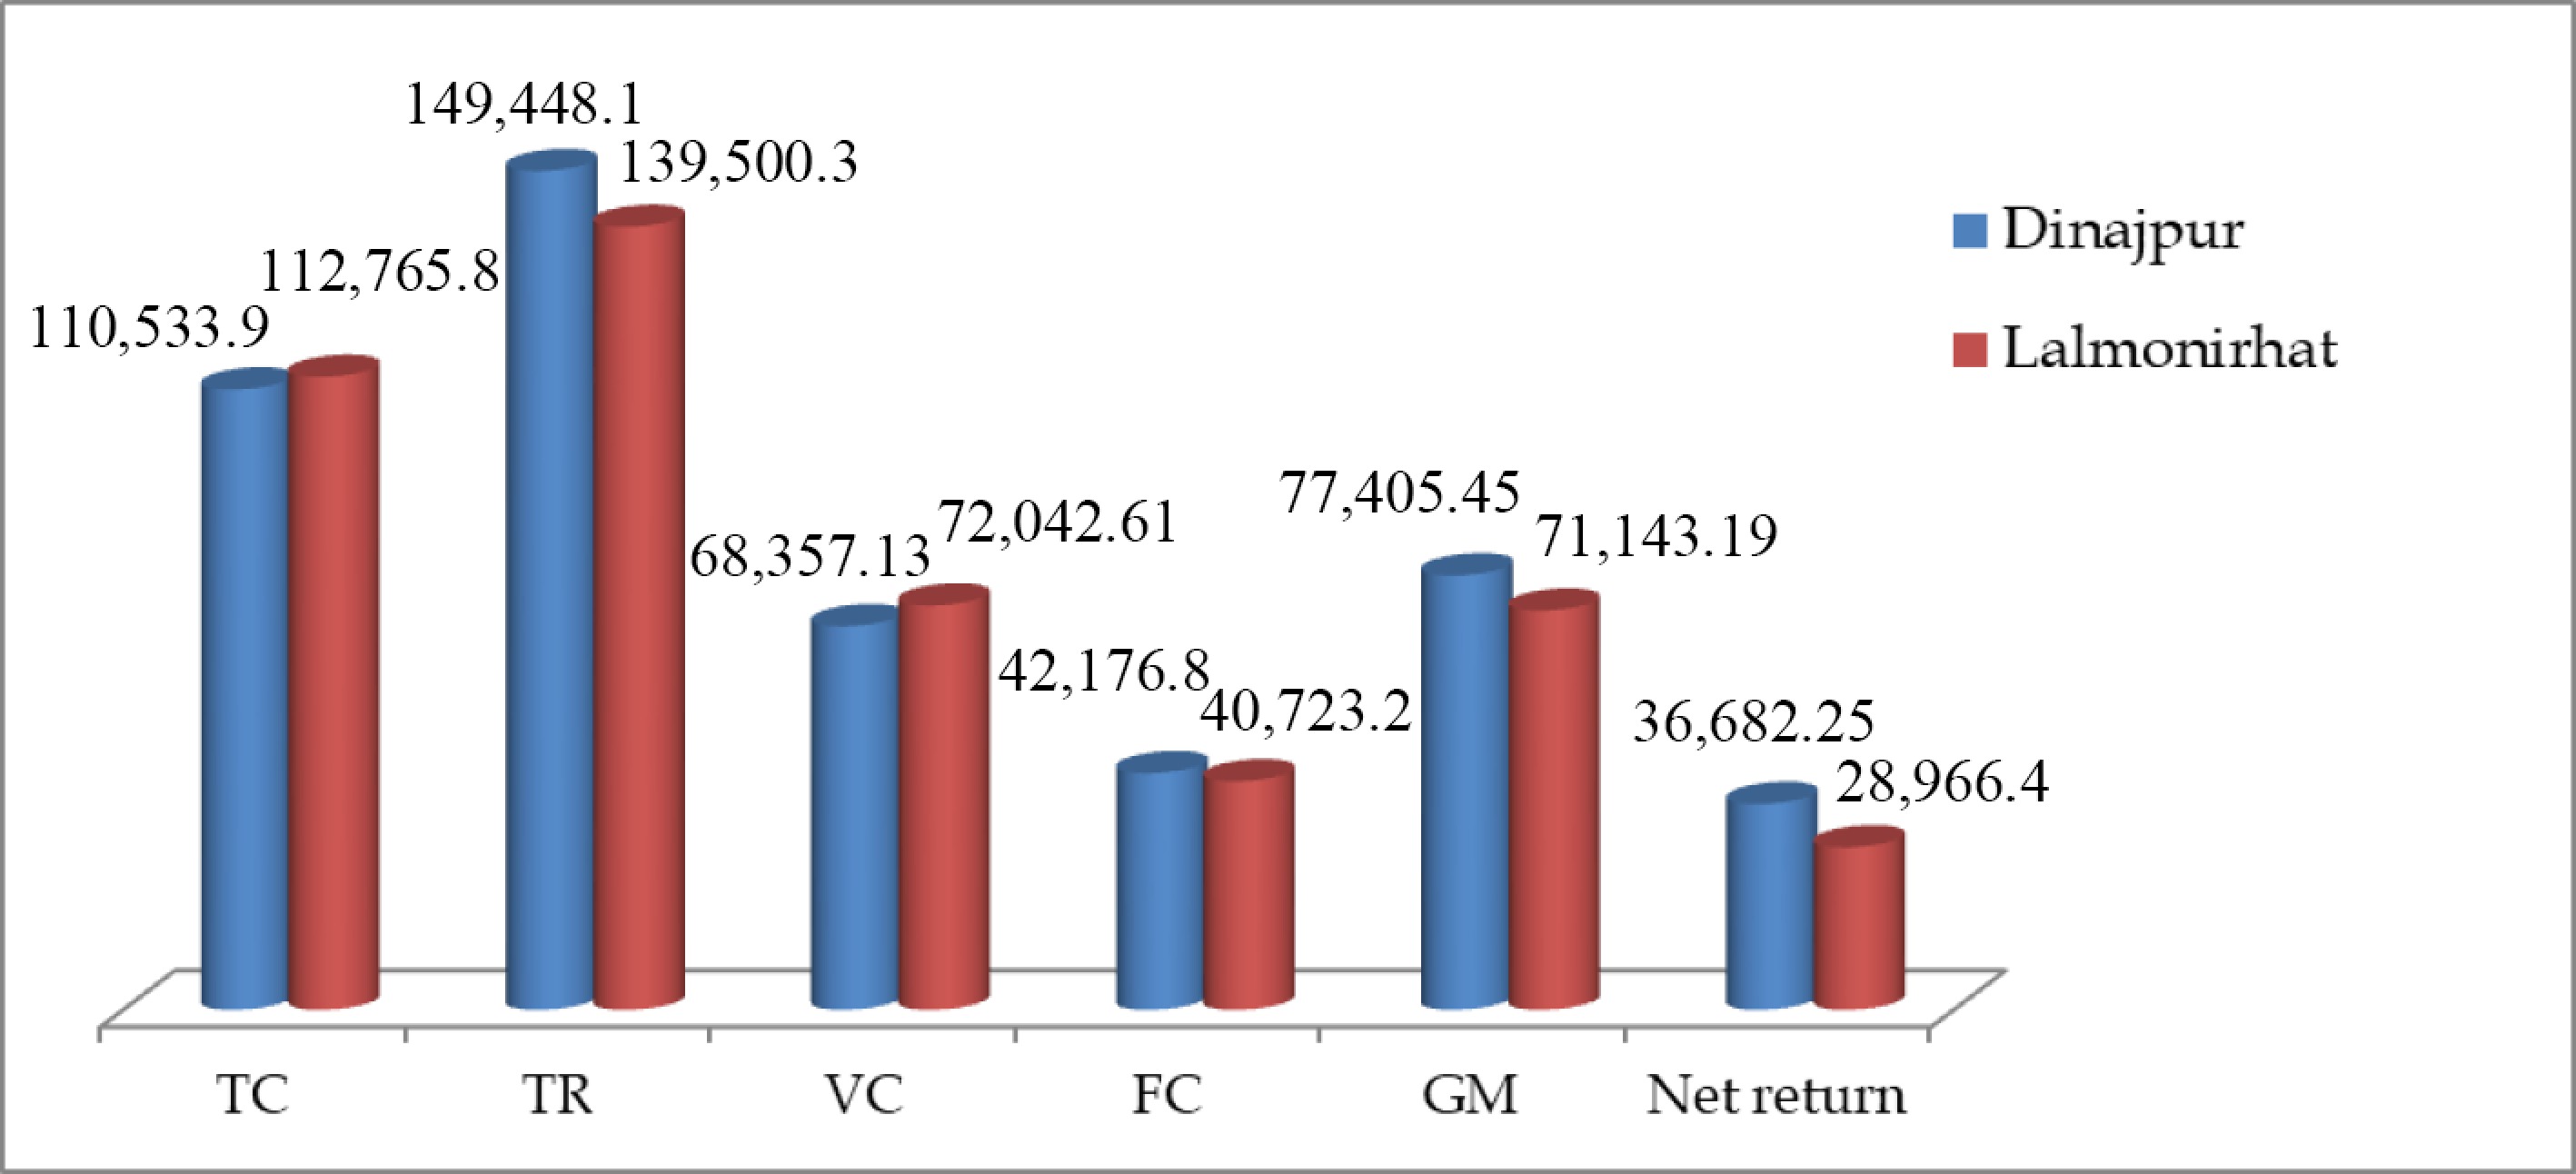
Figure 3.
TC, TR, VC, FC, GM, and net return of maize production of Dinajpur and Lalmonirhat district.
-
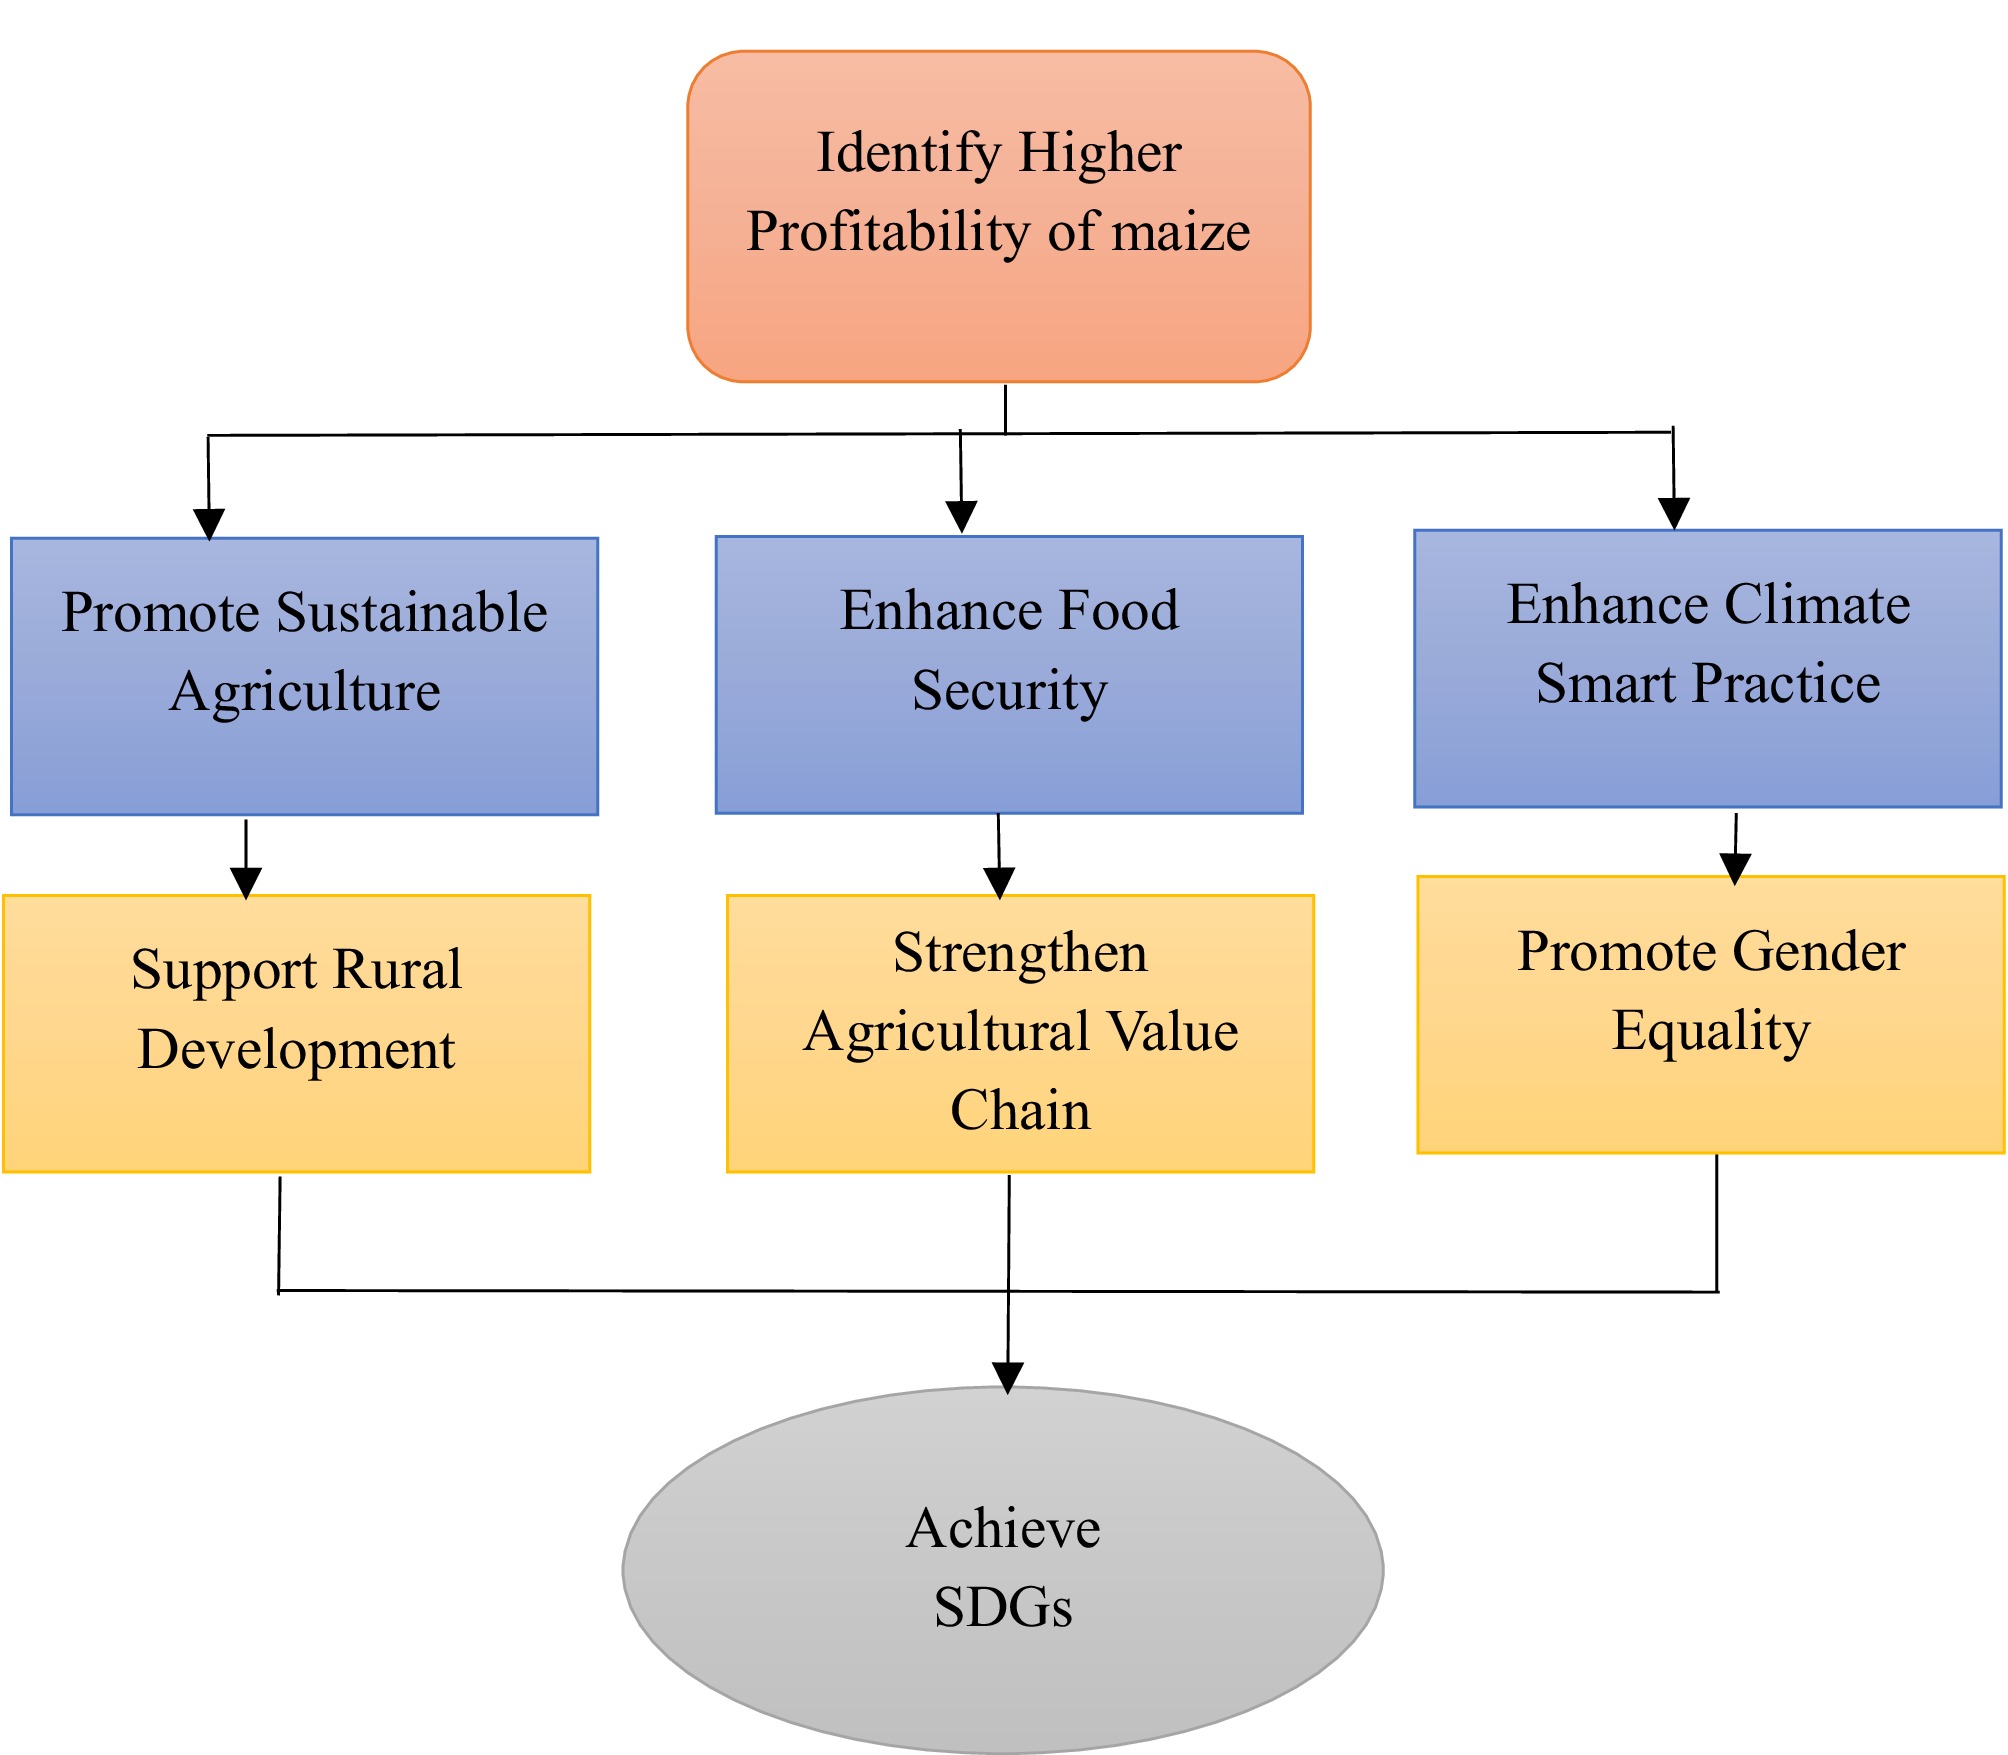
Figure 4.
Maize cultivation in the study areas.
-
Dinajpur Lalmonirhat Dinajpur sadar Birganj Kaharole Patgram Kaliganj Lalmonirhat sadar Korni Shahorgram Shundorpur Panbari Votmari Chinipara Chehelgaji Husnapara Mukundapara Kashbari Modati Lamuriharadi Shovra Madovbati Ramchandrapur Kani Chandrapur Harivanga Mohadebpur Pakura Kamur Baura Chaparhut Adorshapara Bochagonj Robipur Kantogir Kuchilbari Tush vander Foringer digi Source: Field survey, 2017. Table 1.
Study areas selected in the different districts.
-
Value range of BCR Generic interpretation BCR < 1 Investment option generates losses. BCR = 1 Investment option is neither profitable nor loss. BCR > 1 Investment option is profitable Source: Author Illustration 2017. The BCR is calculated by dividing the present value of benefits by that of costs and investments. Table 2.
BCR range interpretation.
-
Variable Boro rice (pooled sample) (n = 300) Maize (pooled sample) (n = 300) Lalmonirhat (n = 150) Dinajpur (n = 150) Freq % Freq % Freq % Freq % Age group of farmers (years) 15–45 185 61.5 176 58.67 97 64.67 79 52.67 46–60 81 24.3 84 28.00 29 19.33 55 36.67 Greater than 60 34 14.2 40 13.33 24 16 16 10.67 Educational level No formal education 77 25.7 127 42.4 102 68.1 25 16.7 Primary school 101 33.7 43 14.25 8 5.6 34 22.9 Middle school/JSC 61 20.3 92 30.55 20 13.2 72 47.9 SSC 38 12.7 27 9.00 14 9 14 9 Collage and above 23 7.7 12 3.85 6 4.2 5 3.5 Number of plot One plot 144 48.0 215 71.55 103 68.8 111 74.3 More than one plot 156 52.0 85 28.45 47 31.2 39 25.7 Association membership No 191 63.7 203 67.7 96 63.9 107 71.5 Yes 109 36.3 97 32.3 54 36.1 43 28.5 Ready market last year No 288 96.0 58 19.45 31 20.8 27 18.1 Yes 12 4.0 242 80.55 119 79.2 123 81.9 Access to extension No 211 70.3 169 56.25 79 52.8 89 59.7 Yes 89 29.7 131 43.75 71 47.2 61 40.3 Access to credit No 244 81.3 244 81.25 121 80.6 123 81.9 Yes 46 15.3 56 18.75 29 19.4 27 18.1 Access to good roads Tarred with potholes/rough and marshy 167 55.7 149 49.65 104 69.4 45 29.9 Tarred but not asphalt/rough and smooth 133 44.3 1151 50.35 46 30.6 105 70.1 Source: Field Survey, 2022. Table 3.
Characteristics of boro rice and maize farmers.
-
Indices variables selected Boro rice (pooled sample) n = 300 Maize (pooled sample) n = 300 Lalmonirhat (n = 150) Dinajpur (n = 150) Min Ma M SD Min Ma M SD Min Ma M SD Min Ma M SD Farmer's age (years) 15 75 49.25 9.21 15 75 49.34 11.61 19 75 46.22 14.33 18 69 52.45 11.7 Education (years) 0 18 4.23 3.12 0 19 5.54 4.97 0 15 3.97 6.03 1 16 7.1 3.86 Experience (years) 3 56 22.11 12.47 1 17 6.10 10.83 1 17 7.11 13.34 1 13 5.09 10.37 Farm size (ha) 0.1 9 0.74 8.1 0.2 11 2.36 12.71 0.2 9 2.74 1.7 0.3 11 1.97 4.73 Number of farm plots 0.7 7 1.78 1.34 0.4 15 1.43 2.16 0.5 15 1.54 0.73 0.4 10 1.31 4.12 Extension visits 0 19 3.44 4.33 0 4 2.16 4.83 0 3 1.45 1.48 0 5 2.87 3.71 Size of household 2 12 5.47 4.11 3 9 5.18 4.71 4 8 5.33 6.49 3 9 5.02 5.09 Table 4.
Descriptive statistics of farmers' characteristics.
-
Particular variables selected Boro rice (pooled sample) n = 300 Maize (pooled sample) n = 300 Lalmonirhat (n = 150) Dinajpur (n = 150) Freq % Freq % Freq % Freq % Fertilizer use No 0 0 62 20.66 29 19.4 33 22.2 Yes 300 100 238 79.33 121 80.6 117 77.8 Pesticide use No 130 43.4 287 95.66 144 95.8 143 95.1 Yes 170 56.6 13 4.33 6 4.2 7 4.9 Seed variety used Traditional 7 2.34 195 65 86 57.6 109 72.9 Improved 293 97.66 105 35 64 42.4 41 27.1 Manure use No 262 87.37 293 97.66 148 98.6 145 96.5 Yes 38 12.63 7 2.33 2 1.4 5 3.5 Farmer ensured zero tillage No 300 100 214 71.33 103 68.8 111 74.3 Yes 0 0 86 28.66 47 31.2 39 25.7 Choice of technologies No use 3 1.11 68 22.66 28 19.11 40 26.44 Improved seed 181 60.2 51 17 21 14.05 30 20.22 Fertilizer and row planting 109 36.46 164 54.66 95 63.34 69 45.8 All technologies 7 2.23 17 5.66 6 3.5 11 7.54 Table 5.
Distribution of boro rice and maize farmers according to technology used.
-
Variable Boro rice (pooled sample) n = 300 Maize (pooled sample) n = 300 Lalmonirhat (n = 150) Dinajpur (n = 150) Variable cost (A) Seedling 5,111.04 8,889.05 9,089.79 8,688.31 Urea 3,733.9 5,531.21 5,506.6 5,556.42 TSP 3,556.44 5,151.7 5,046.7 5,256.7 MP 2,708.14 3,044.82 2,922.71 3,166.93 Power tiller 6,698.5 6,017.75 6,758.4 5,385.09 Irrigation 16,986.7 5,121.7 5,381.7 4,861.68 Insecticides 4,513.12 3,492.22 3,767.61 3,216.83 Manure 2,594.8 2,519.38 2,624.12 2,414.64 Labor cost 40,183.17 30,377.75 30,944.98 29,810.53 Total variable cost (A) 86,084.92 70,199.9 72,042.61 68,357.13 Fixed cost Land use cost 37,607.17 36,185 35,320 37,050 Interest on operating capital 5034.2 5,265 5,403.2 5,126.8 Total fixed cost (B) 42,641.37 41,450 40,723.2 42,176.8 Total cost (A + B) 128,726.3 111,649.9 112,765.8 110,533.9 Variable cost: variable cost refers to the costs of production that change according to the level of output or size of farming activity. Total variable cost is the total expenditure on all variable inputs used in agricultural production during a given period. Fixed cost refers to the costs of agricultural production that do not change with the level of output in the short run. Total Fixed Cost (TFC) is the total expenditure on all fixed inputs used in agricultural production during a given period. Table 6.
Per hectare total variable cost of maize and boro-rice production (Tk/ha).
-
Variable Boro rice (pooled sample) n = 300 Maize (pooled sample) n = 300 Lalmonirhat (n = 150) Dinajpur (n = 150) Total return (TR) (Tk.) 136,540.5 144,474.2 139,500.3 149,448.1 Variable cost (VC) (Tk.) 85,305.93 70,199.87 68,357.13 720,42.61 Fixed cost (FC) (Tk.) 41,717.94 41,450 42,176.8 40,723.2 Gross margin (TR-VC) (Tk.) 51,234.52 74,274.32 71,143.19 77,405.45 Net return TR-(VC+FC) 9,516.6 32,824.33 28,966.4 36,682.25 BCR (full cost basis) 1.07 1.3 1.26 1.33 BCR (variable cost basis) 1.60 2.06 2.04 2.07 Source: Field survey, 2022. Table 7.
TR, GM, net profit, and BCR of maize and boro-rice (Tk/ha) in the study areas.
Figures
(4)
Tables
(7)