-
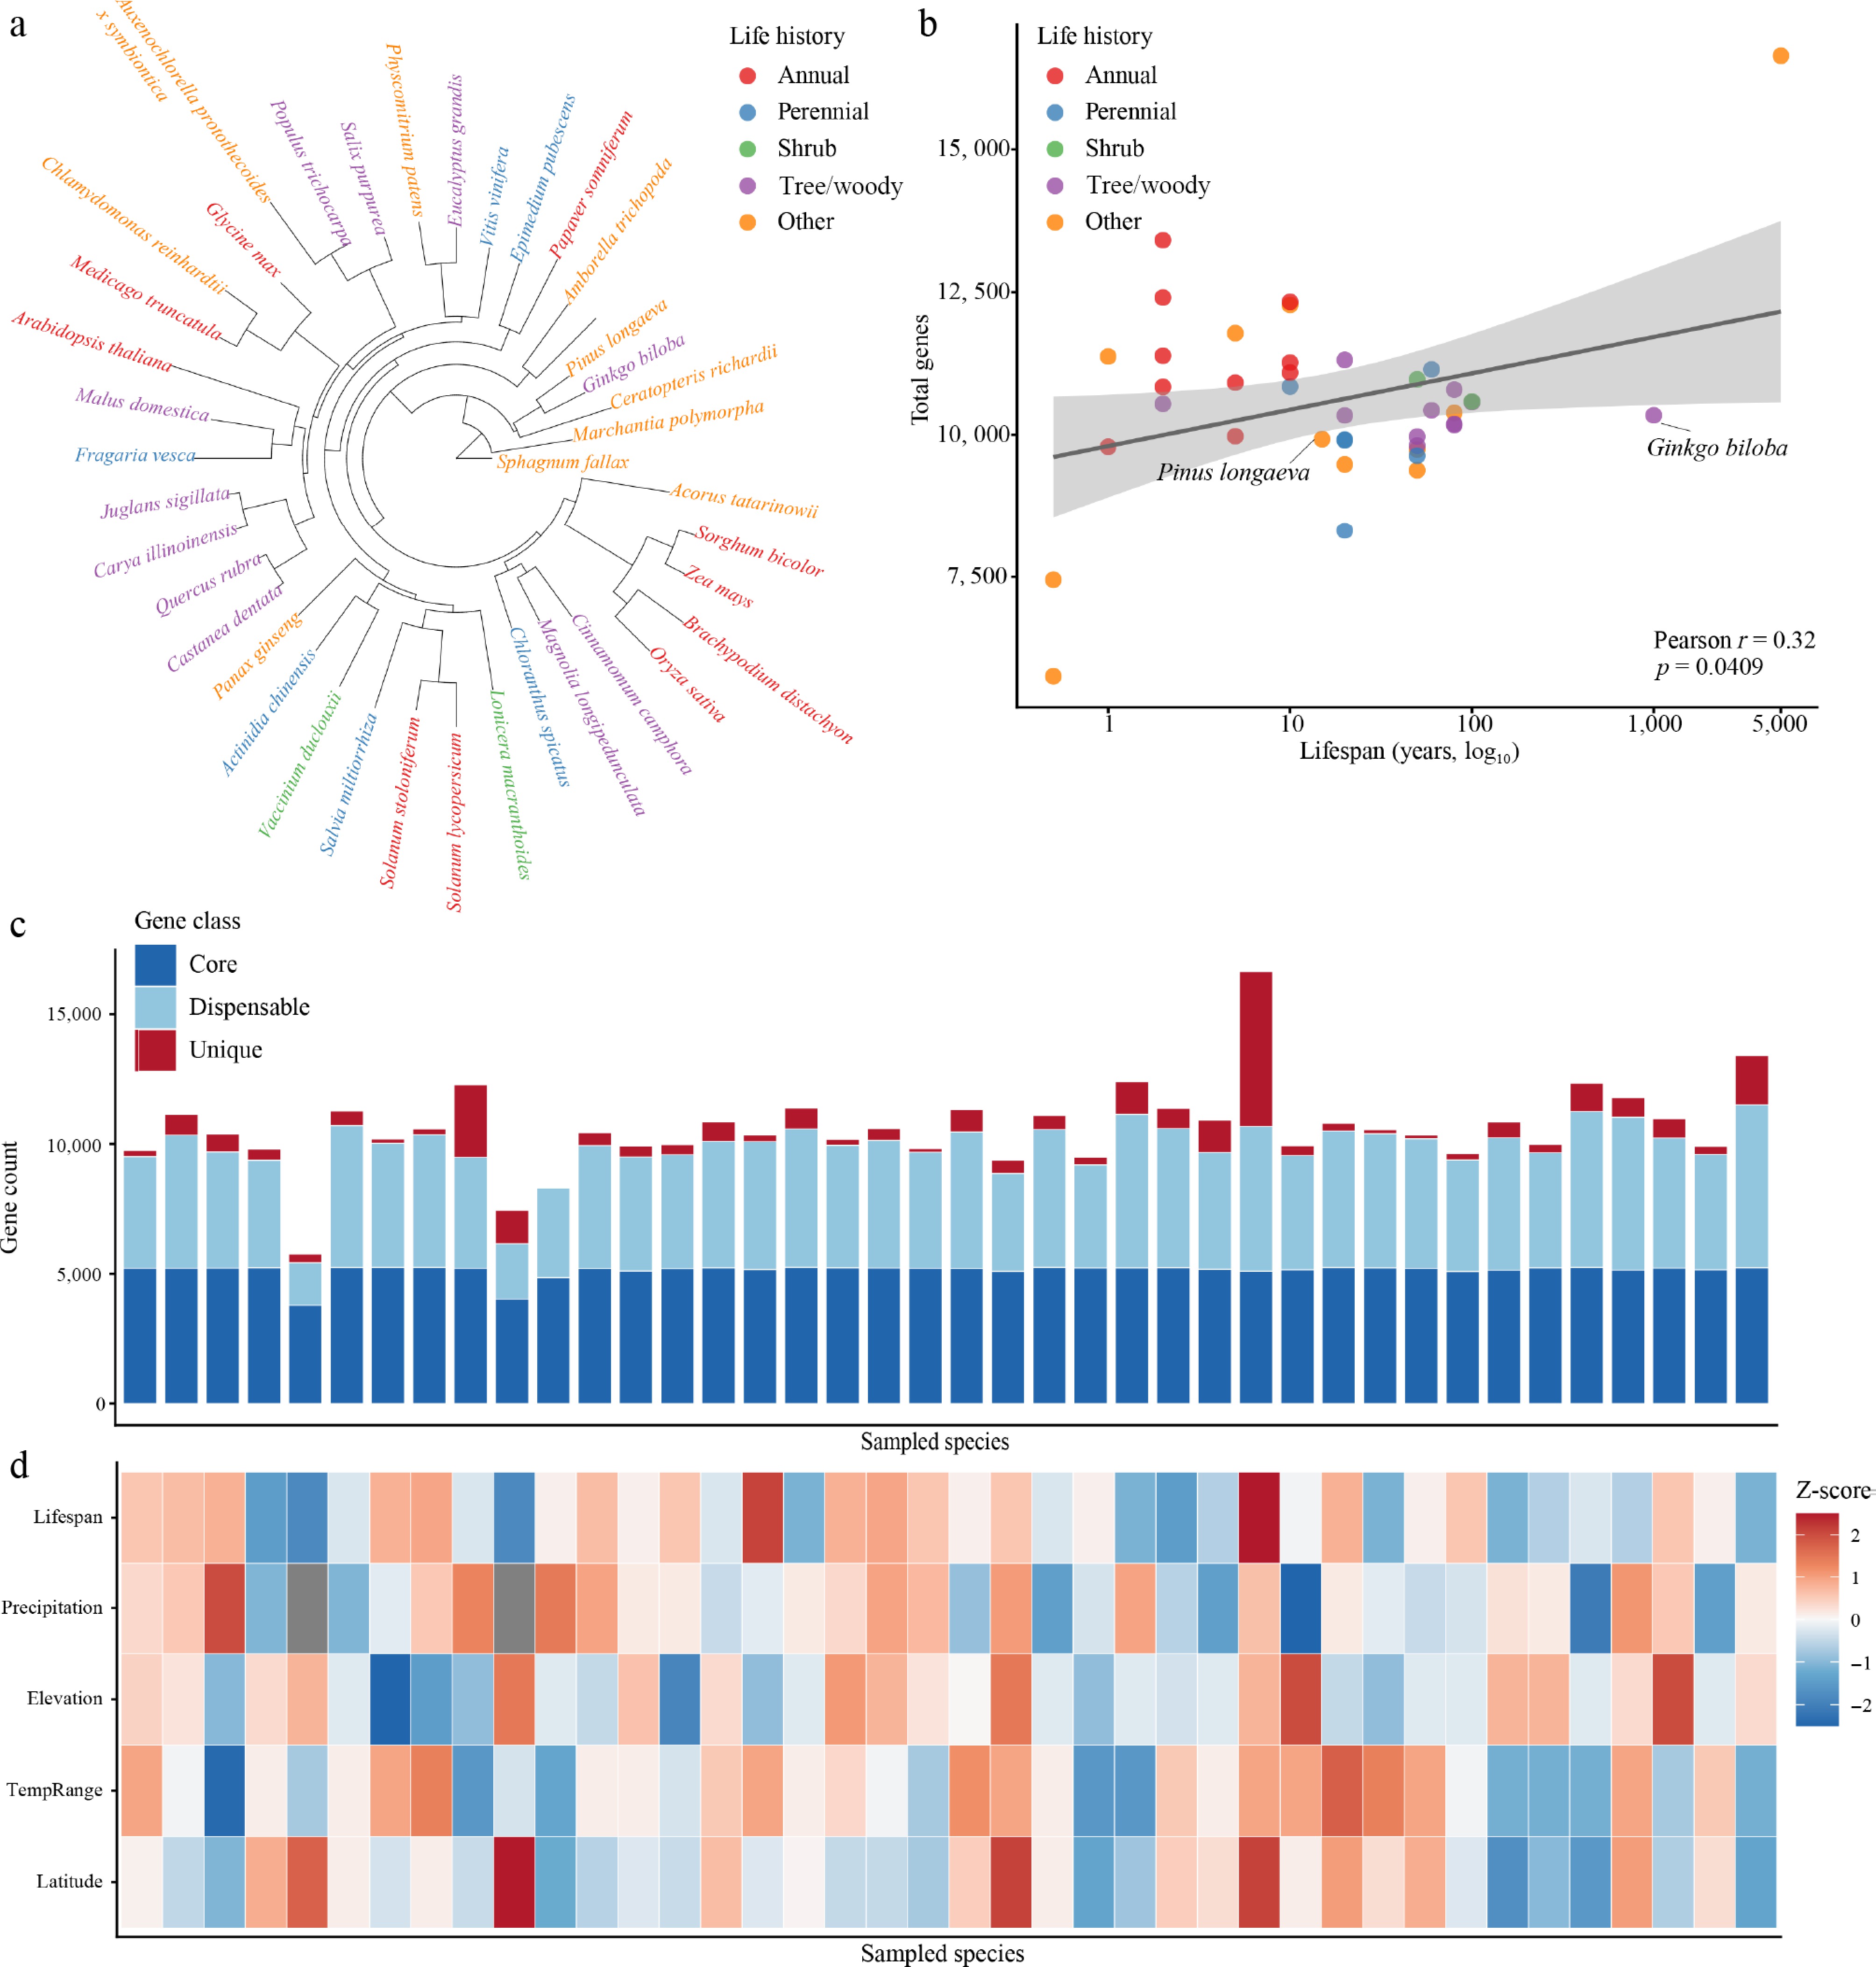
Figure 1.
Phylogenetic distribution, lifespan-associated variation, and gene repertoire composition across the sampled plant species. (a) Circular phylogenetic tree showing the evolutionary relationships among the sampled species. Tip-label colors represent major life-history categories: annual, perennial, shrub, tree/woody, and other, as indicated in the legend. (b) Relationship between species lifespan and total gene number. Lifespan is plotted on a log10-transformed scale, and point colors indicate life-history categories. The fitted linear regression line is shown in dark gray, with the corresponding 95% confidence interval shown as a gray band. (c) Stacked bar plot showing the composition of gene repertoires in each sampled species. Each bar represents one sampled species. Gene families are classified as core, dispensable, or unique according to their distribution across the sampled species. (d) Heatmap showing standardized values (Z-scores) of lifespan and selected environmental variables for each sampled species. Each column corresponds to the same species order as in panel (c). Red indicates relatively high values, blue indicates relatively low values, and gray indicates missing data.
-
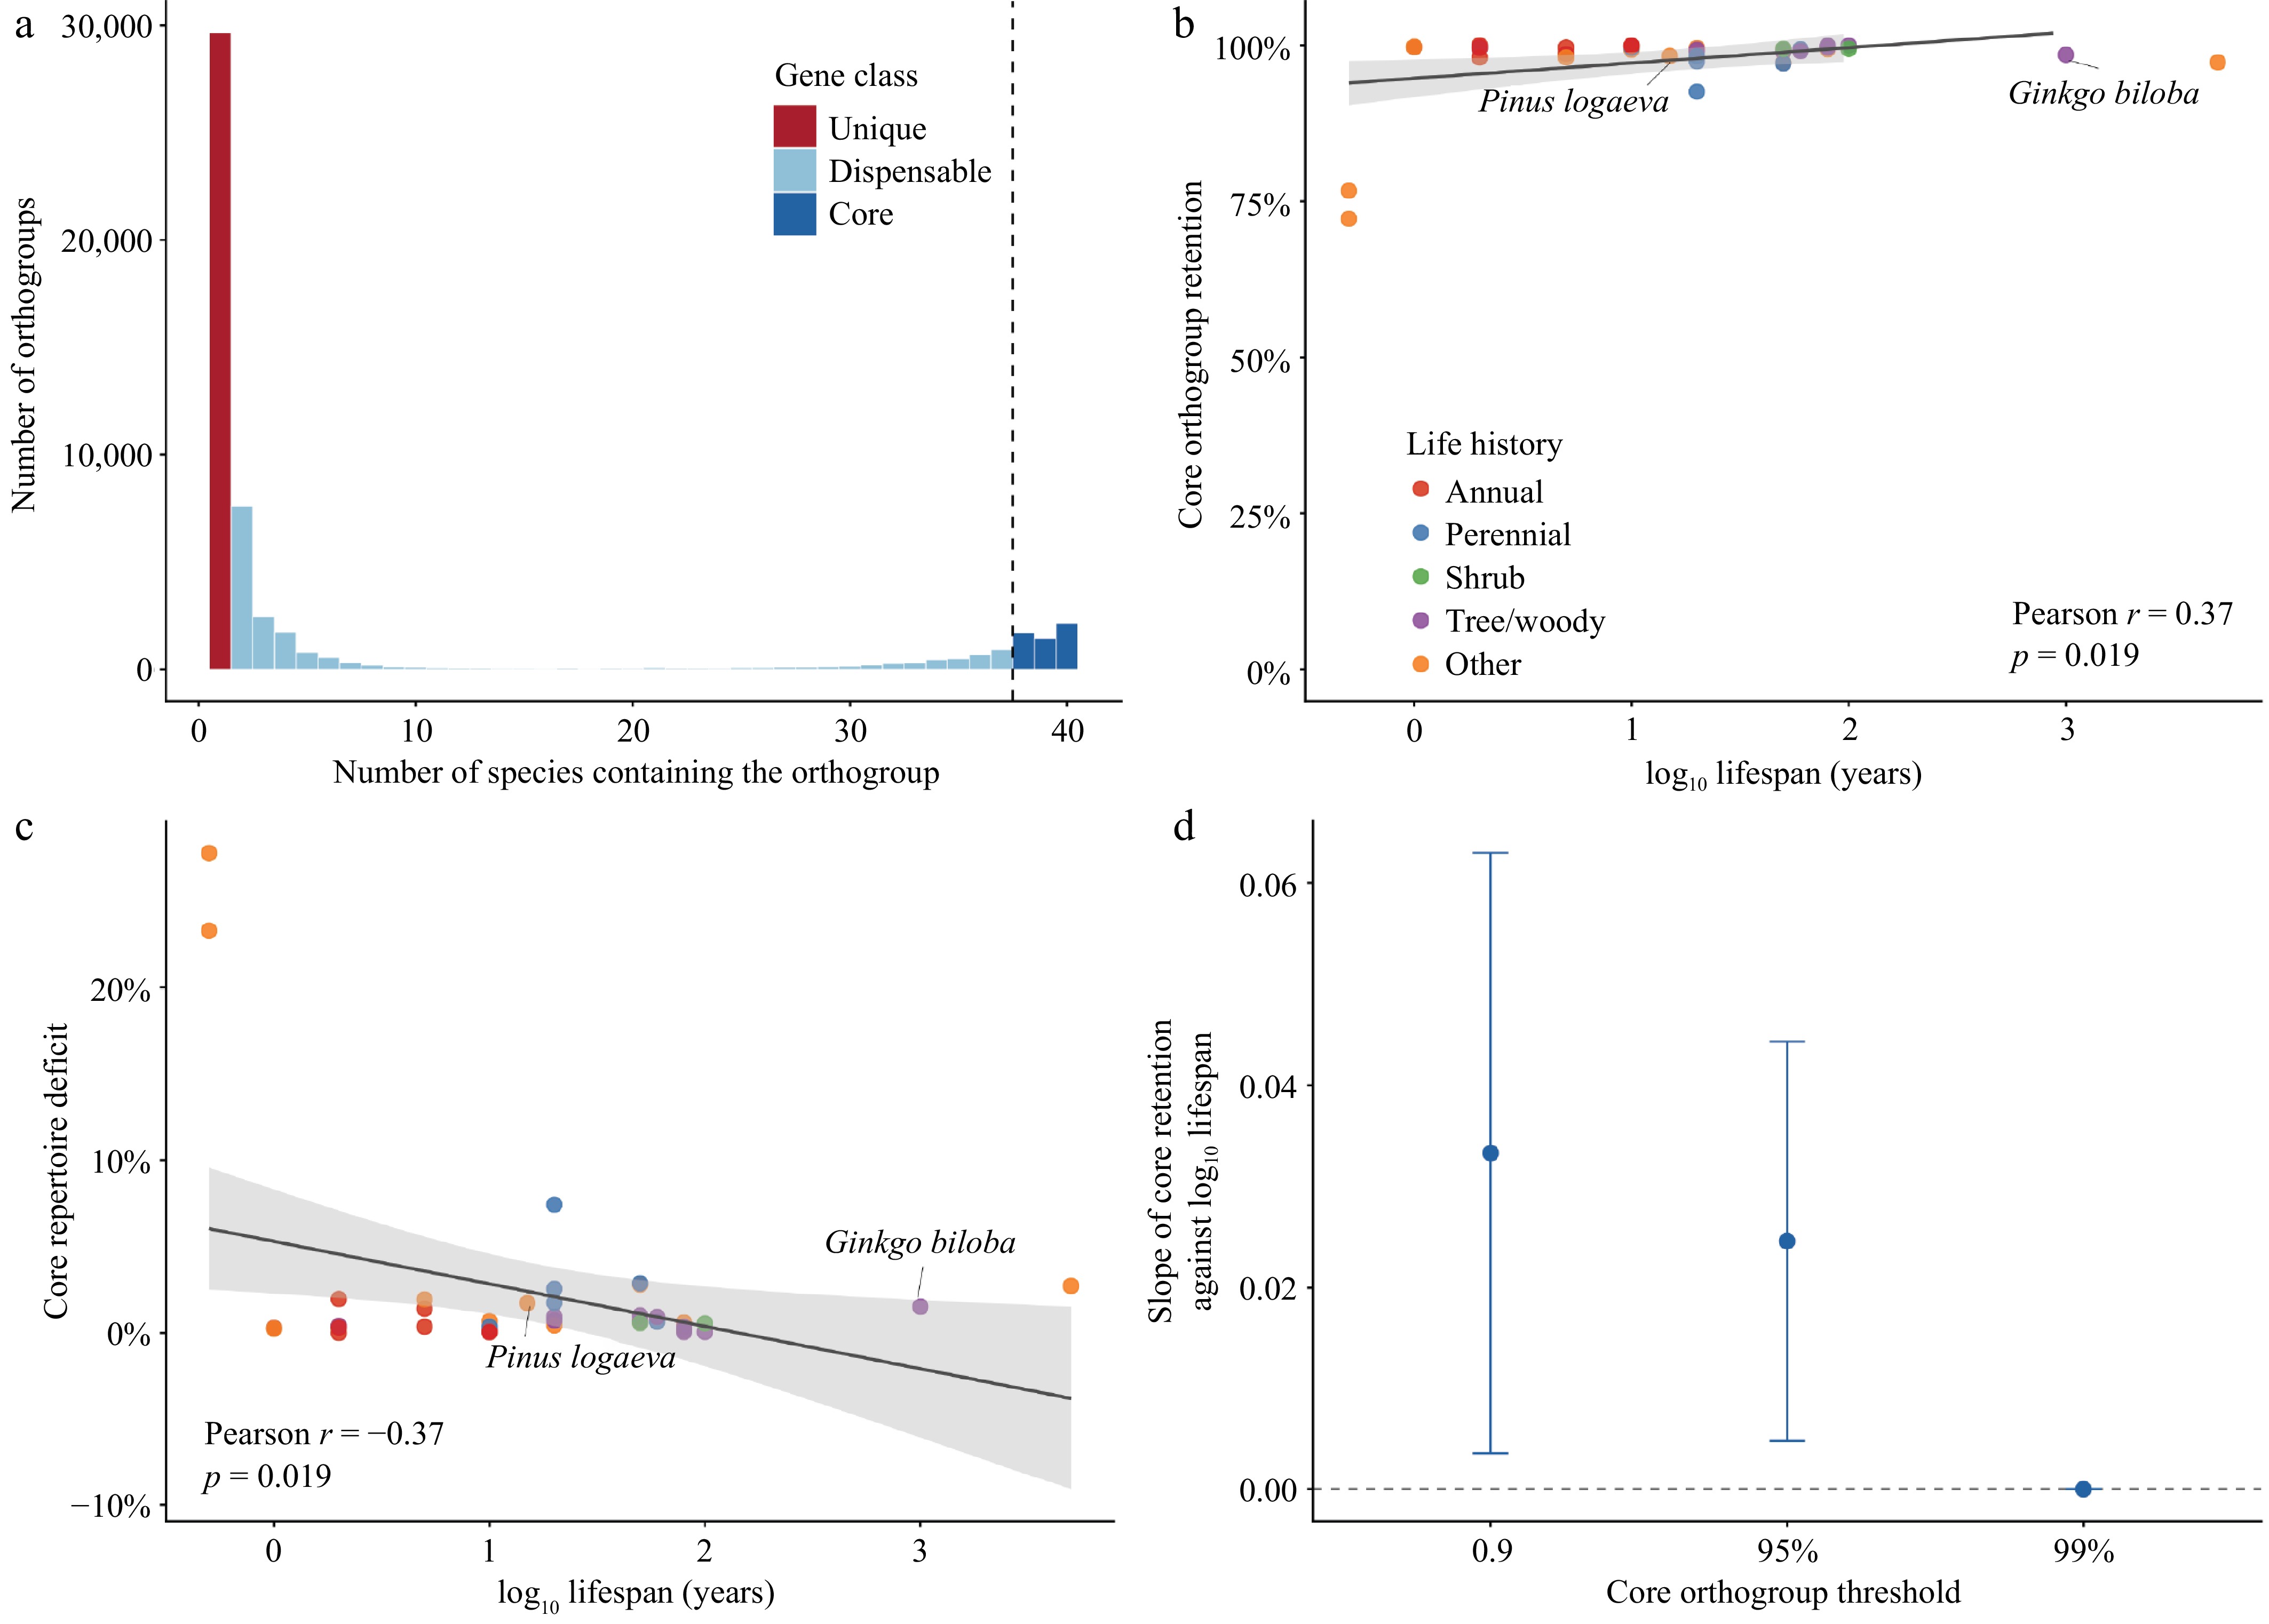
Figure 2.
Lifespan-associated stability of the core orthogroup repertoire across species. (a) Distribution of orthogroup occupancy across the 40 species included in the analysis. The dashed vertical line indicates the 95% core threshold. (b) Relationship between log10-transformed lifespan and core orthogroup retention. (c) Relationship between log10-transformed lifespan and core repertoire deficit. Core repertoire deficit was calculated as one minus core orthogroup retention. The solid line and shaded area represent the ordinary least-squares regression and its 95% confidence interval, respectively. (d) Sensitivity of the lifespan association to the definition of the core orthogroup set. Points show the regression slope relating core orthogroup retention to log10-transformed lifespan under core thresholds of 90%, 95%, and 99%. Error bars indicate 95% confidence intervals. The dashed horizontal line indicates a slope of zero. All analyses were based on the 40 species shared among the lifespan, species information, and orthogroup datasets.
-
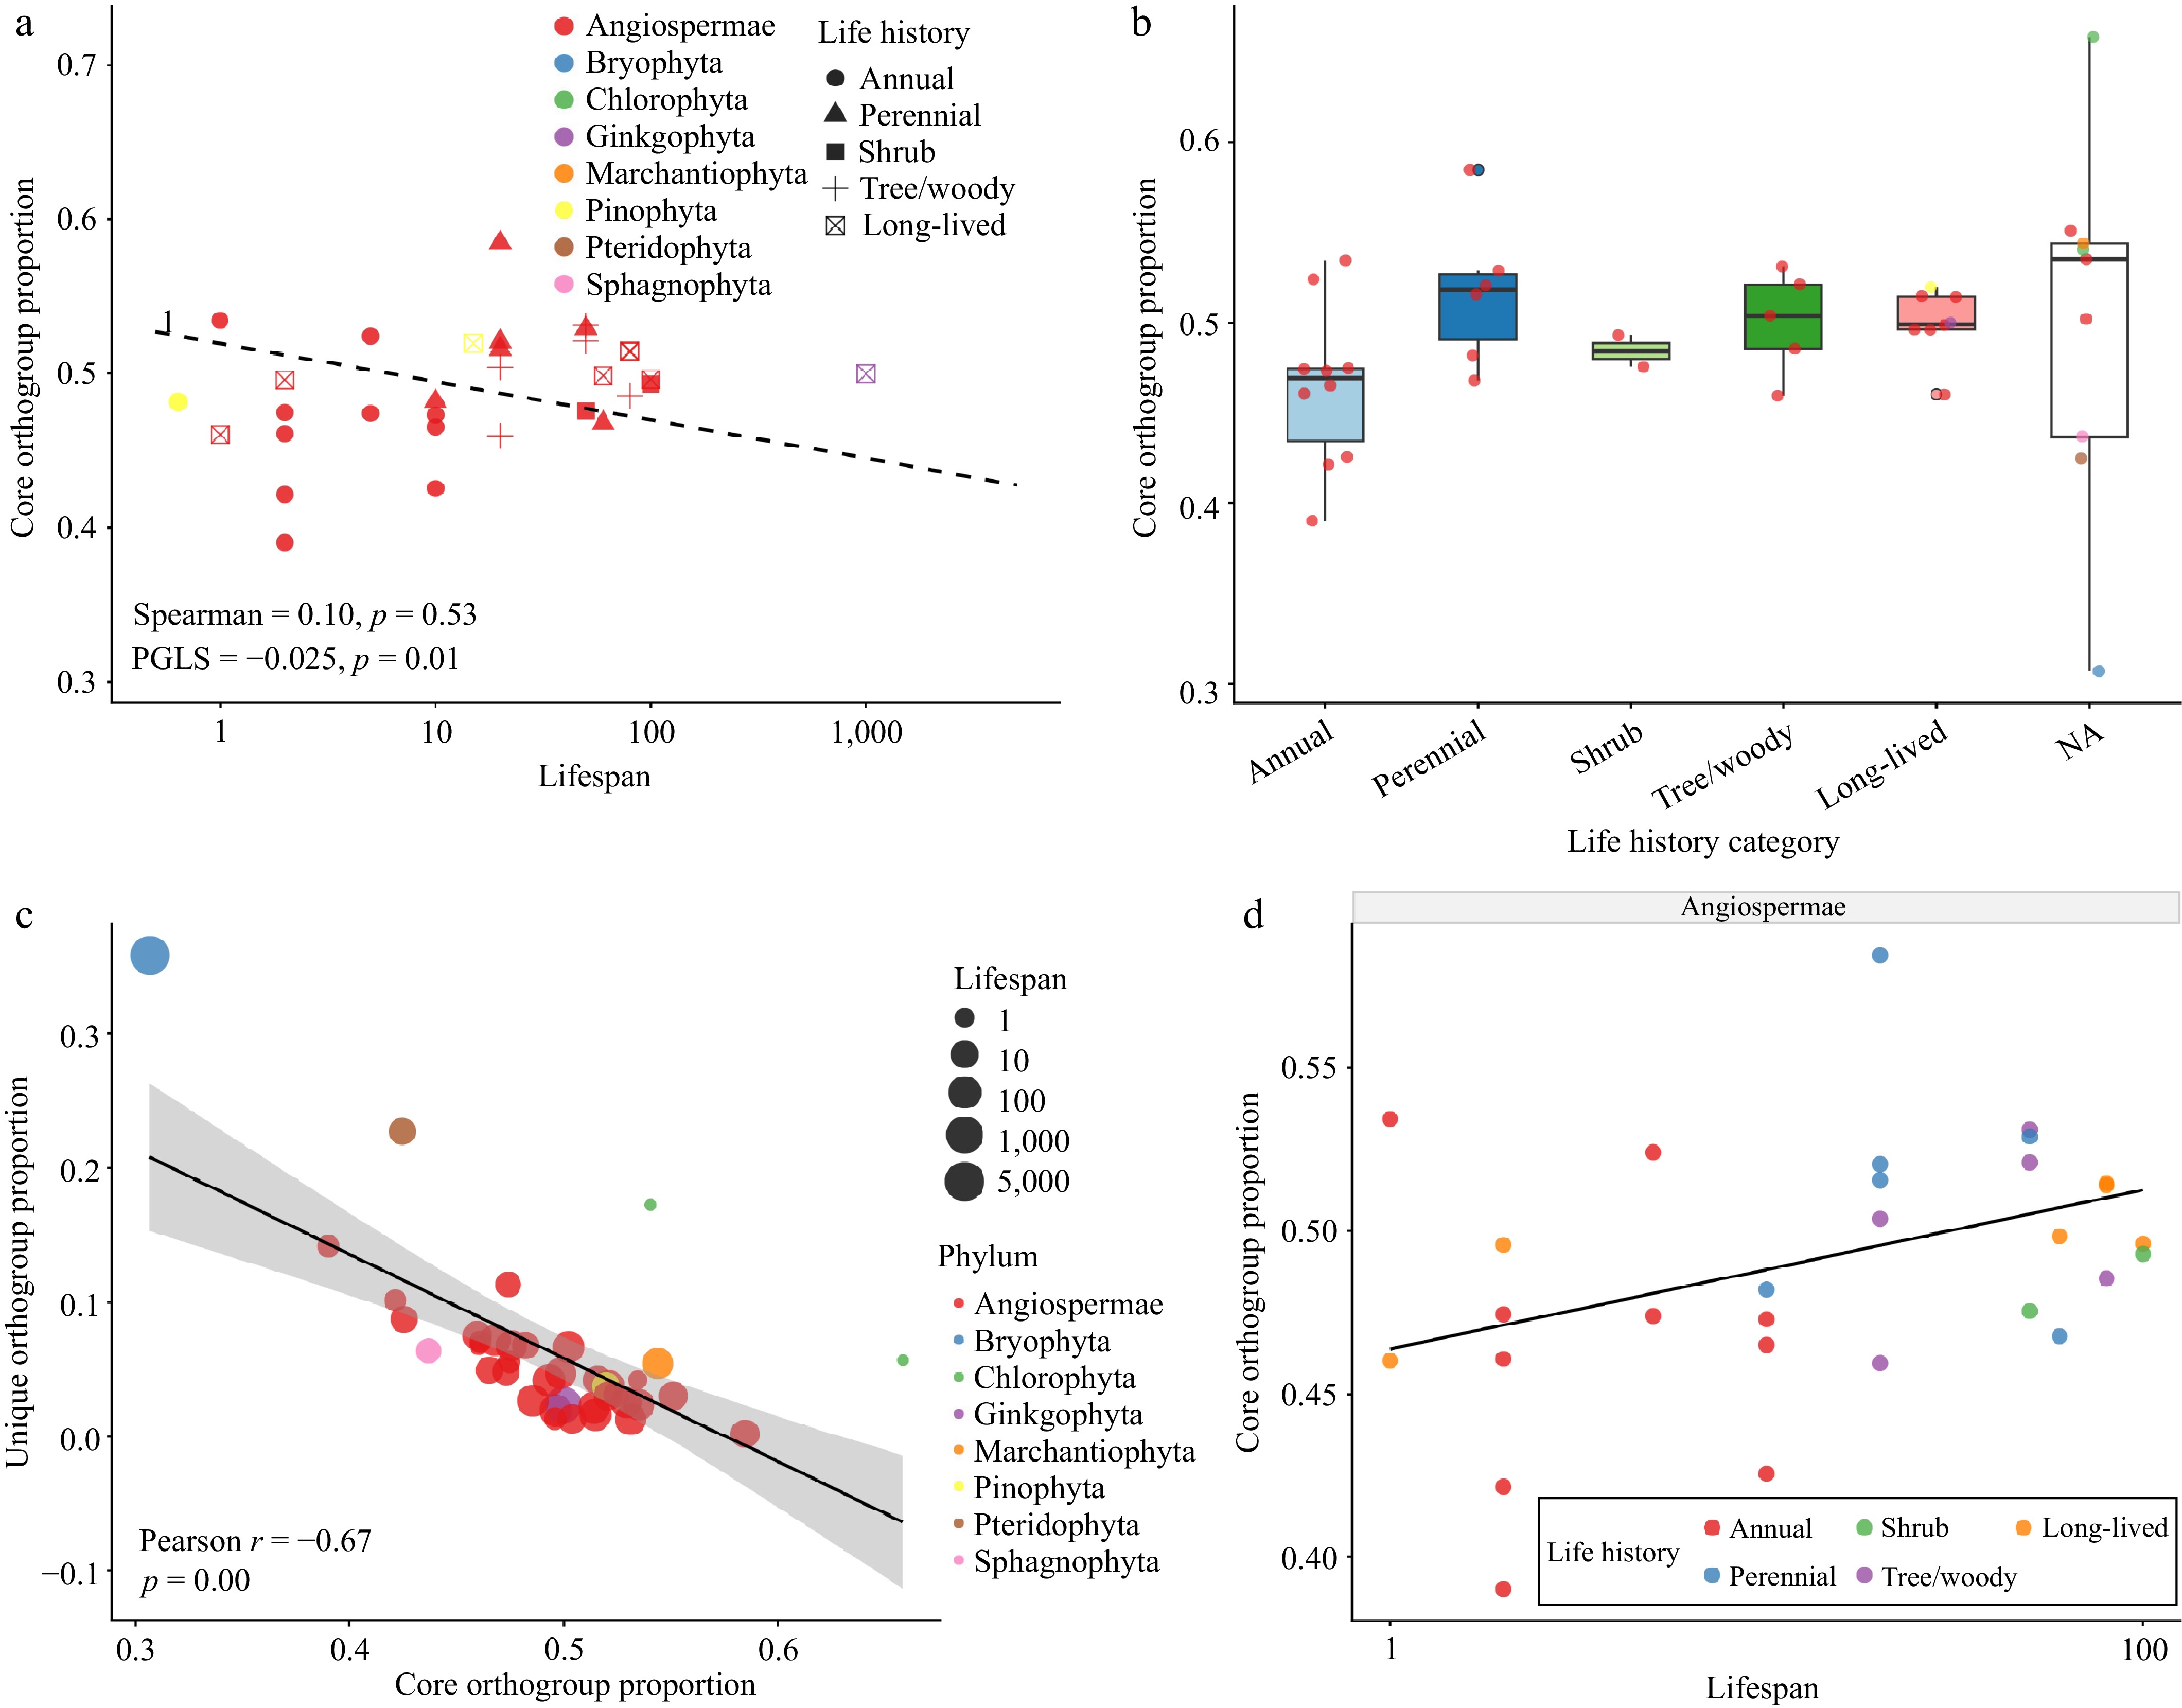
Figure 3.
Core orthogroup proportion in relation to plant lifespan and life history traits across taxonomic groups. (a) Scatter plot of core orthogroup proportion vs lifespan (log10 years), colored by phylum and shaped by growth form (shrub, tree/woody, long-lived). (b) Boxplot of core orthogroup proportion grouped by life history category (annual, perennial, shrub, tree/woody, long-lived, NA). (c) Scatter plot of unique orthogroup proportion vs core orthogroup proportion, with point size indicating lifespan (1–5,000 years) and color indicating phylum. Regression line with 95% CI shaded. (d) Scatter plot of core orthogroup proportion vs lifespan (log10 years) for Angiospermae only, colored by life history category (annual, perennial, shrub, tree/woody, long-lived).
-
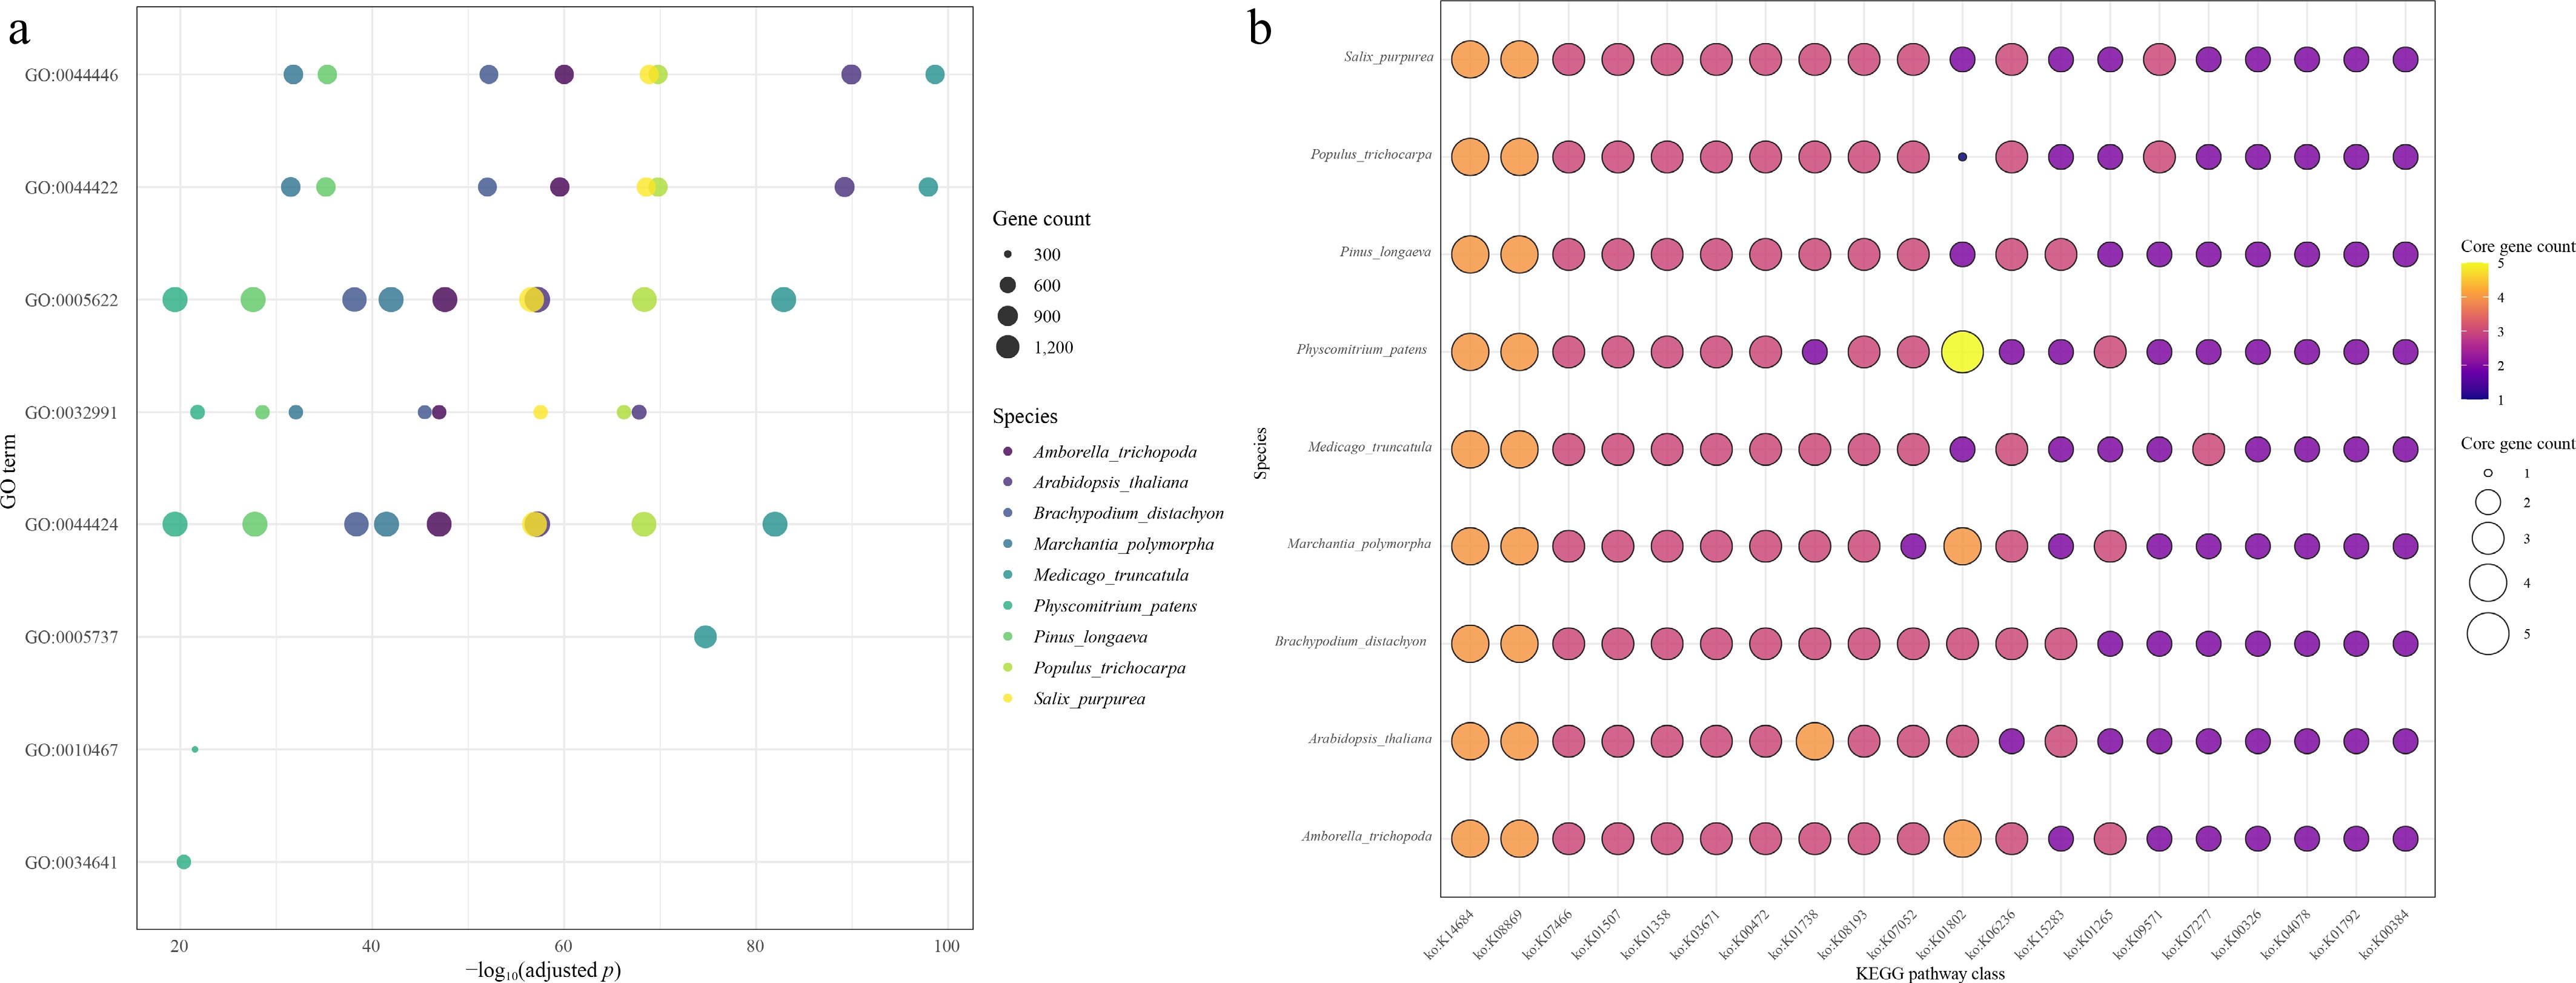
Figure 4.
Evolutionary dynamics of core genes across 40 land plants. (a) Enrichment analysis of core orthogroups (OGs) based on Gene Ontology (GO) terms. (b) Coverage of KEGG pathway classes by core orthogroups. Each bubble indicates the number of core genes associated with a specific KEGG pathway class (e.g., metabolism, genetic information processing) across species.
-
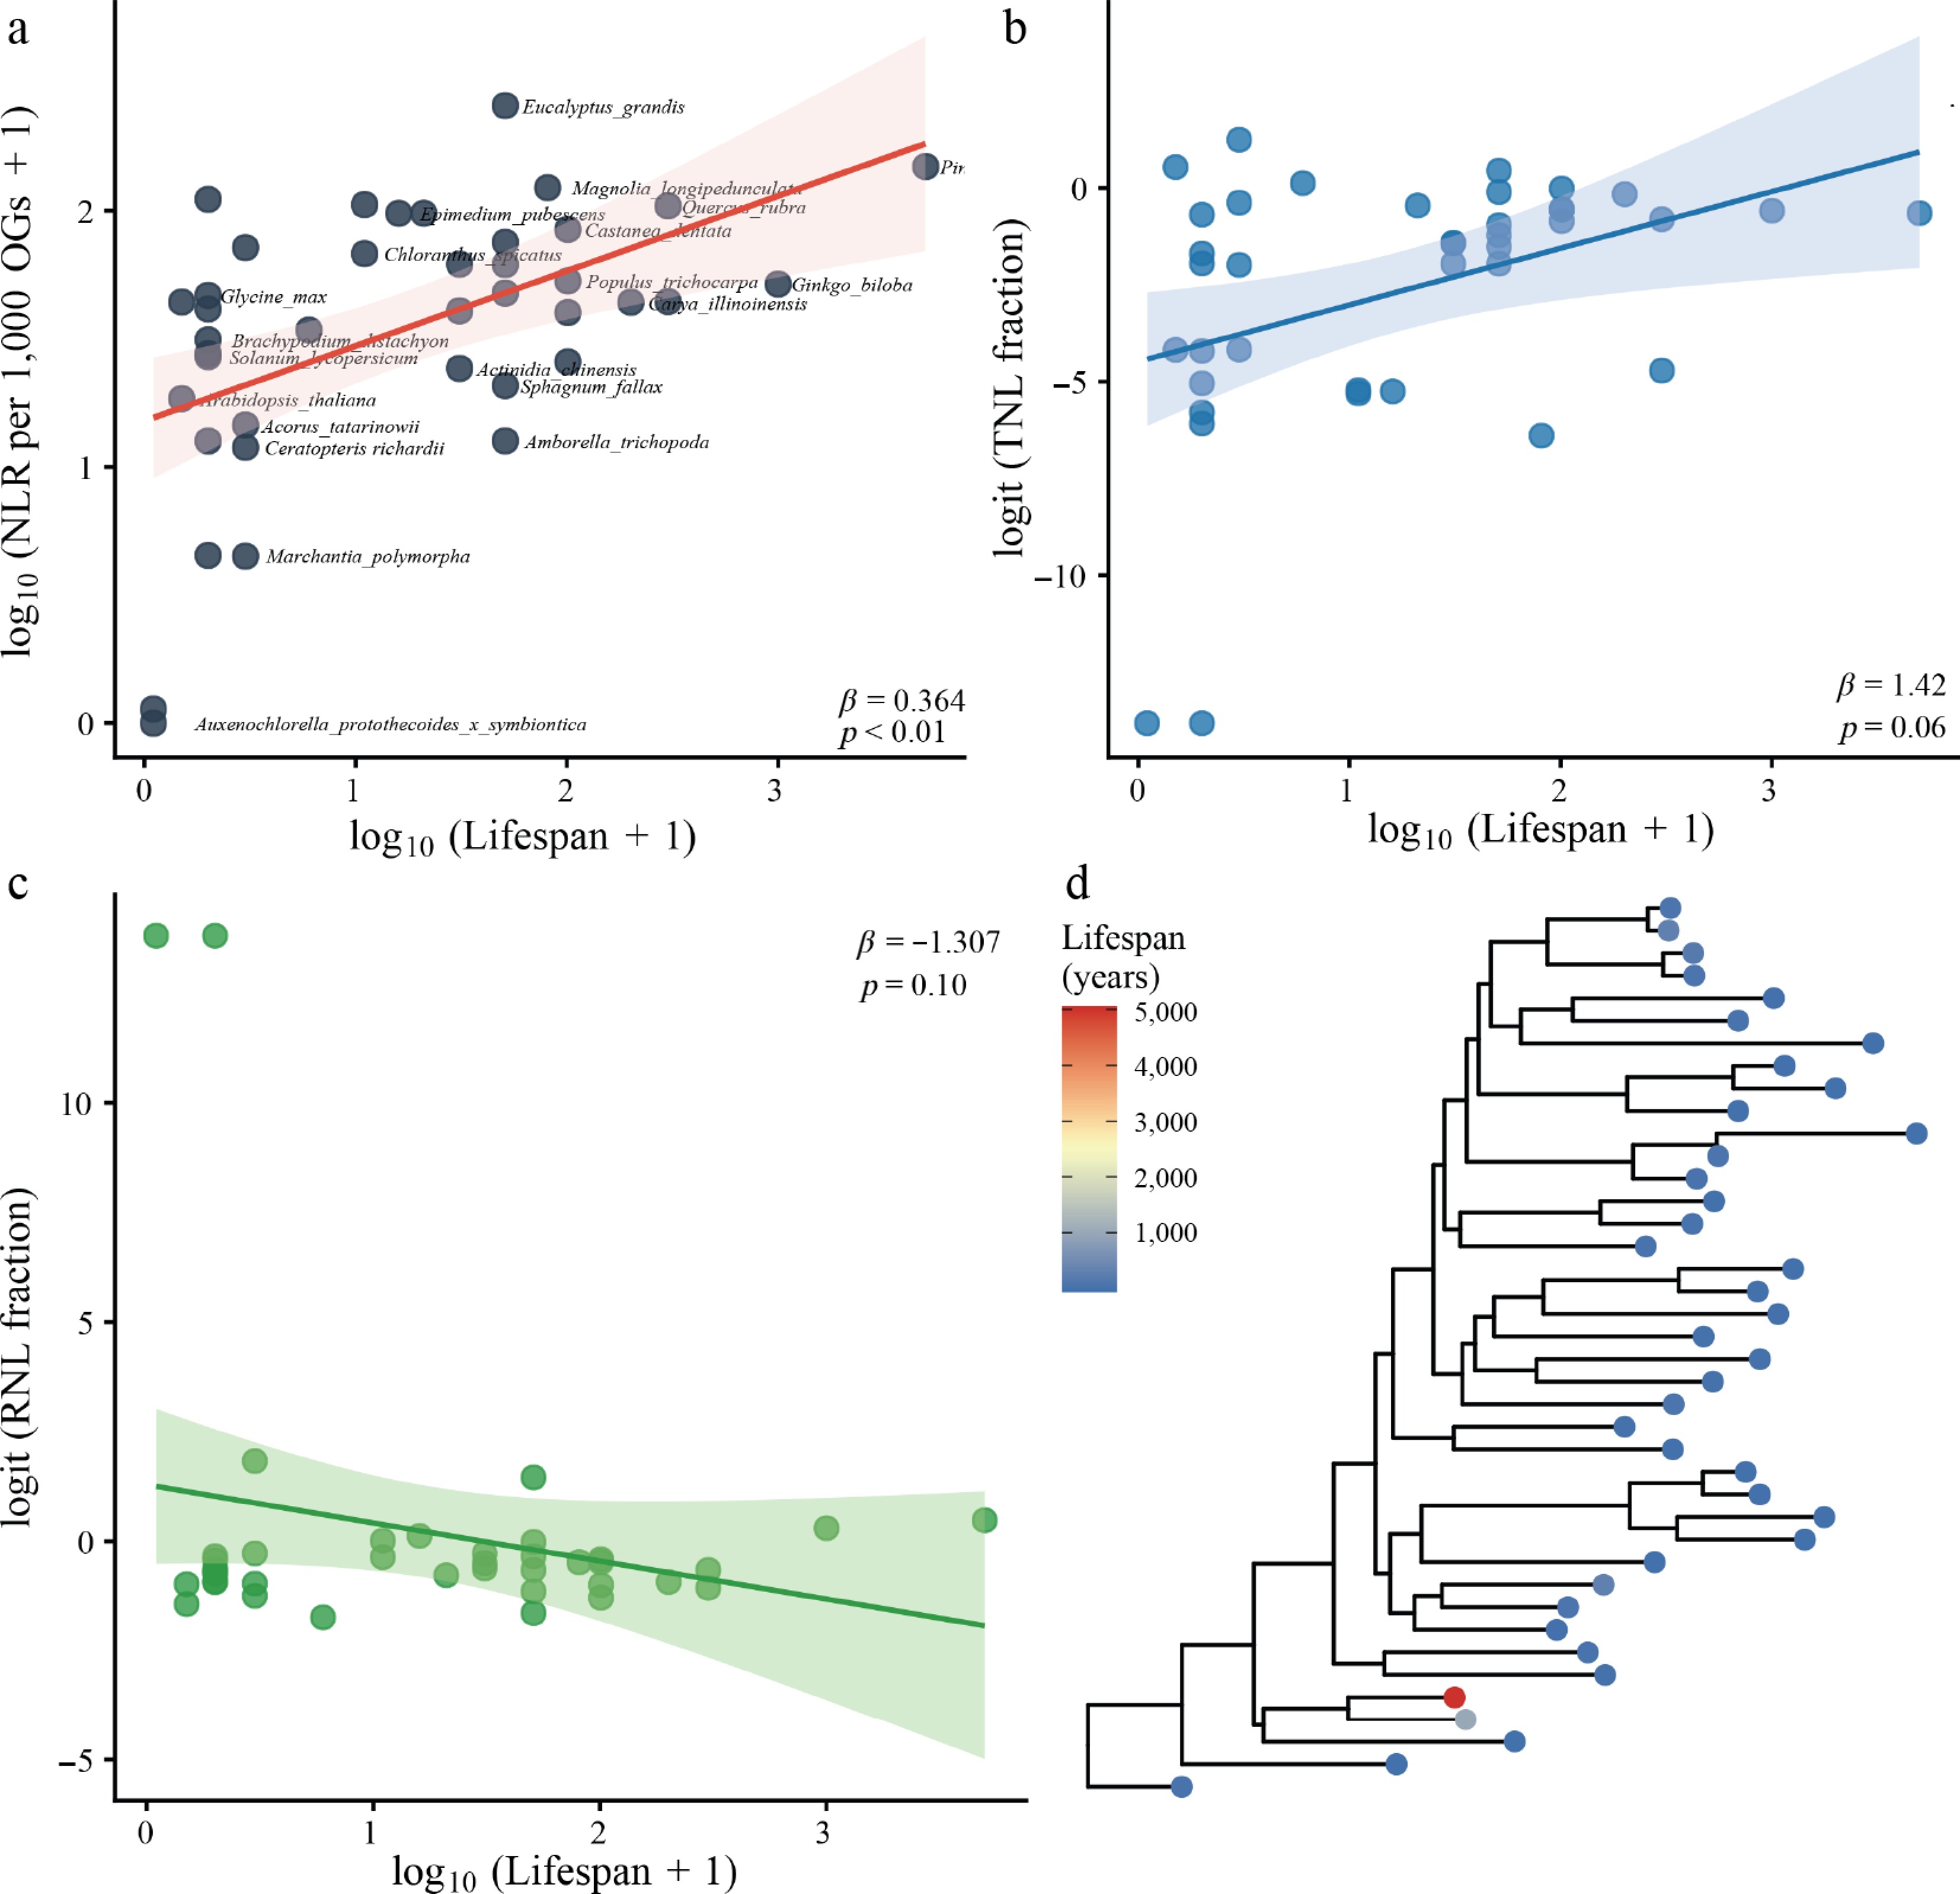
Figure 5.
Evolutionary dynamics of NLR immune receptor repertoires across plant lifespan. (a) Phylogenetic generalized least squares (PGLS) regression of log10(NLR gene density; NLRs per 1,000 orthogroups + 1) against log10(maximum recorded lifespan + 1) across 40 species spanning algae, bryophytes, ferns, and angiosperms. Species names are labelled adjacent to data points; shading denotes 95% confidence intervals. (b) PGLS regression of TNL (Toll/interleukin-1 receptor nucleotide-binding leucine-rich repeat) receptor proportion against lifespan. (c) PGLS regression of RNL (Resistance to Powdery Mildew 8-like) receptor proportion against lifespan. (d) Left-to-right maximum-likelihood species tree inferred using OrthoFinder (STAG algorithm), with tip colours scaled to species lifespan.
-
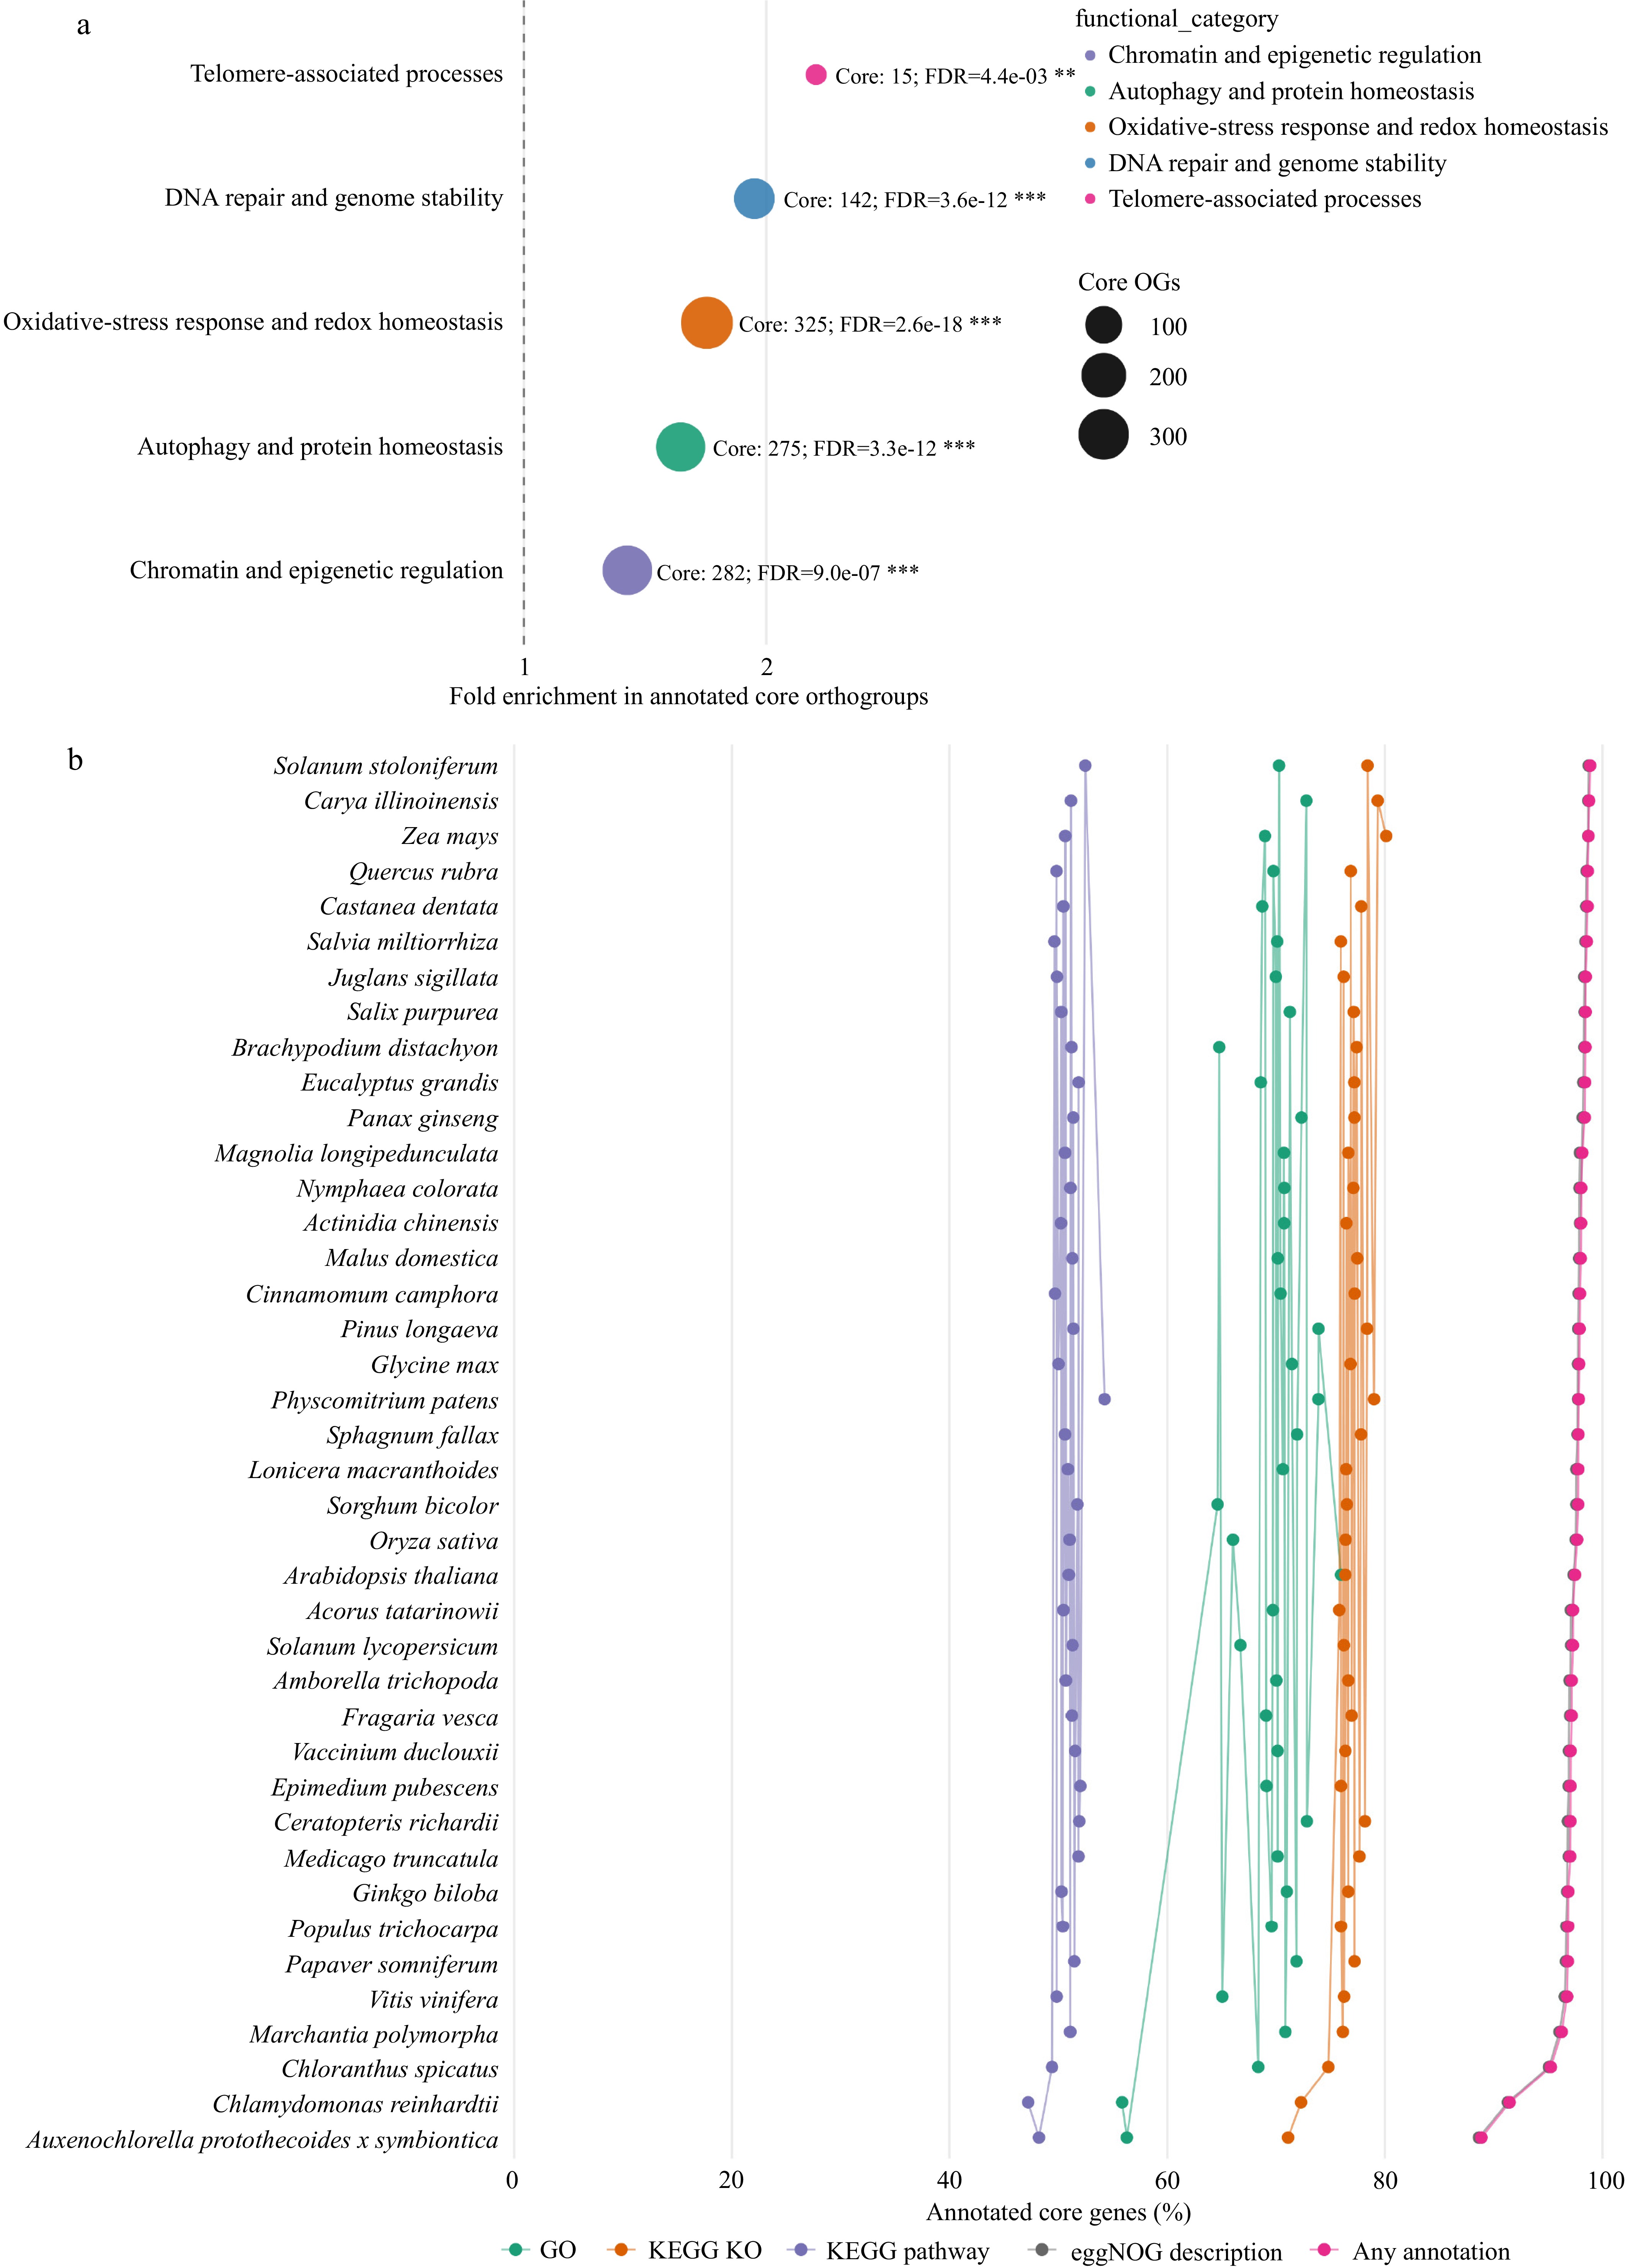
Figure 6.
Enrichment of longevity-relevant functional modules and annotation completeness of core genes. (a) Enrichment of five functional modules in core orthogroups relative to non-core orthogroups. Bubble size indicates the number of core orthogroups, and significance was assessed using one-sided Fisher's exact tests followed by Benjamini–Hochberg correction. (b) Functional annotation completeness of core genes across 40 plant species. Percentages indicate the proportions of core genes with GO, KEGG KO, KEGG pathway, eggNOG description, or any annotation.
-
Orthogroup category Slope (β) SE t p-value 95% CI R2 Core retained 129.079 52.832 2.443 0.019 22.127 to 236.032 0.136 Dispensable 224.448 170.741 1.315 0.197 −121.199 to 570.095 0.043 Unique 283.05 187.577 1.509 0.14 −96.680 to 662.780 0.057 Table 1.
Regression analyses of absolute orthogroup counts in relation to plant lifespan.
Figures
(6)
Tables
(1)