-
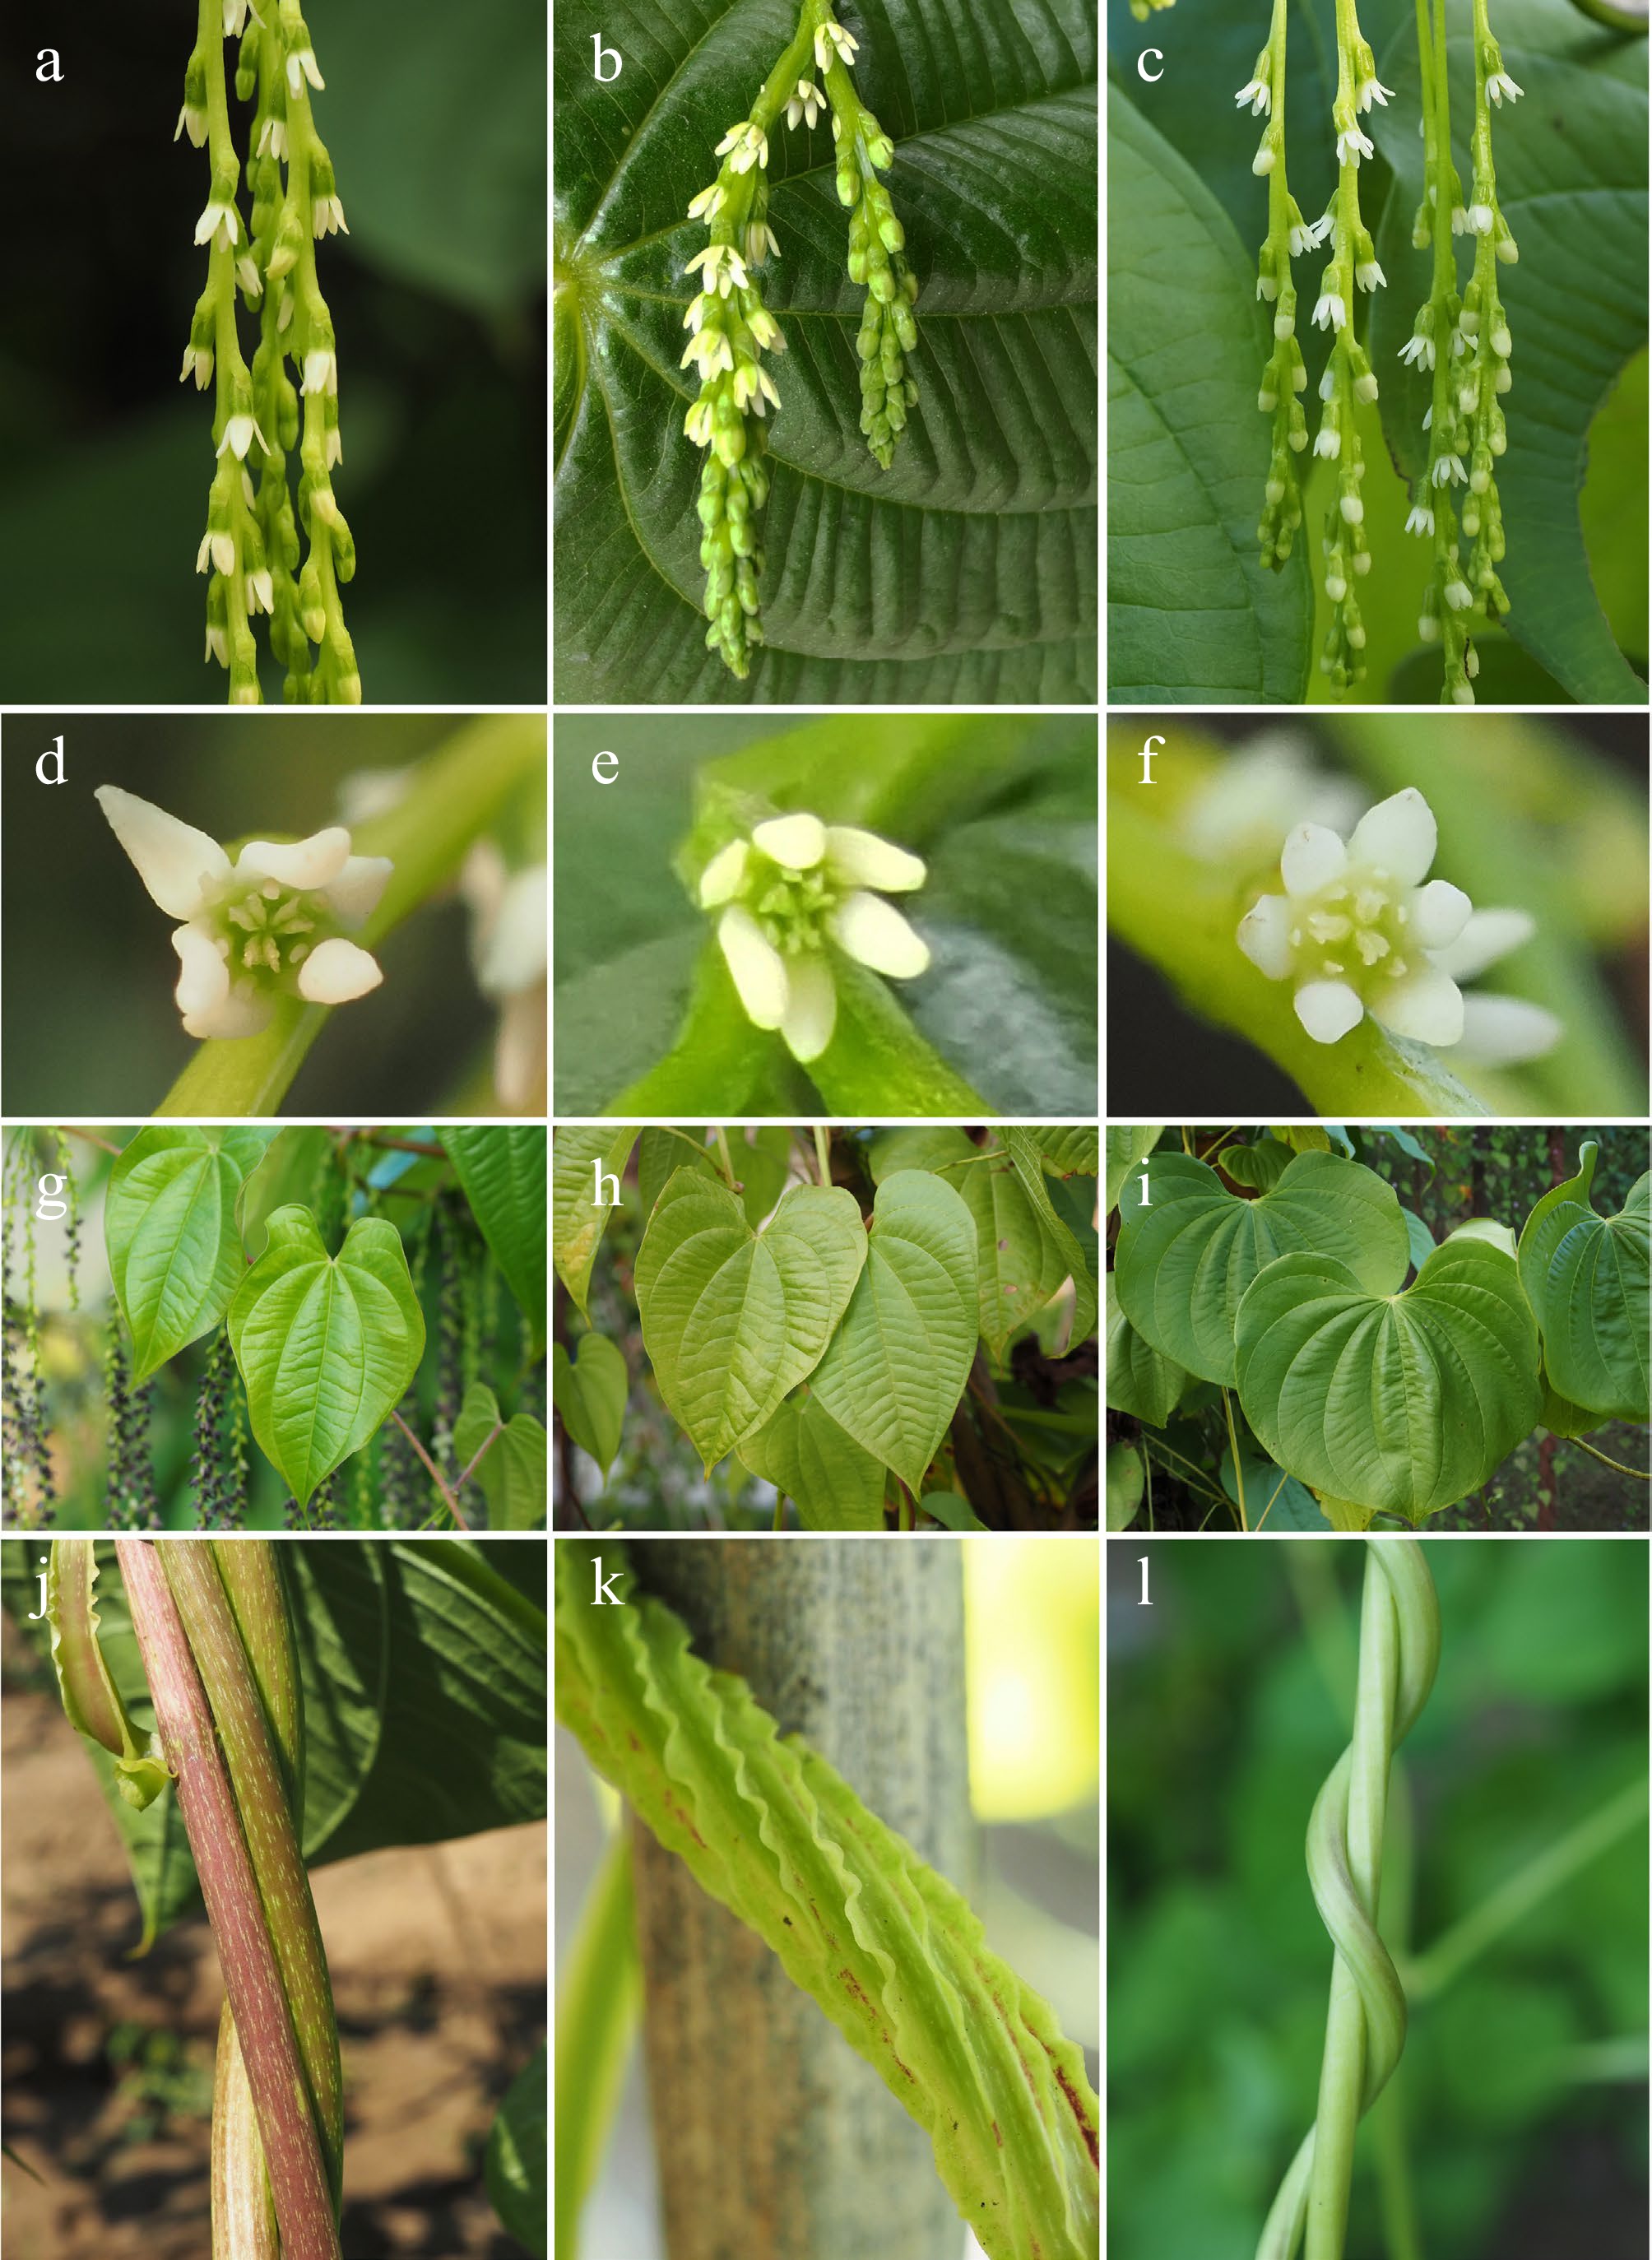
Figure 1.
(a), (d), (g), (j) Morphological comparison of D. bulbifera var. bulbifera; (b), (e), (h), (k) D. bulbifera var. kacheo; and (c), (f), (i), (l) D. bulbifera f. domestica. (a)–(c) Female inflorescences; (d)–(f) female flowers; (g)–(i) leaves; (j)–(l) stems.
-
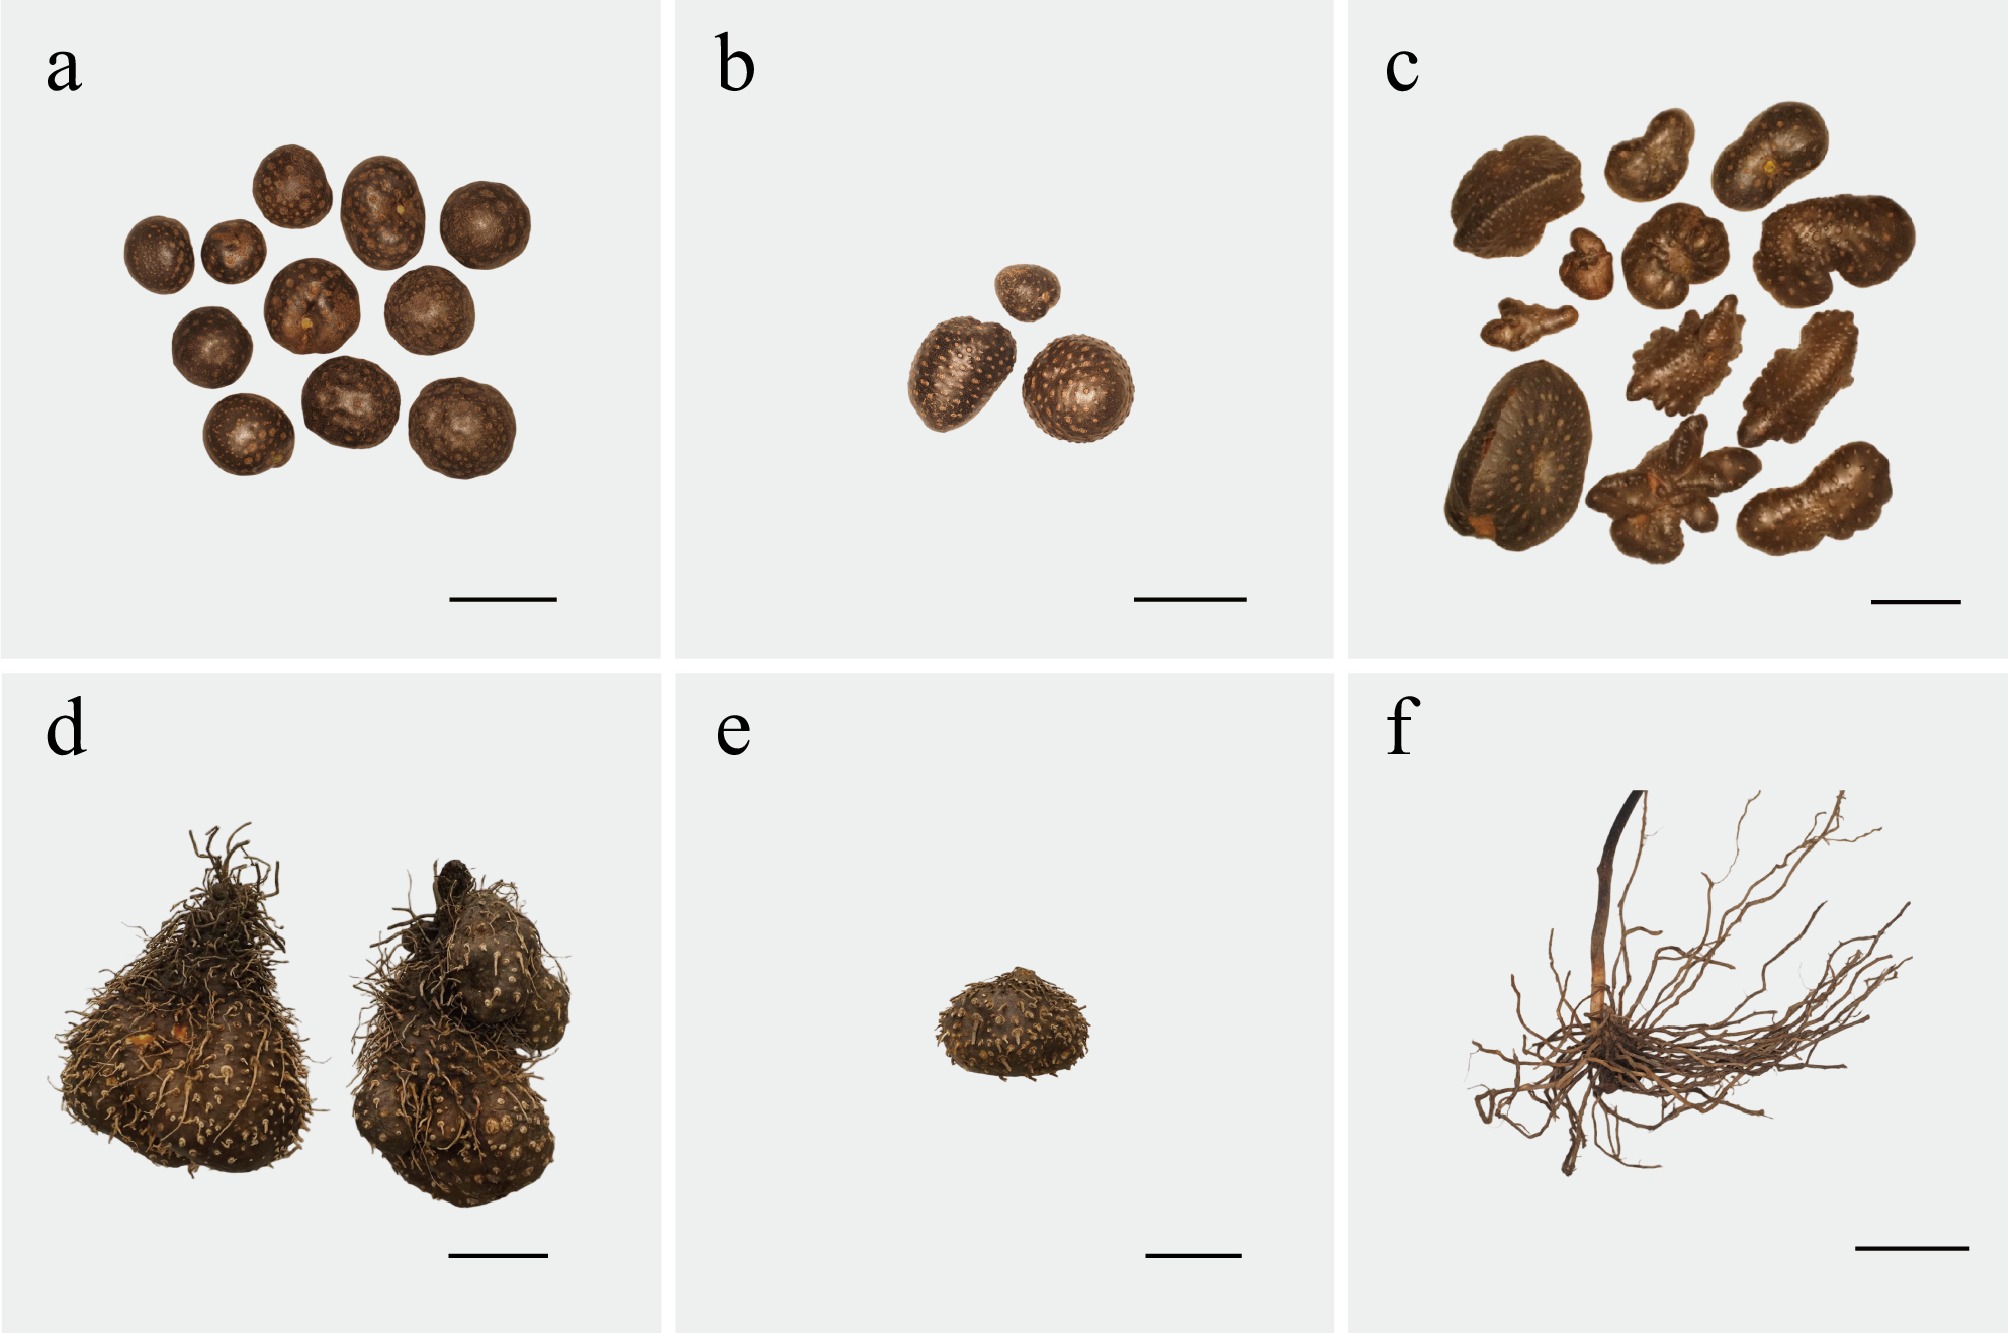
Figure 2.
Morphological comparison of (a), (d) D. bulbifera var. bulbifera; (b), (e) D. bulbifera var. kacheo; and (c), (f) D. bulbifera f. domestica. (a)–(c) Bulbils. (d)–(f) Tubers. Scale bar = 5 cm.
-
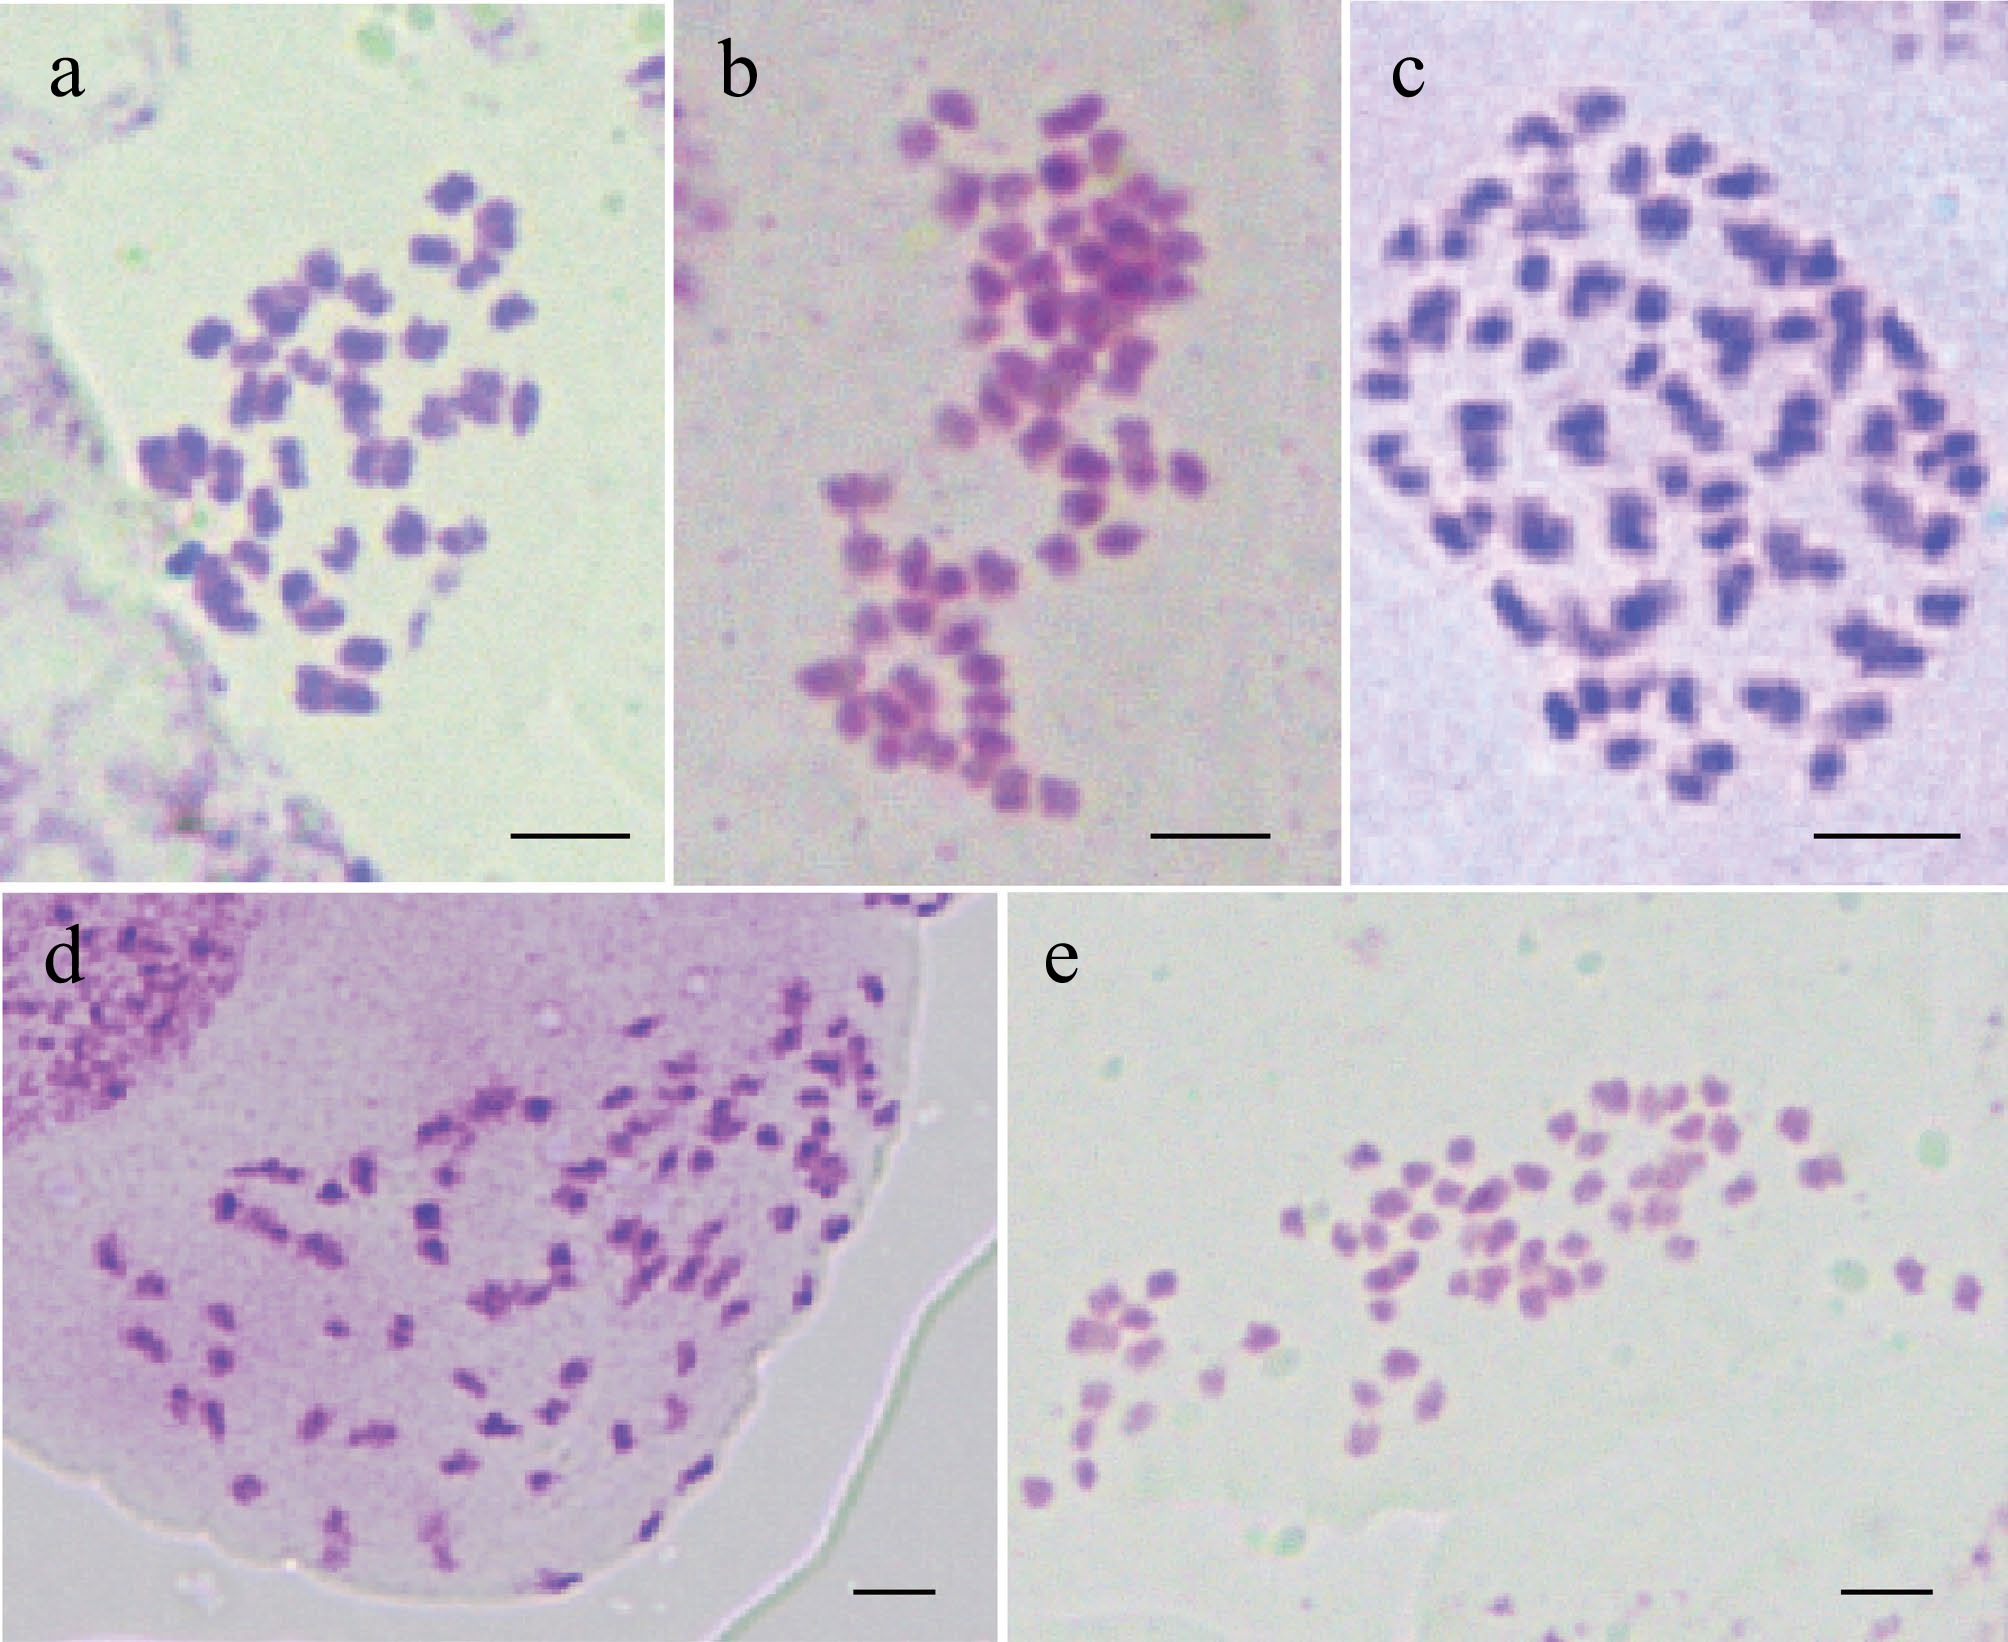
Figure 3.
Chromosome spreads of D. bulbifera var. bulbifera, D. bulbifera var. kacheo and D. bulbifera f. domestica. (a) D. bulbifera var. bulbifera (HNLS, 2n = 40); (b) D. bulbifera var. bulbifera (HNHK, 2n = 60); (c) D. bulbifera var. bulbifera (ZJLS, 2n = 80); (d) D. bulbifera var. kacheo (JCHD1, 2n = 80); (e) D. bulbifera f. domestica (YZ1, 2n = 60). Scale bar = 2 μm.
-
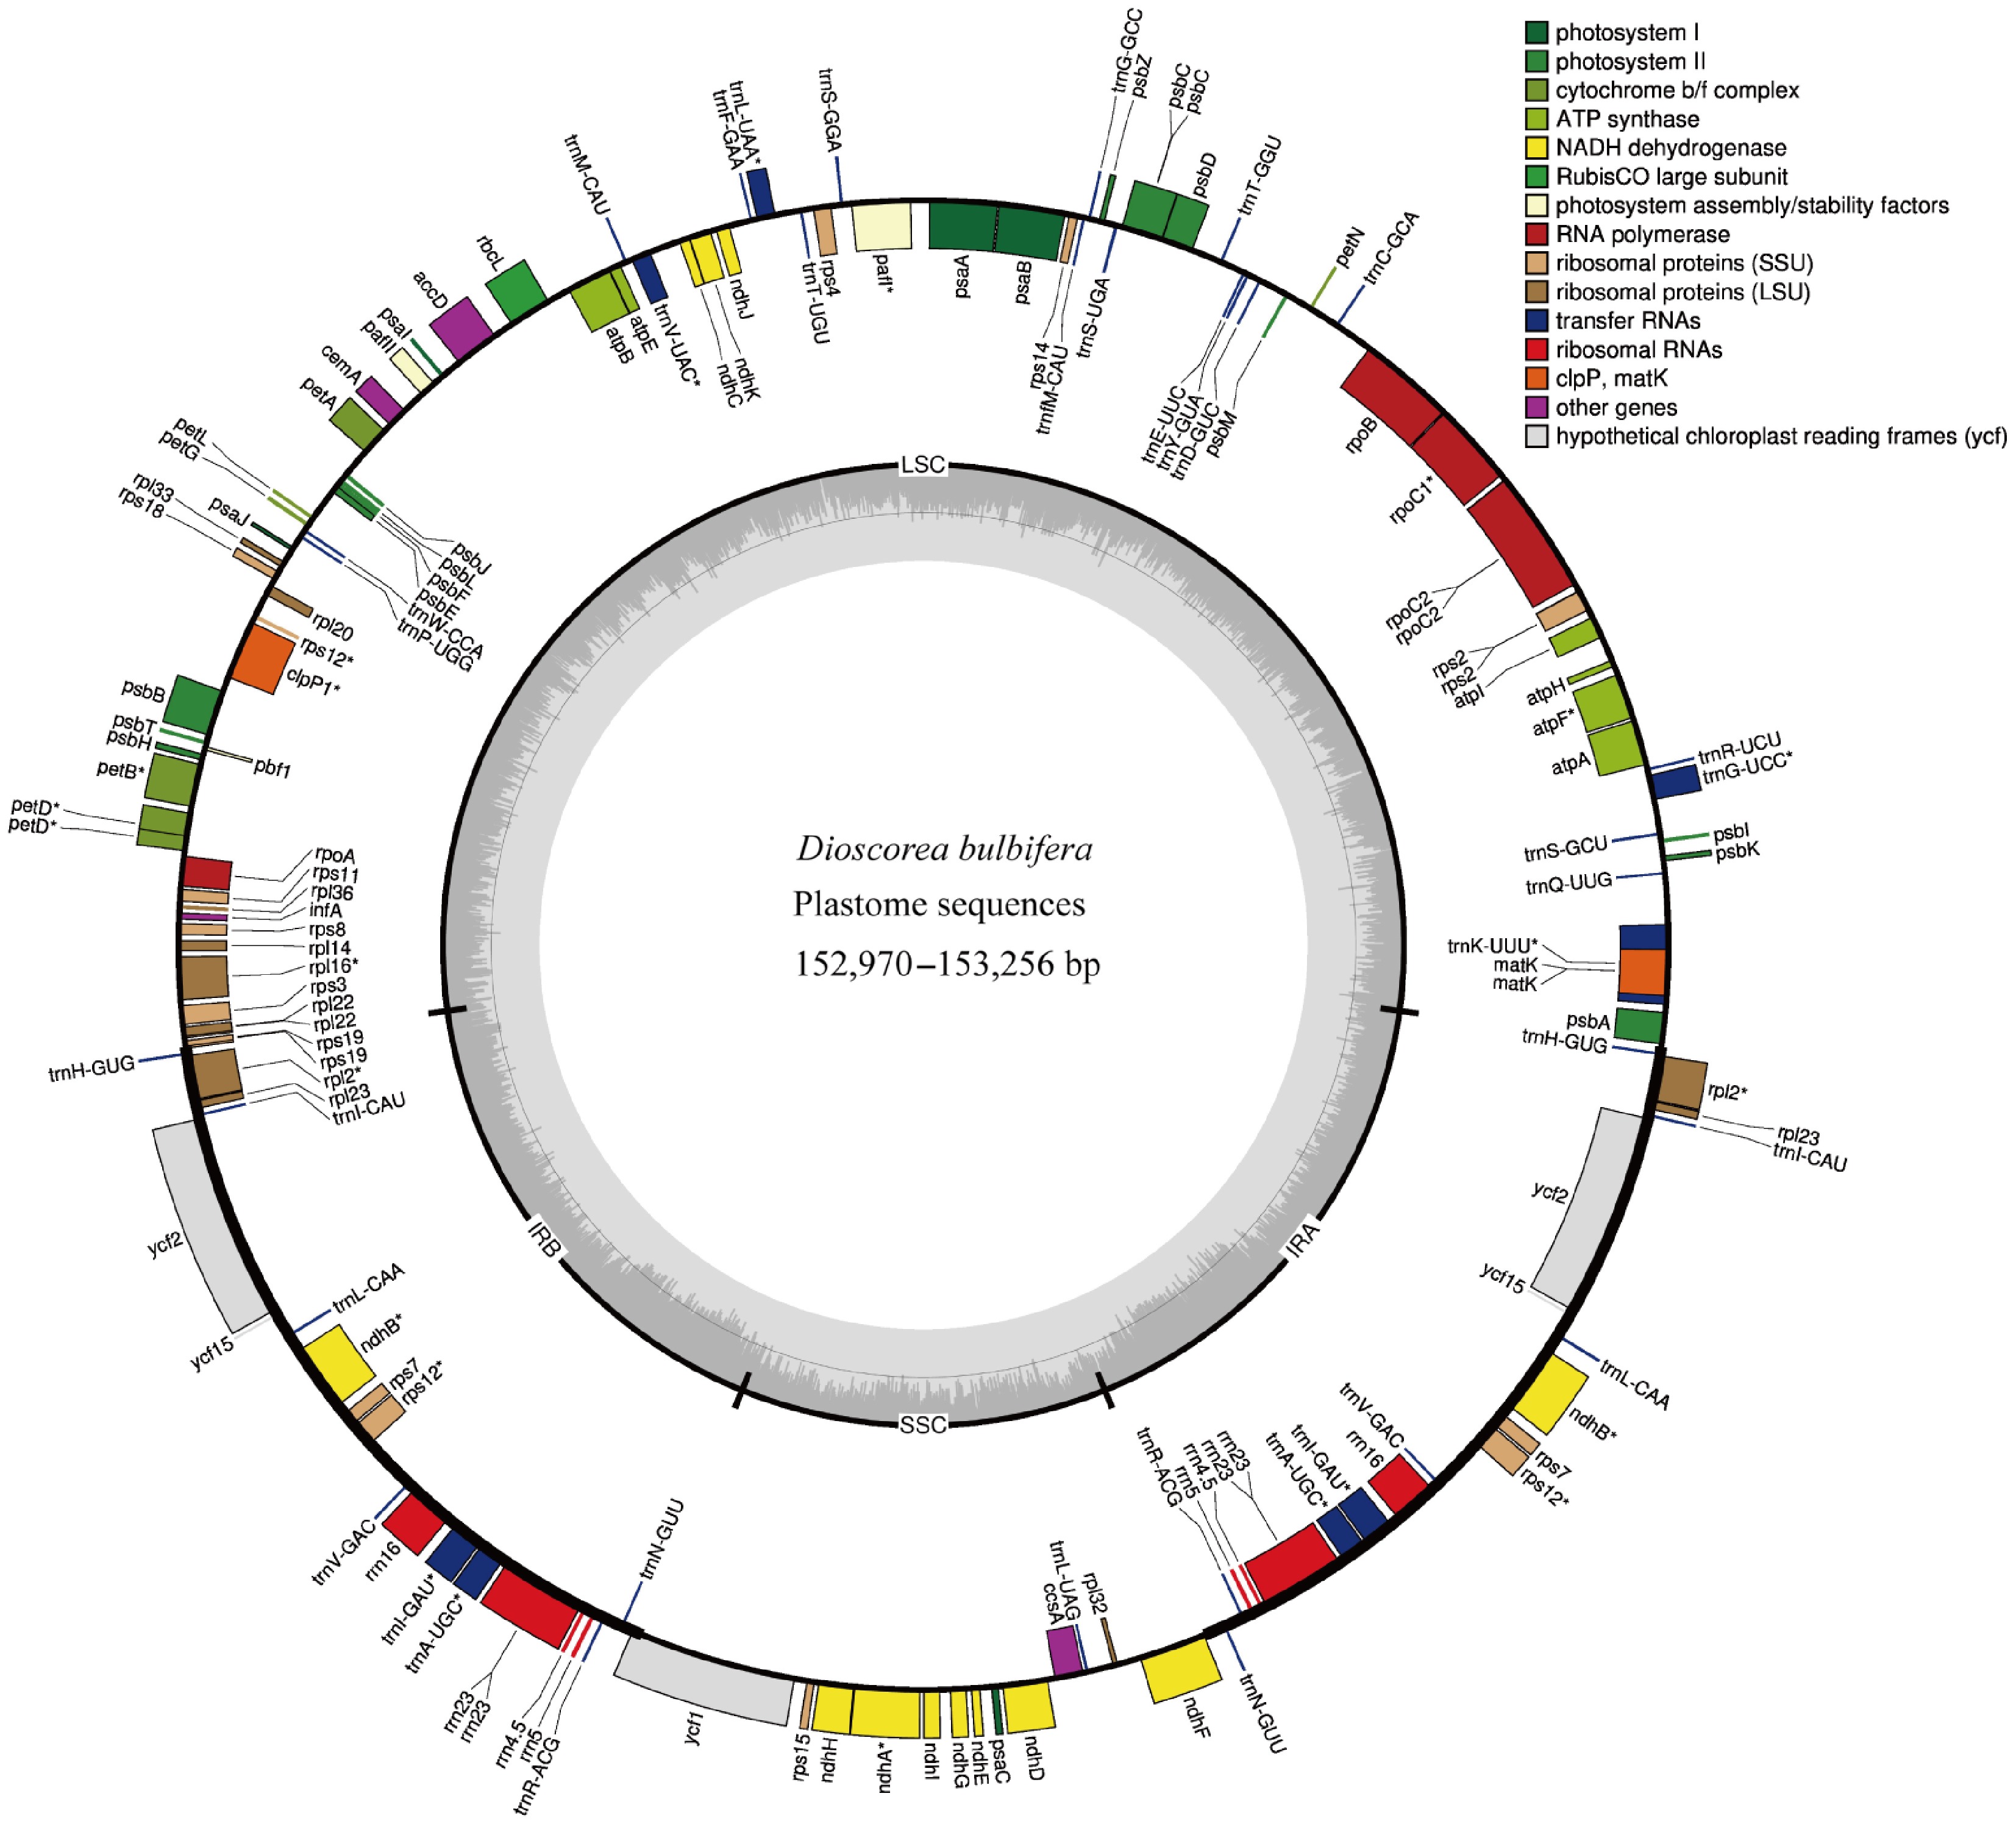
Figure 4.
Plastome map of D. bulbifera. Genes on the outer circle are transcribed clockwise, and those on the inner circle are transcribed counterclockwise. Functional categories are indicated by color-coded genes. The dark grey and the light grey plots in the inner circle correspond to the GC content and AT content, respectively.
-
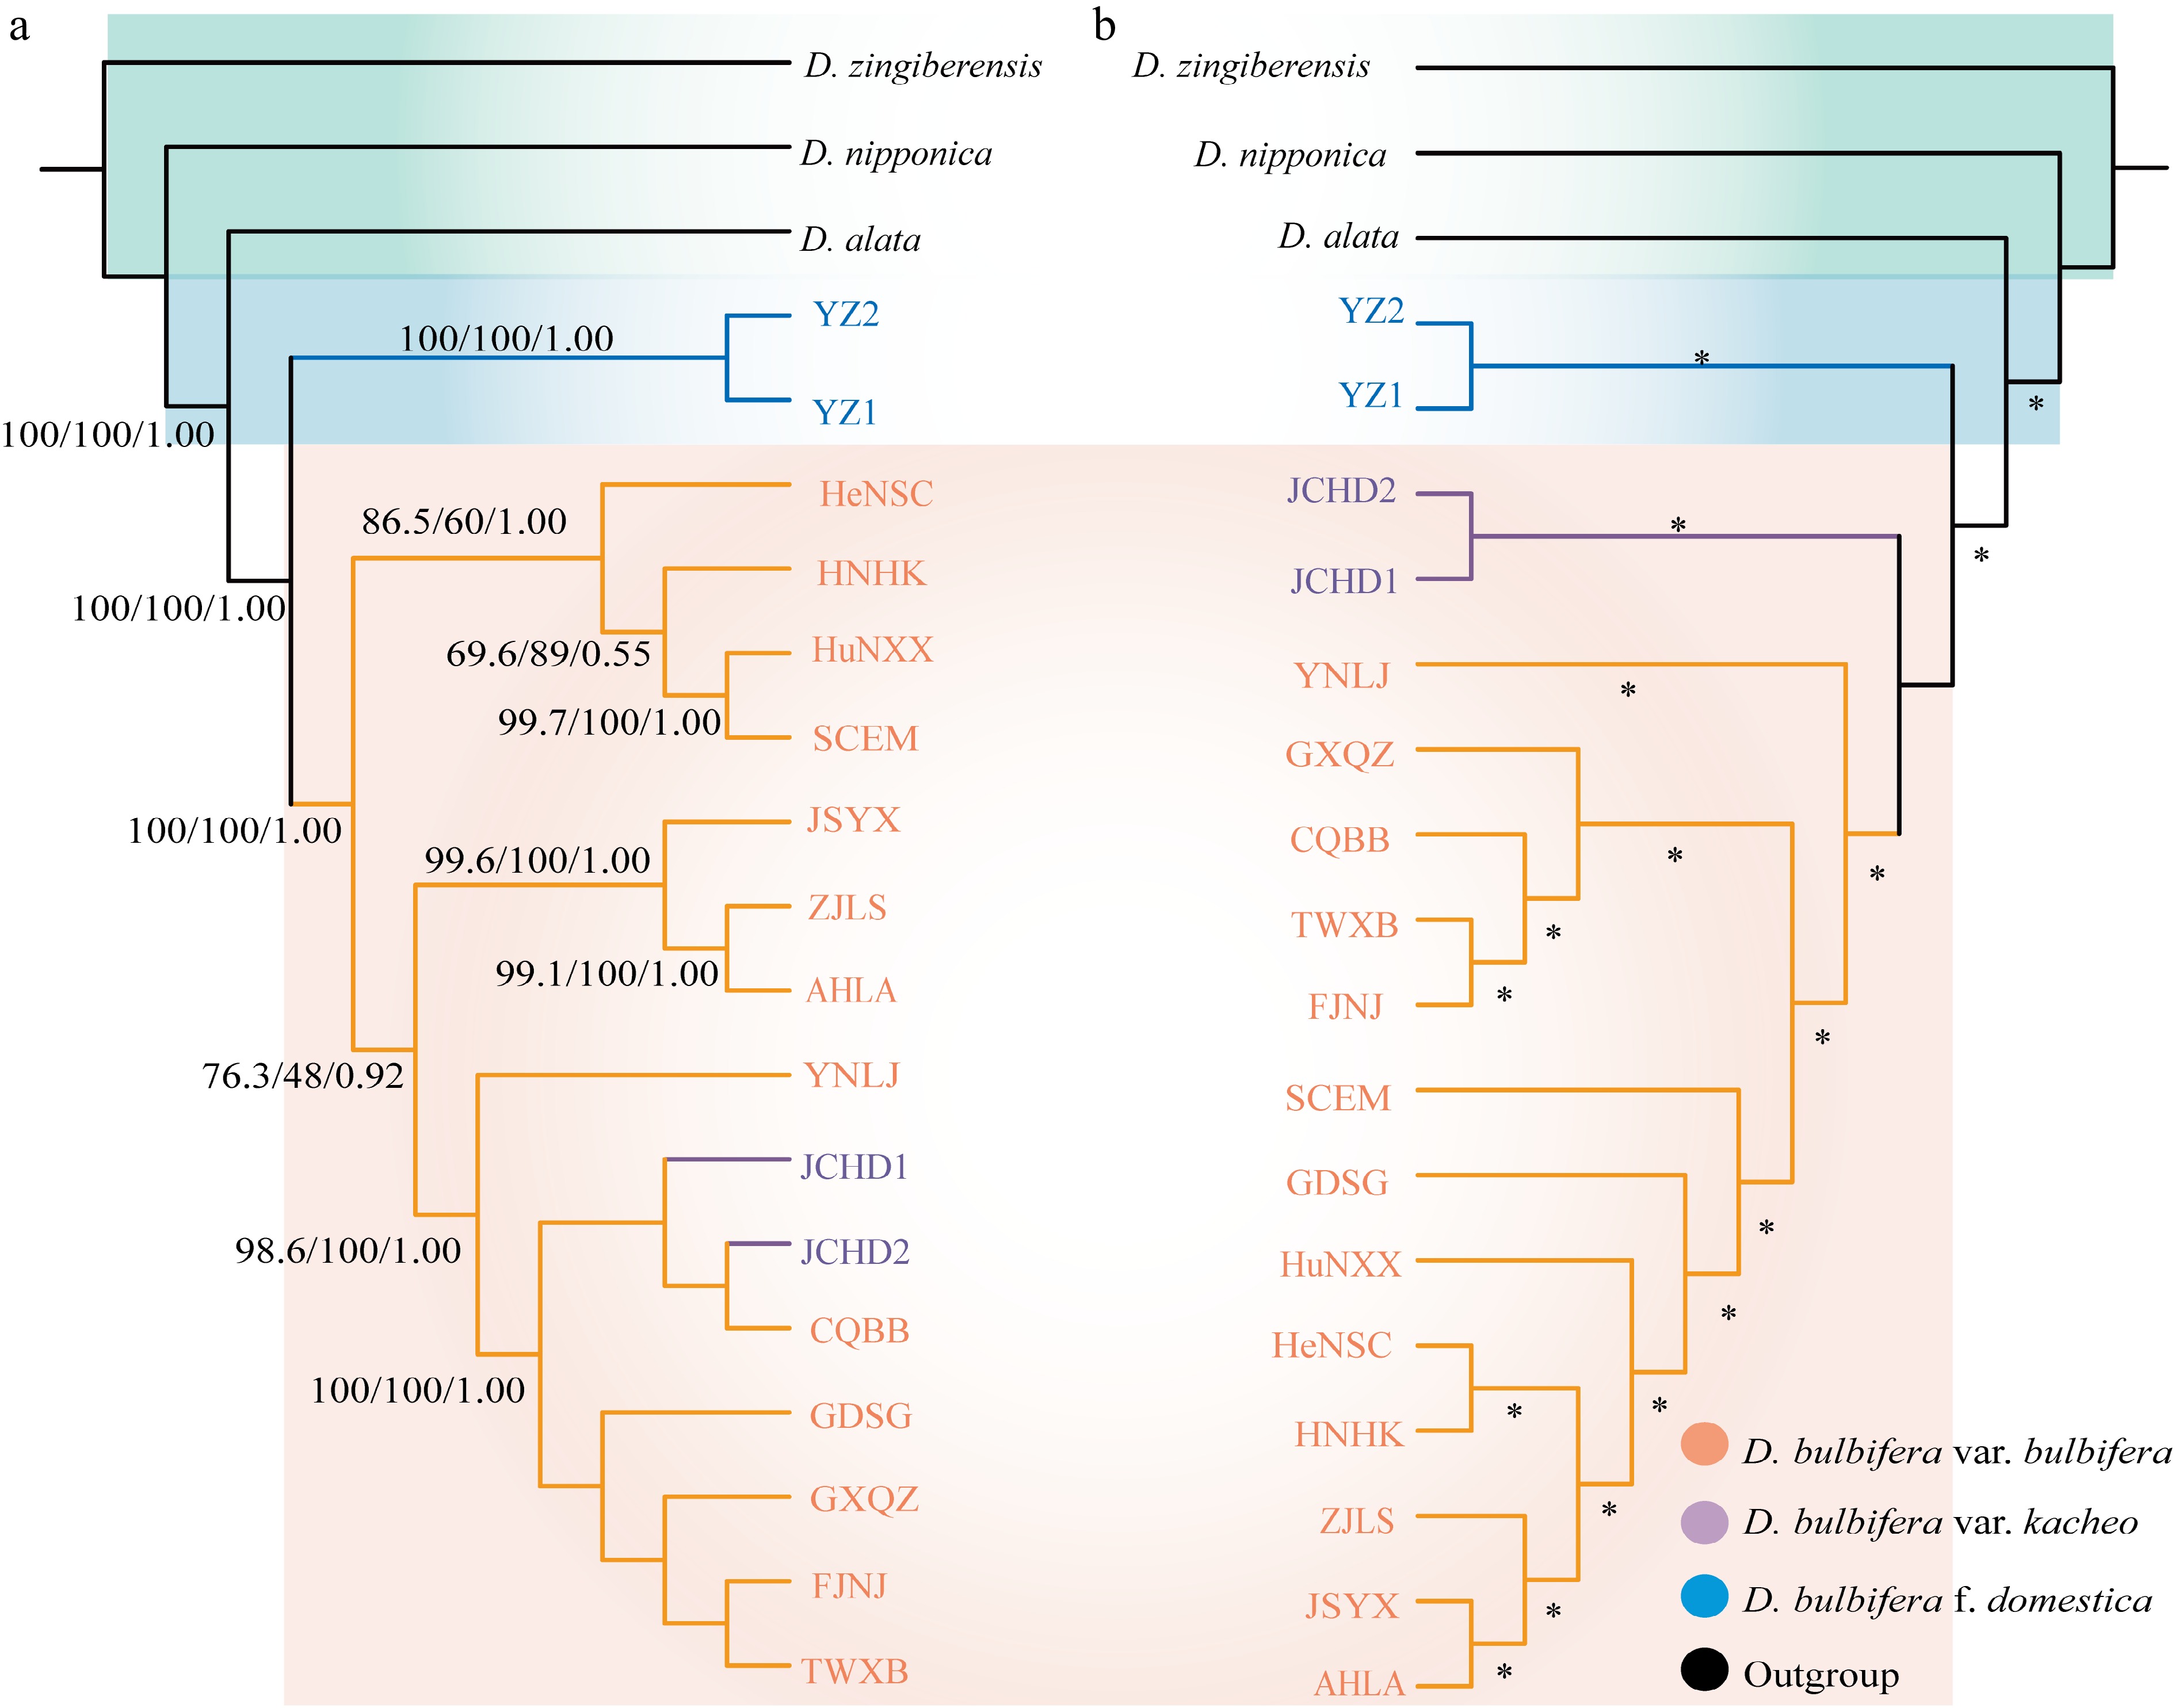
Figure 5.
Phylogenetic relationships and cytonuclear discordance in D. bulbifera. (a) Maximum likelihood (ML) tree based on complete plastome sequences; node labels show SH-aLRT/UFBoot/PP (SH-aLRT support [%], ultrafast bootstrap support [%], and Bayesian posterior probabilities). (b) ML tree based on genome-wide nuclear SNPs; node labels show SH-aLRT/UFBoot support (%), with * indicating SH-aLRT/UFBoot = 100/100. All trees were rooted with D. zingiberensis.
-
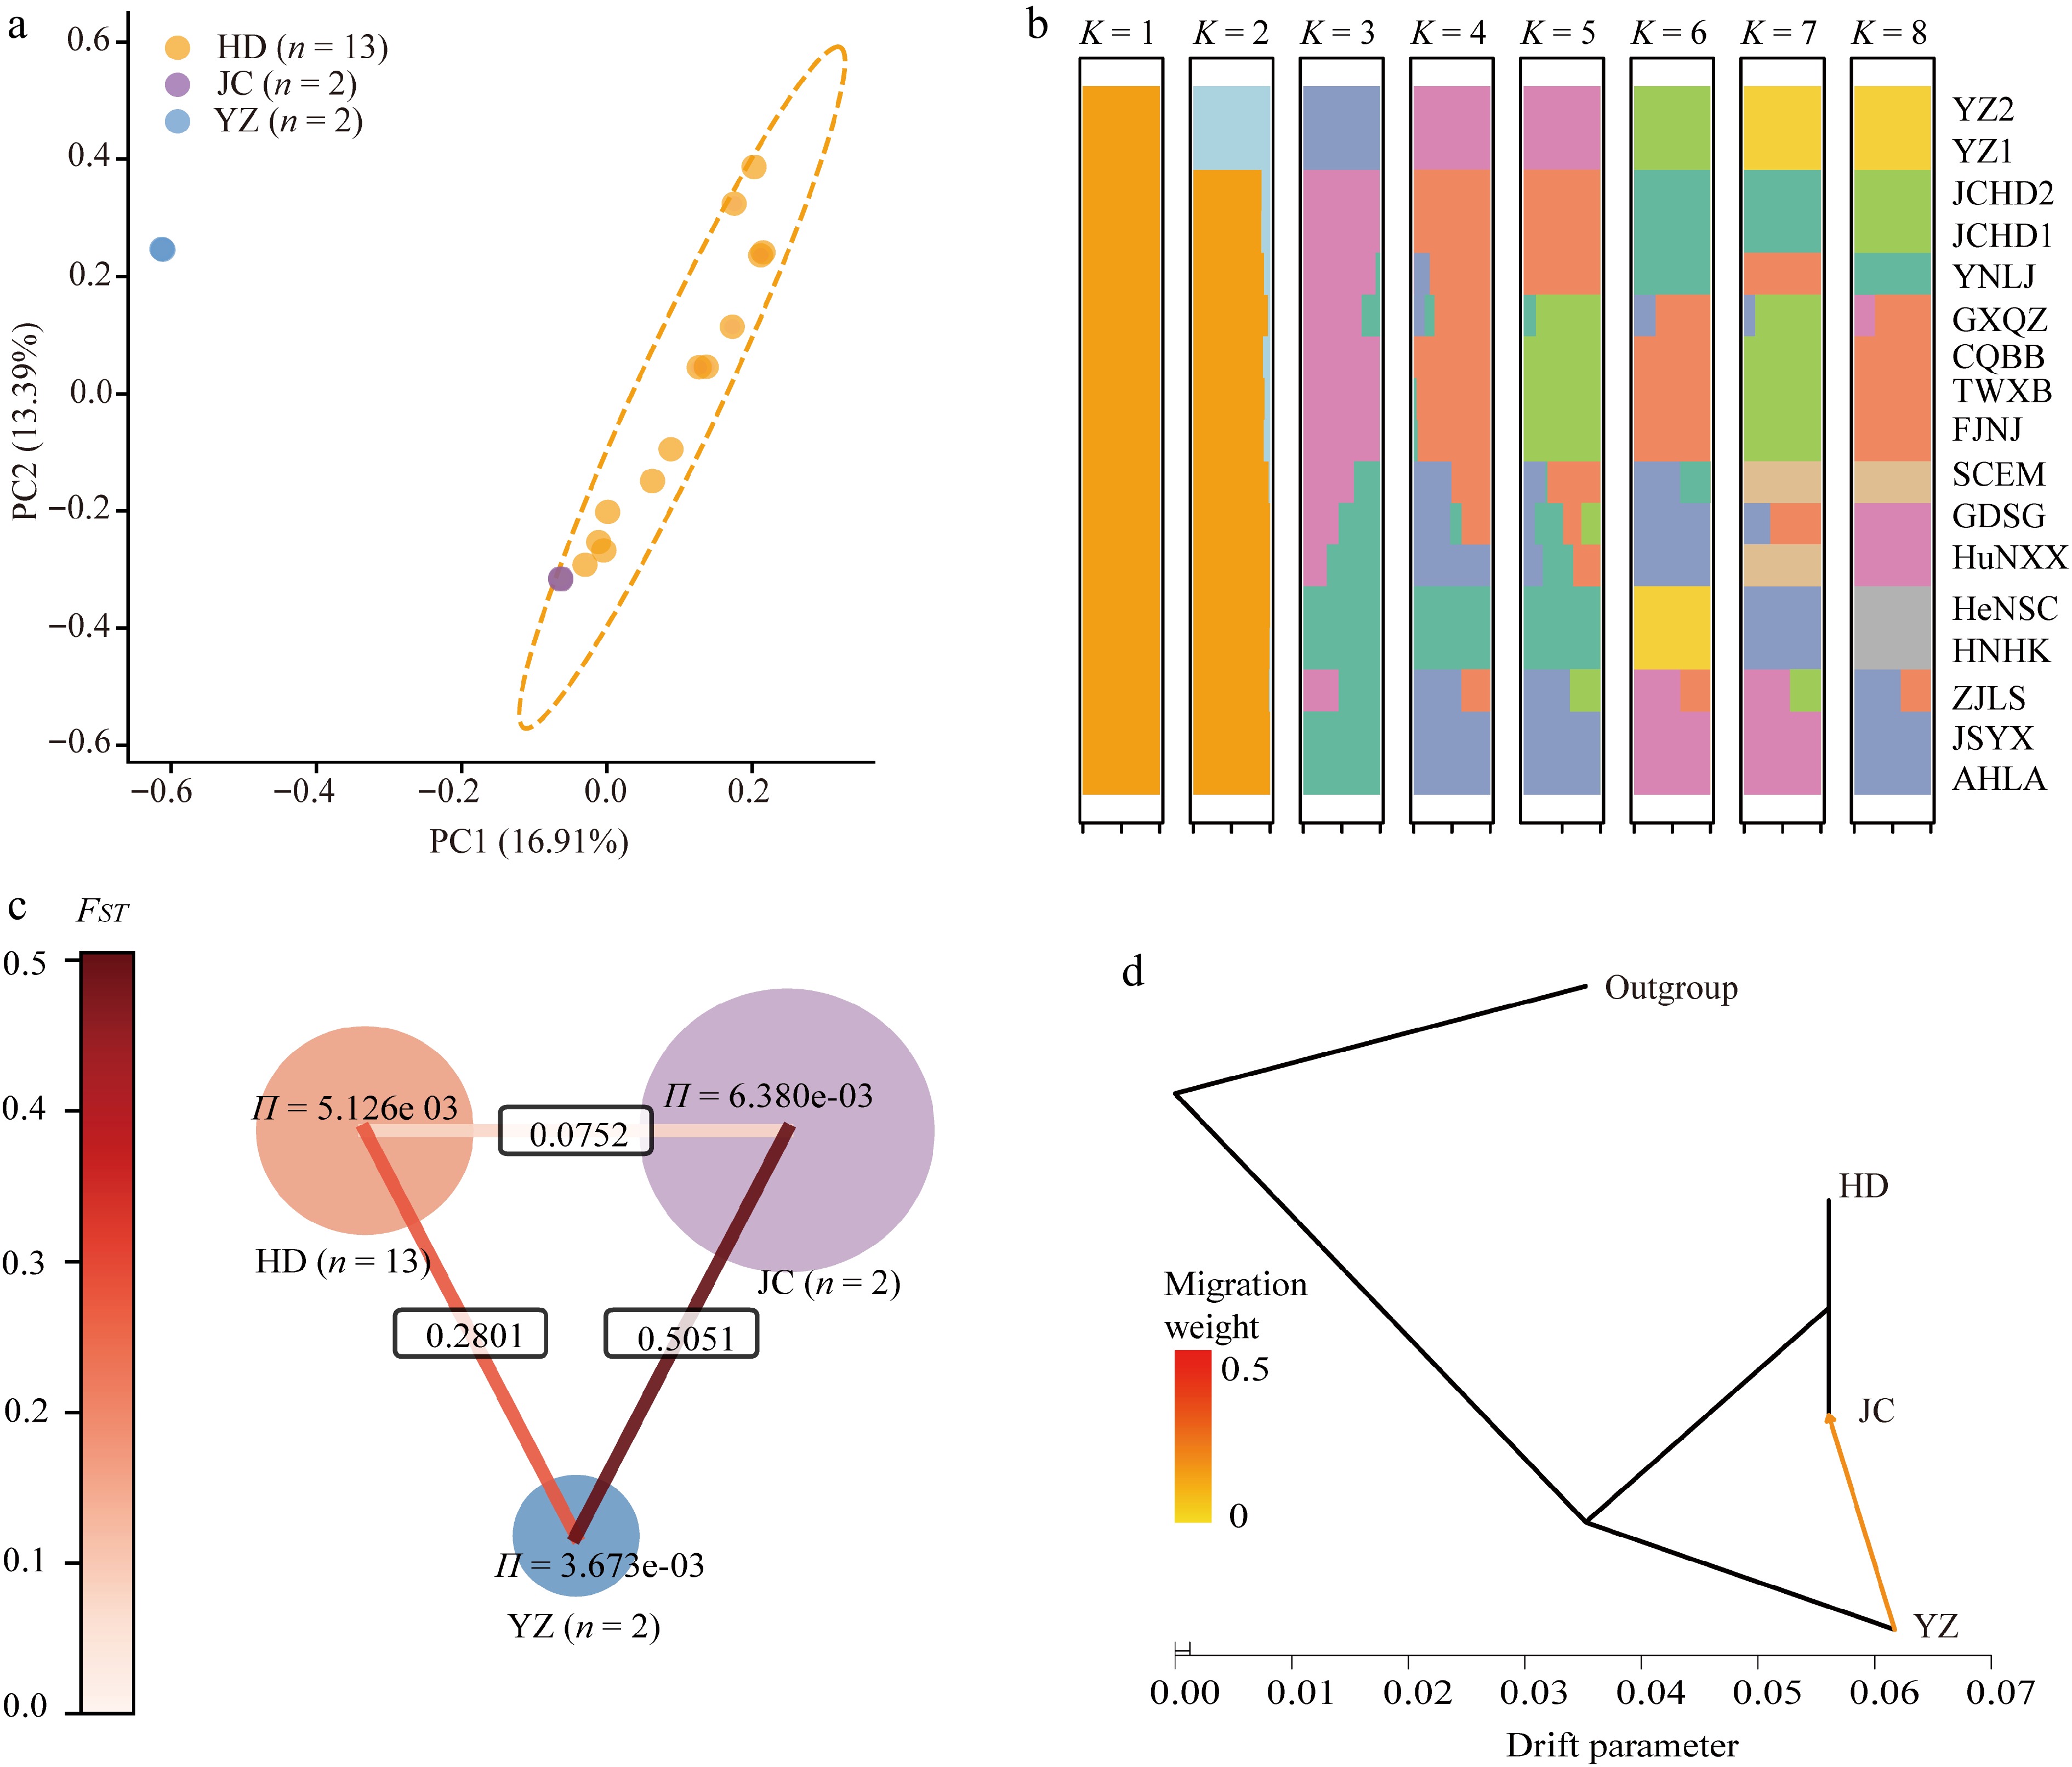
Figure 6.
Population genomic analyses of three D. bulbifera infraspecific taxa: HD (D. bulbifera var. bulbifera), JC (D. bulbifera var. kacheo), and YZ (D. bulbifera f. domestica). (a) PCA based on genome-wide SNPs; PC1 and PC2 explain 16.91% and 13.39% of genetic variation. Orange, purple, and blue denote HD (n = 13), JC (n = 2), and YZ (n = 2), respectively. (b) ADMIXTURE analysis (K = 1–8) showing ancestry proportions of each sample. (c) Network of (π) nucleotide diversity and (FST) population differentiation; values inside circles indicate π, and lines show pairwise FST (white to red indicates increasing differentiation). (d) TreeMix analysis (m = 1) showing population divergence and gene flow; the yellow arrow indicates migration from YZ to JC (weight = 0.183).
-
Organ Character D. bulbifera var. bulbifera D. bulbifera var. kacheo D. bulbifera f. domestica Leaf Shape Broadly ovate-cordate or ovate-cordate Broadly ovate-cordate or ovate-cordate Broadly cordate, length nearly equal to width Length/width ratio 1.20−1.60 1.17−1.38 1.02−1.07 Stem Shape Terete Ridged Terete Epidermal color Often dark red, or green with red stripes Pale green Usually emerald green Epidermal features Longitudinally striate With membranous wings along the ridges Subglabrous, sometimes longitudinally striate Bulbil Shape Subglobose Subglobose to broadly ellipsoid Highly variable in shape, ridged Epidermal features Irregularly arranged depressions Regularly arranged protuberances Irregularly arranged protuberances
of various sizesDiameter (cm) 2.9−4.7 2.8−6.5 2.0−8.5 Tuber Diameter (cm) 8.0−13.0 4.0−5.0 1.0−1.5 Data were collected from mature field specimens (n ≥ 5 per taxon). Diameters of bulbils and tubers were measured at the widest transverse position. Table 1.
Morphological traits of three taxa in Dioscorea bulbifera.
-
Sample name Internal reference Reference fluorescence
intensityTarget fluorescence
intensityRatio Estimated genome size (Gb) D. bulbifera var. bulbifera ZJLS Zea mays 105.51 60.01 0.57 1.31 HNHK Zea mays 44.22 19.62 0.44 1.02 HNLS Zea mays 50.97 14.69 0.29 0.66 D. bulbifera var. kacheo JCHD1 Solanum lycopersicum 22.58 35.53 1.57 1.38 D. bulbifera f. domestica YZ1 Zea mays 44.46 22.14 0.5 1.15 Table 2.
Estimated genome size of Dioscorea bulbifera accessions determined by flow cytometry.
Figures
(6)
Tables
(2)