-
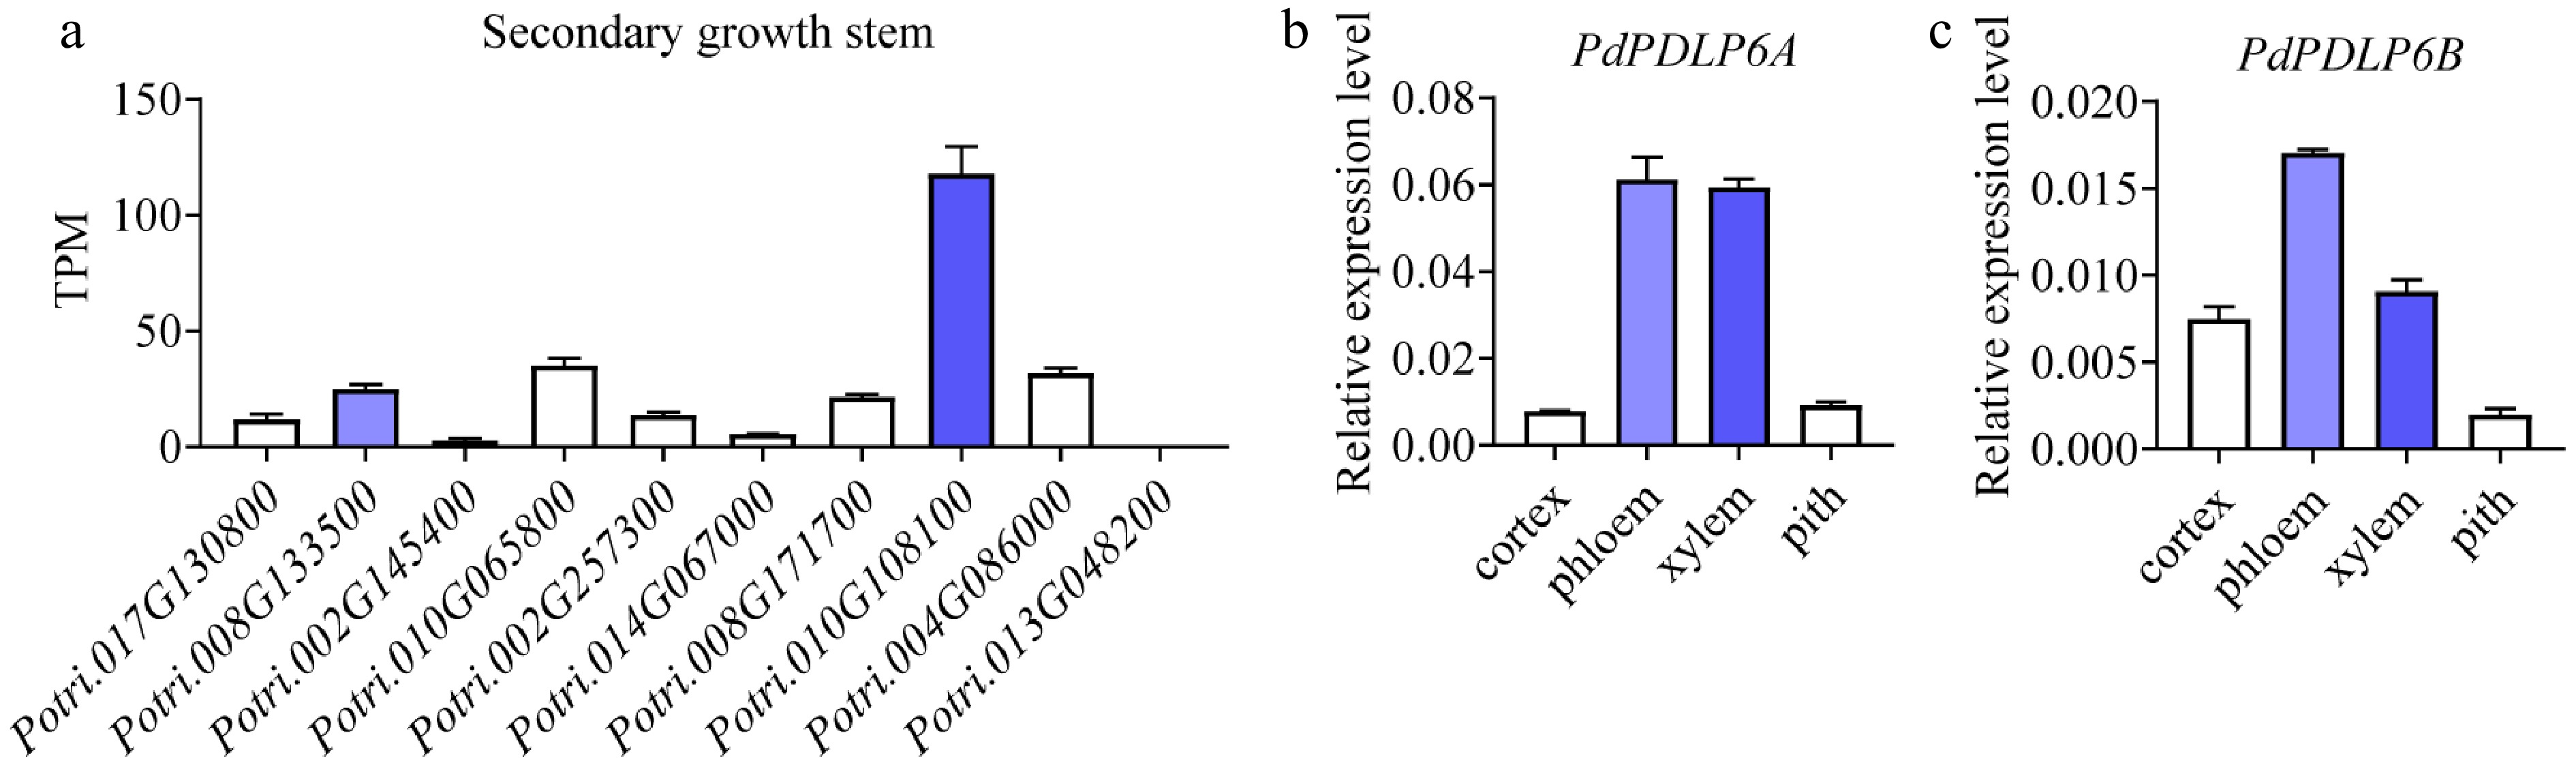
Figure 1.
PdPDLP6A was highly expressed in the vascular tissues of the secondary-growth stem. (a) Relative expression of PdPDLPs in secondary-growth stems based on our previously published RNA-seq data. TPM, transcripts per million. Values are means ± SD, n = 3. (b), (c) Relative expression of PdPDLP6A/6B in vascular tissues determined by qRT-PCR. Values are means ± SD, n = 3.
-
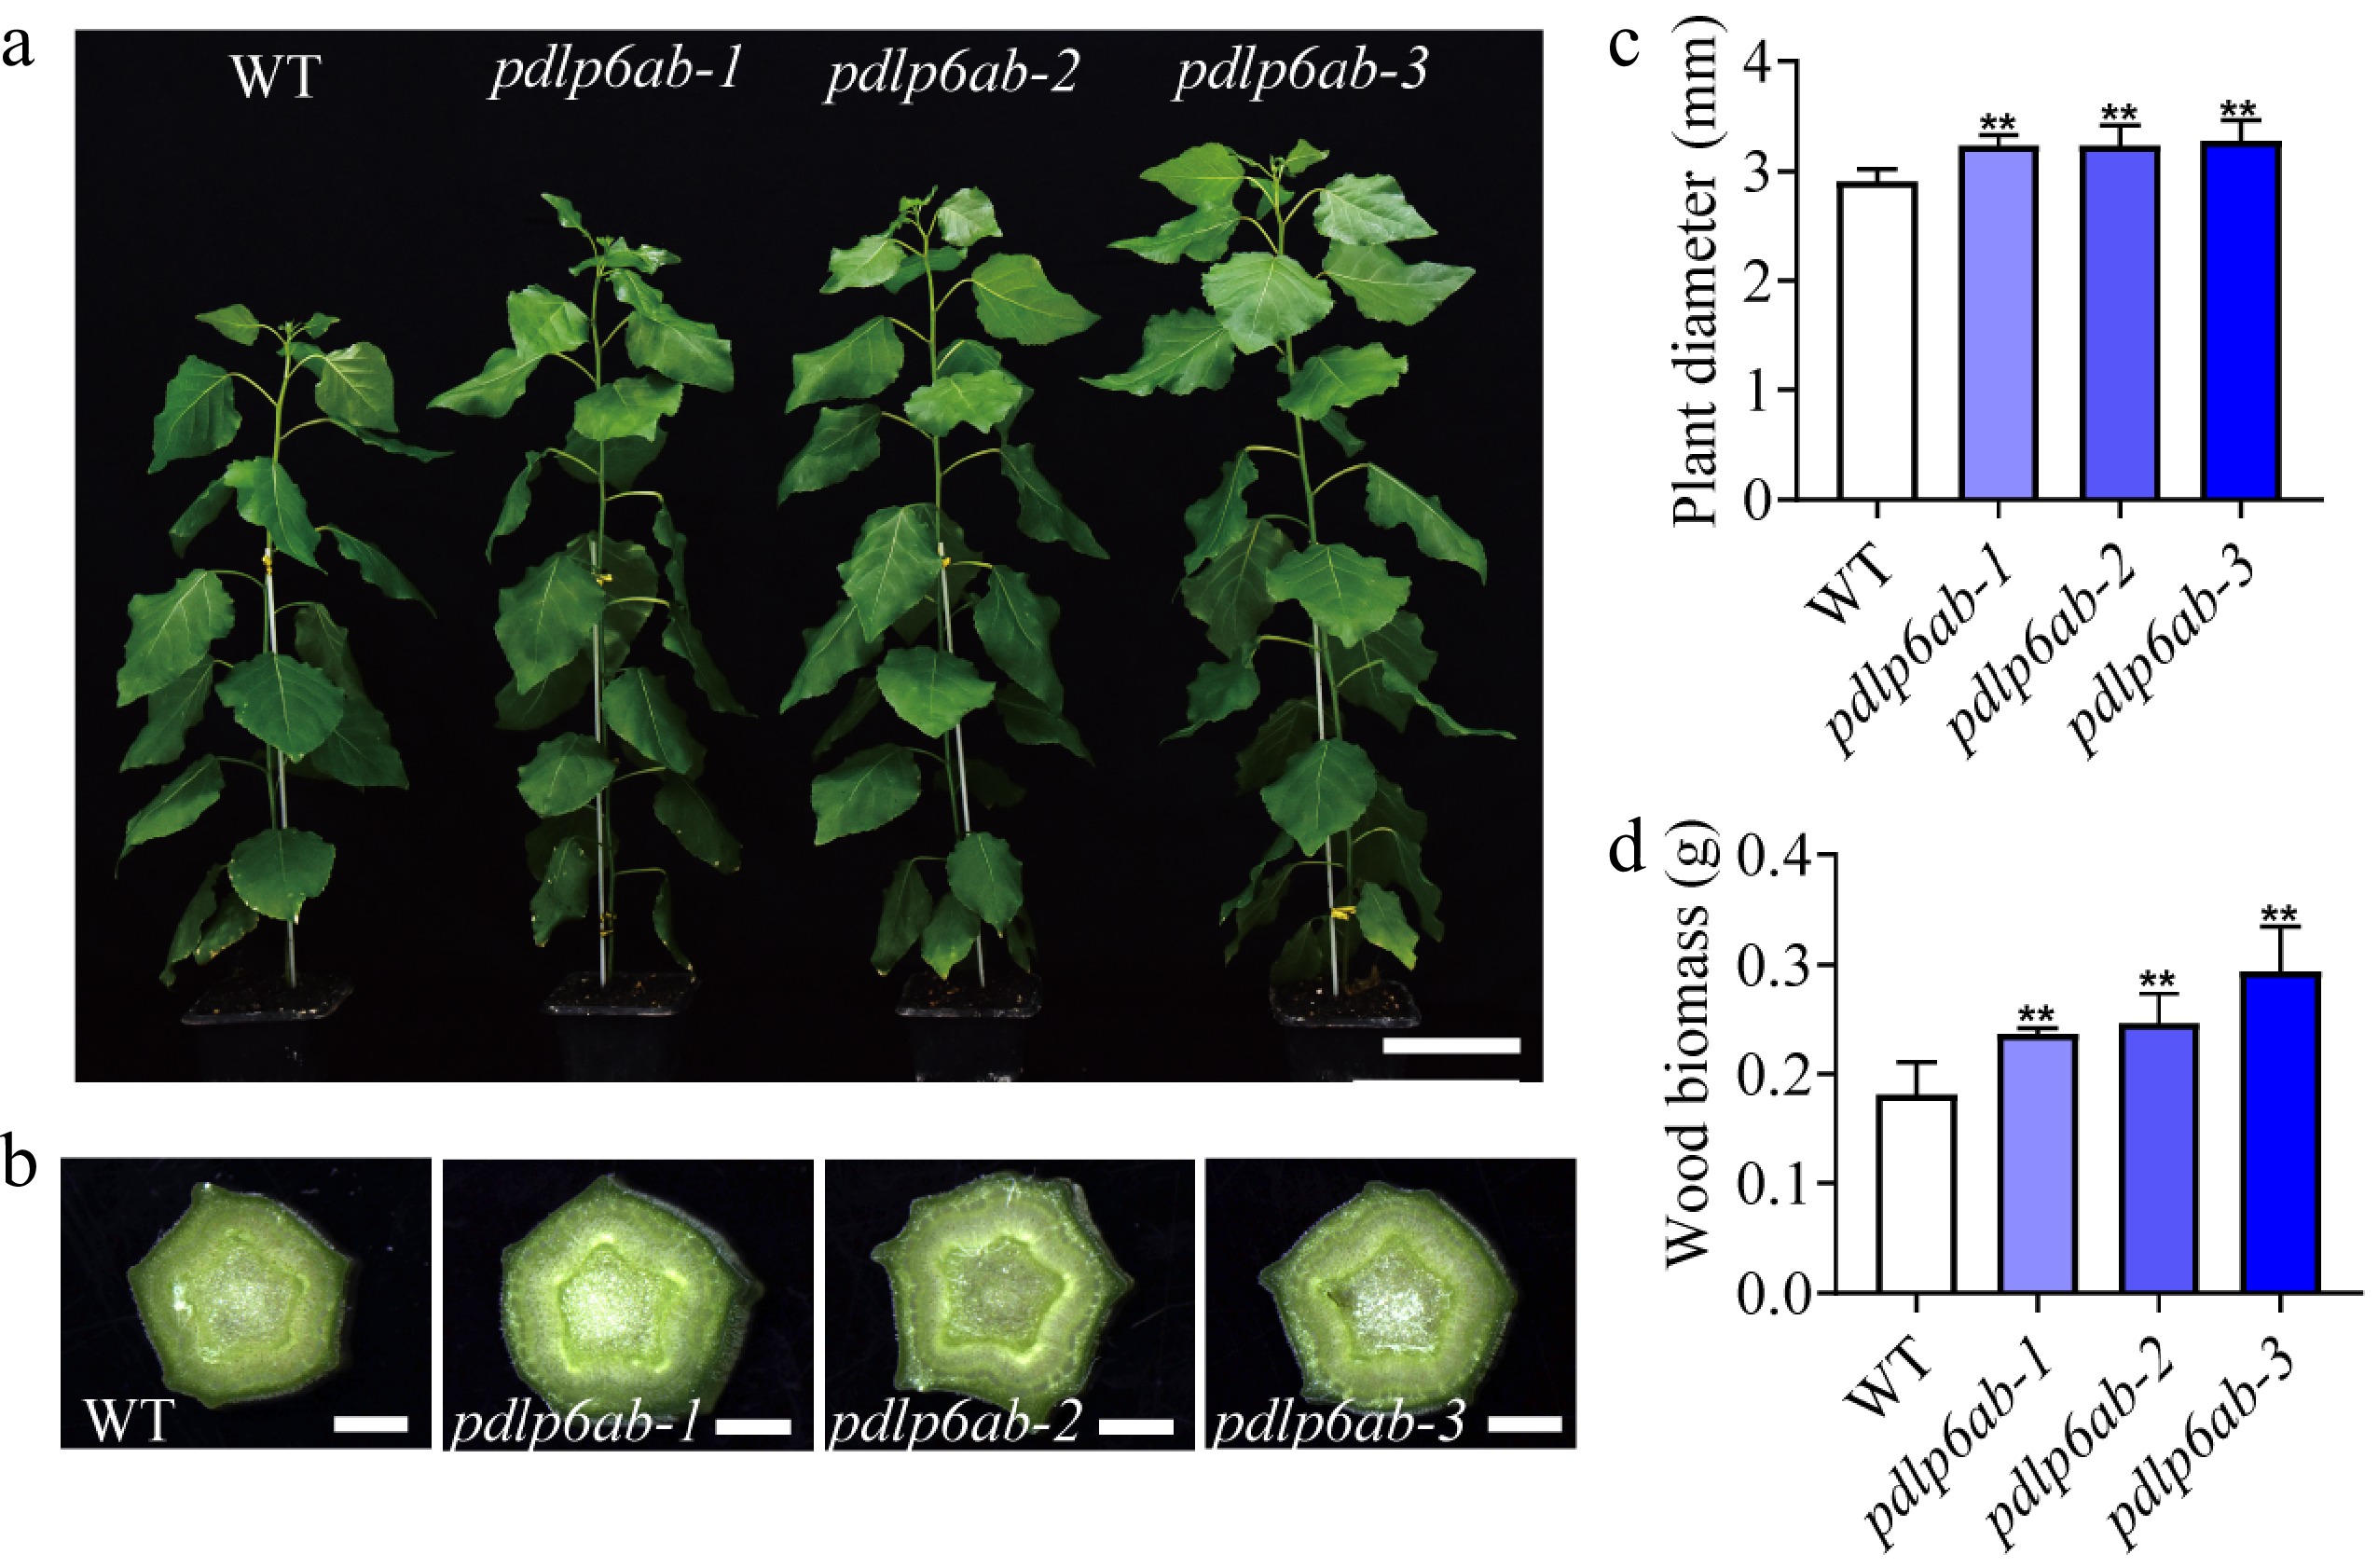
Figure 2.
PdPDLP6A and PdPDLP6B affect stem secondary growth. (a) Growth of WT and pdlp6ab double mutants. Scale bar = 10 cm. (b) Stem phenotypes of WT and pdlp6ab double mutants. Scale bar = 1 mm. (c) Stem diameter at the 10th internode. Values are means ± SD, n = 6, ** p < 0.01 (one-way ANOVA with Dunnett's test). (d) Xylem biomass of WT and pdlp6ab double mutants. Values are means ± SD, n = 4, ** p < 0.01 (one-way ANOVA with Dunnett's test).
-
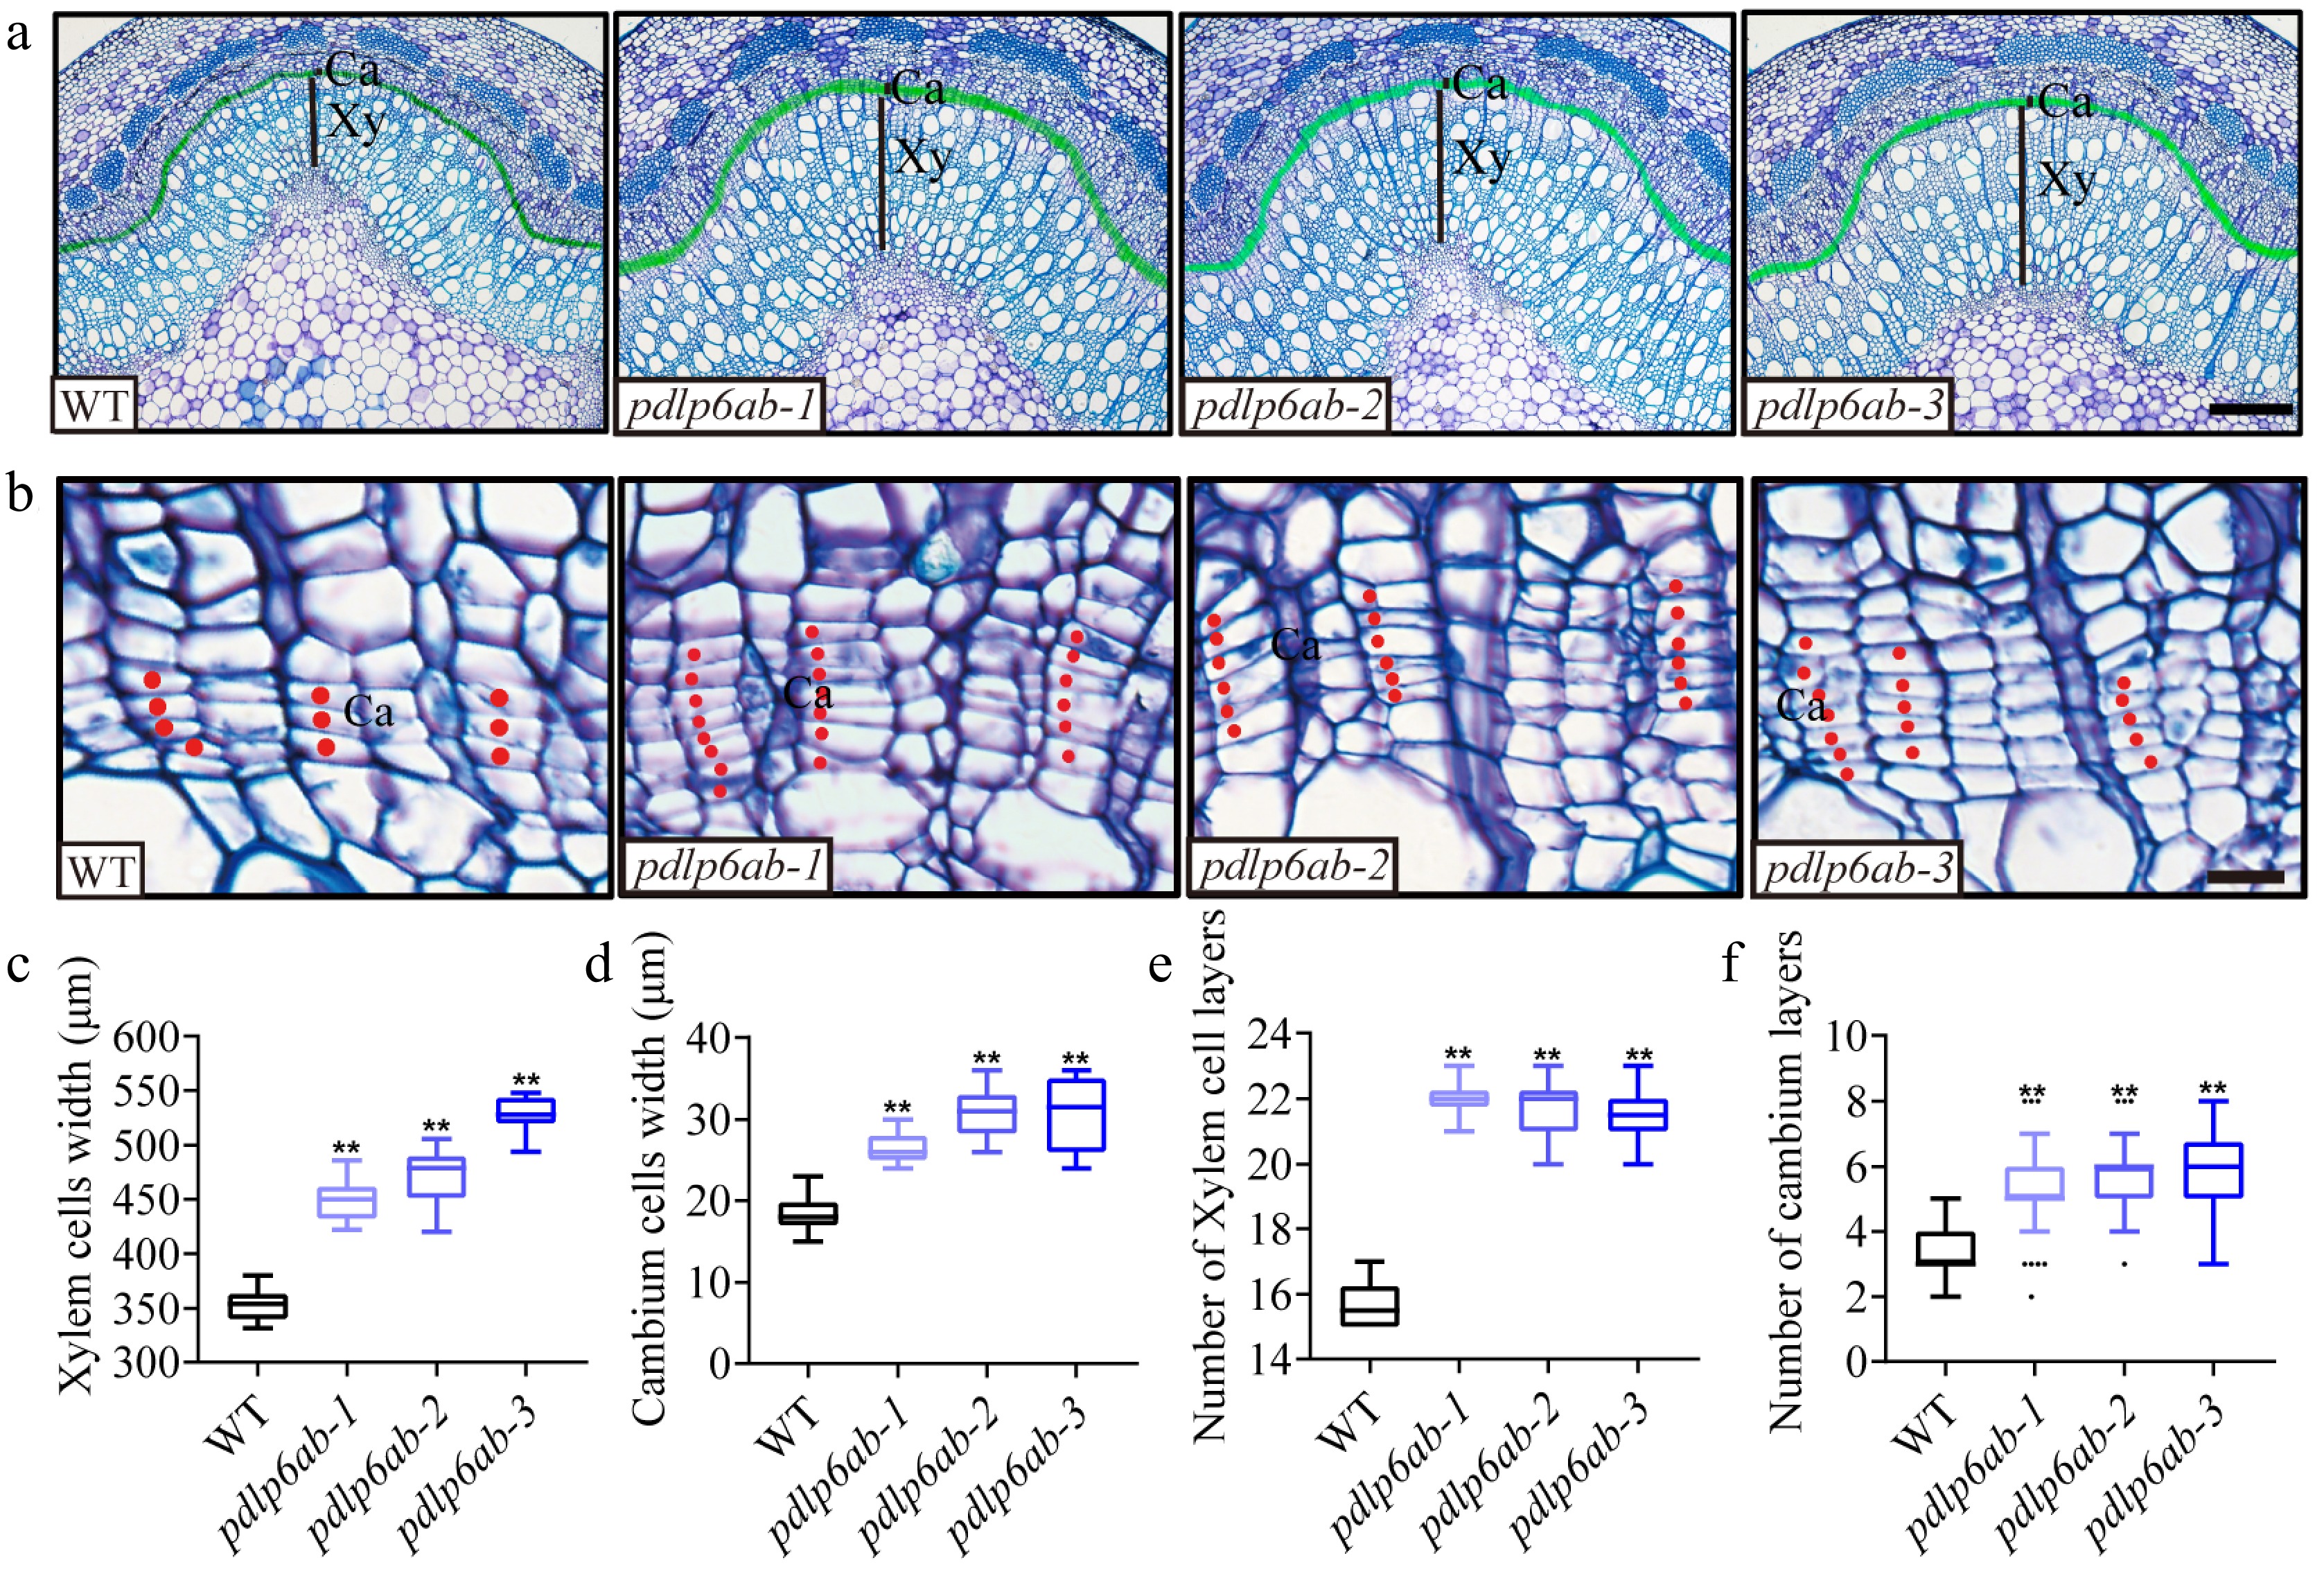
Figure 3.
PdPDLP6A and PdPDLP6B influence cambial division and xylem development. (a) Cross sections of the stems in the 13th internode stained with toluidine blue. Xy, xylem; Ca, cambium (indicated by the green shaded area). Scale bar = 200 μm. (b) Cross sections of the cambial zone. Red dots mark individual cambium cells. Ca, cambium. Scale bar = 20 μm. (c), (d) Width of xylem region and cambial zone. Values are means ± SD, n = 5, ** p < 0.01 (one-way ANOVA with Dunnett's test). (e), (f) Cell layer numbers of xylem and cambial zone. Values are means ± SD, n = 5, ** p < 0.01 (one-way ANOVA with Dunnett's test).
-
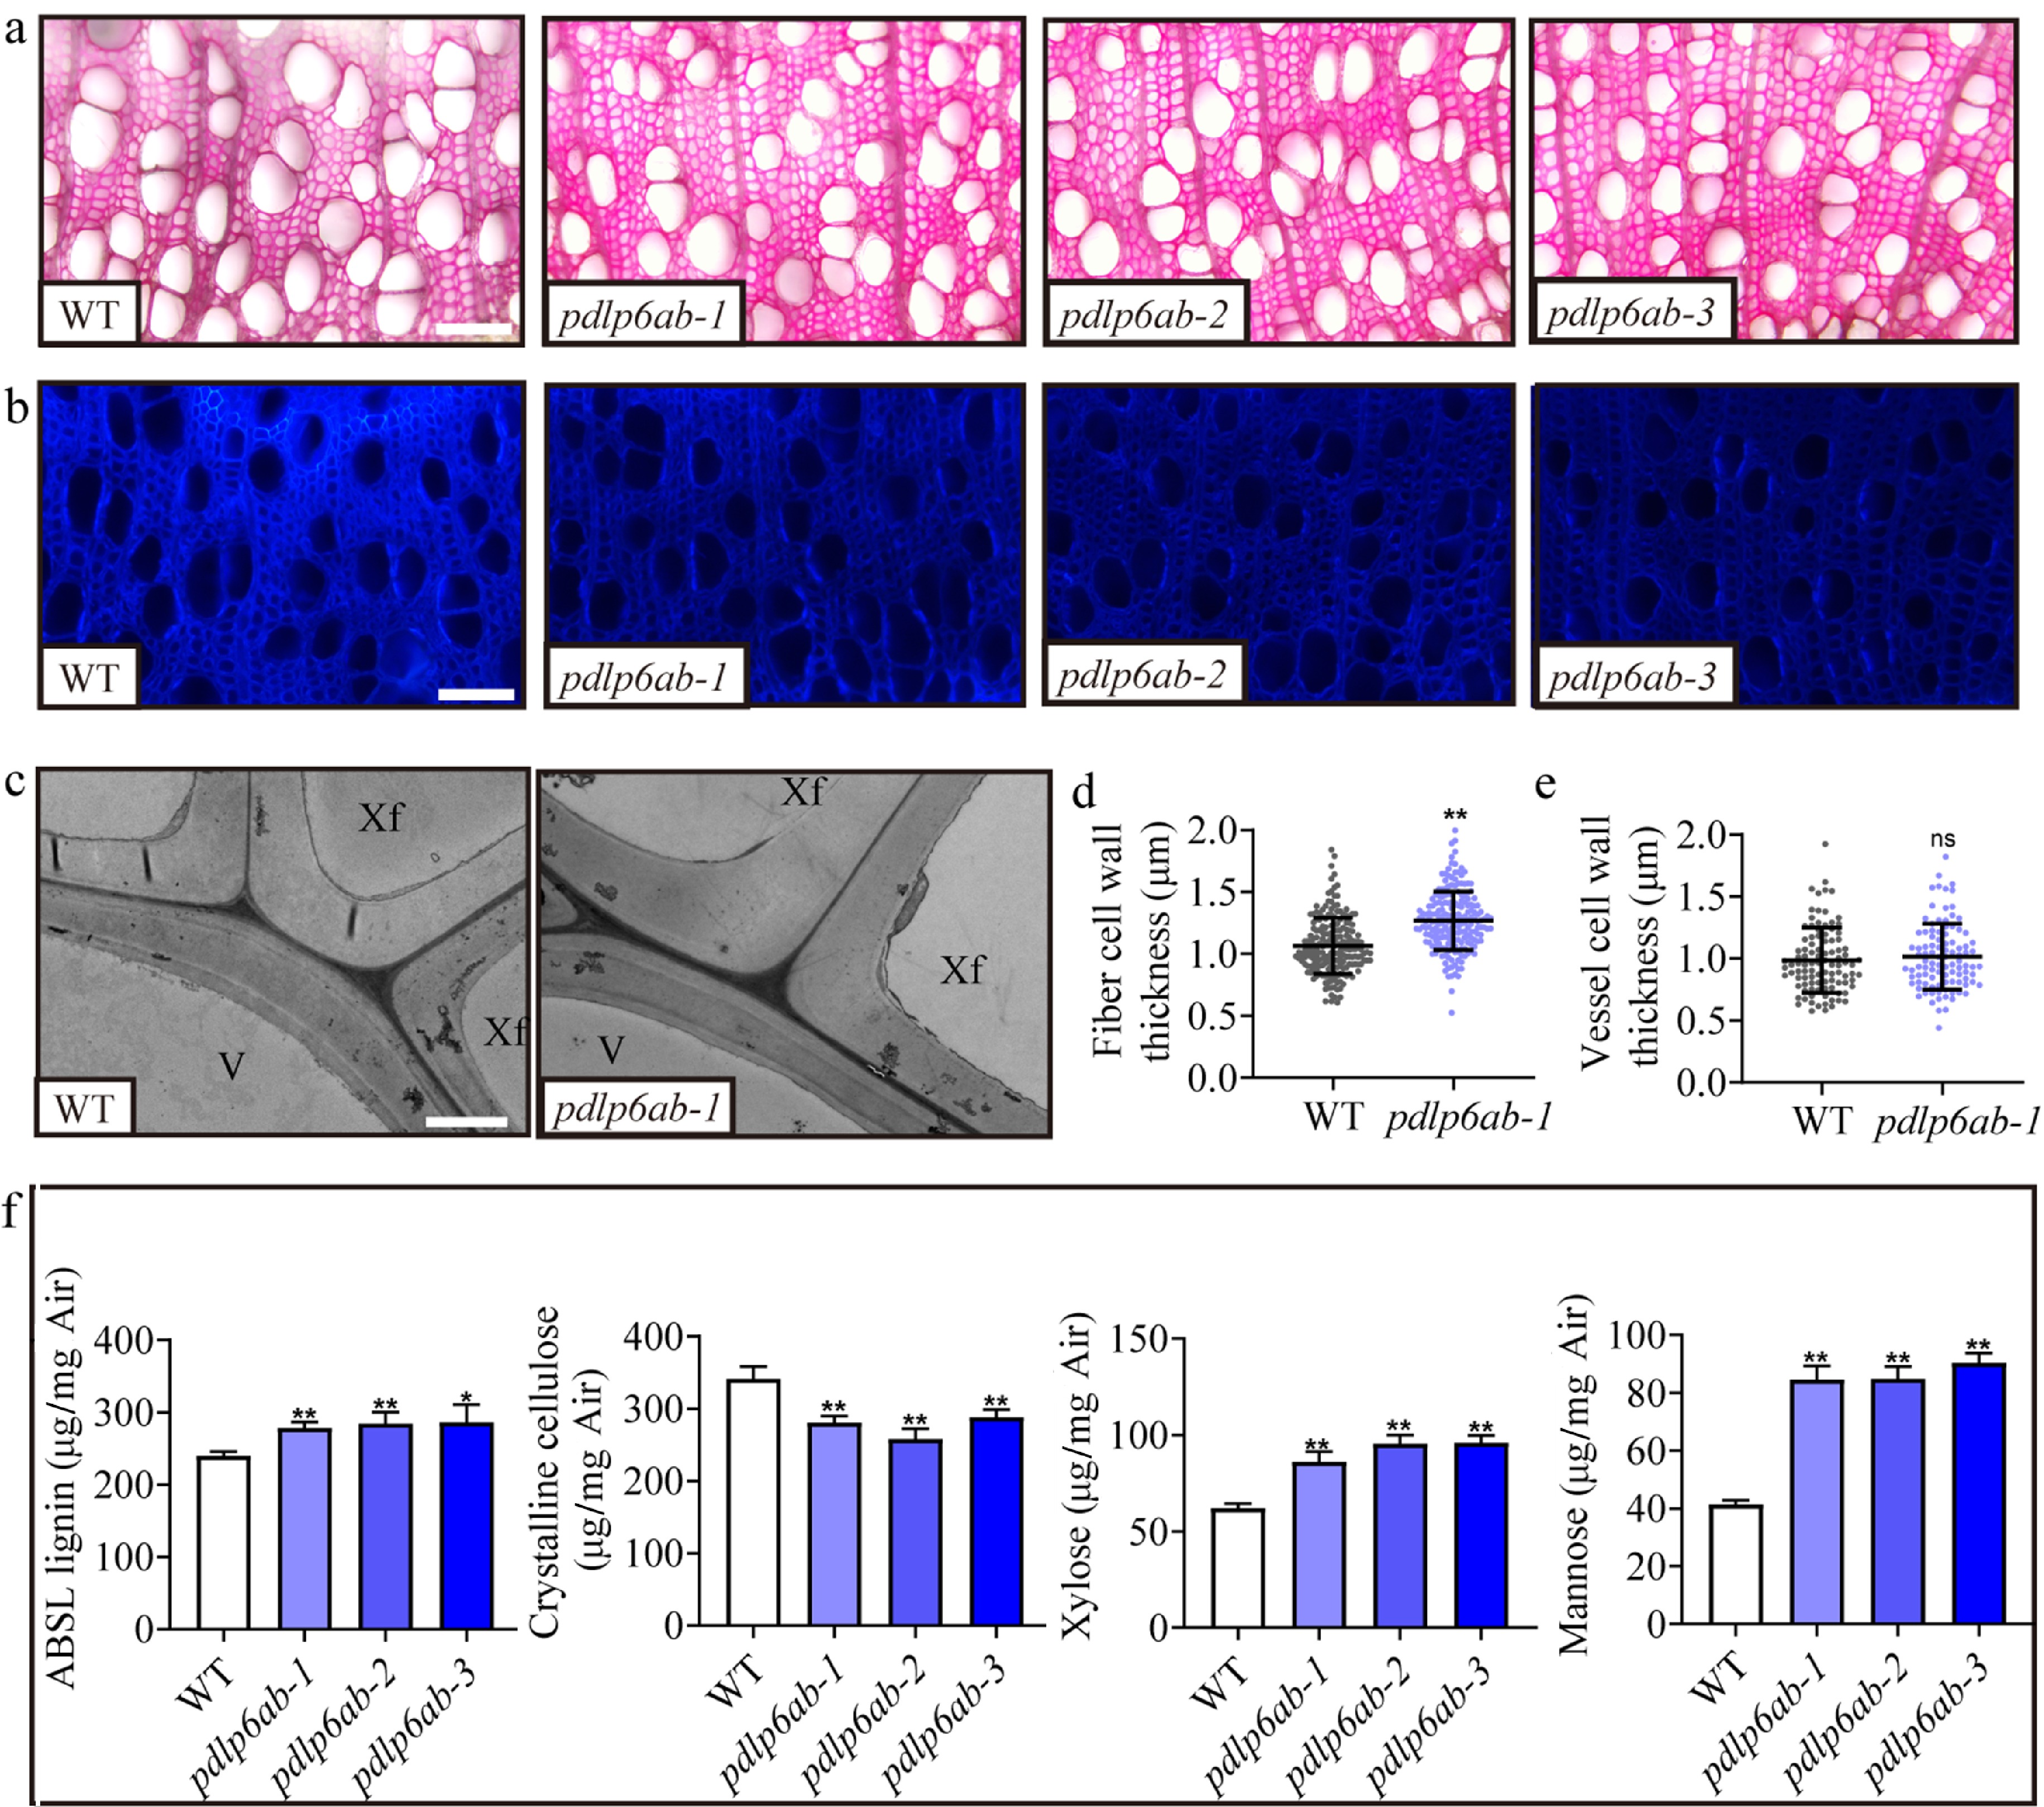
Figure 4.
PdPDLP6A and PdPDLP6B are involved in SCW thickening. (a) Cross sections of the stems in the 14th internode stained with phloroglucinol. Scale bar = 200 μm. (b) Cross sections of the stems at the 14th internode stained with Calcofluor White. Scale bar = 200 μm. (c) Transmission electron microscopy images of cell walls at the 14th internode. Scale bar = 2 μm. V, vessel; Xf, xylem fiber. (d) Quantification of xylem fiber and vessel cell wall thickness. Values are means ± SD, n = 5, ** p < 0.01 (Student's t-test). (e)–(f) Contents of cell wall components (lignin, cellulose, xylose, and mannose). Values are means ± SD, n = 3, ** p < 0.01 (one-way ANOVA with Dunnett's test).
-
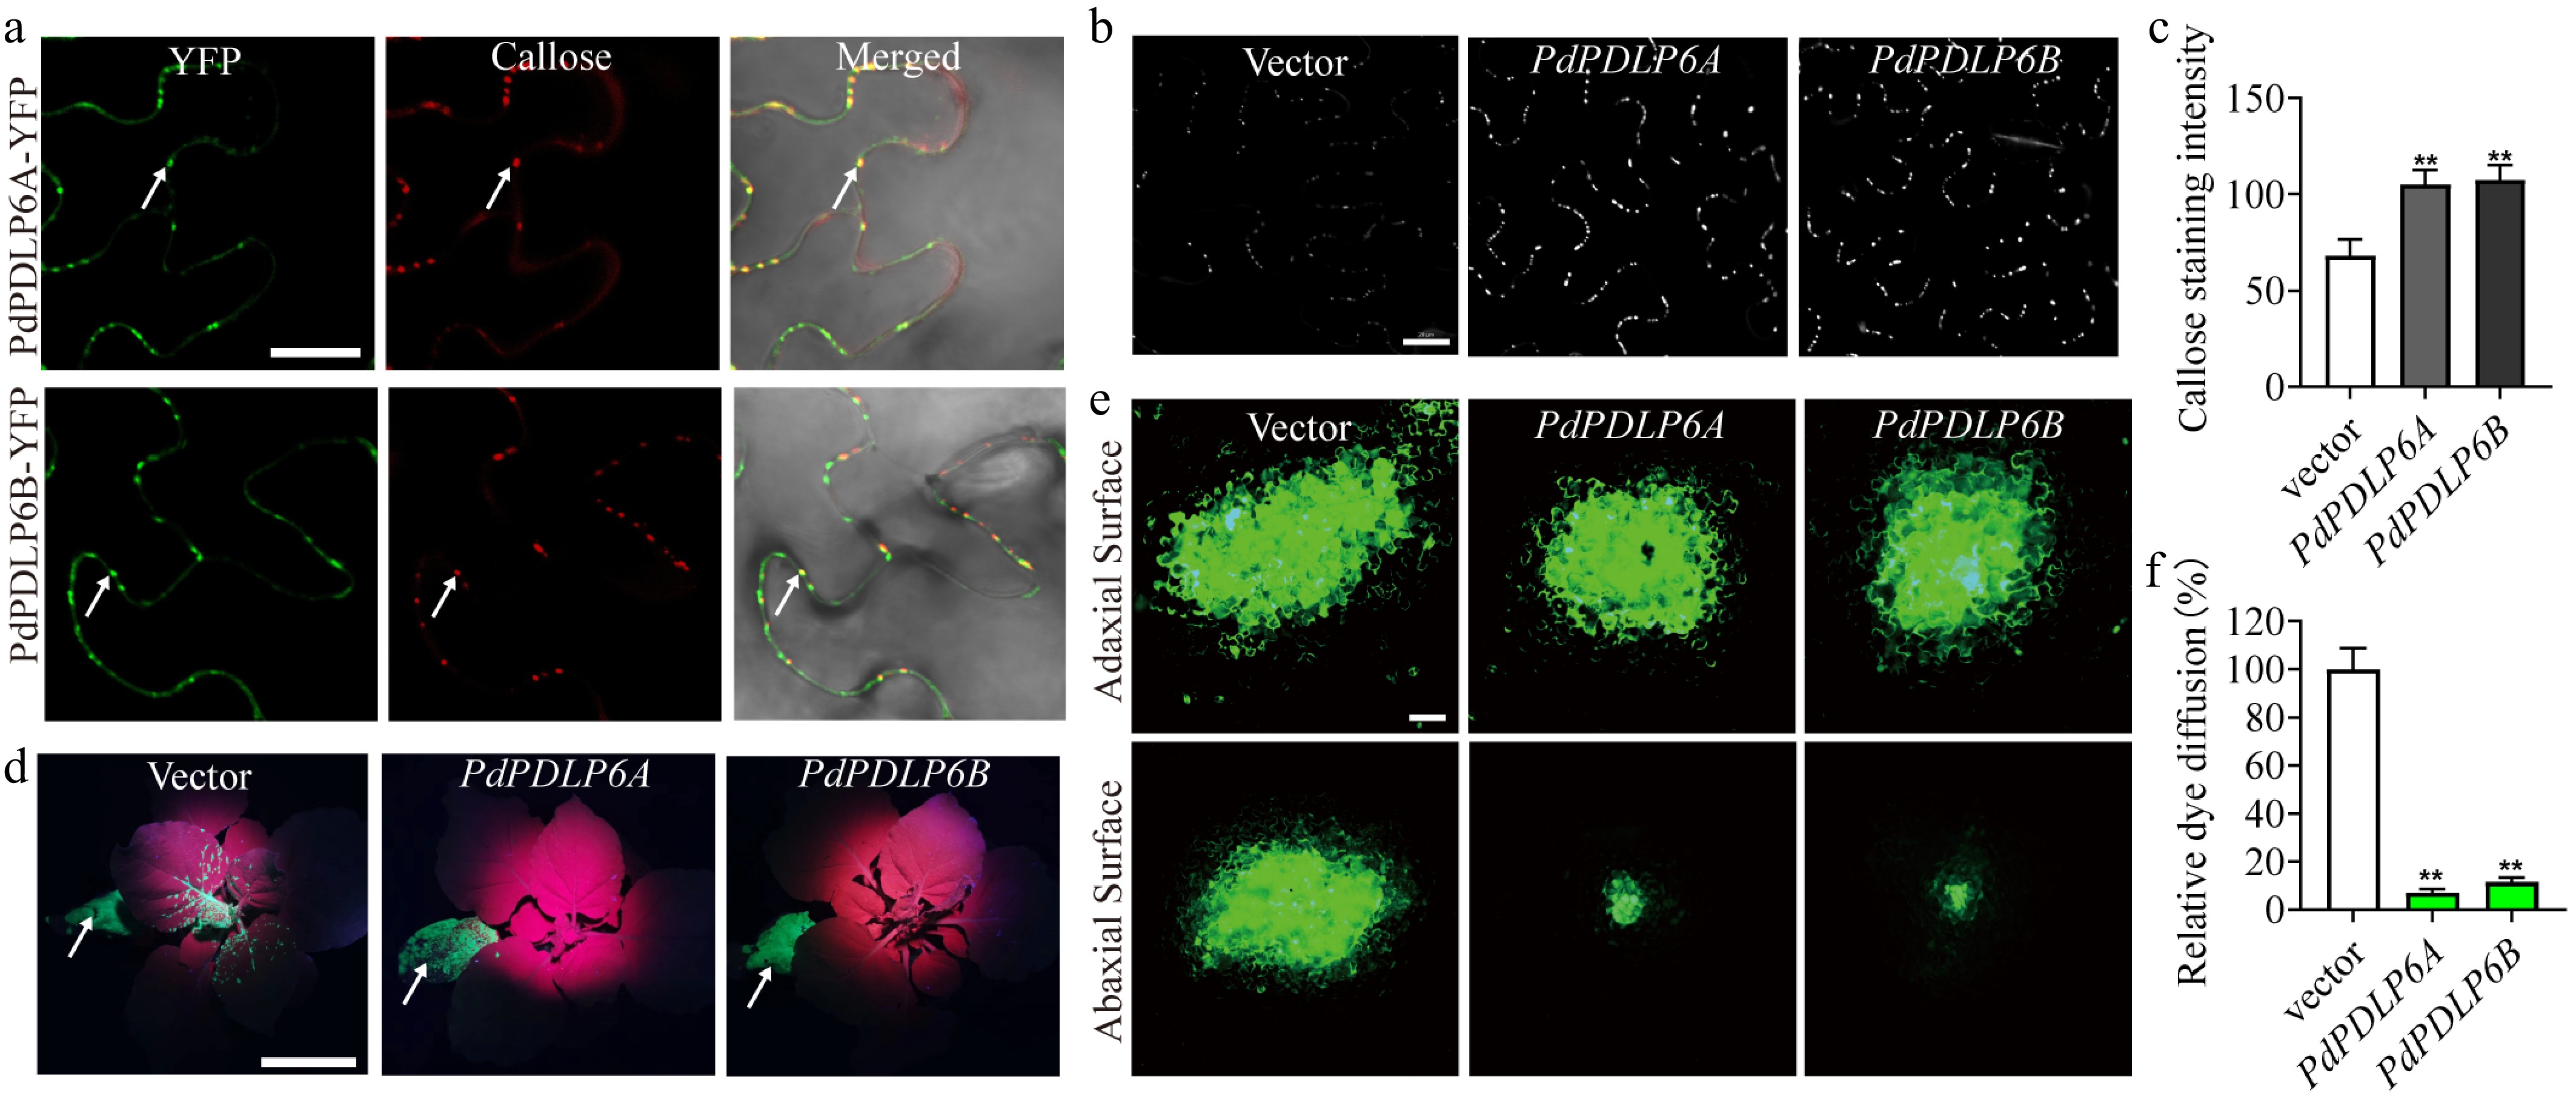
Figure 5.
PdPDLP6A and PdPDLP6B associate with callose at PD and reduce symplastic transport. (a) Subcellular localization of PdPDLP6A and PdPDLP6B. Callose is stained with aniline blue (red pseudocolor). Arrows point to sites of PdPDLP6A/6B and callose colocalization. Scale bar = 20 μm. (b) Punctate callose deposition detected by aniline blue staining, consistent with plasmodesmata localization. Scale bar = 20 μm. (c) Quantification of aniline blue fluorescence intensity in (b). Values are means ± SD, n = 5, ** p < 0.01 (one-way ANOVA with Dunnett's test). (d) TMV-GFP infiltration site (arrow). Expression of PdPDLP6A or PdPDLP6B restricted viral movement to the apical region. Scale bar = 5 cm. (e) CFDA dye loading on the adaxial side (upper panel) and fluorescence signal detected on the abaxial side (lower panel). Scale bar = 20 μm. (f) Statistics of relative CF dye diffusion area in (e). Values are means ± SD, n = 4, ** p < 0.01 (one-way ANOVA with Dunnett's test).
-
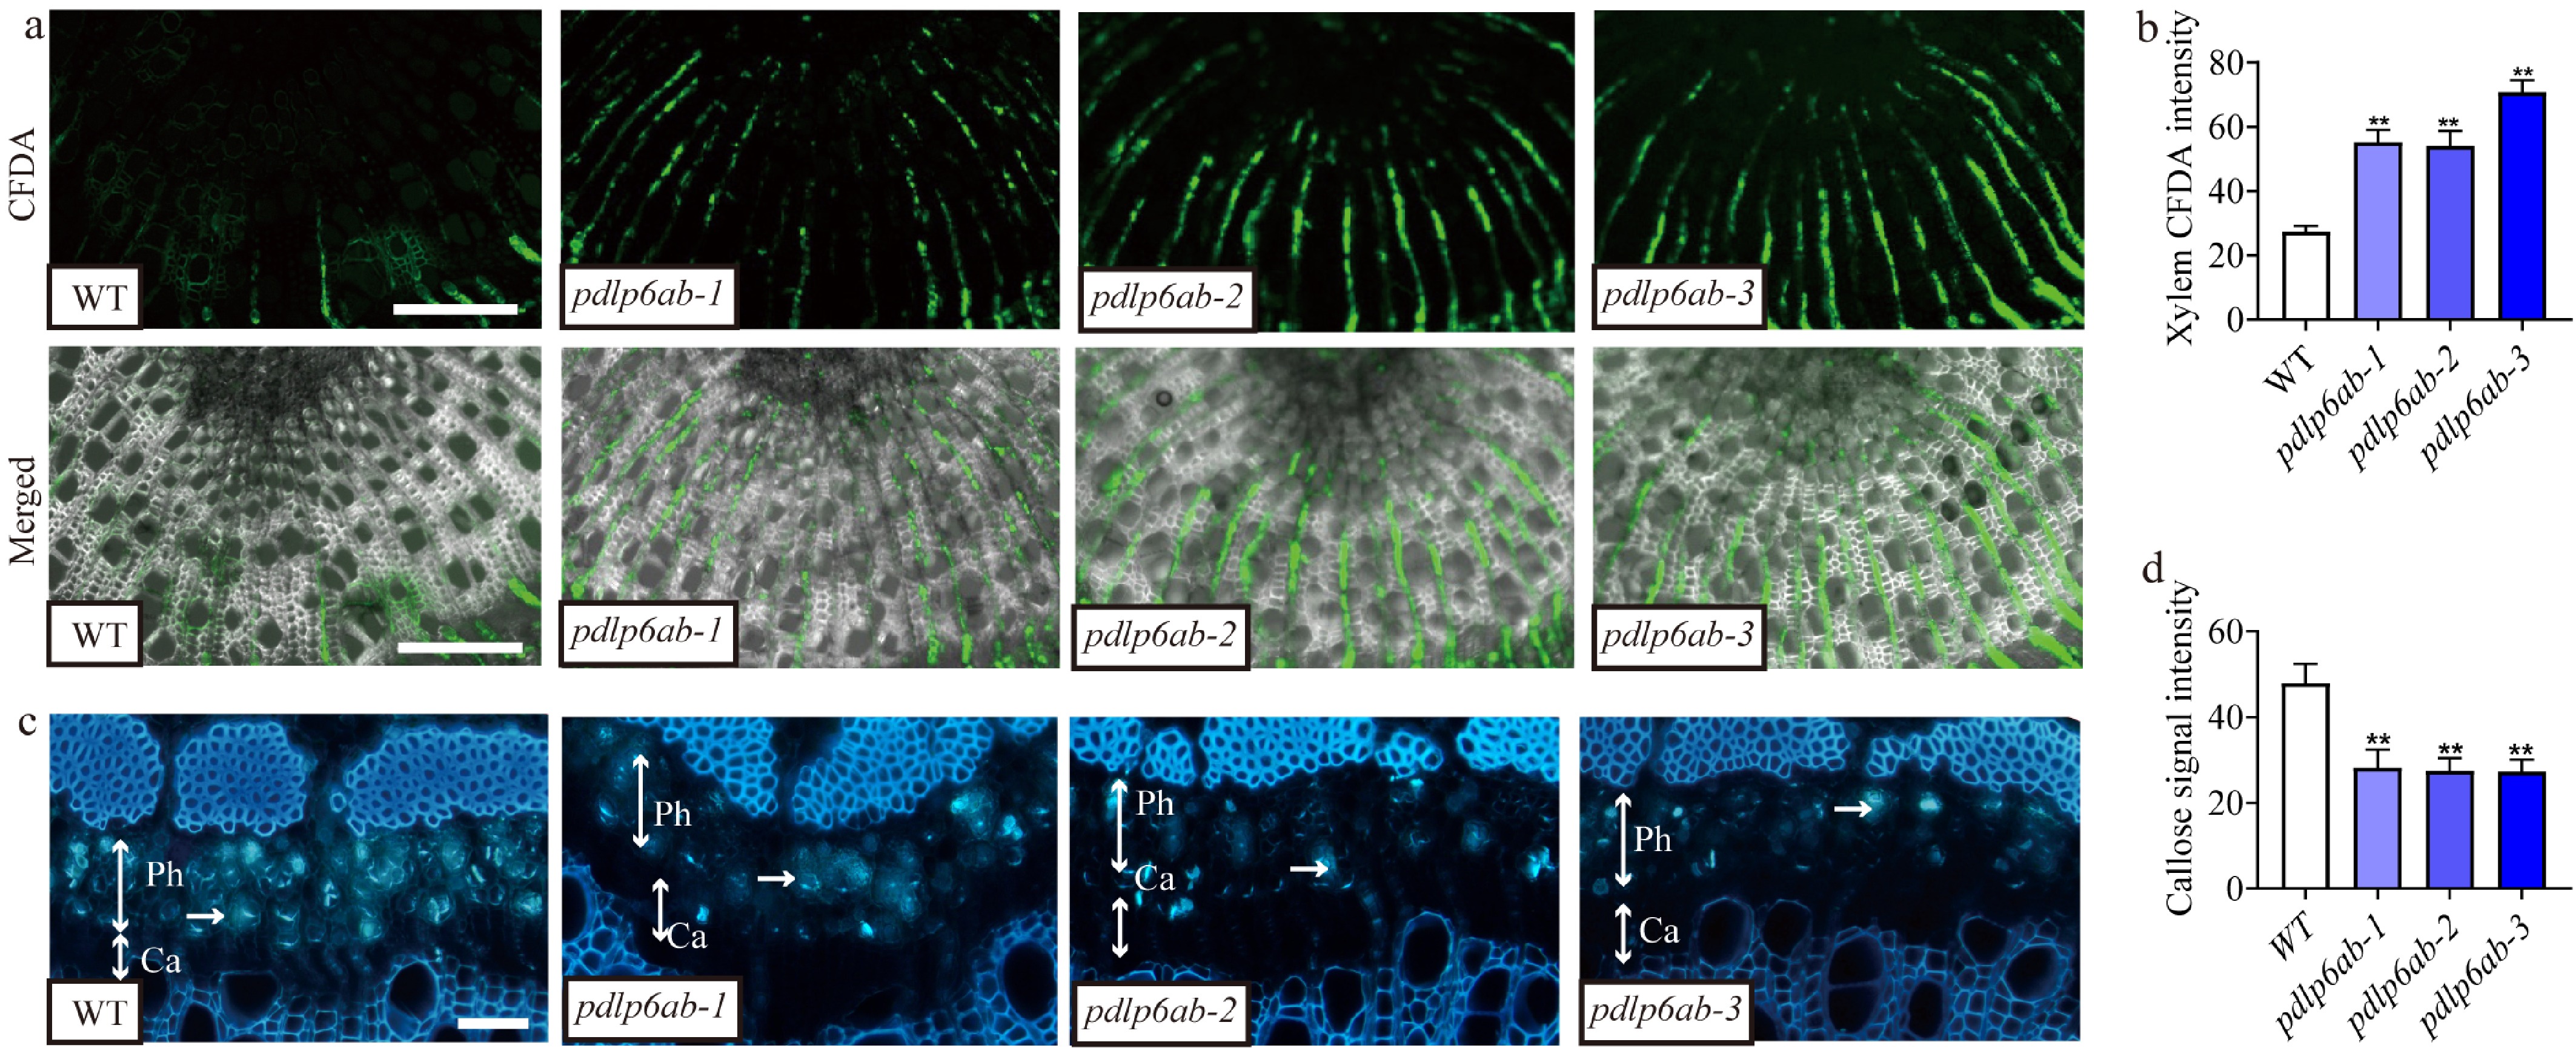
Figure 6.
Editing of PdPDLP6A and PdPDLP6B enhanced symplastic transport across the stem. (a) The fluorescent dye CFDA was used to examine symplastic transport in the Populus stem at the 14th internode. The fluorescence signal was detected in the xylem, indicating symplastic spread. Scale bar = 200 μm. (b) Quantification of the CF fluorescence signal intensity in (a). Values are means ± SD, n = 5, ** p < 0.01 (one-way ANOVA with Dunnett's test). (c) Callose stained by aniline blue was detected in the phloem and cambial zone of Populus stems at the 12th internode. Single-headed arrows indicate the stained callose, and two-headed arrows indicate the phloem and cambial zone. Ph, phloem; Ca, cambium. Scale bar = 20 μm. (d) Quantification of the callose fluorescence signal intensity in (c). Values are means ± SD, n = 5, ** p < 0.01 (one-way ANOVA with Dunnett's test).
-
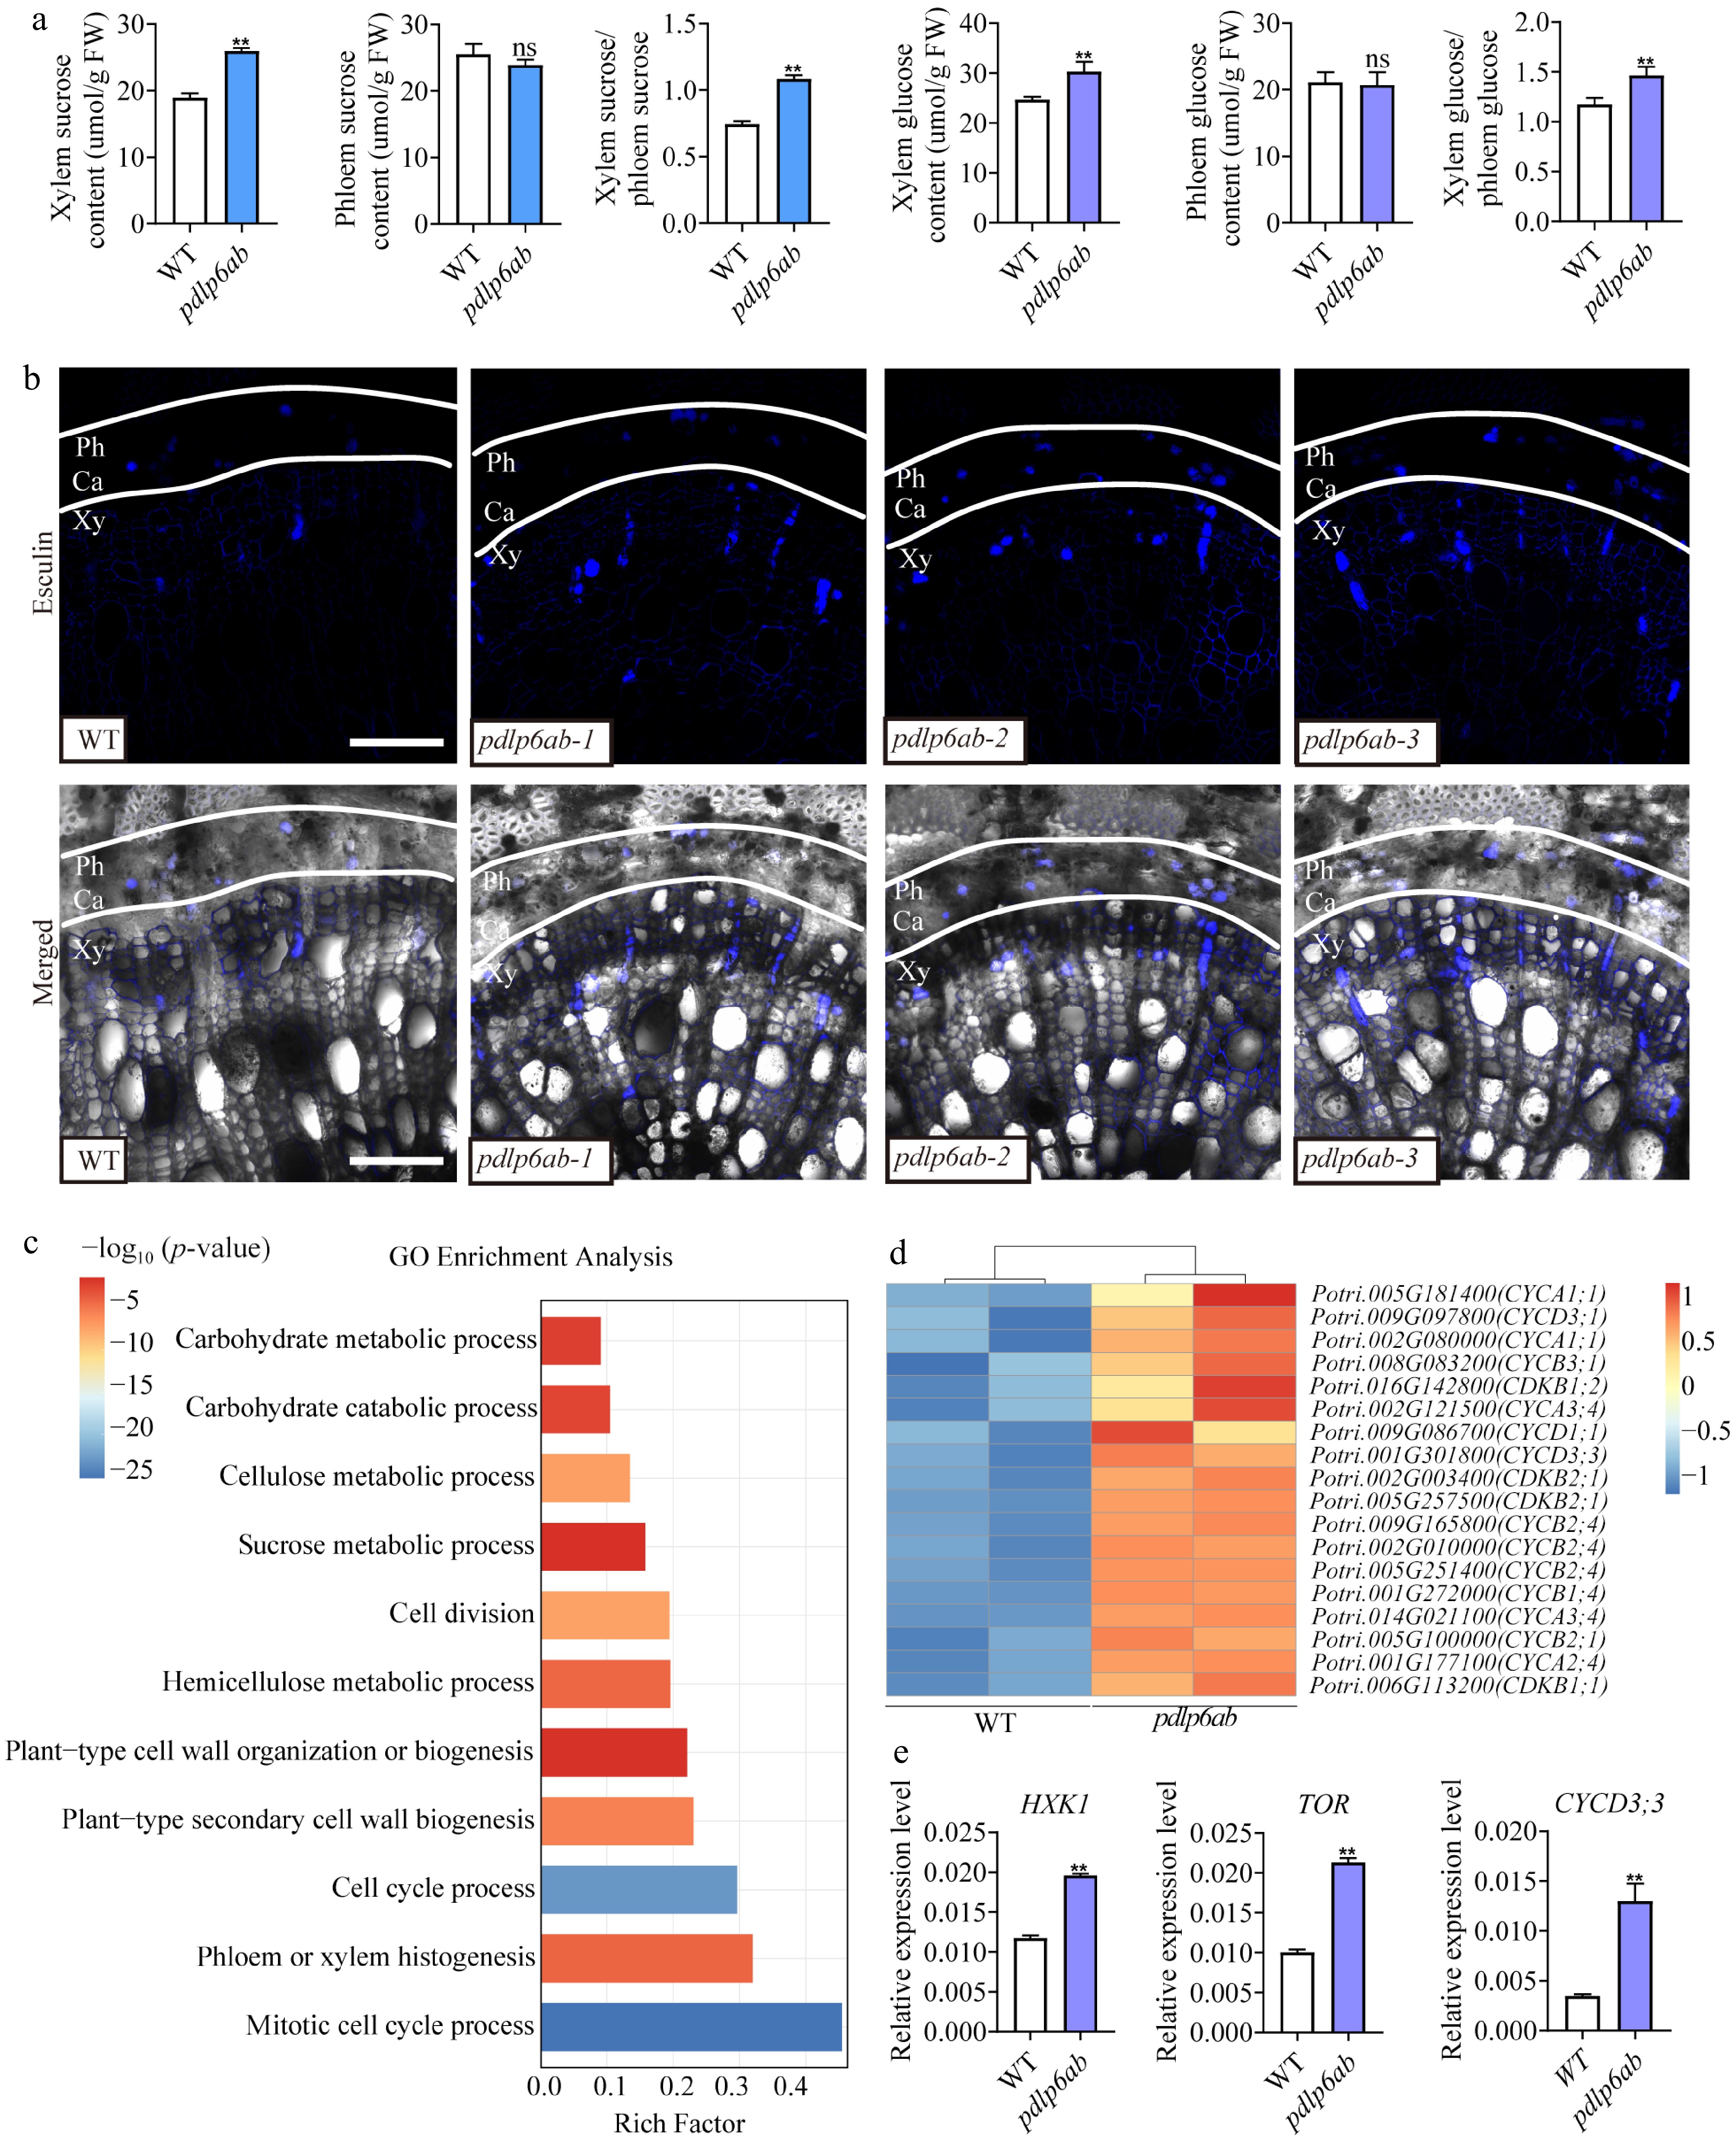
Figure 7.
Editing of PdPDLP6A and PdPDLP6B affects sugar transport. (a) Quantification of sucrose and glucose in the phloem and xylem of Populus stems at the 14th internode. Values are means ± SD, n = 3, ** p < 0.01 (Student's t-test). (b) The fluorescent sucrose analog esculin was used to visualize sucrose distribution in the Populus stems at the 14th internode. Ca, cambium; Ph, phloem; Xy, xylem. Scale bar = 100 μm. (c) GO enrichment analysis of differentially expressed genes (pdlp6ab vs WT). (d) The heatmap shows the relative expression of the cell cycle-related genes in WT and pdlp6ab plants. The color scale represents relative expression levels. (e) Relative expression levels of HXK1, TOR, and CYCD3;3 determined by qRT-PCR. Values are means ± SD, n = 3 biological replicates per genotype, ** p < 0.01 (Student's t-test).
Figures
(7)
Tables
(0)