-
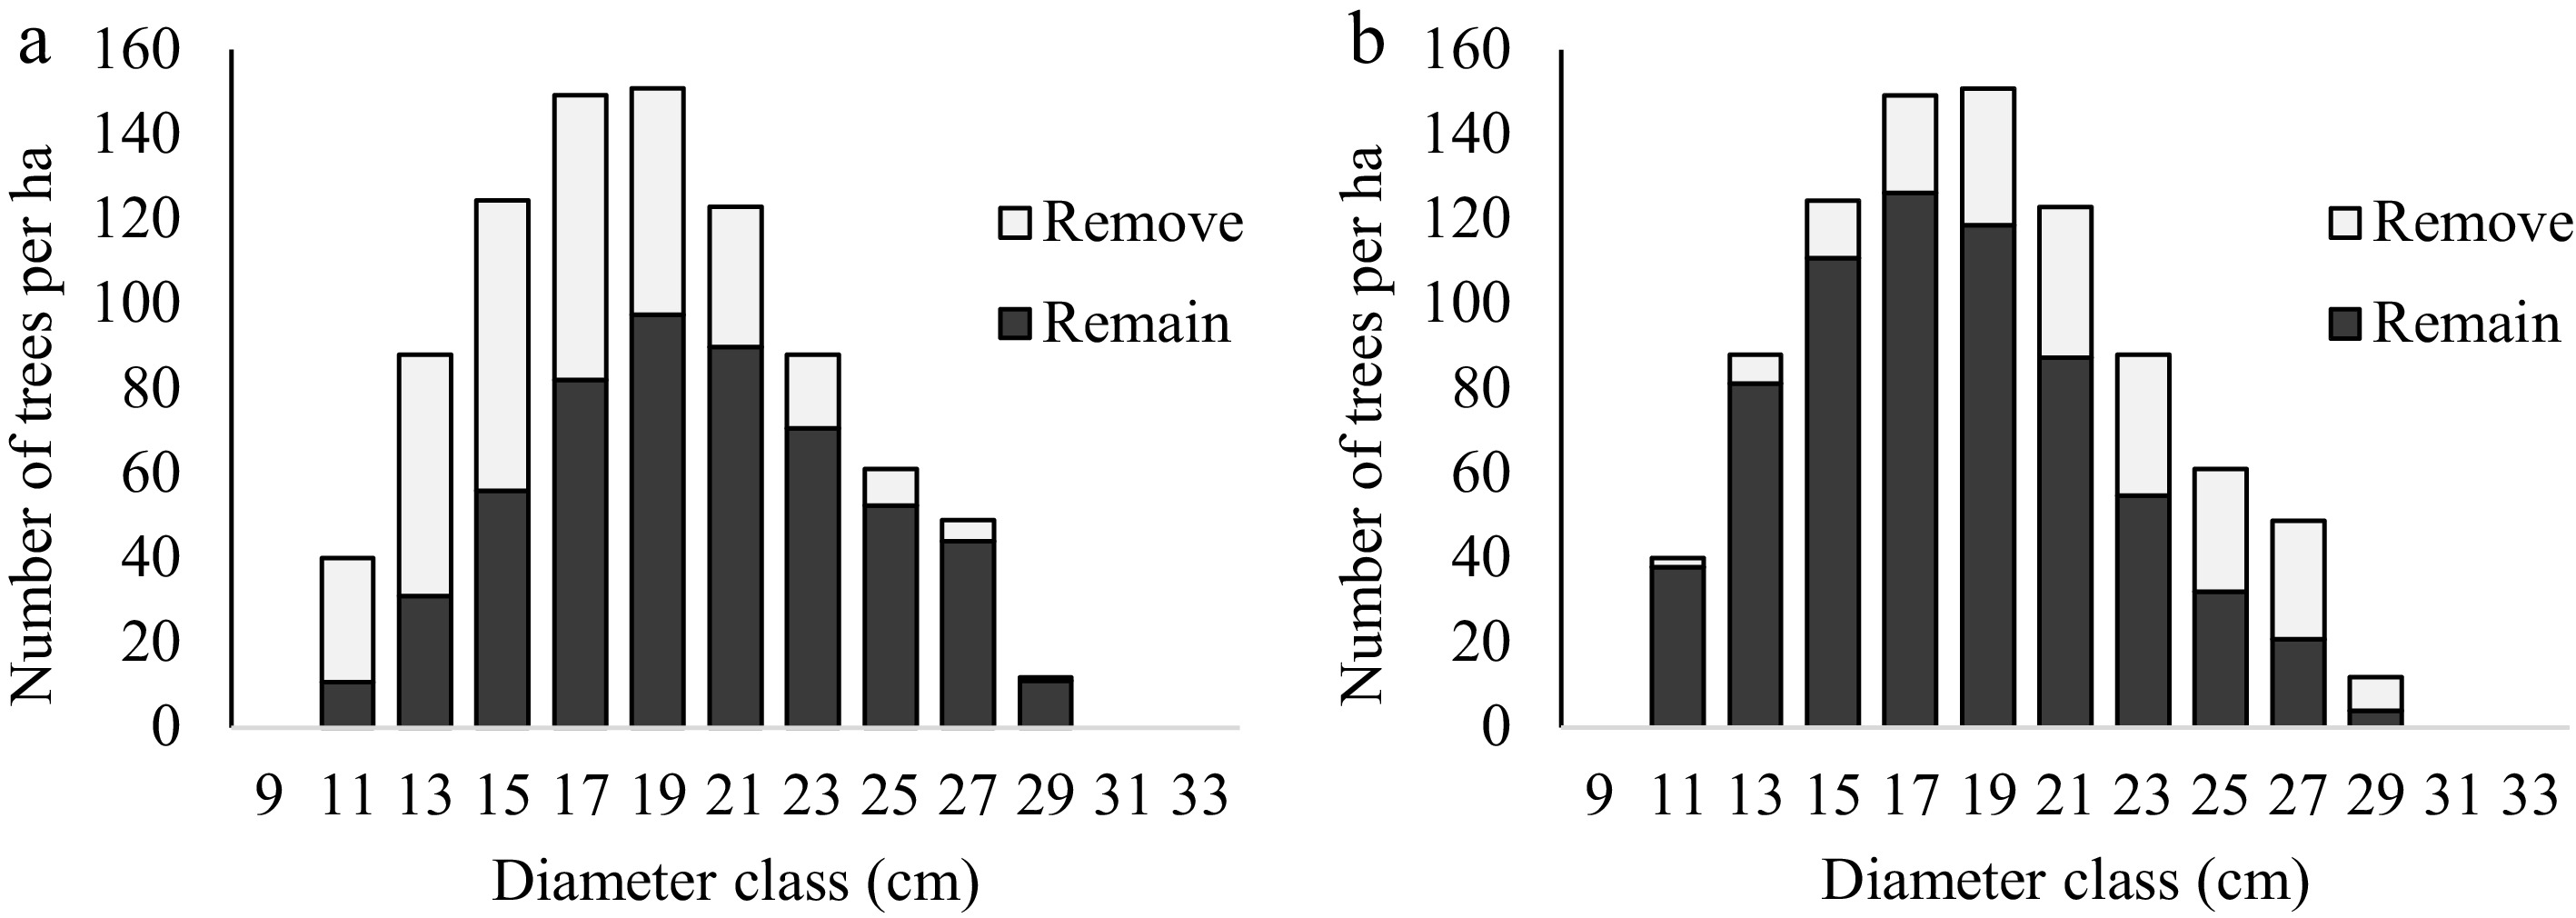
Figure 1.
(a) Thinning from below and (b) from above when 30% of the basal area is removed.
-
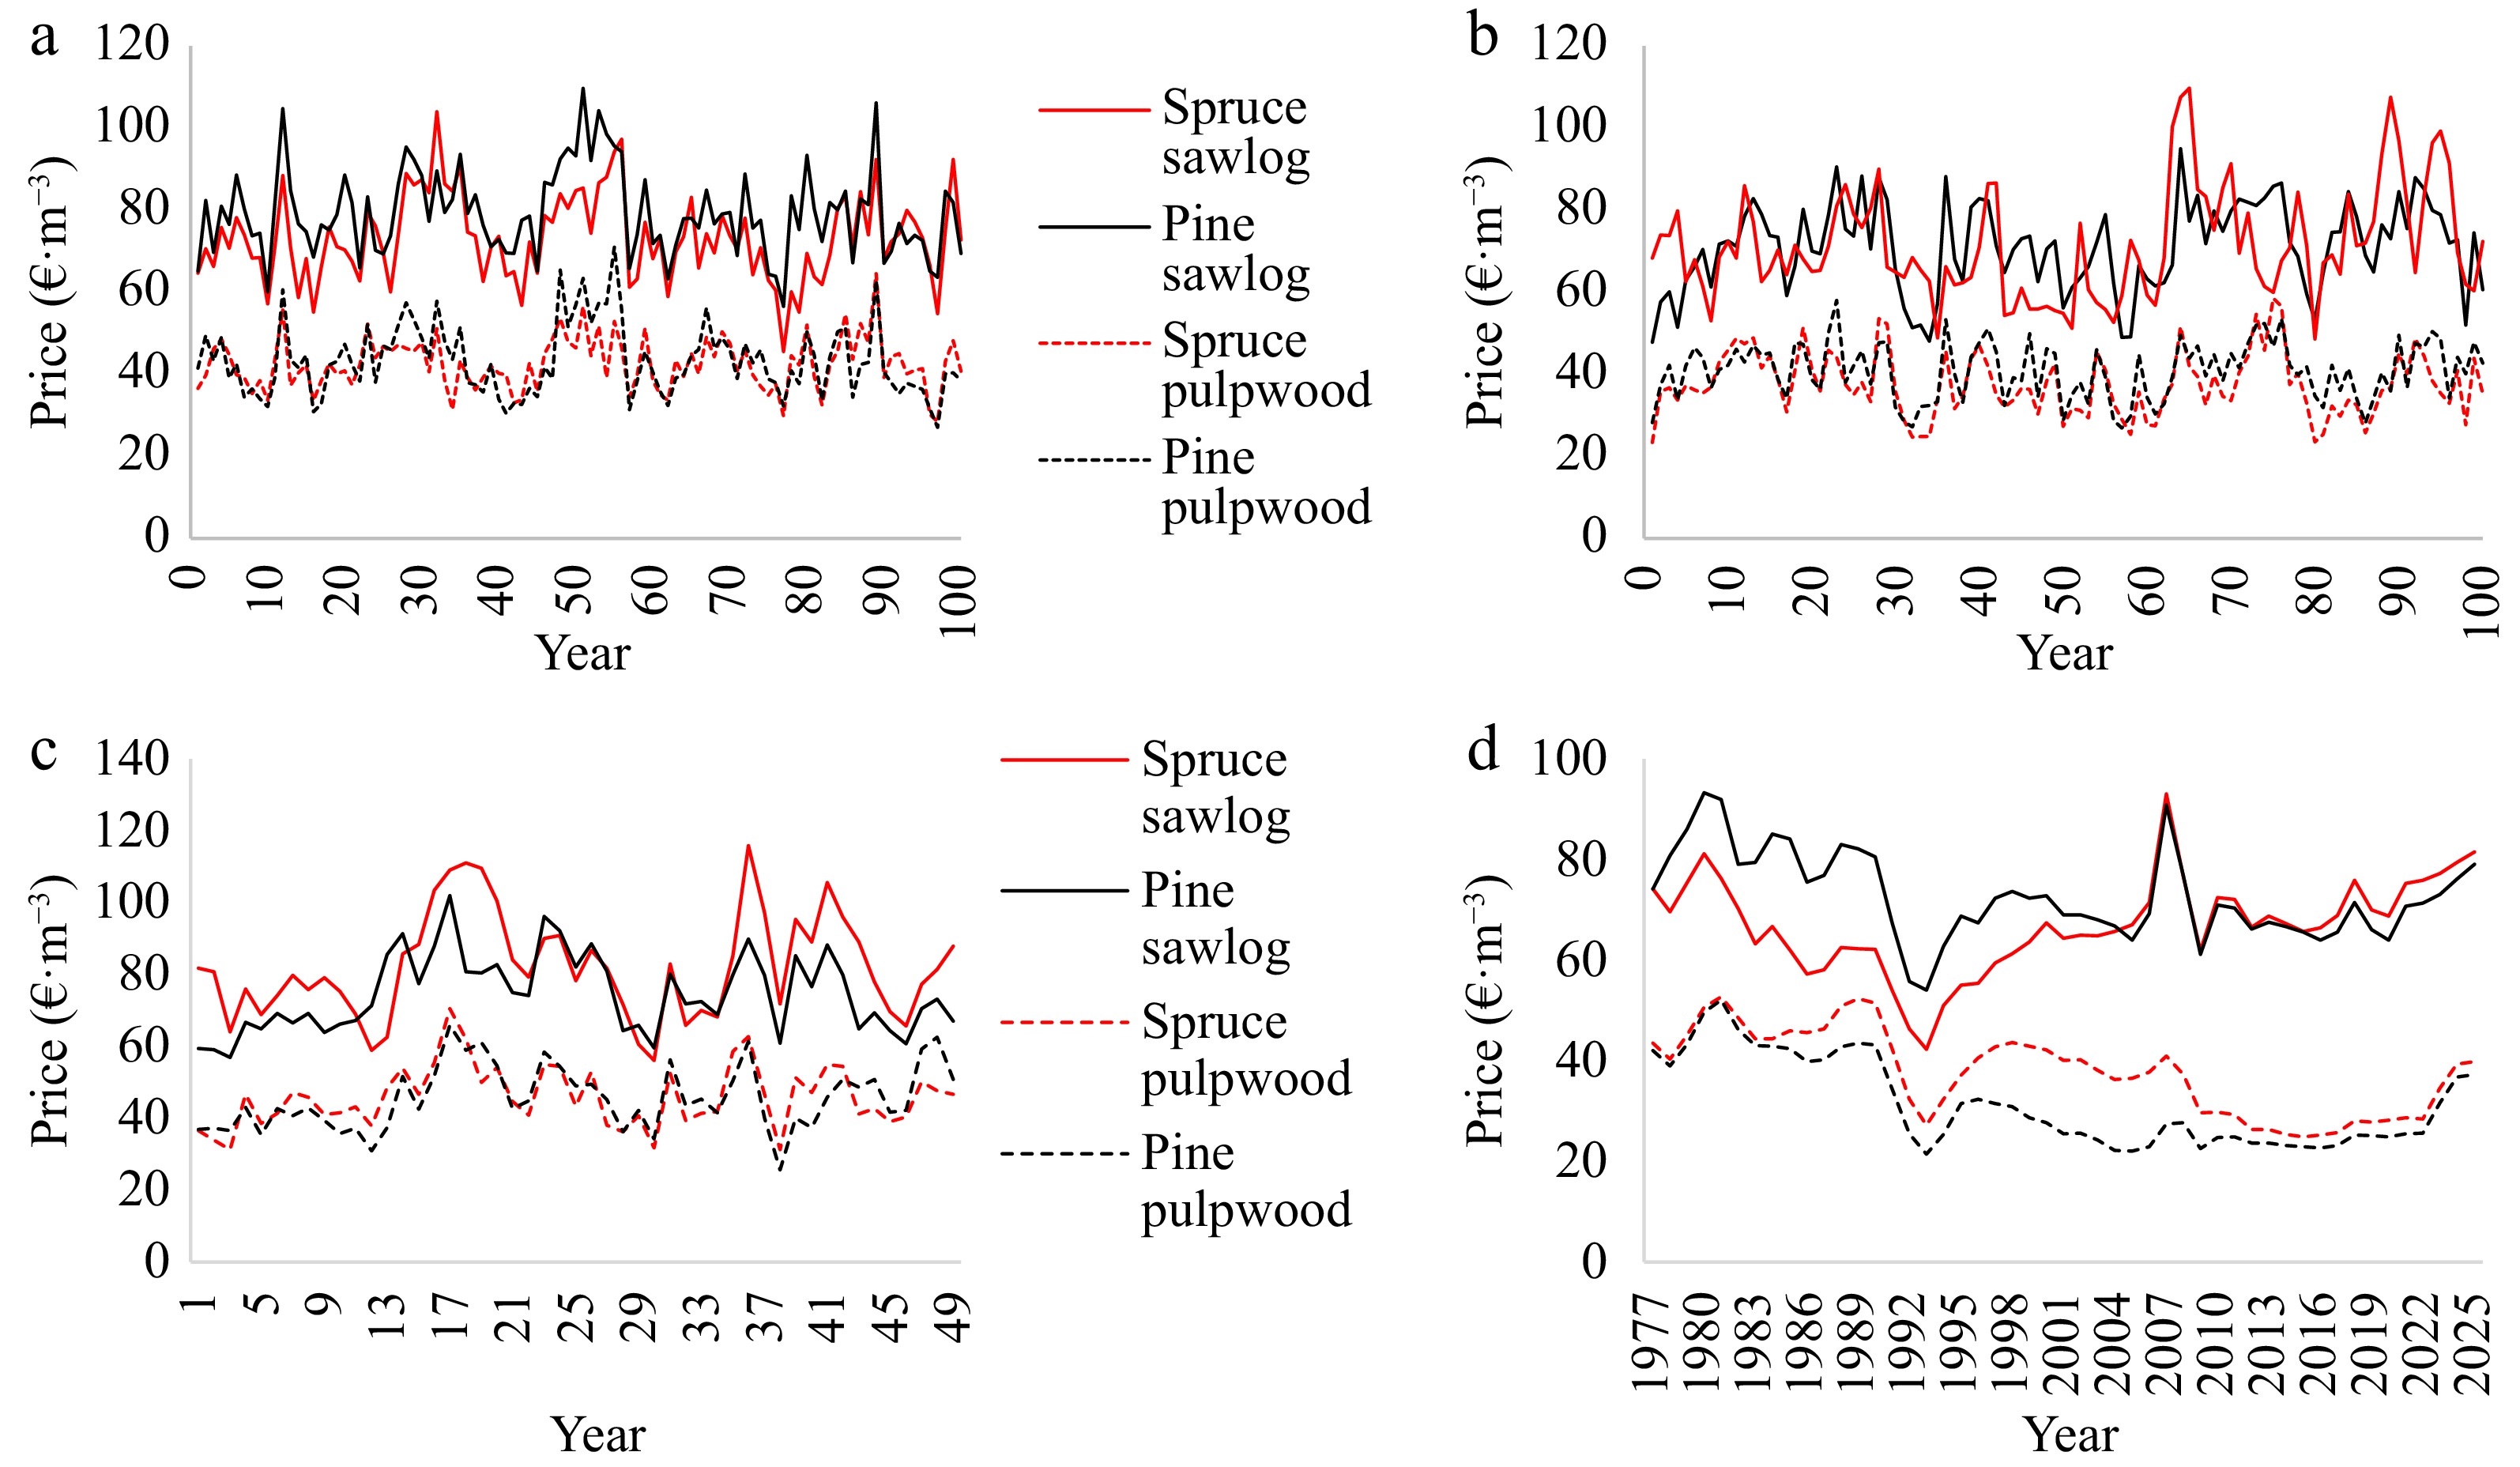
Figure 2.
(a), (b) Examples of stochastic 100-year roadside timber price scenarios. (c) Stochastic 49-year scenario. (d) A 49-year scenario based on timber price statistics for southern Finland. All scenarios describe real timber prices. The cost-of-living index has been used to remove the effect of inflation.
-
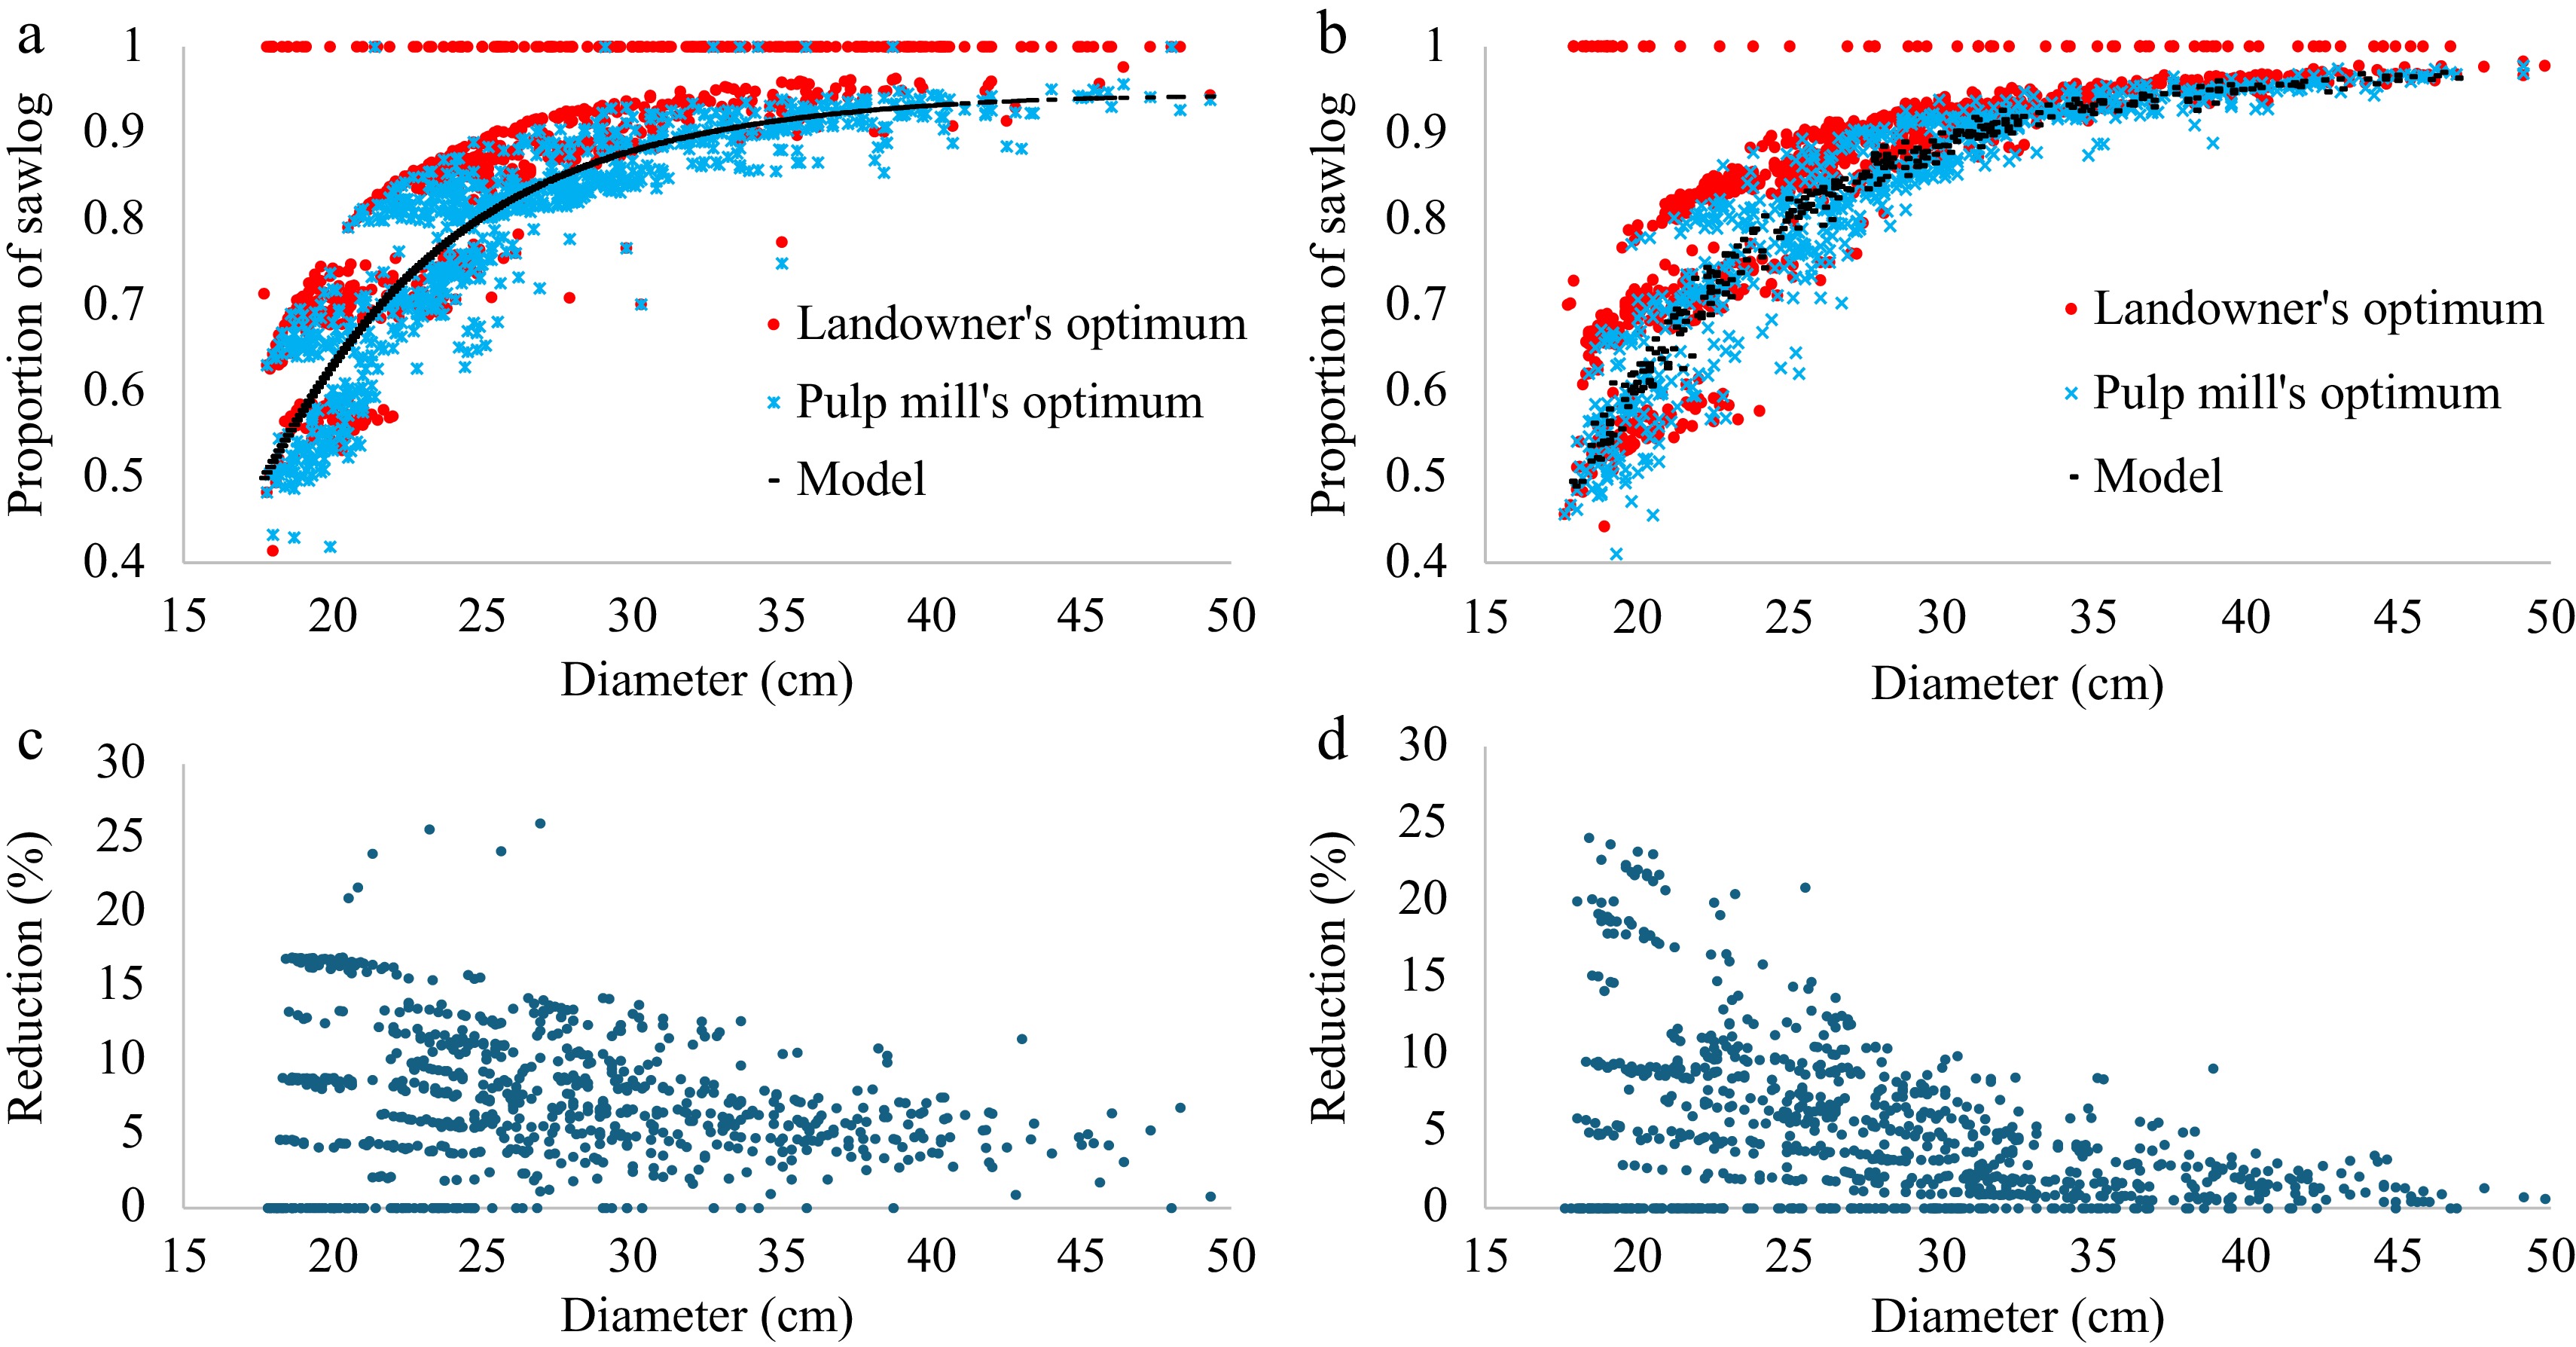
Figure 3.
(a), (b) Optimal crosscutting when sawlog yield is maximized (landowner's optimum) or minimized (pulp mill's optimum), and model predictions for the pulp mill's sawlog yield. The lower diagrams (c), (d) show the relative reduction in sawlog volume when the landowner's optimum is replaced by the pulp mill's optimum. Diagrams (a) and (c) are for pine and diagrams (b) and (d) are for spruce.
-
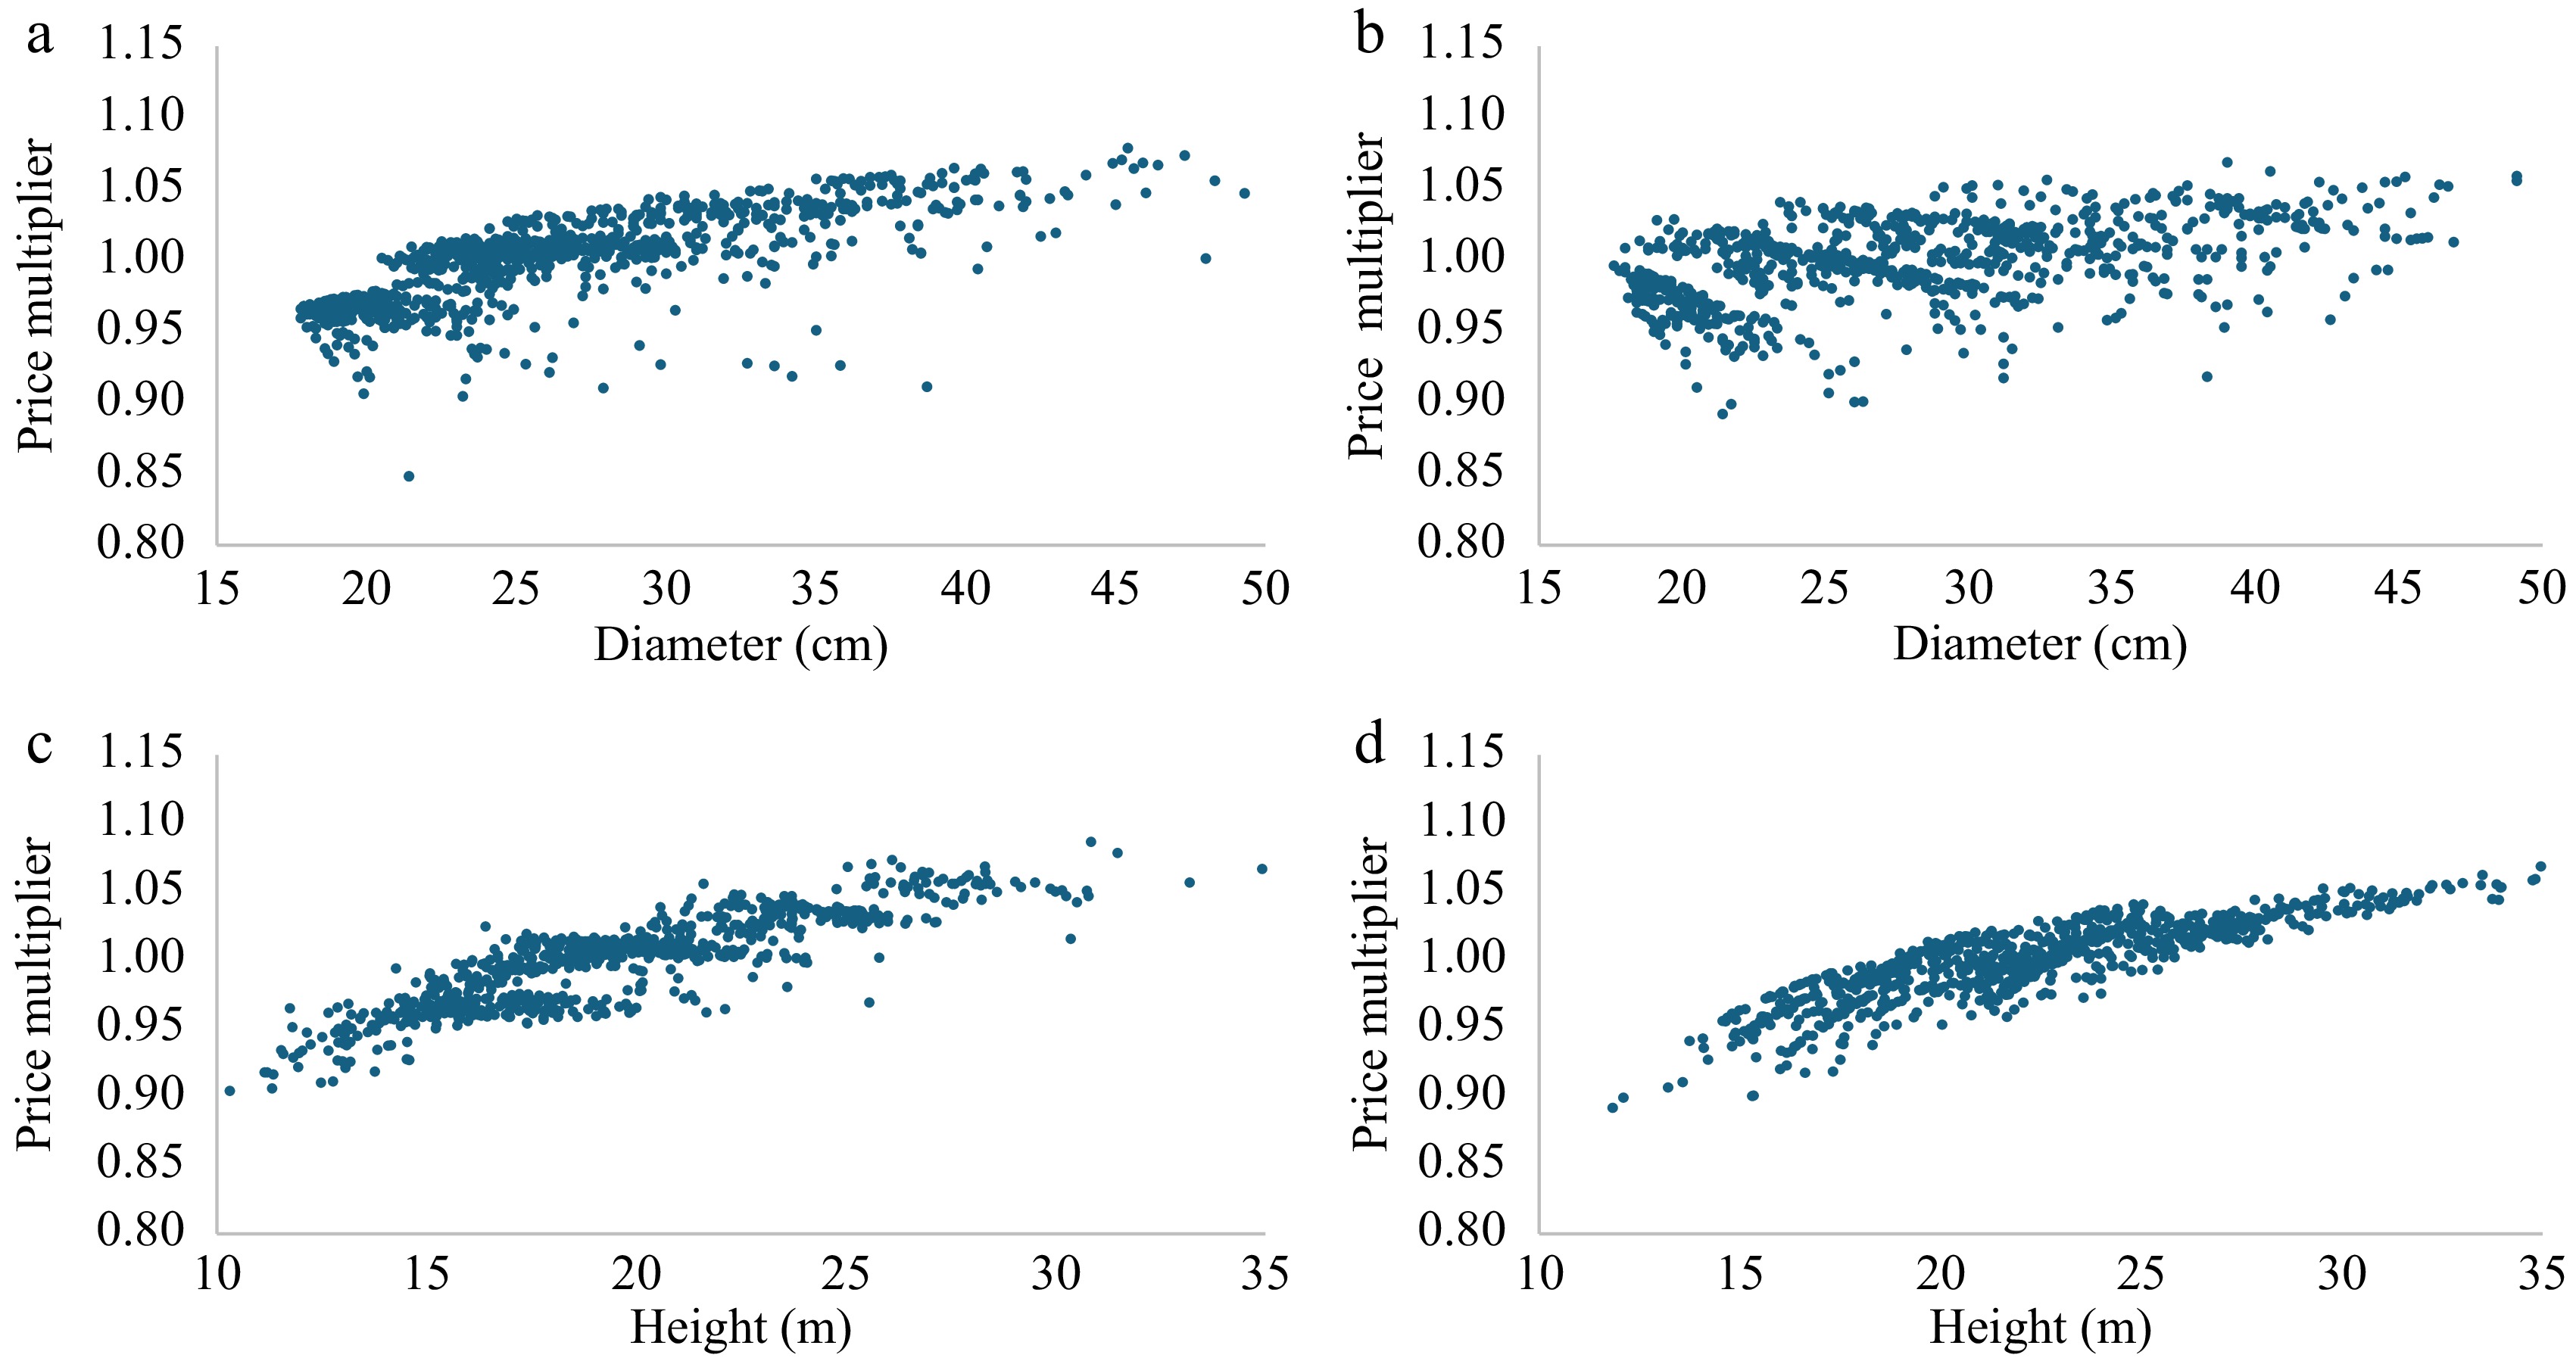
Figure 4.
Relative sawlog price under the assumption that the price depends on the proportion of sawn wood that can be obtained from the sawlogs. Diagrams (a) and (c) are for pine and diagrams (b) and (d) are for spruce.
-
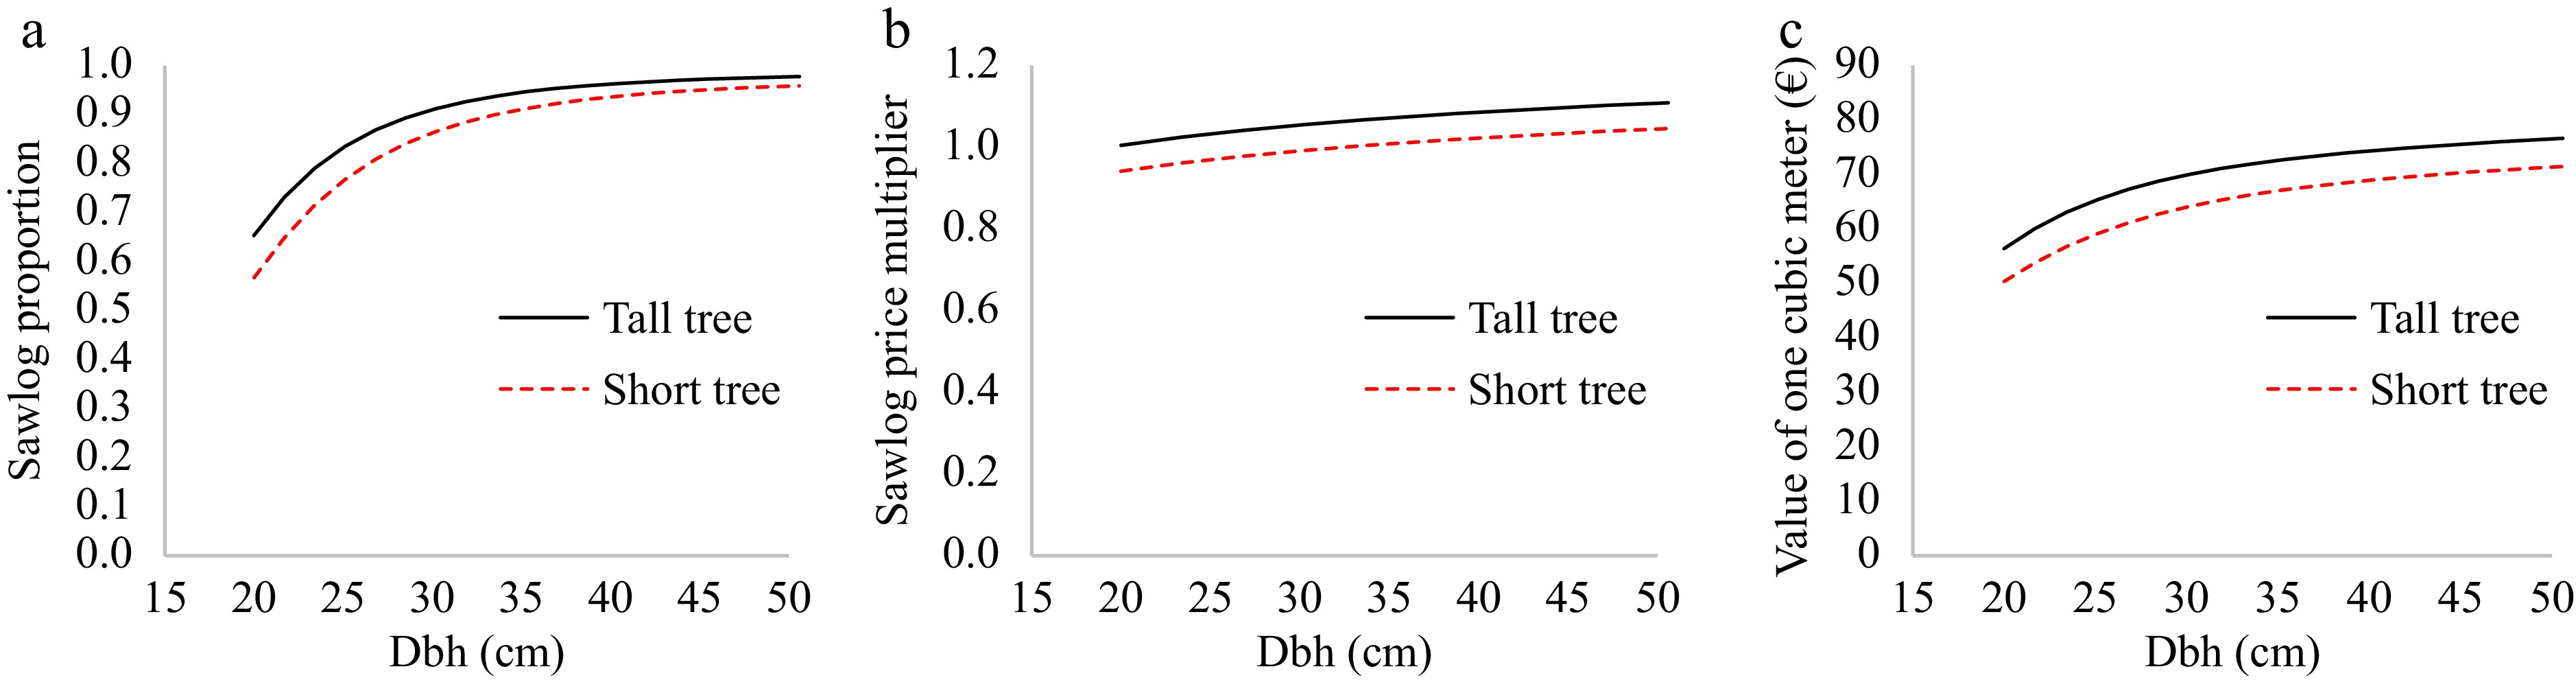
Figure 5.
(a) Dependence of the proportion of sawlog volume of usable volume on DBH in short (30% shorter than average) and tall (30% taller than average) spruce, (b) the sawlog price multiplier, and (c) the average roadside price of usable stem wood in €·m−3.
-
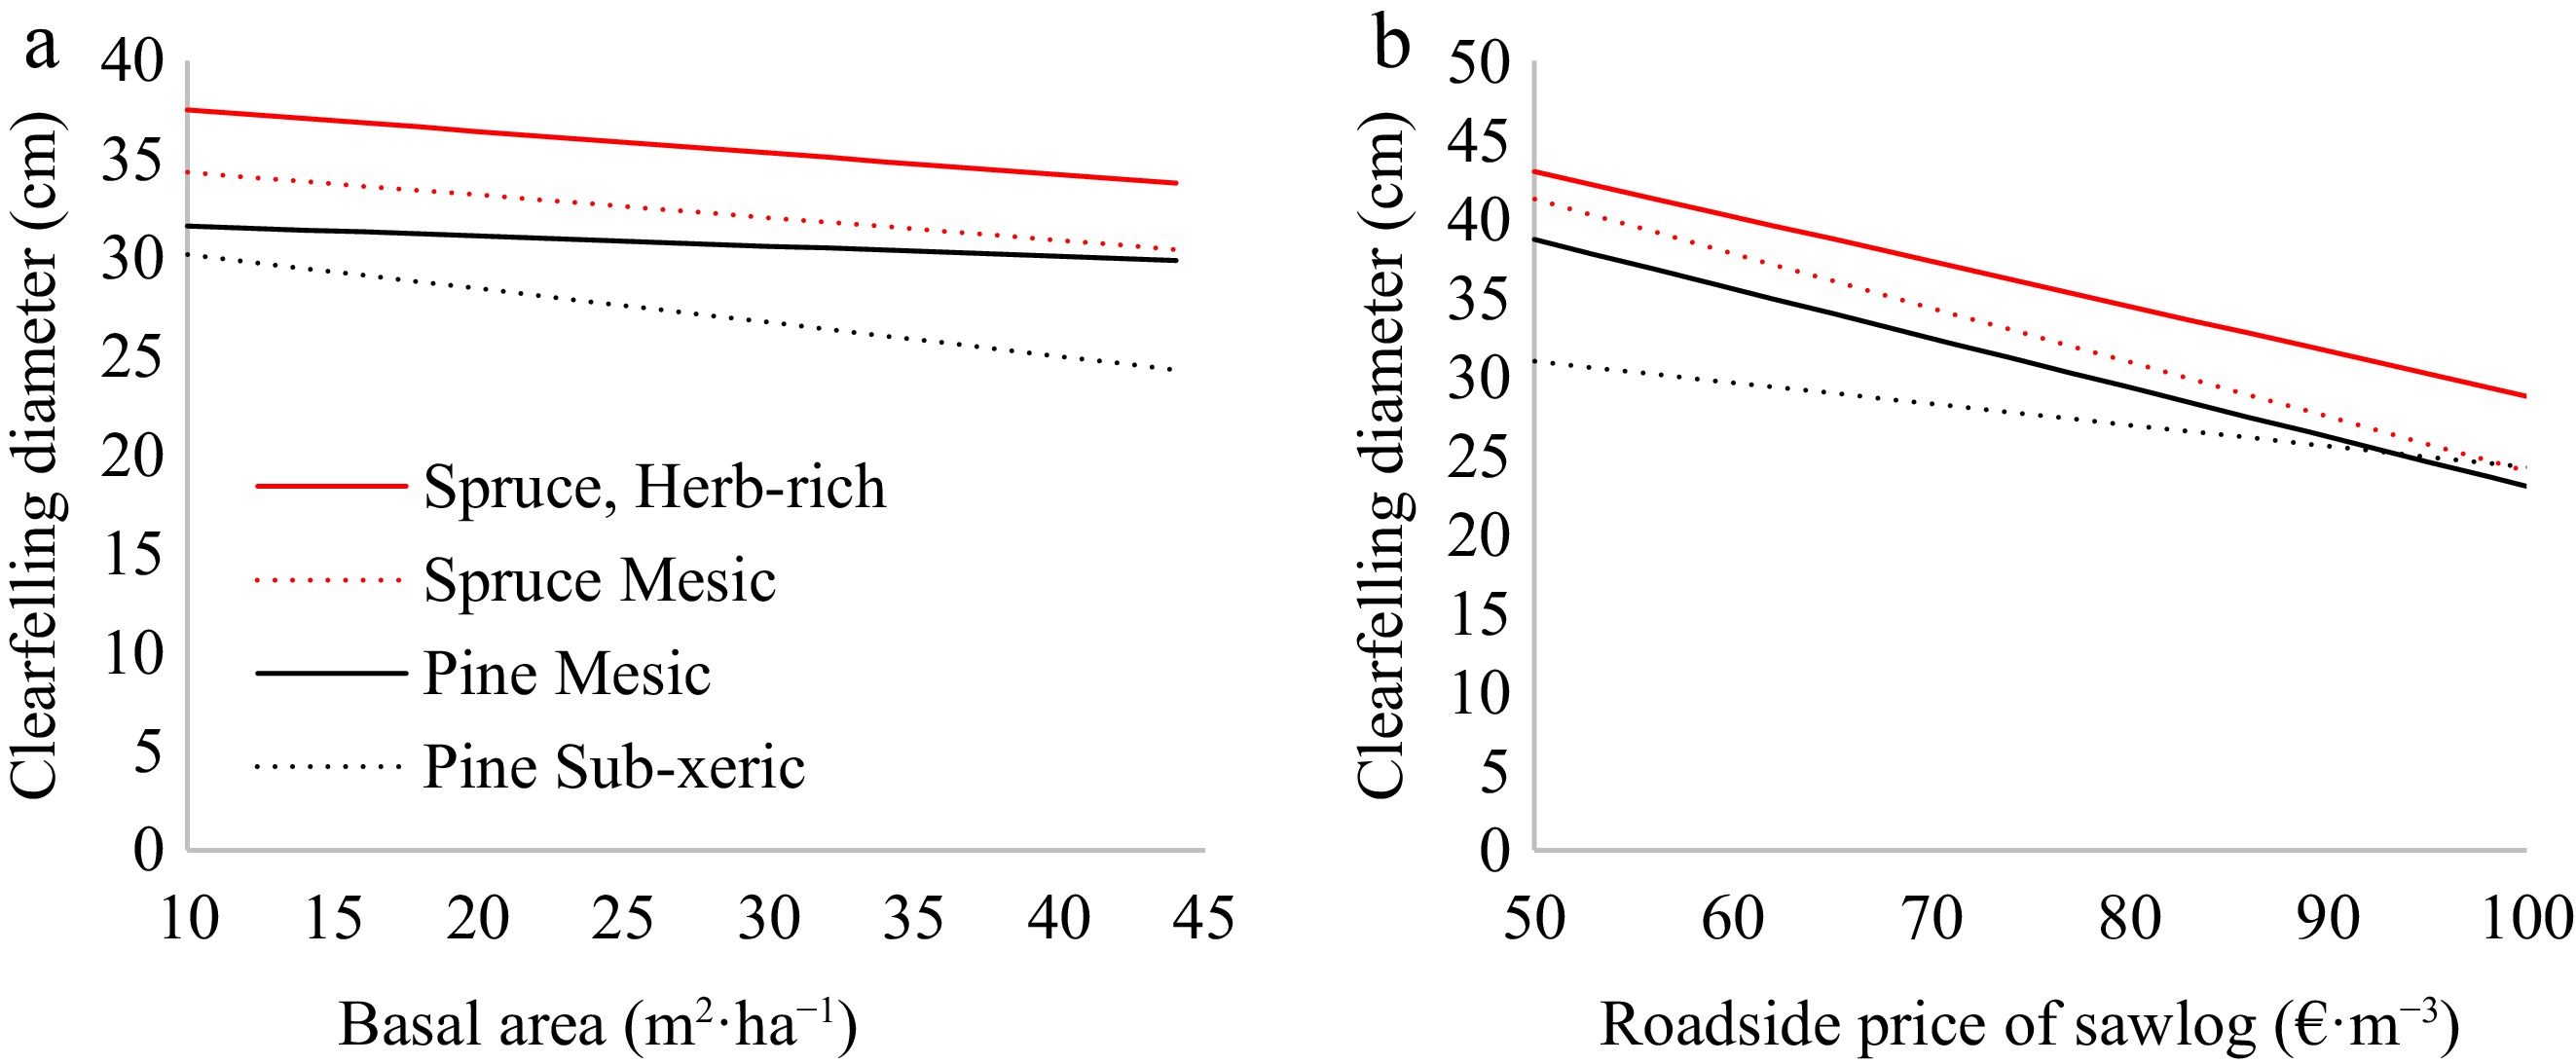
Figure 6.
Effect of (a) stand basal area and (b) roadside price of sawlog on the clear-felling diameter of pine and spruce stands on different sites when the roadside price of pulpwood is 42 €·m−3. In diagram (a), the roadside price of sawlog is 75 €·m−3.
-
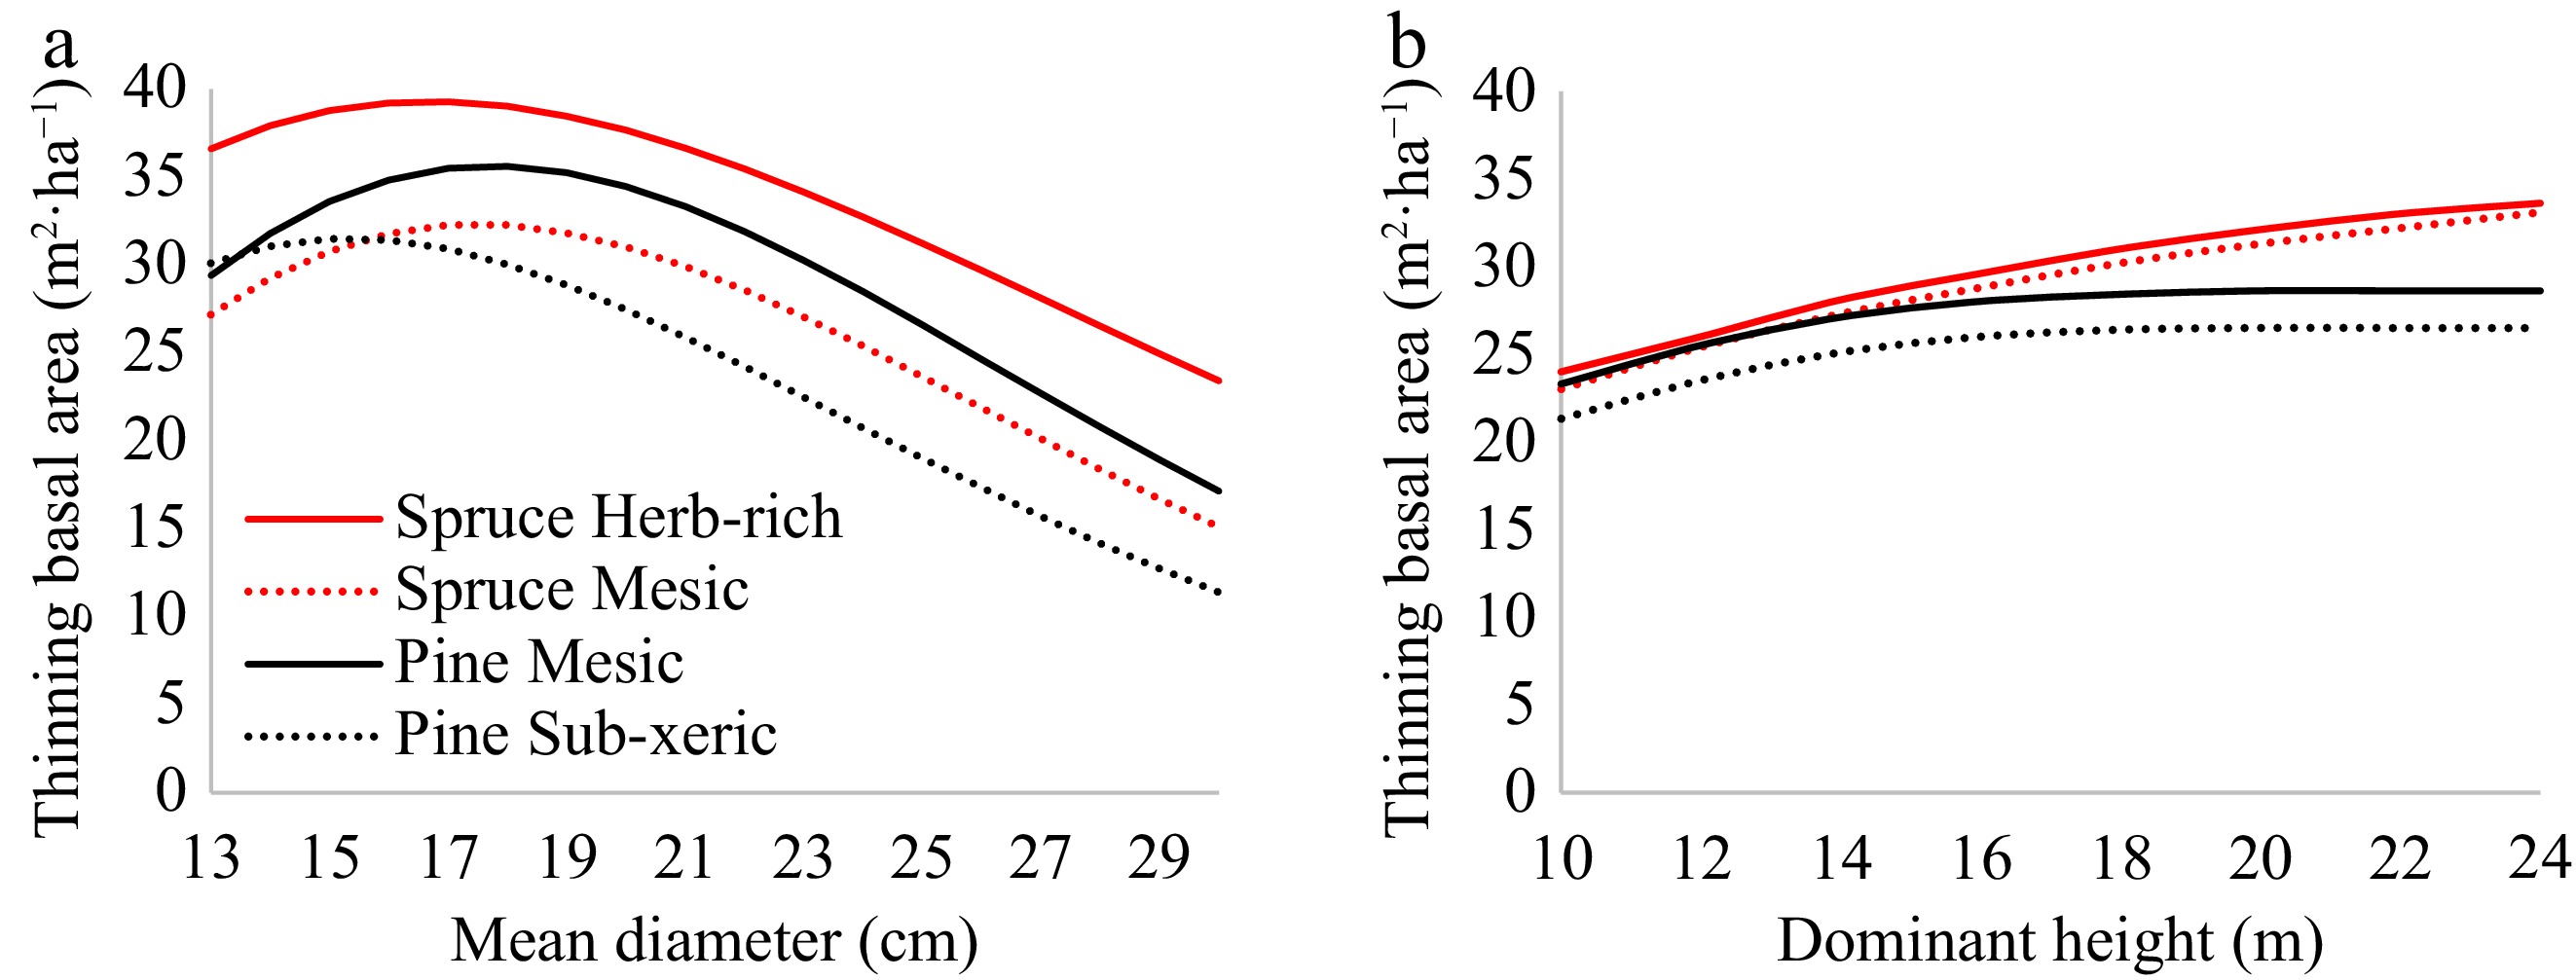
Figure 7.
(a) Optimal thinning basal area of pine and spruce stands on different sites when the roadside price is 75 €·m−3 for sawlog and 42 €·m−3 for pulpwood. (b) The currently recommended thinning basal area in low-thinning management for the same stand types.
-
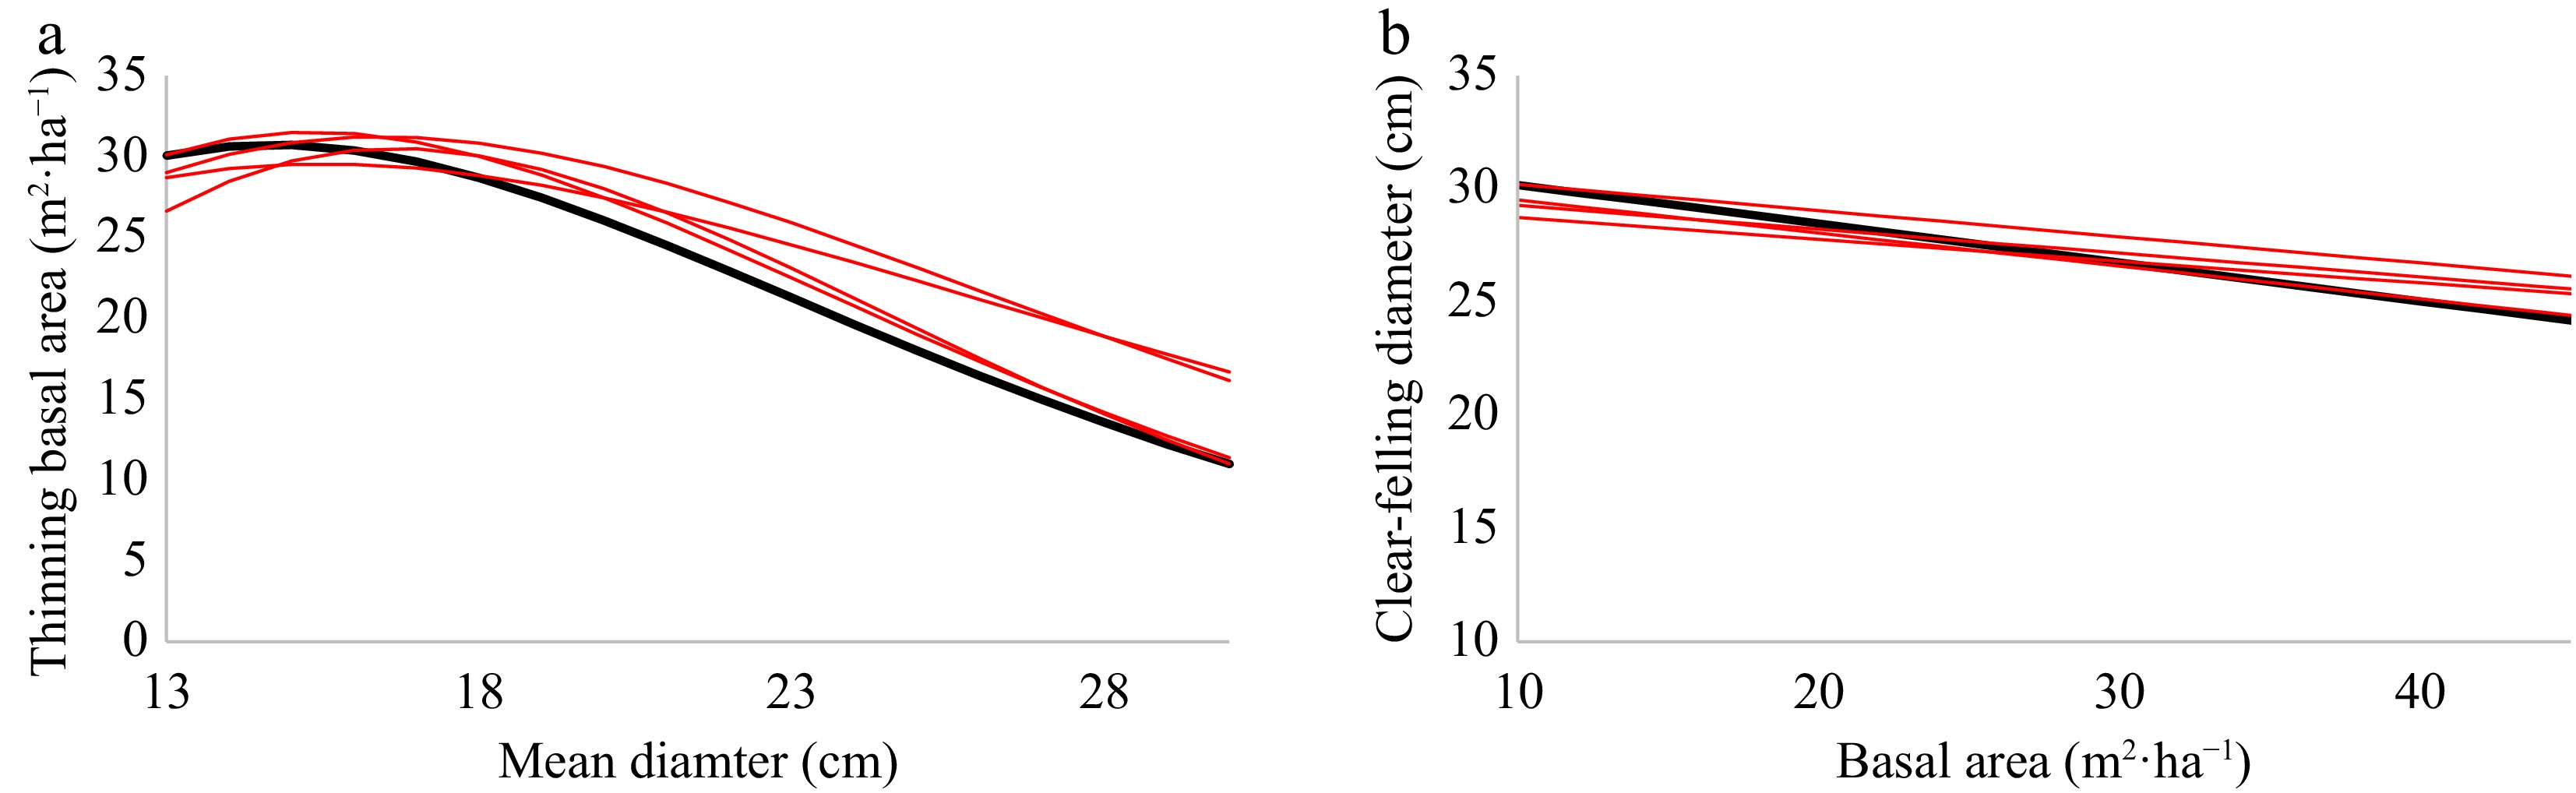
Figure 8.
Variation in (a) thinning basal area and (b) clear-felling diameter in sub-xeric pine in five optimizations when the roadside price is 75 €·m−3 for sawlog and 42 €·m−3 for pulpwood. The thick black lines are the baseline results shown in Figs. 6a and 7a. The y-axis of (b) is cut at 10 cm for better visibility.
-
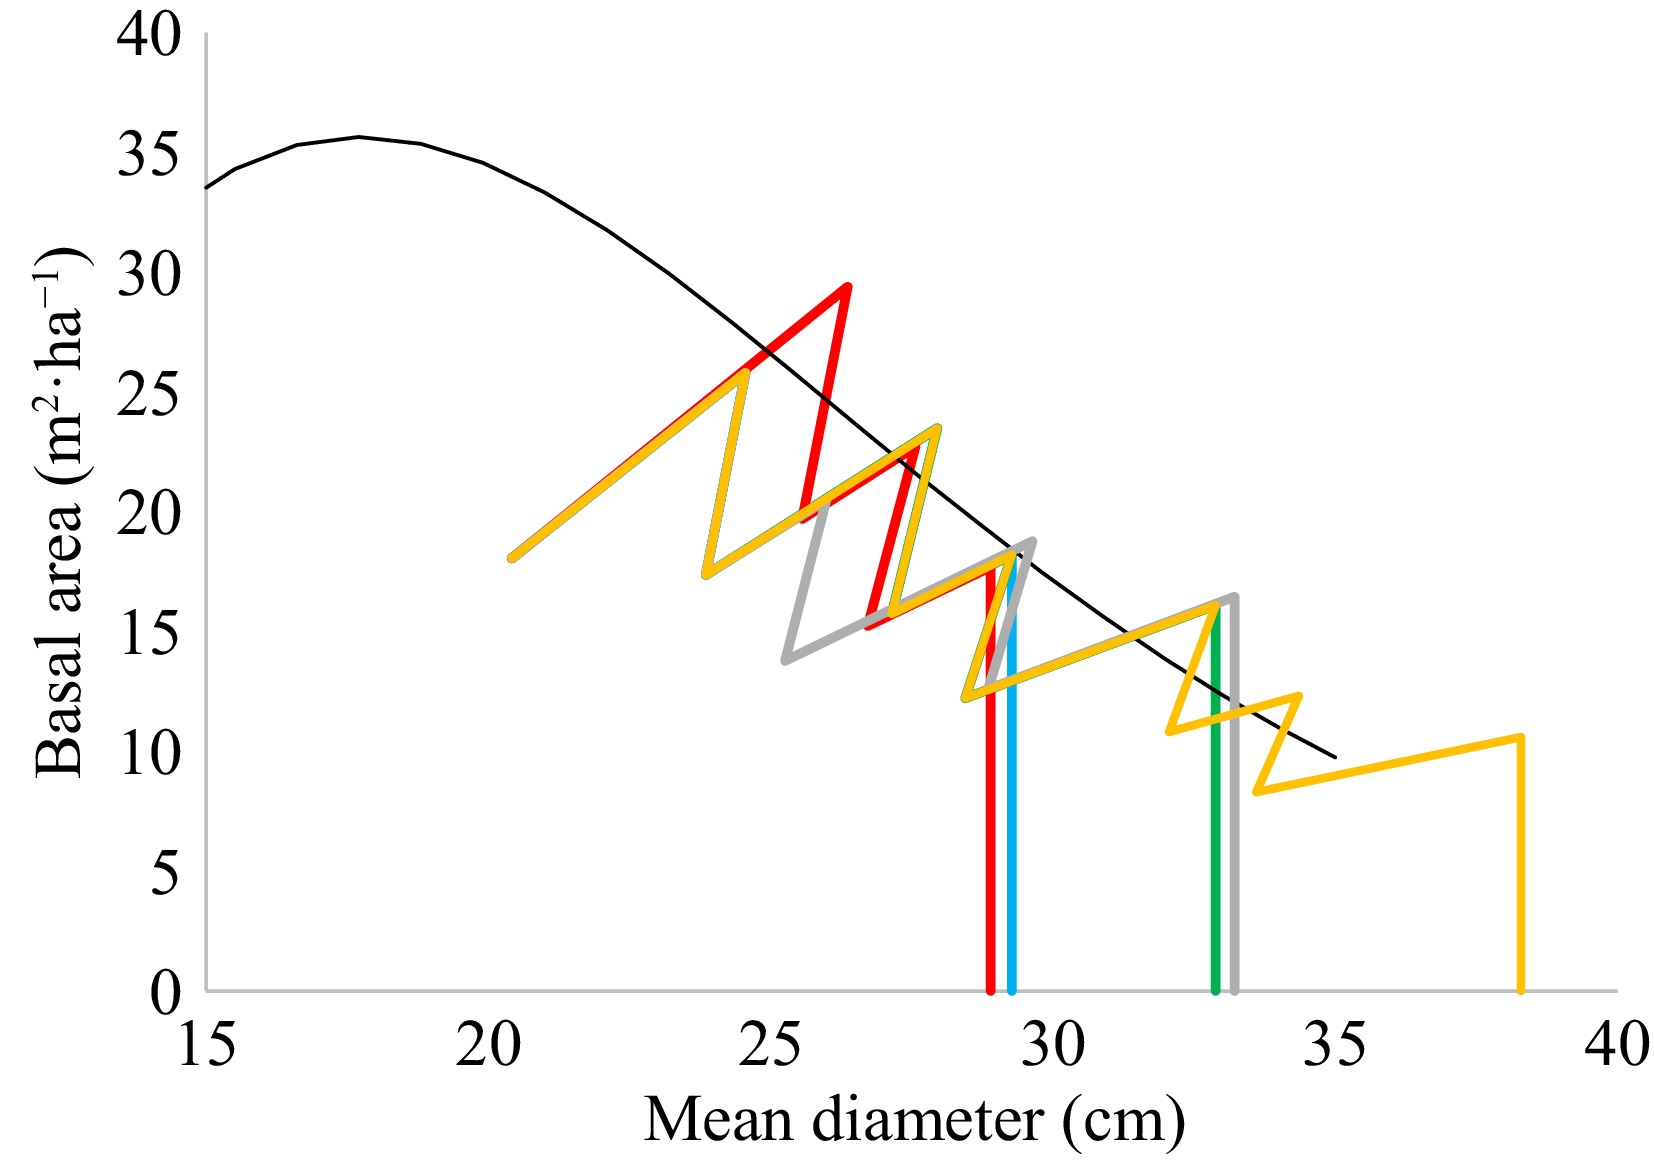
Figure 9.
Optimal cutting schedule of a mesic pine stand under five different timber price scenarios (red, blue, green, grey, and yellow lines). The thin black line is the thinning basal area when the roadside price is 75 €·m−3 for sawlogs and 42 €·m−3 for pulpwood.
-
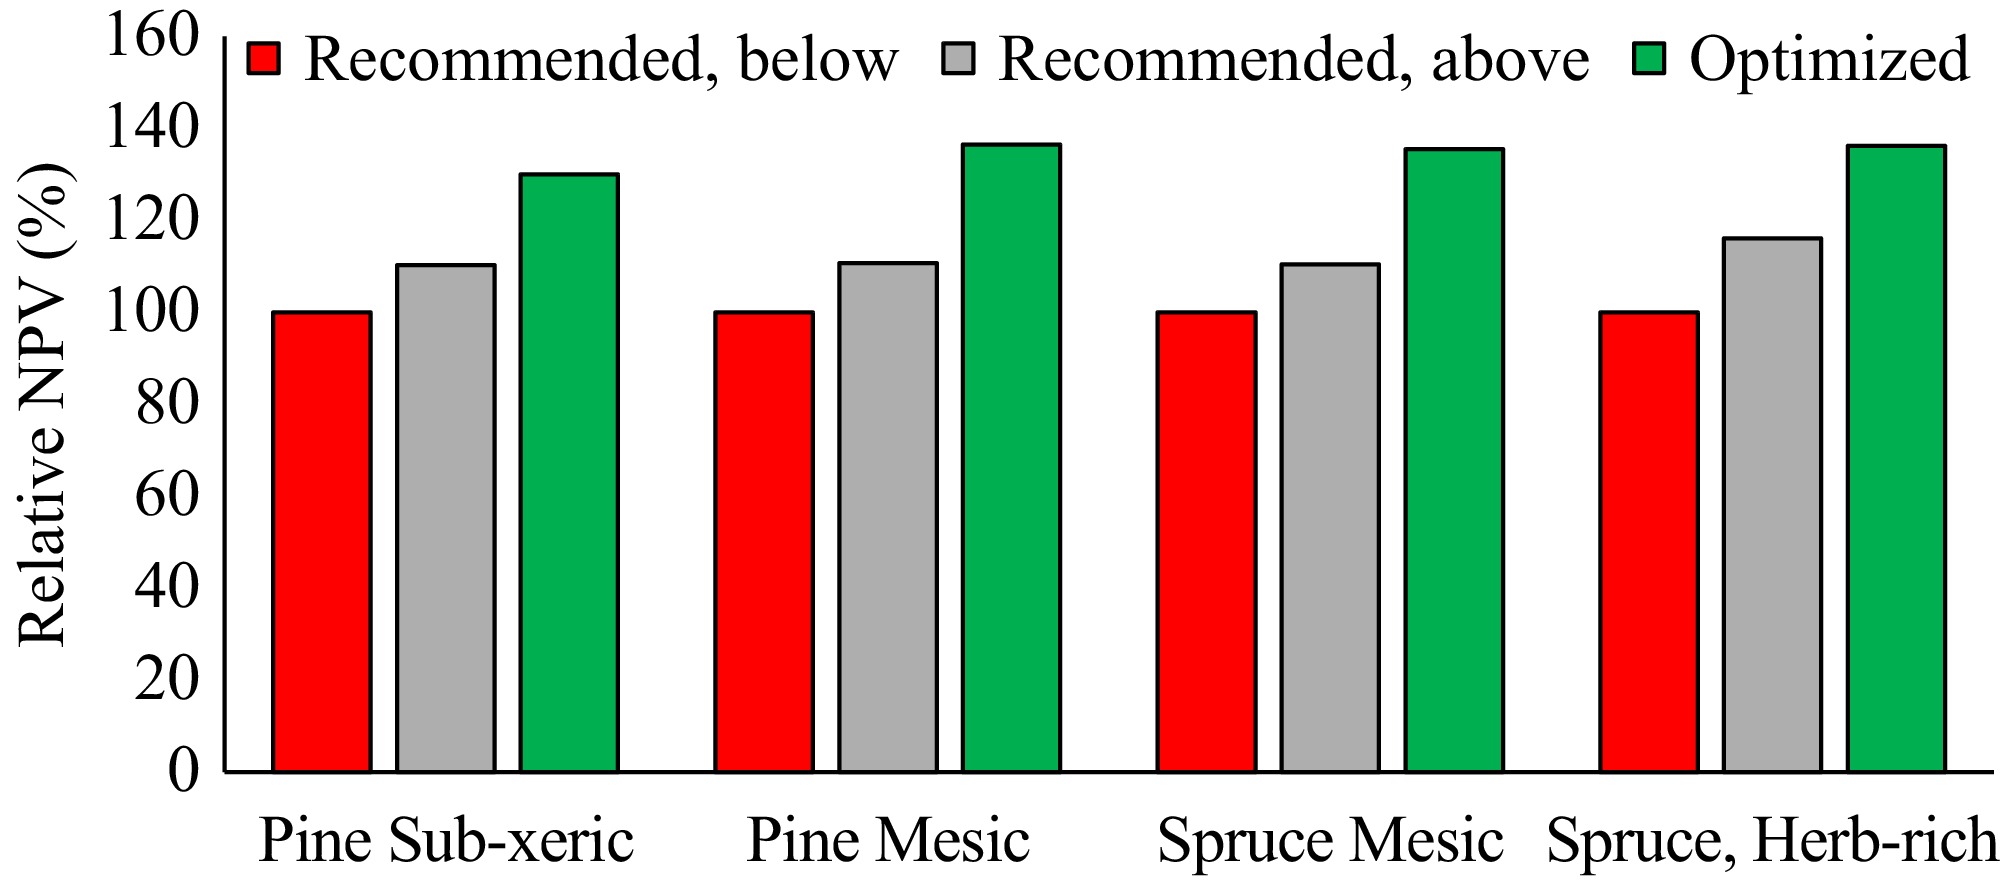
Figure 10.
Relative net present values (NPV) when cuttings are simulated according to the current recommendations for thinning from below (red), thinning from above (grey), or the optimized guidelines of this study (green). The results are based on simulations for 43–60 plots under 100 different timber price scenarios.
-
Predictor Parameter Pine Spruce Estimate t-value Estimate t-value Intercept a0 −17.6771 −18.17 −15.7233 −27.52 ln(d) a1 7.0033 16.70 5.8150 23.98 d a2 −0.1385 9.29 −0.0926 −11.30 h a3 − − 0.0341 10.64 RMSE 0.3914 0.2758 R2 0.699 0.788 Table 1.
Parameters of models for the logit-transformed proportion of sawlogs (of usable stem volume).
-
Predictor Parameter Pine Spruce Estimate t-value Estimate t-value Intercept a0 0.5231 82.54 0.6198 121.60 ln(d) a1 0.0533 25.01 −0.0580 −28.39 ln(h) a2 0.1024 43.14 0.1857 71.99 RMSE 0.0110 0.0102 R2 0.869 0.874 Table 2.
Parameters for the model of the sawlog price multiplier.
-
Predictor Parameter Pine Spruce Mesic Sub-xeric Herb-rich Mesic Clear-felling diameter (Eq. [4]) Intercept a0 56.5829 45.8596 72.5192 64.8701 PSawlog a1 −0.3129 −0.1341 −0.2846 −0.3446 PPulpwood a2 −0.0230 −0.0932 −0.2989 −0.0839 G a3 −0.0513 −0.1713 −0.1097 −0.1147 Thinning basal area (Eq. [5]) Intercept b0 −1.3922 1.4633 4.4442 −0.8991 ln(D) b1 4.7676 4.2347 2.9134 4.7651 D b2 −0.2486 −0.2325 −0.1469 −0.2473 ln(PSawlogD) b3 −0.3603 −0.6706 −0.4602 −0.4412 ln(PPulpwood) b4 −0.4664 −0.3429 −0.8665 −0.4733 Mean diameter to start thinning from above (Eq. [6]) Constant c 15.38 15.78 10.16 13.05 Table 3.
Parameters of the models for clear-felling diameter (Eq. [4]), thinning basal area (Eq. [5]), and the diameter at which thinning from below is changed to thinning from above (Eq. [6]).
Figures
(10)
Tables
(3)