-
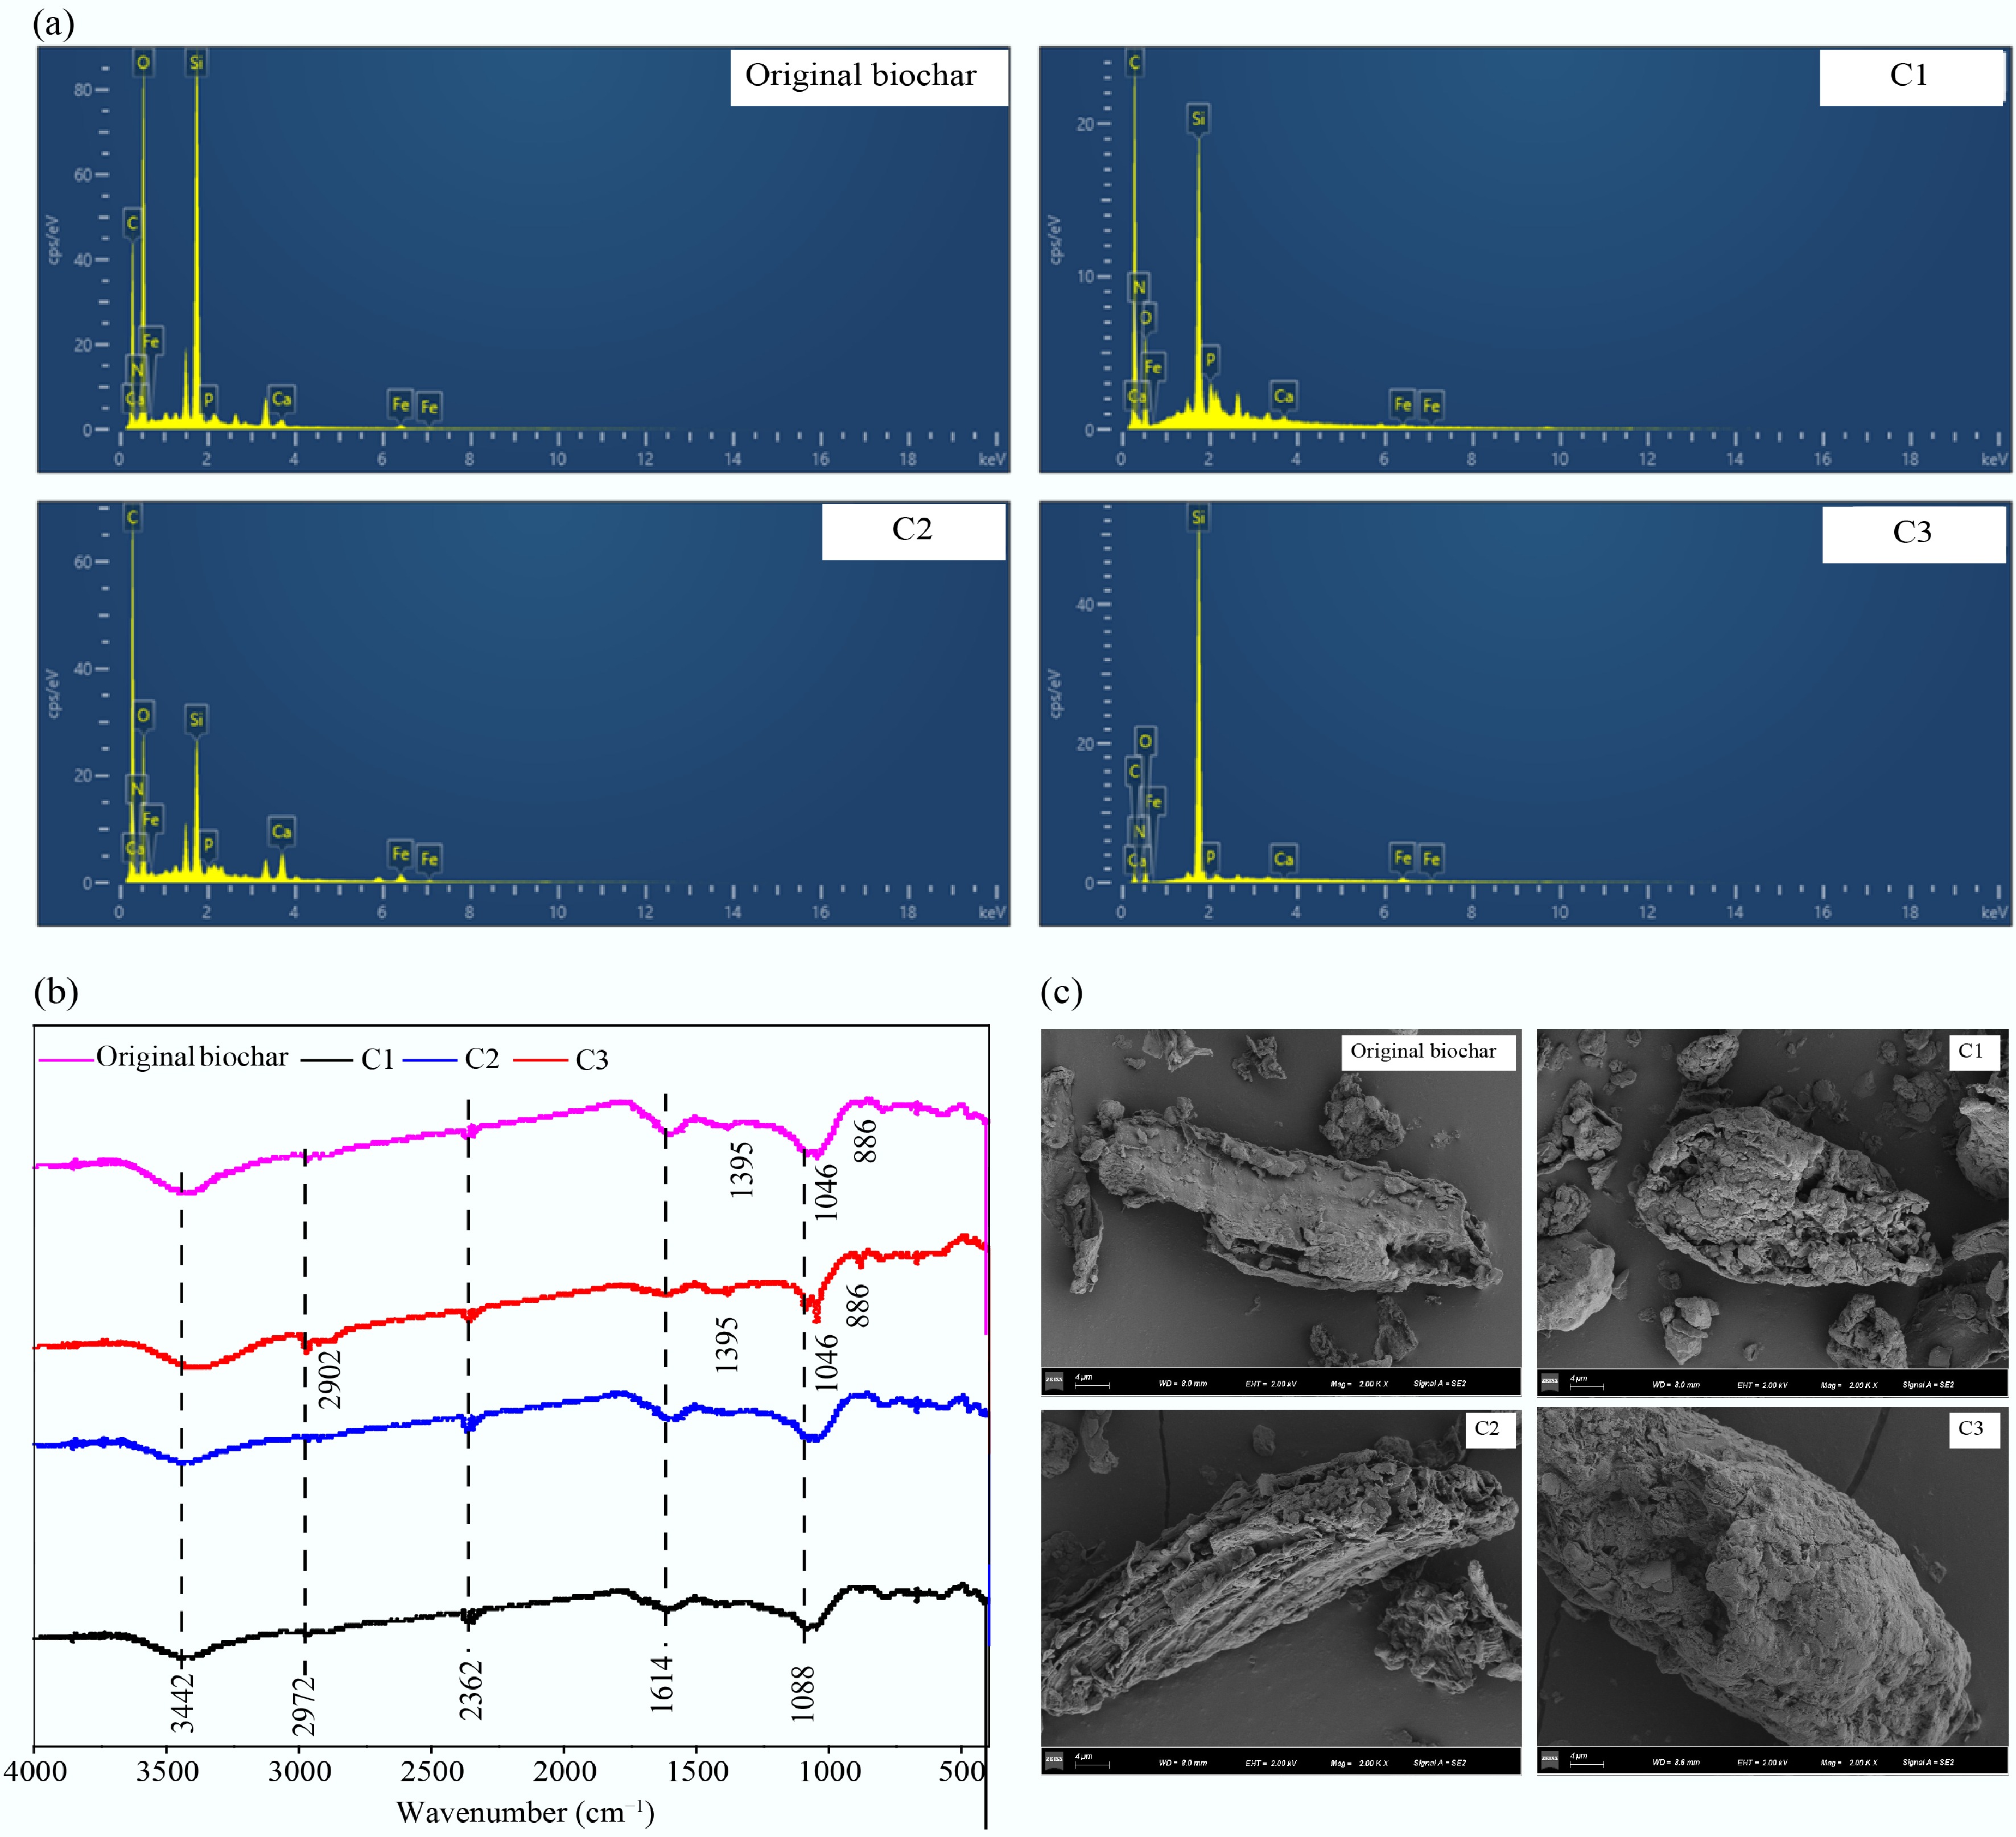
Figure 1.
Characterization of the biochar. (a) EDS characterization of original and modified biochars. (b) Infrared spectra of original biochar and modified biochars. (c) SEM images at low magnification (2.0 k).
-
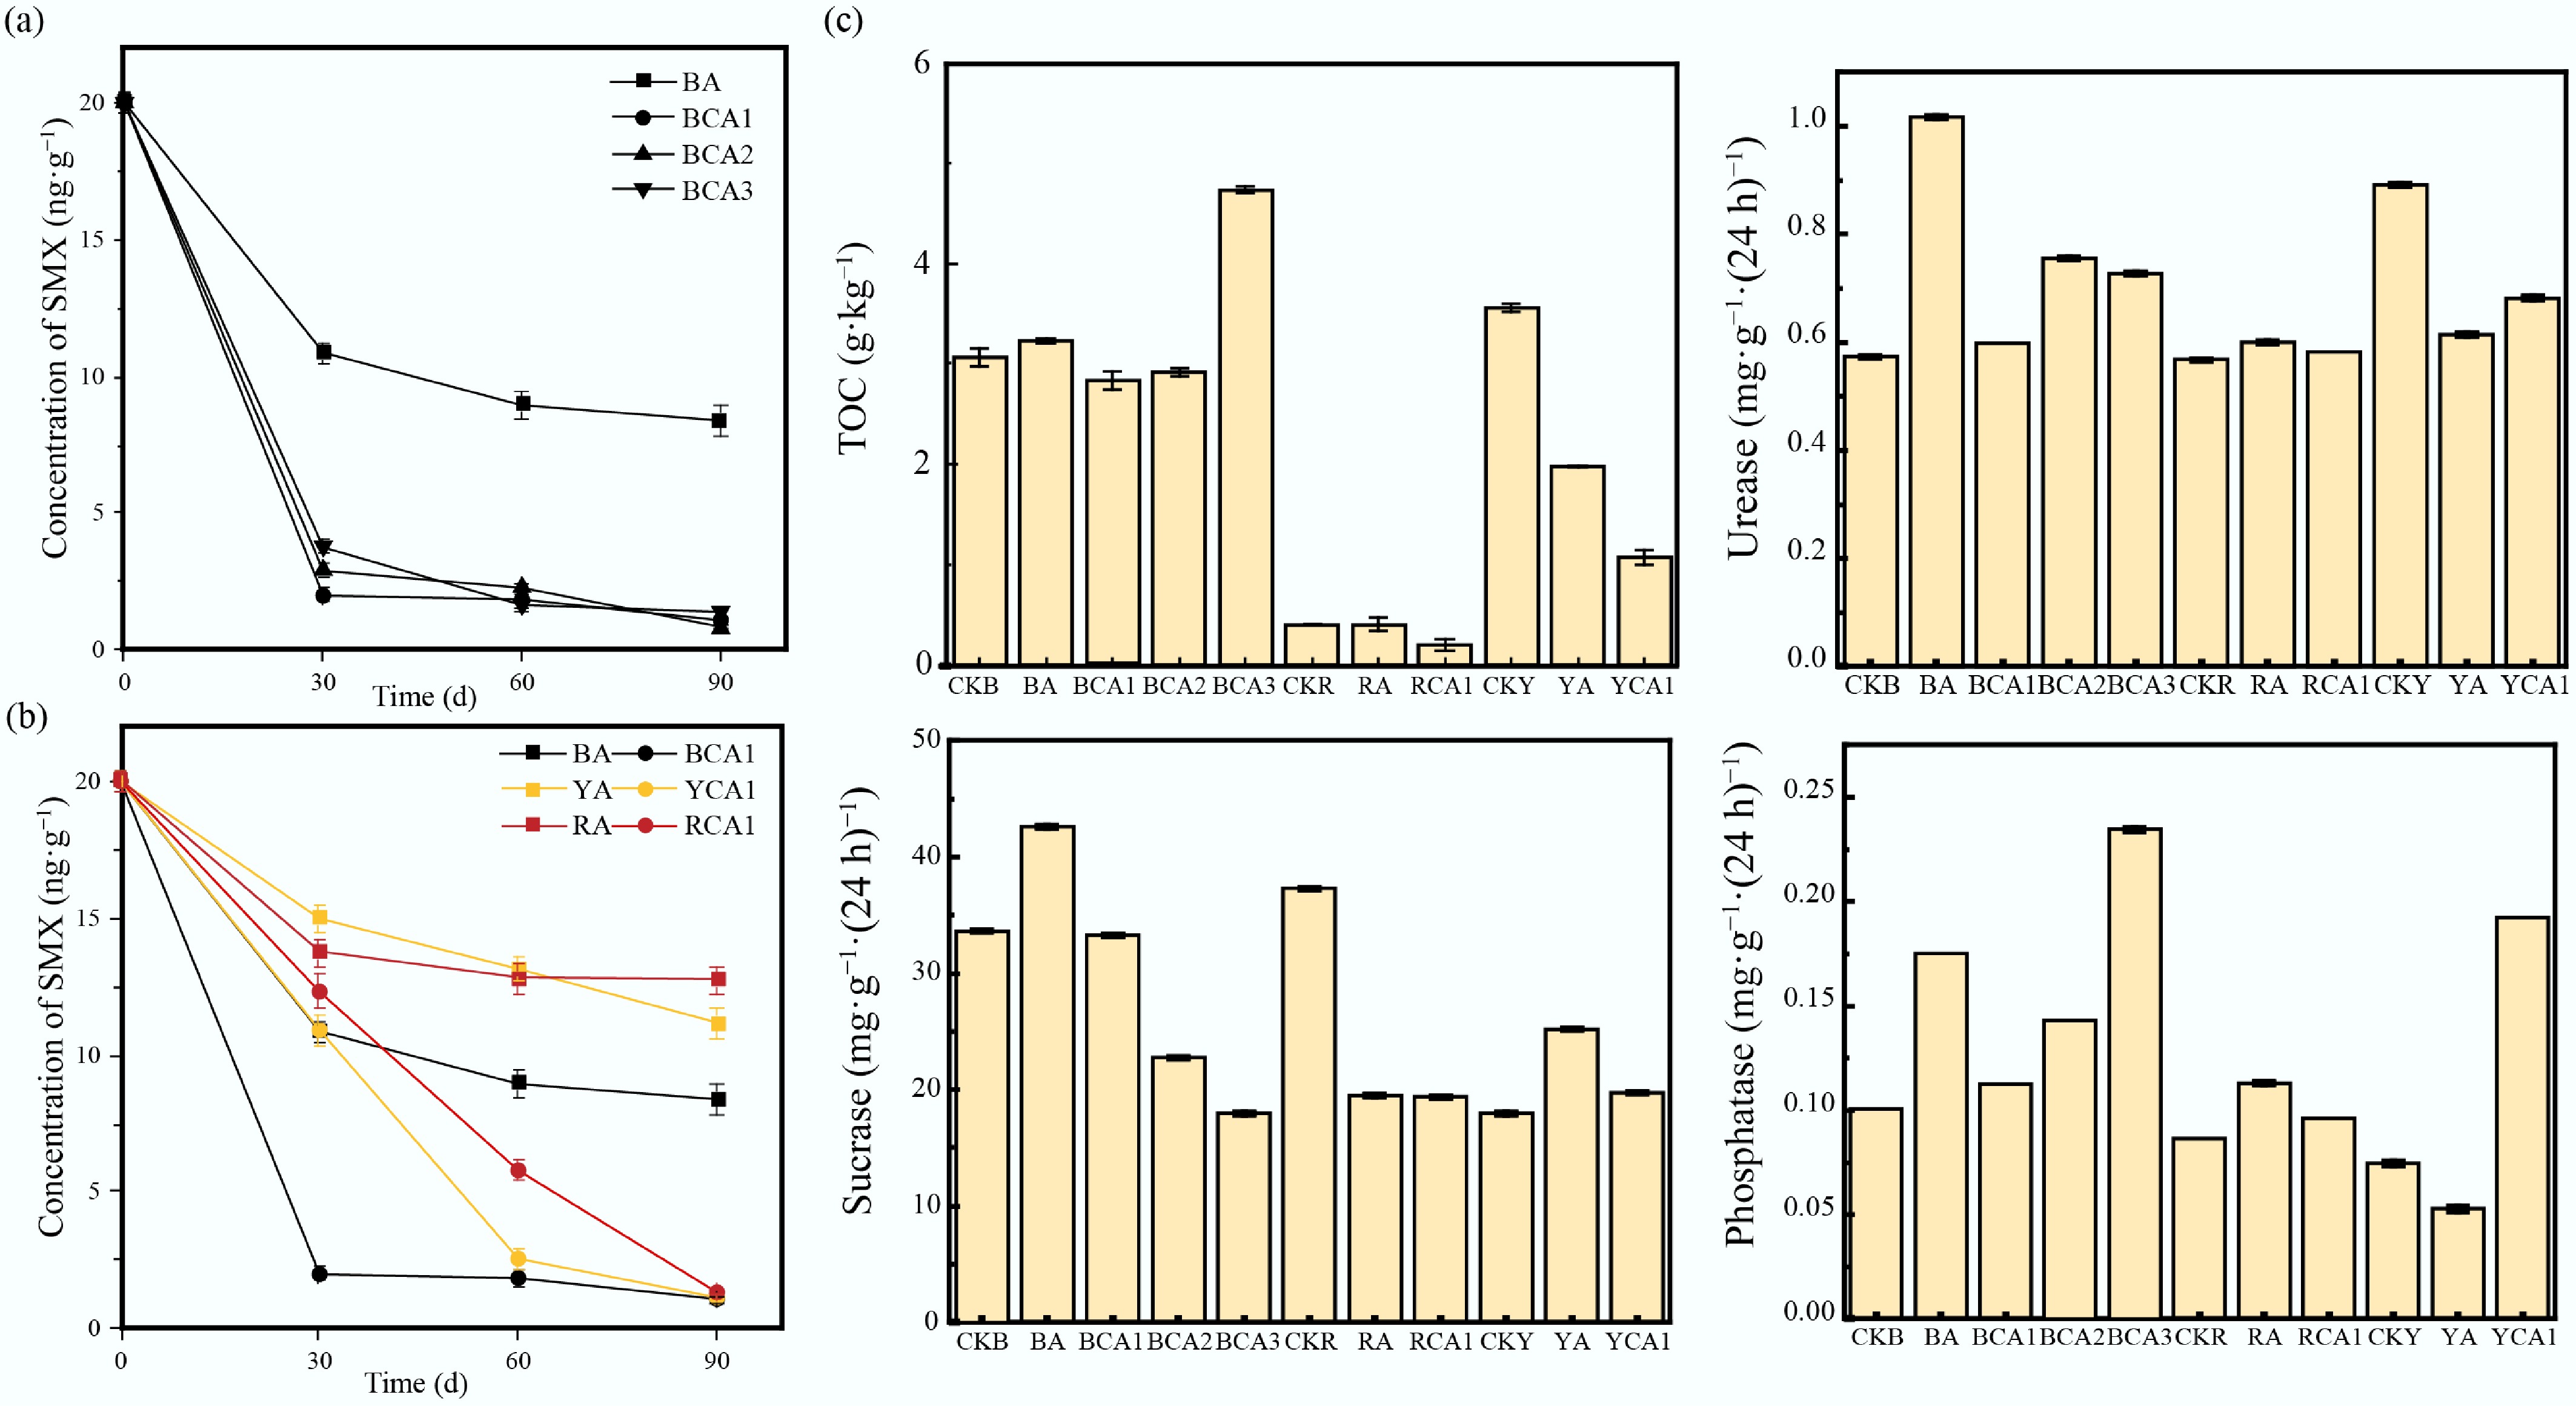
Figure 2.
Enhanced removal of SMX by modified biochar in contaminated soils and the corresponding changes in soil TOC and enzyme activities. (a) Comparative effectiveness of different biochars in black soil. (b) Performance of C1 in different soil types. (c) Soil TOC and enzyme activities under different treatments.
-
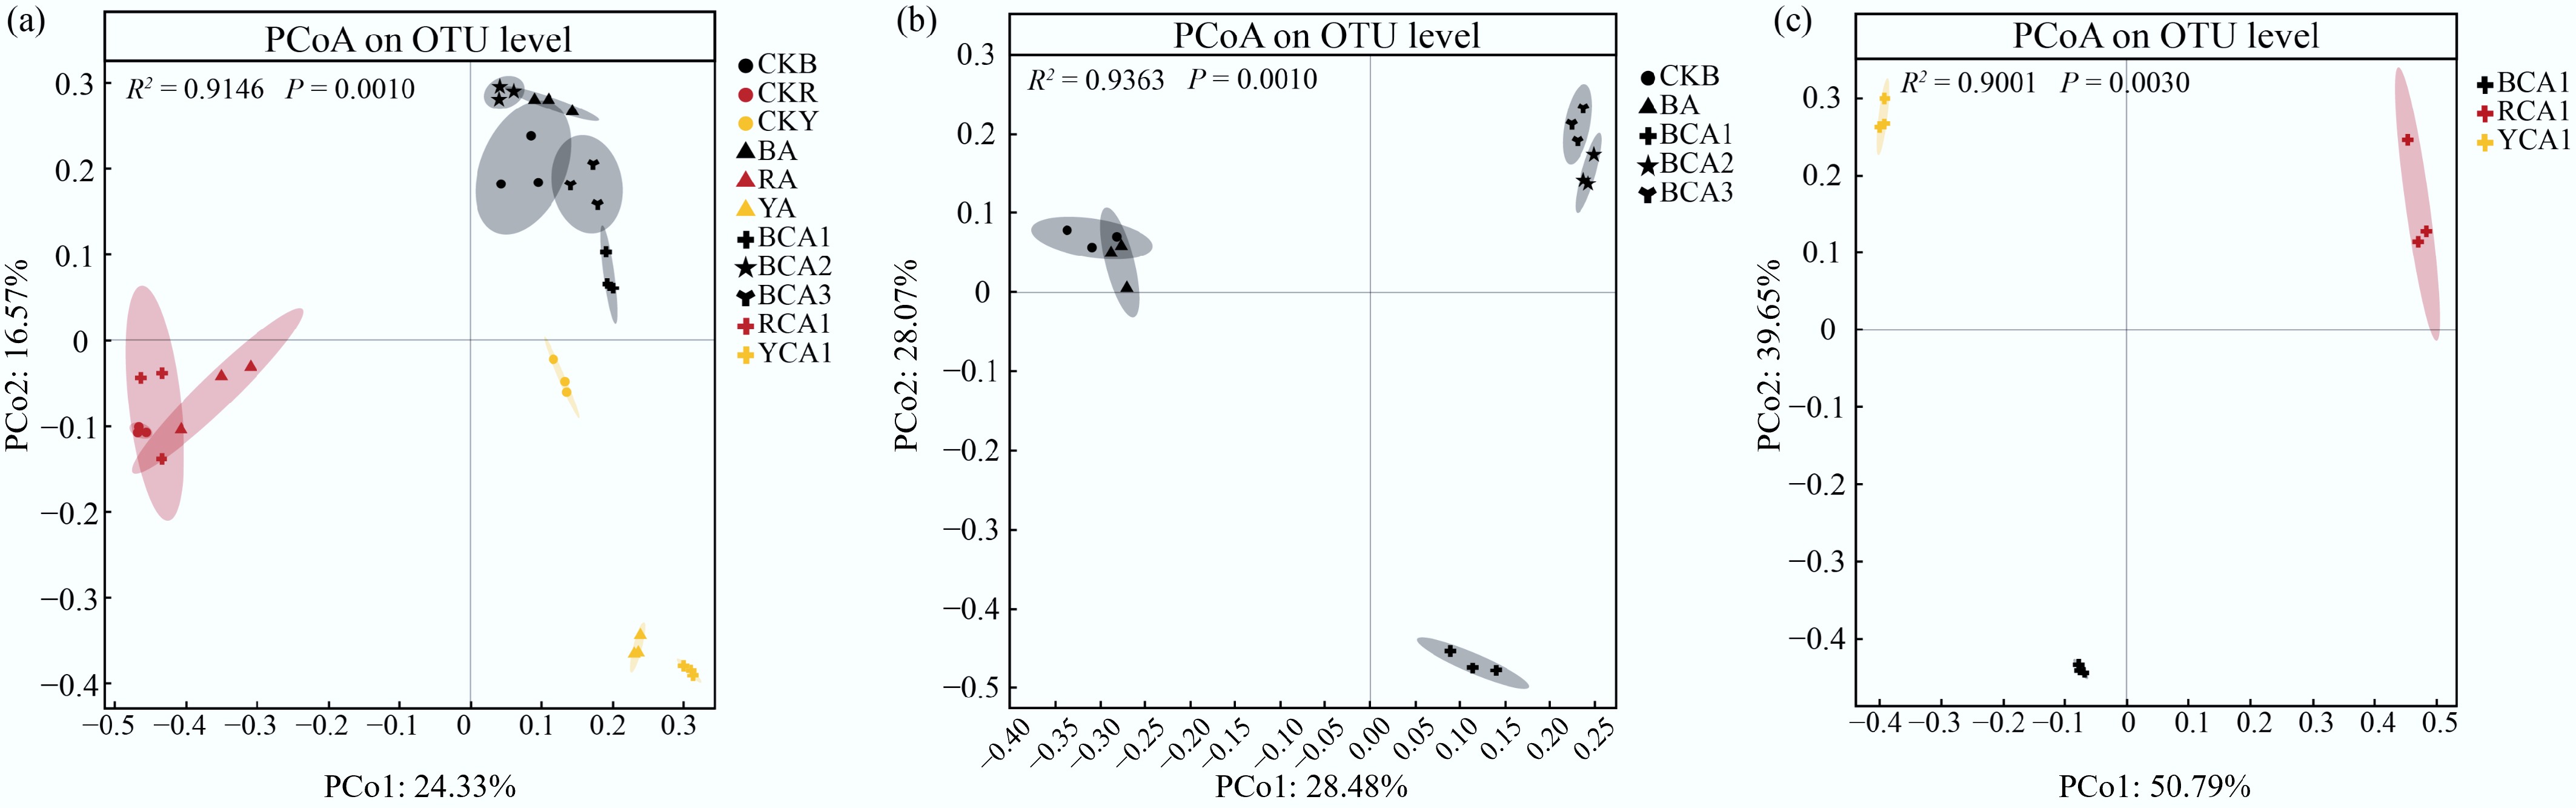
Figure 3.
Beta diversity of microbial communities. (a) Comparison of all treatment groups. (b) Comparison of all treatment groups in black soil. (c) Effects of C1 in different soil types.
-
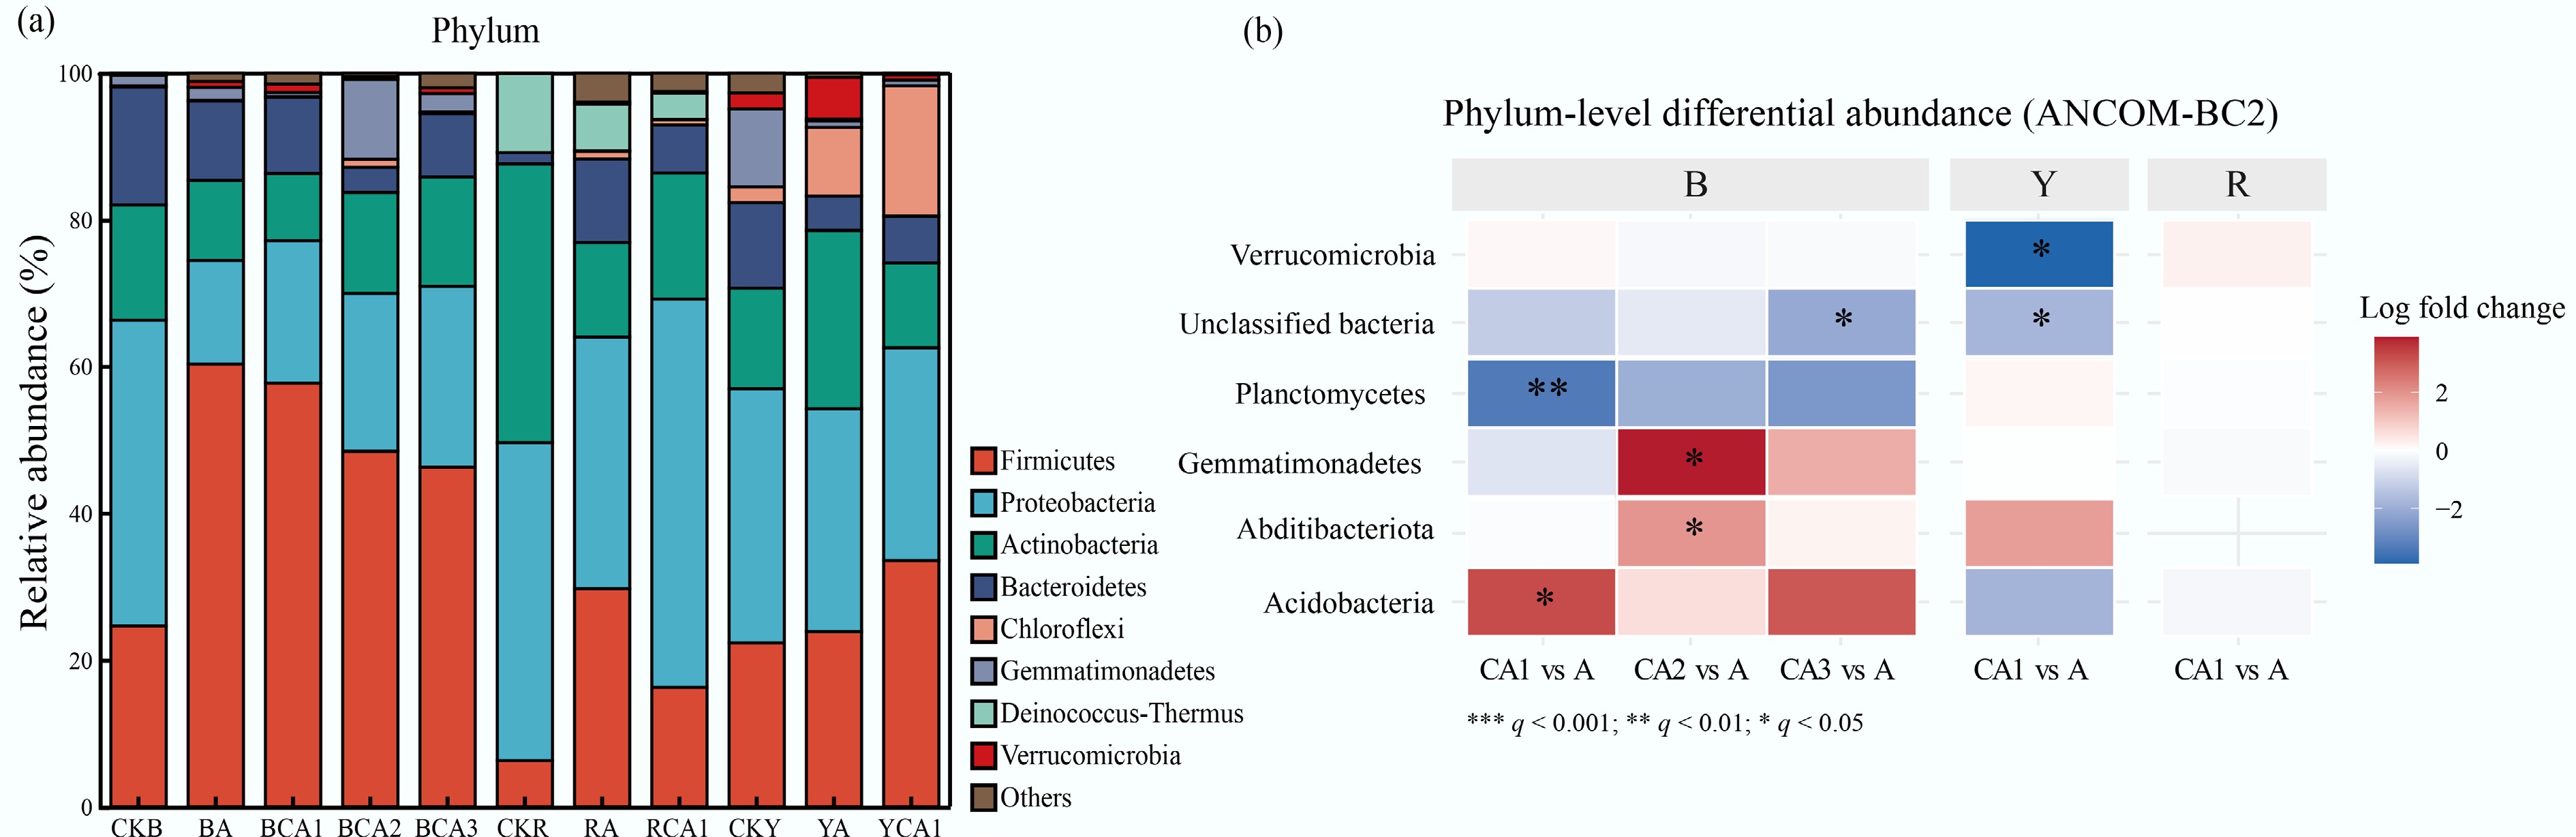
Figure 4.
Phylum-level microbial community composition. (a) Relative abundance of dominant phyla. (b) Phylum-level differential abundance assessed by ANCOM-BC2. Asterisks denote false discovery rate-adjusted q-values: *** q < 0.001; ** q < 0.01; * q < 0.05.
-
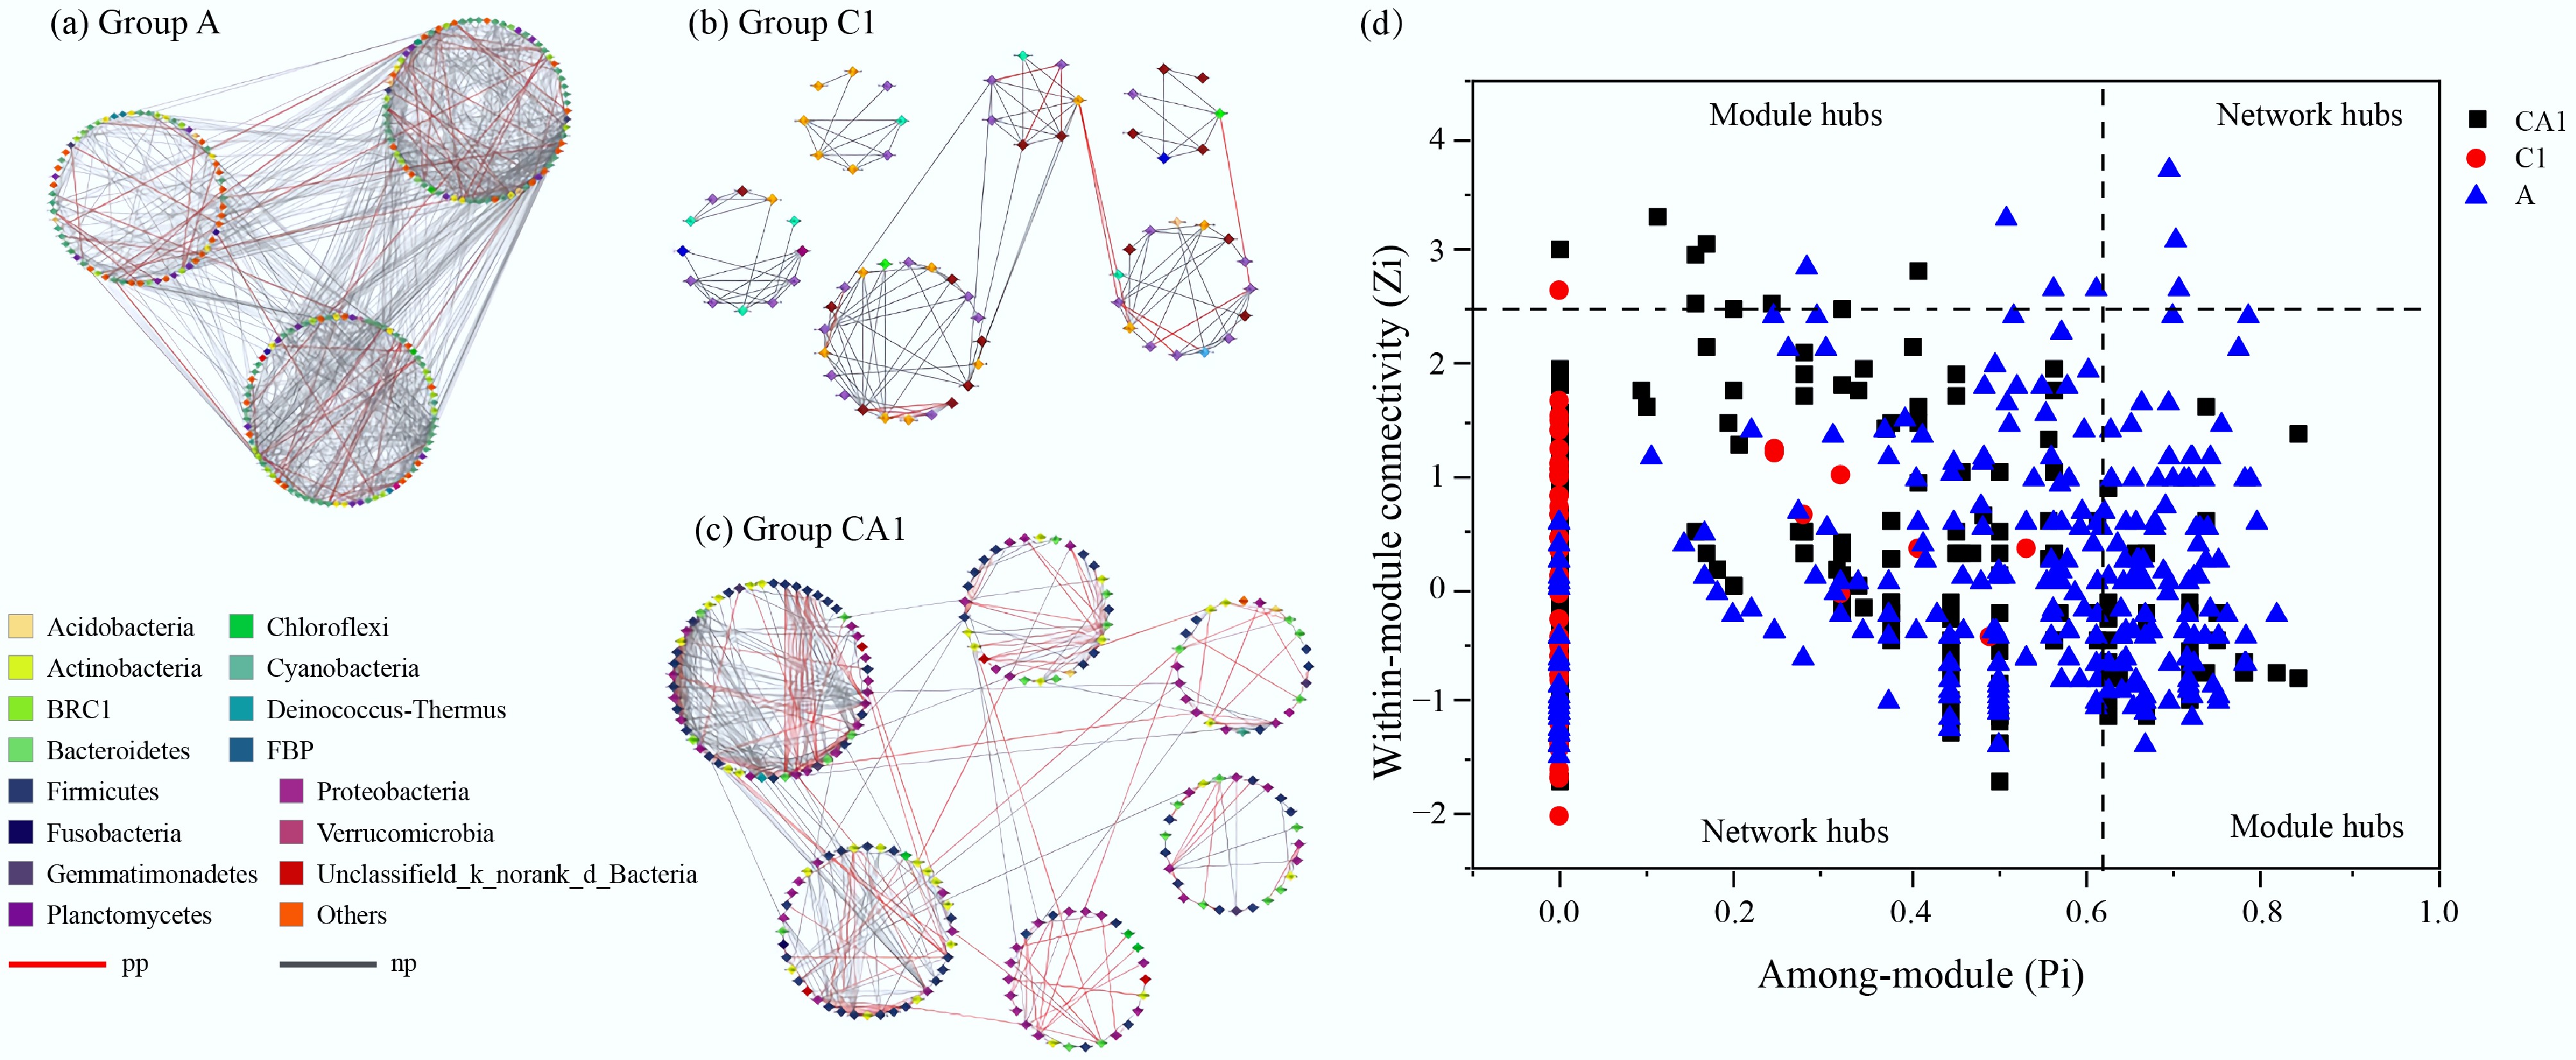
Figure 5.
Diagram of the soil bacterial molecular ecological network under three treatments. (a–c) Each node represents a bacterial OTU; red lines indicate positive interactions between nodes (pp), and gray lines indicate negative interactions between nodes (np). (d) Distribution of within-module connectivity–among-module connectivity (Zi–Pi) values for nodes in the microbial network.
-
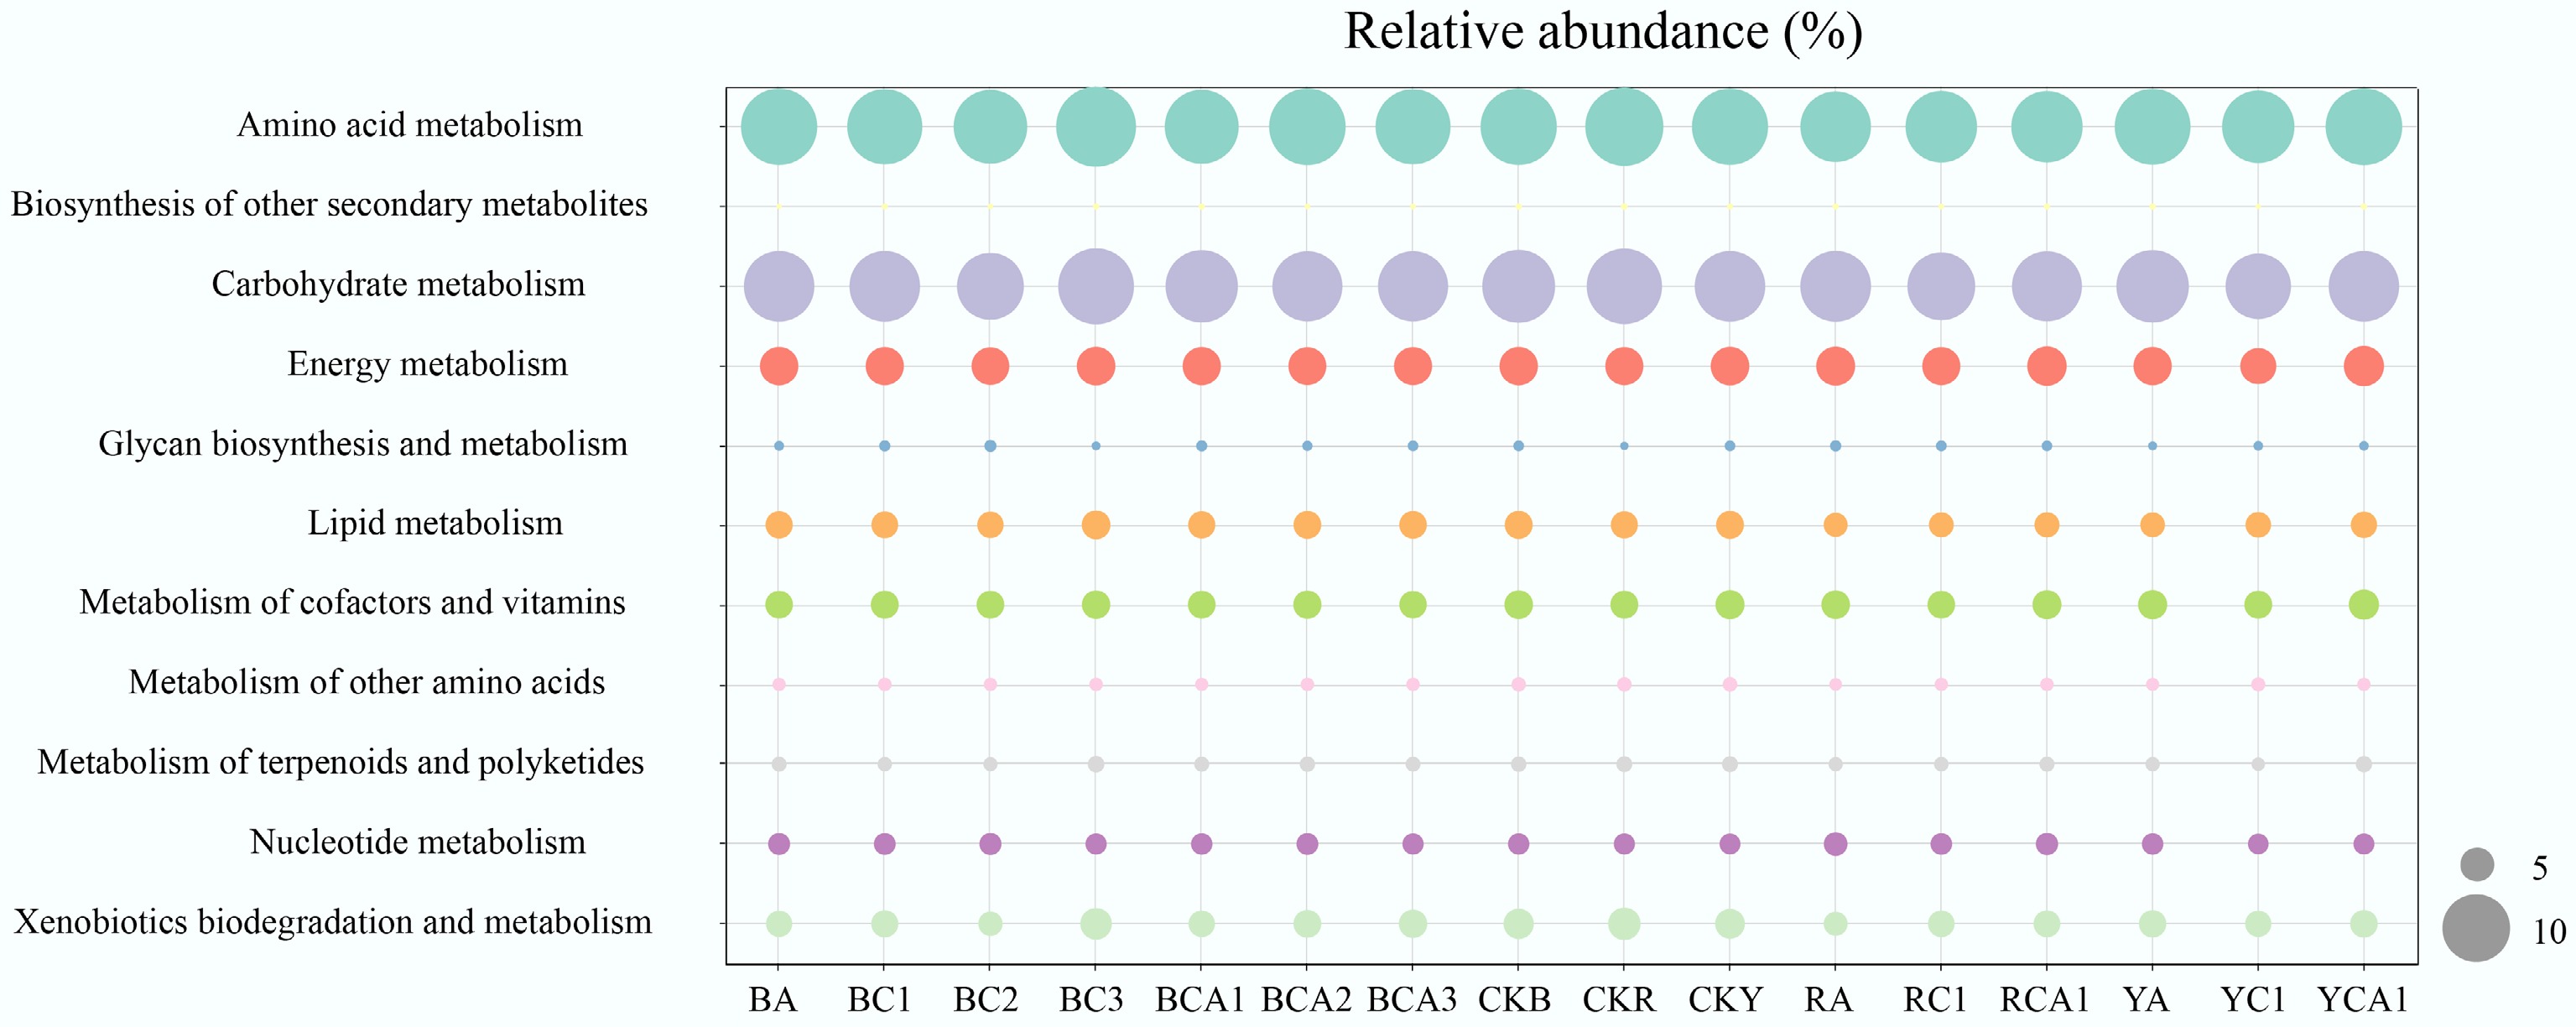
Figure 6.
PICRUSt function prediction.
Figures
(6)
Tables
(0)