-
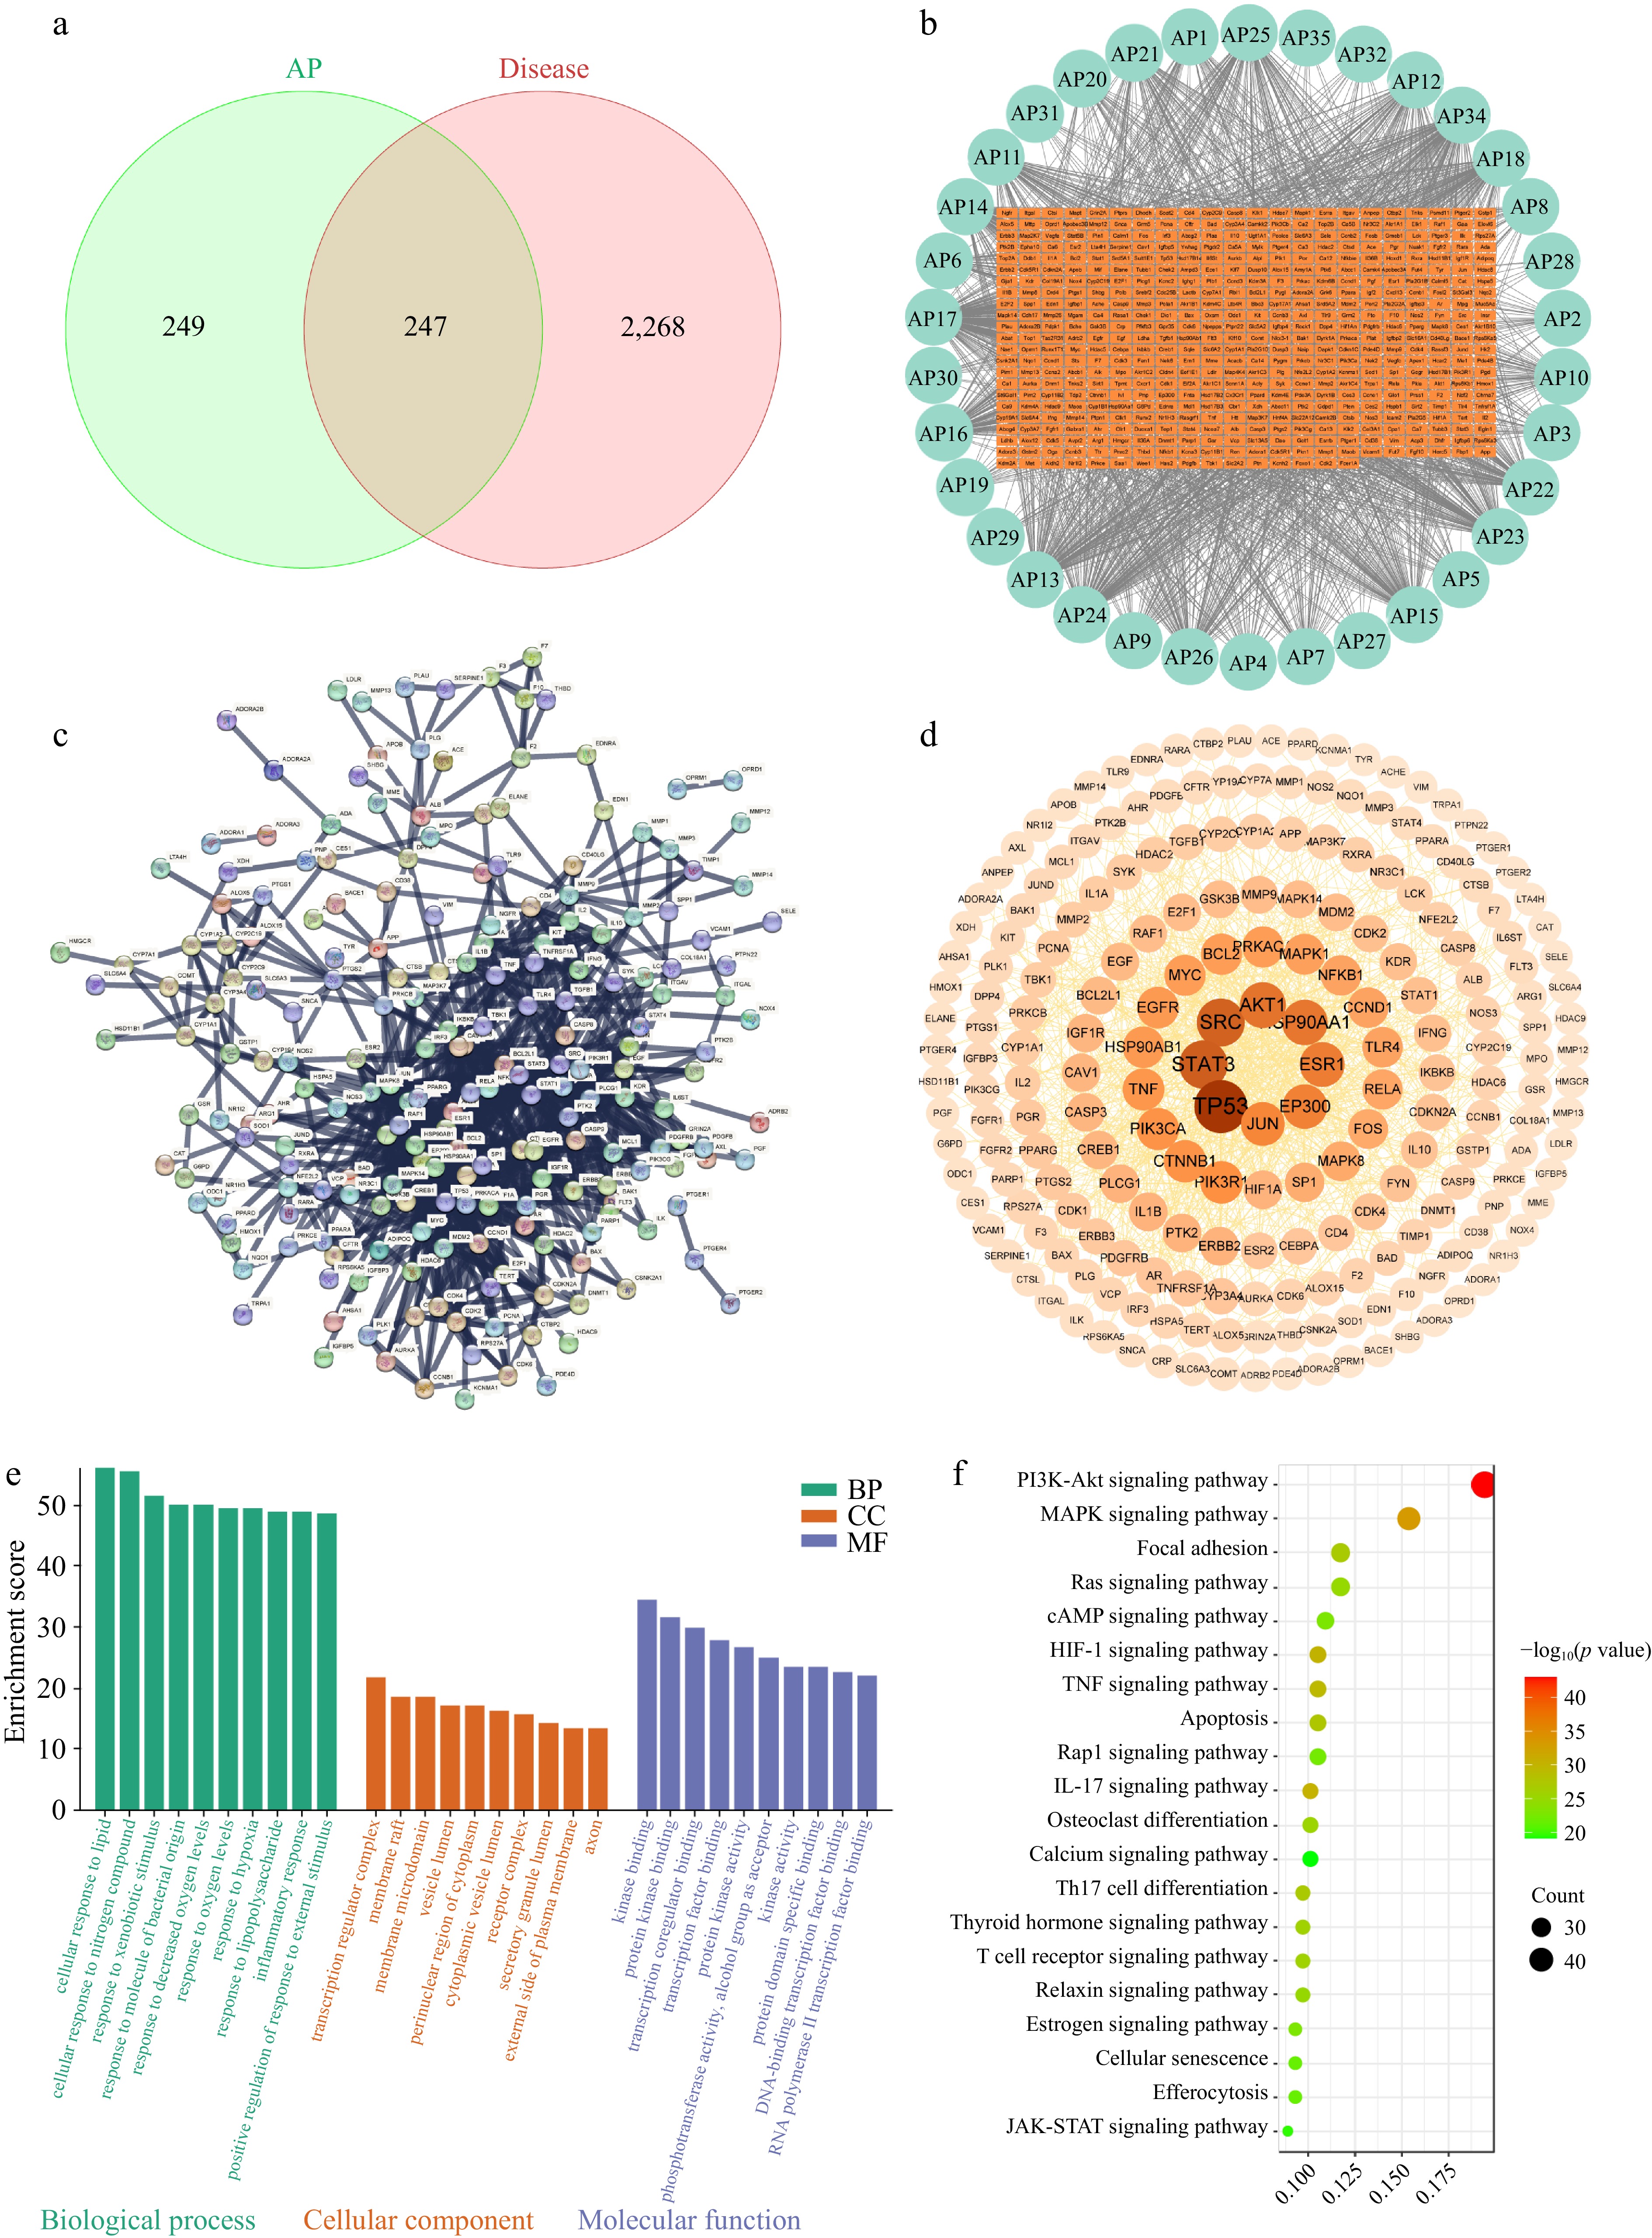
Figure 1.
Network pharmacology analysis of APs in the treatment of immunosuppression. (a) Component–disease intersection targets. (b) APs' component–target network diagram. (c) PPI network of the intersection targets of APs and immunosuppression. (d) The PPI network diagram after further analysis by Cytoscape, protein nodes with stronger interactions have larger sizes and darker colors. (e) GO enrichment analysis of the intersection targets. (f) KEGG enrichment analysis of intersection targets.
-
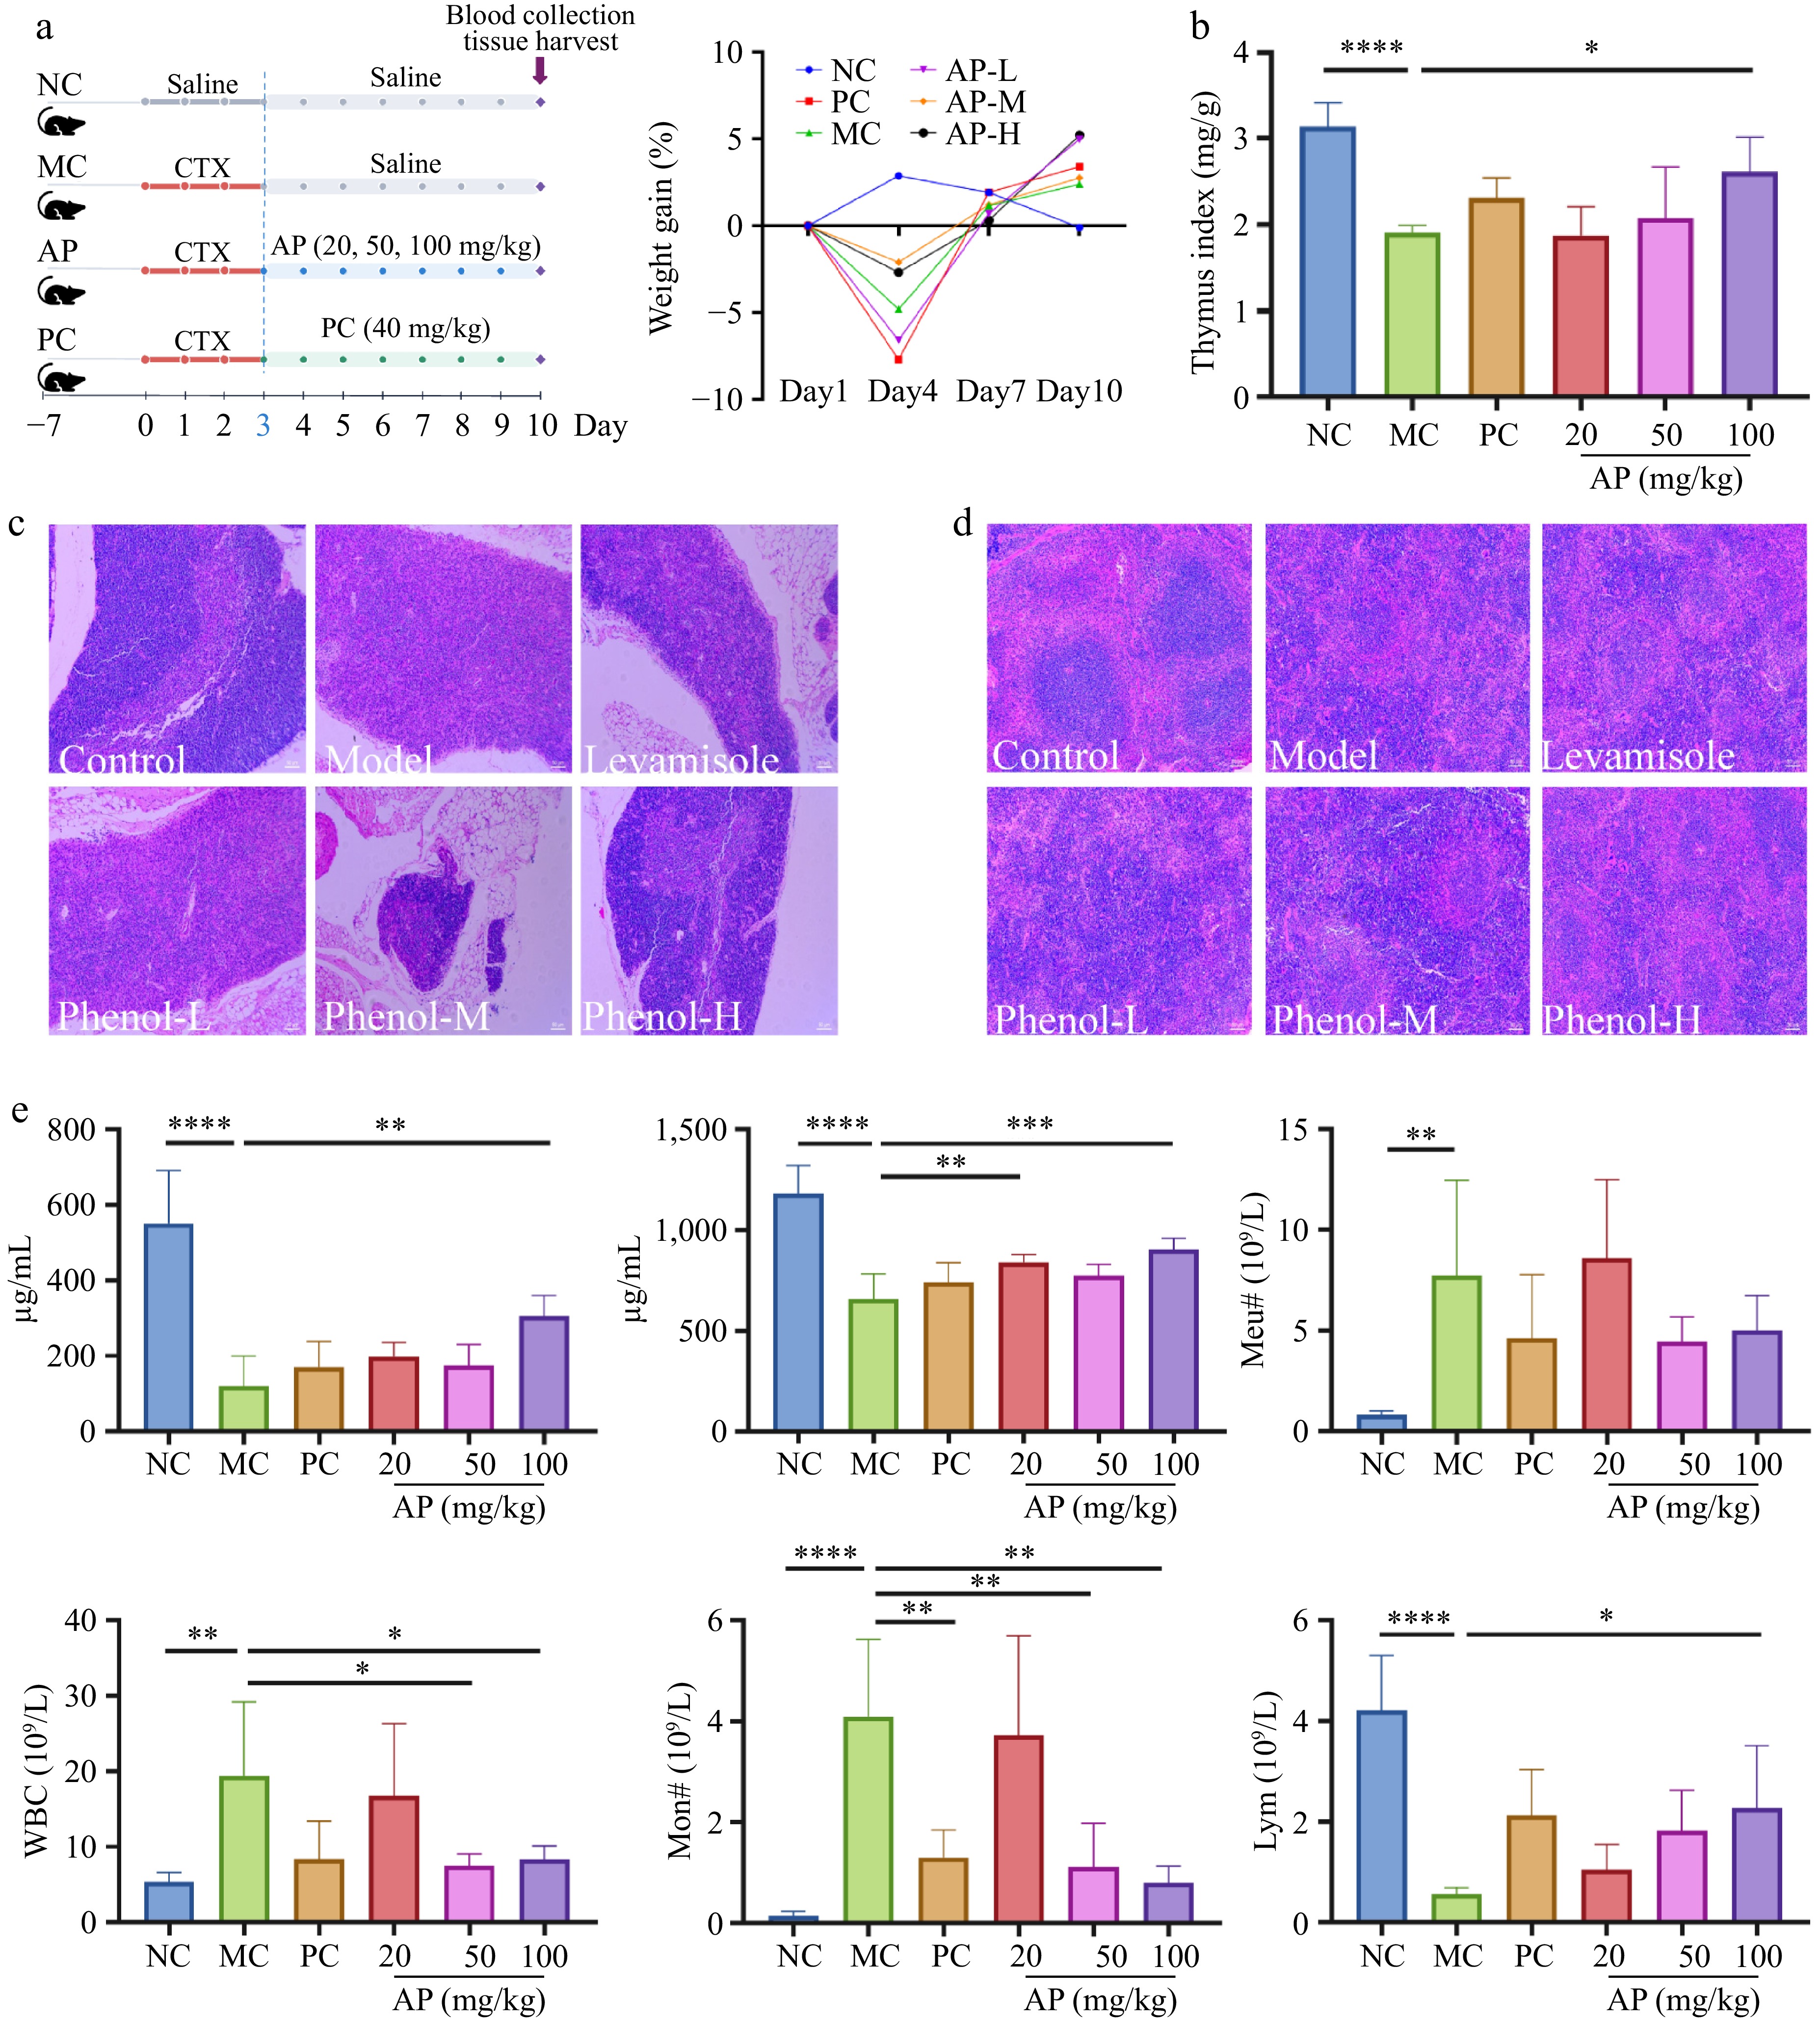
Figure 2.
Changes in the animal experiment's procedures and basic indexes of the mice. (a) Experimental protocol and changes in the BW of mice. (b) Changes in the thymus index. (c) Morphological changes in the thymus. (d) Morphological changes in the spleen. (e) Changes in biochemical indicators: IgA, IgM content changes and neutrophils, white blood cells, monocytes, and lymphocyte number changes. Note: *, p < 0.05, **, p < 0.01. ***, p < 0.001. ****, p < 0.0001.
-
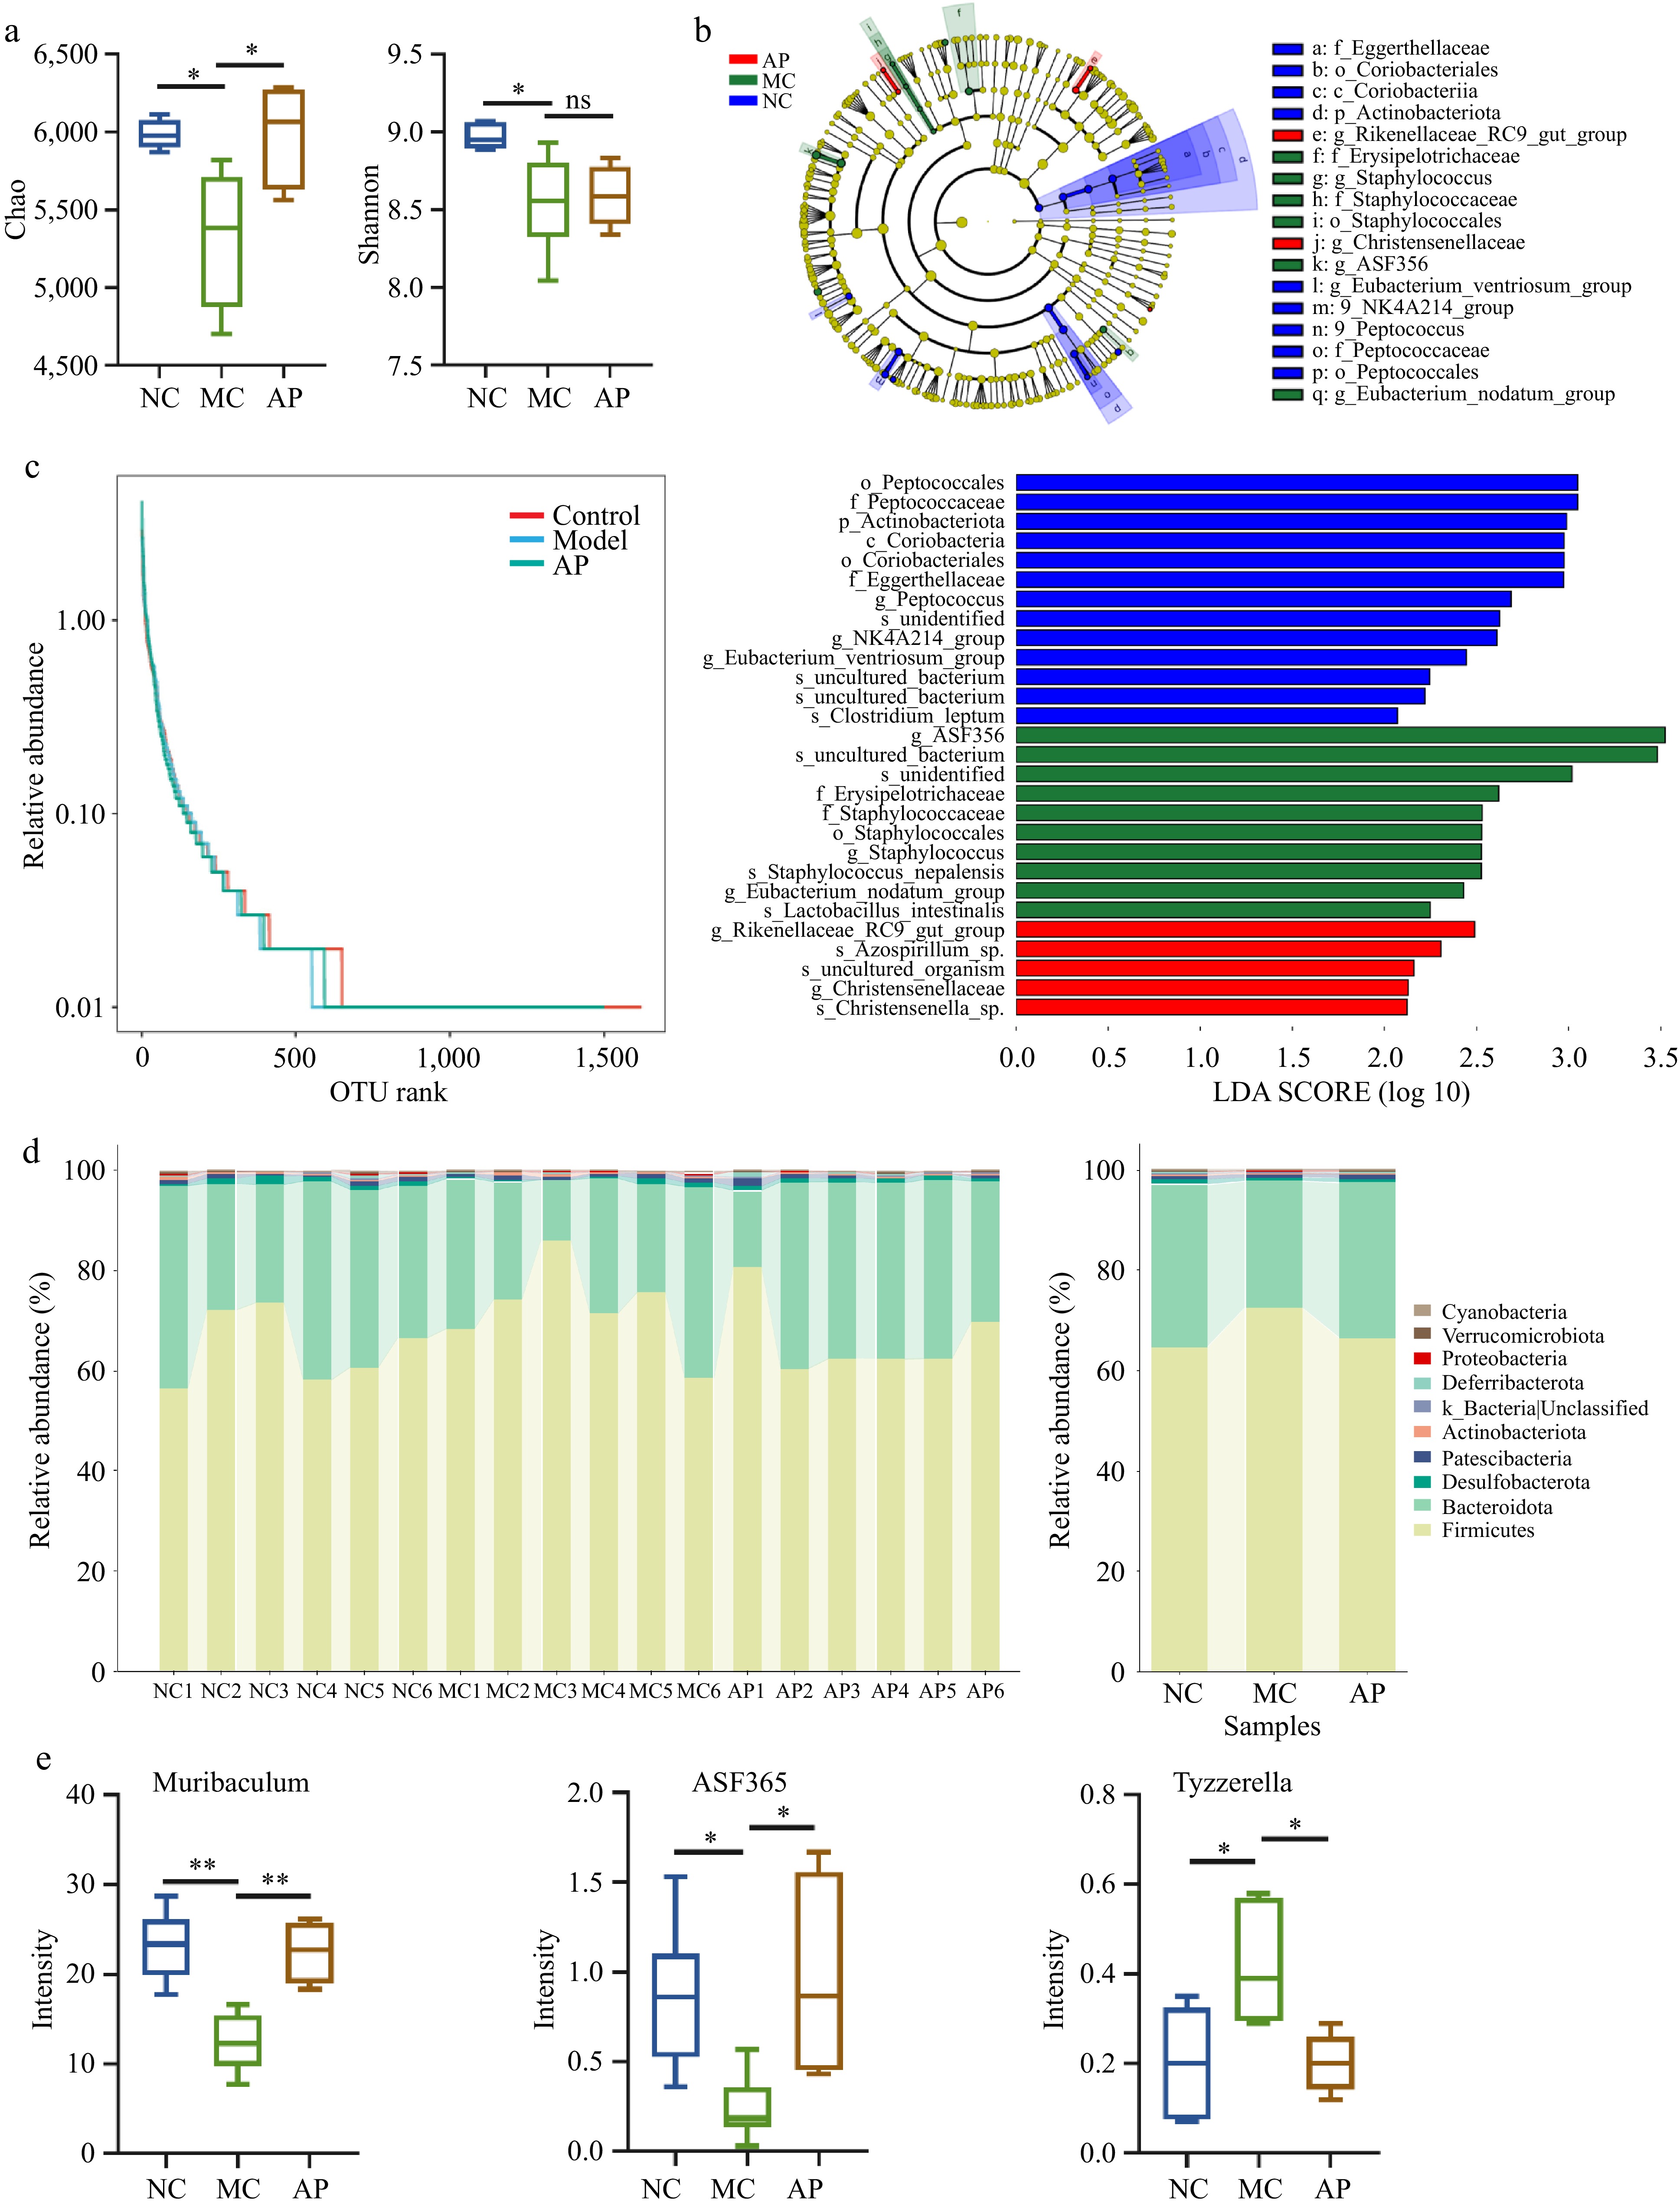
Figure 3.
APs altered the gut microbiota composition in mice. (a) Alpha diversity analysis. (b) Linear discriminant analysis effect size analysis. (c) Operational taxonomic units (OTU) rank analysis. (d) Relative abundance of differential genera. (e) Differential bacteria genera. Note: *, p < 0.05; **, p < 0.01.
-
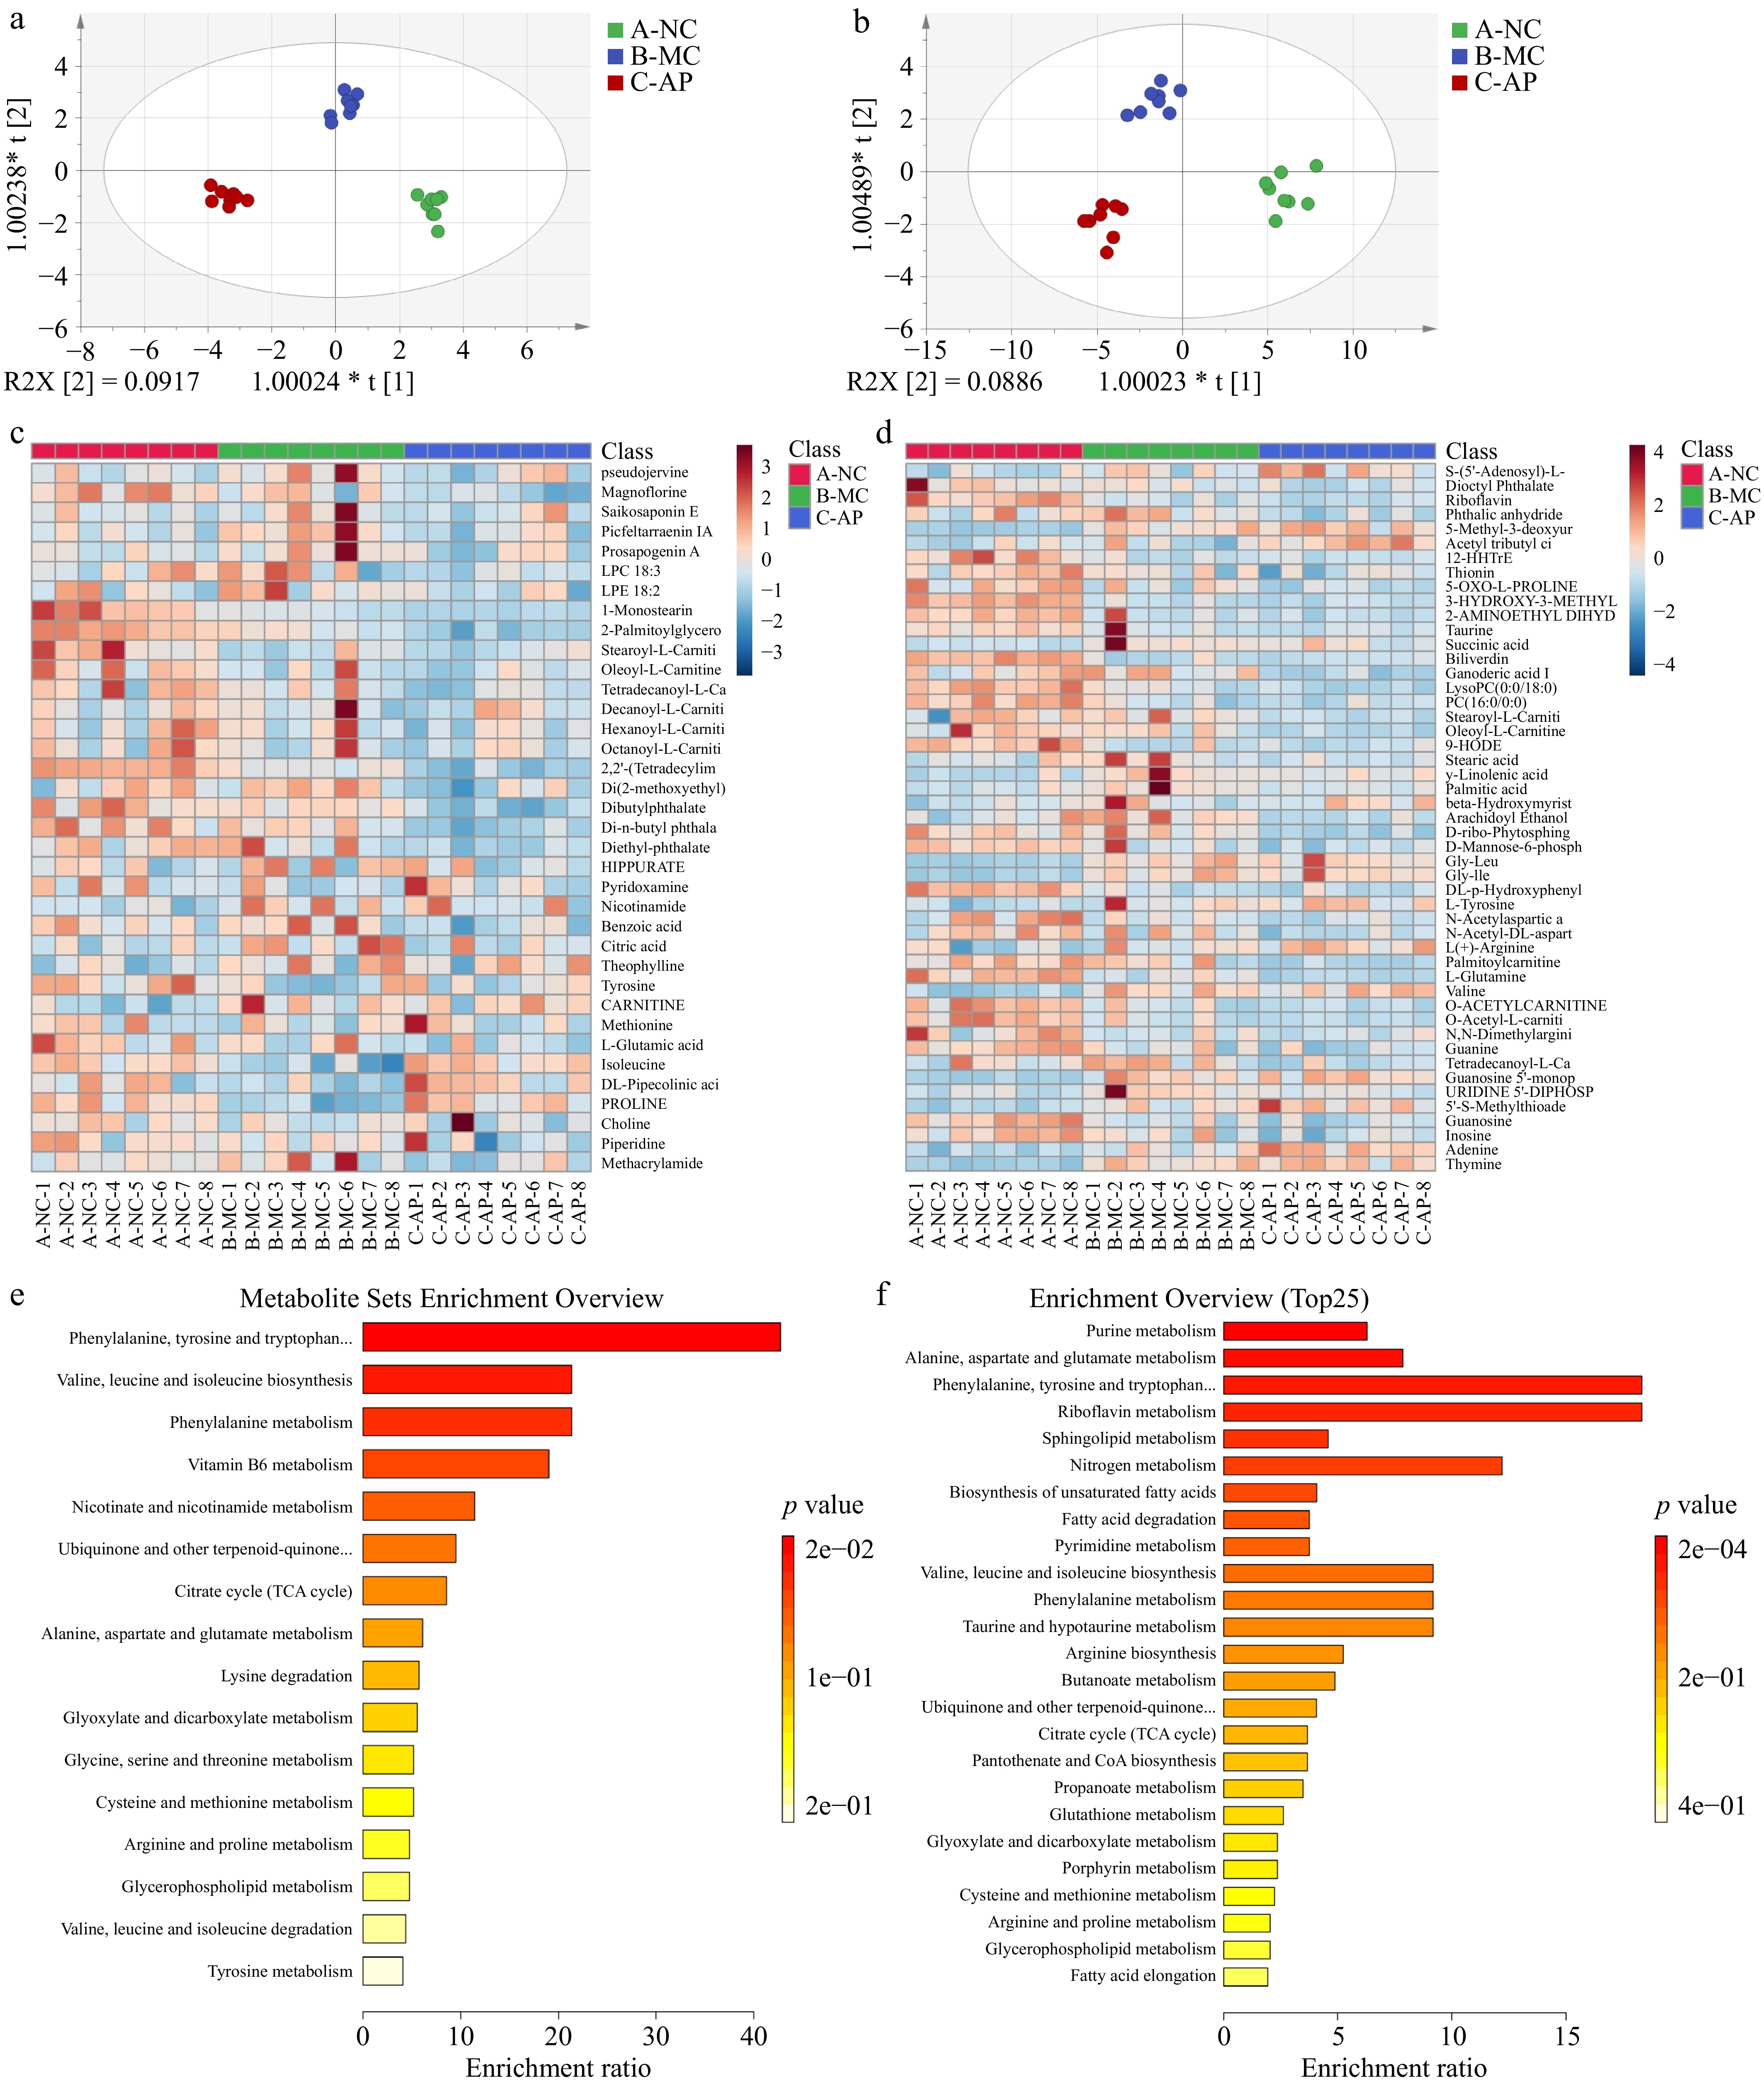
Figure 4.
Effects of the AP intervention on serum and spleen metabolites in mice. (a) Orthogonal partial least squares discriminant analysis (OPLS-DA) of serum metabolites. (b) OPLS-DA of splenic metabolites. (c) Heatmap analysis results of serum metabolites. (d) Heatmap analysis results of spleen metabolites. (e) Metabolite pathway analysis of serum differences. (f) Differential metabolite pathway analysis in the spleen.
-
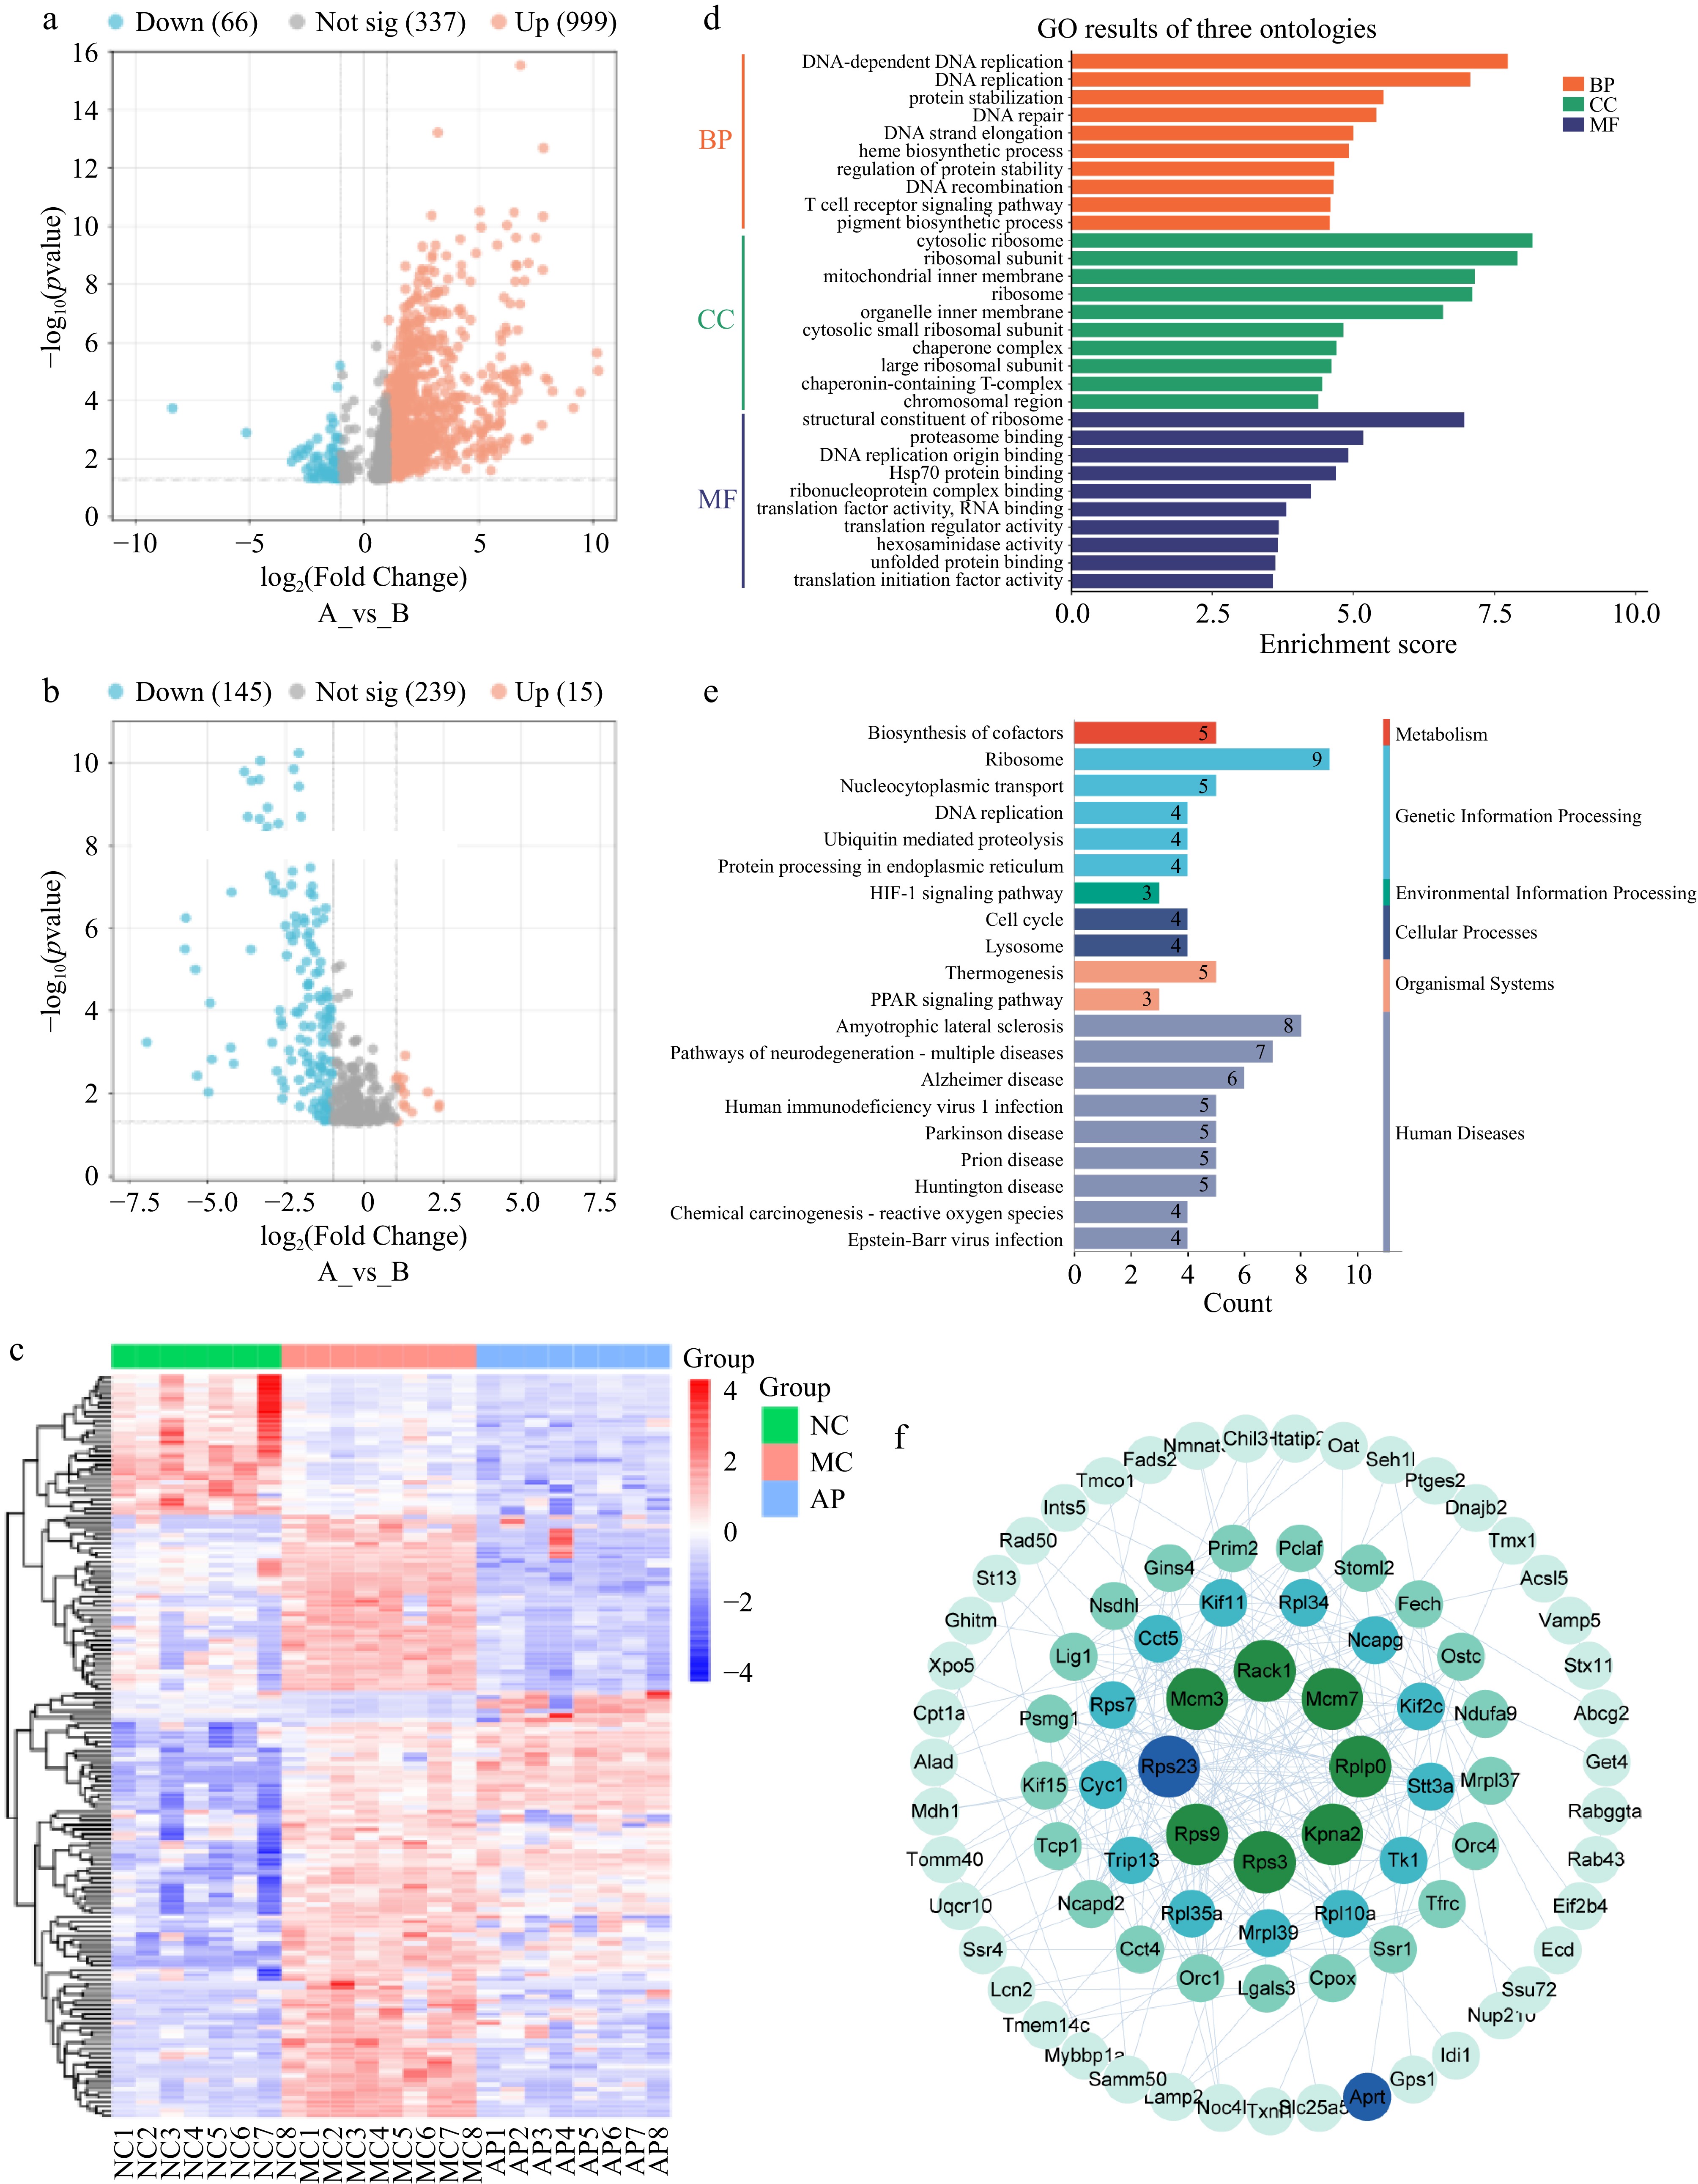
Figure 5.
Effects of the AP intervention on spleen protein in mice. (a) Volcano map analysis (NC vs MC). (b) Volcano map analysis (MC vs AP). (c) Differential protein heatmap analysis among the three groups. (d) GO enrichment analysis of spleen proteins. (e) KEGG analysis of spleen proteins. (f) Spleen protein interaction analysis.
-
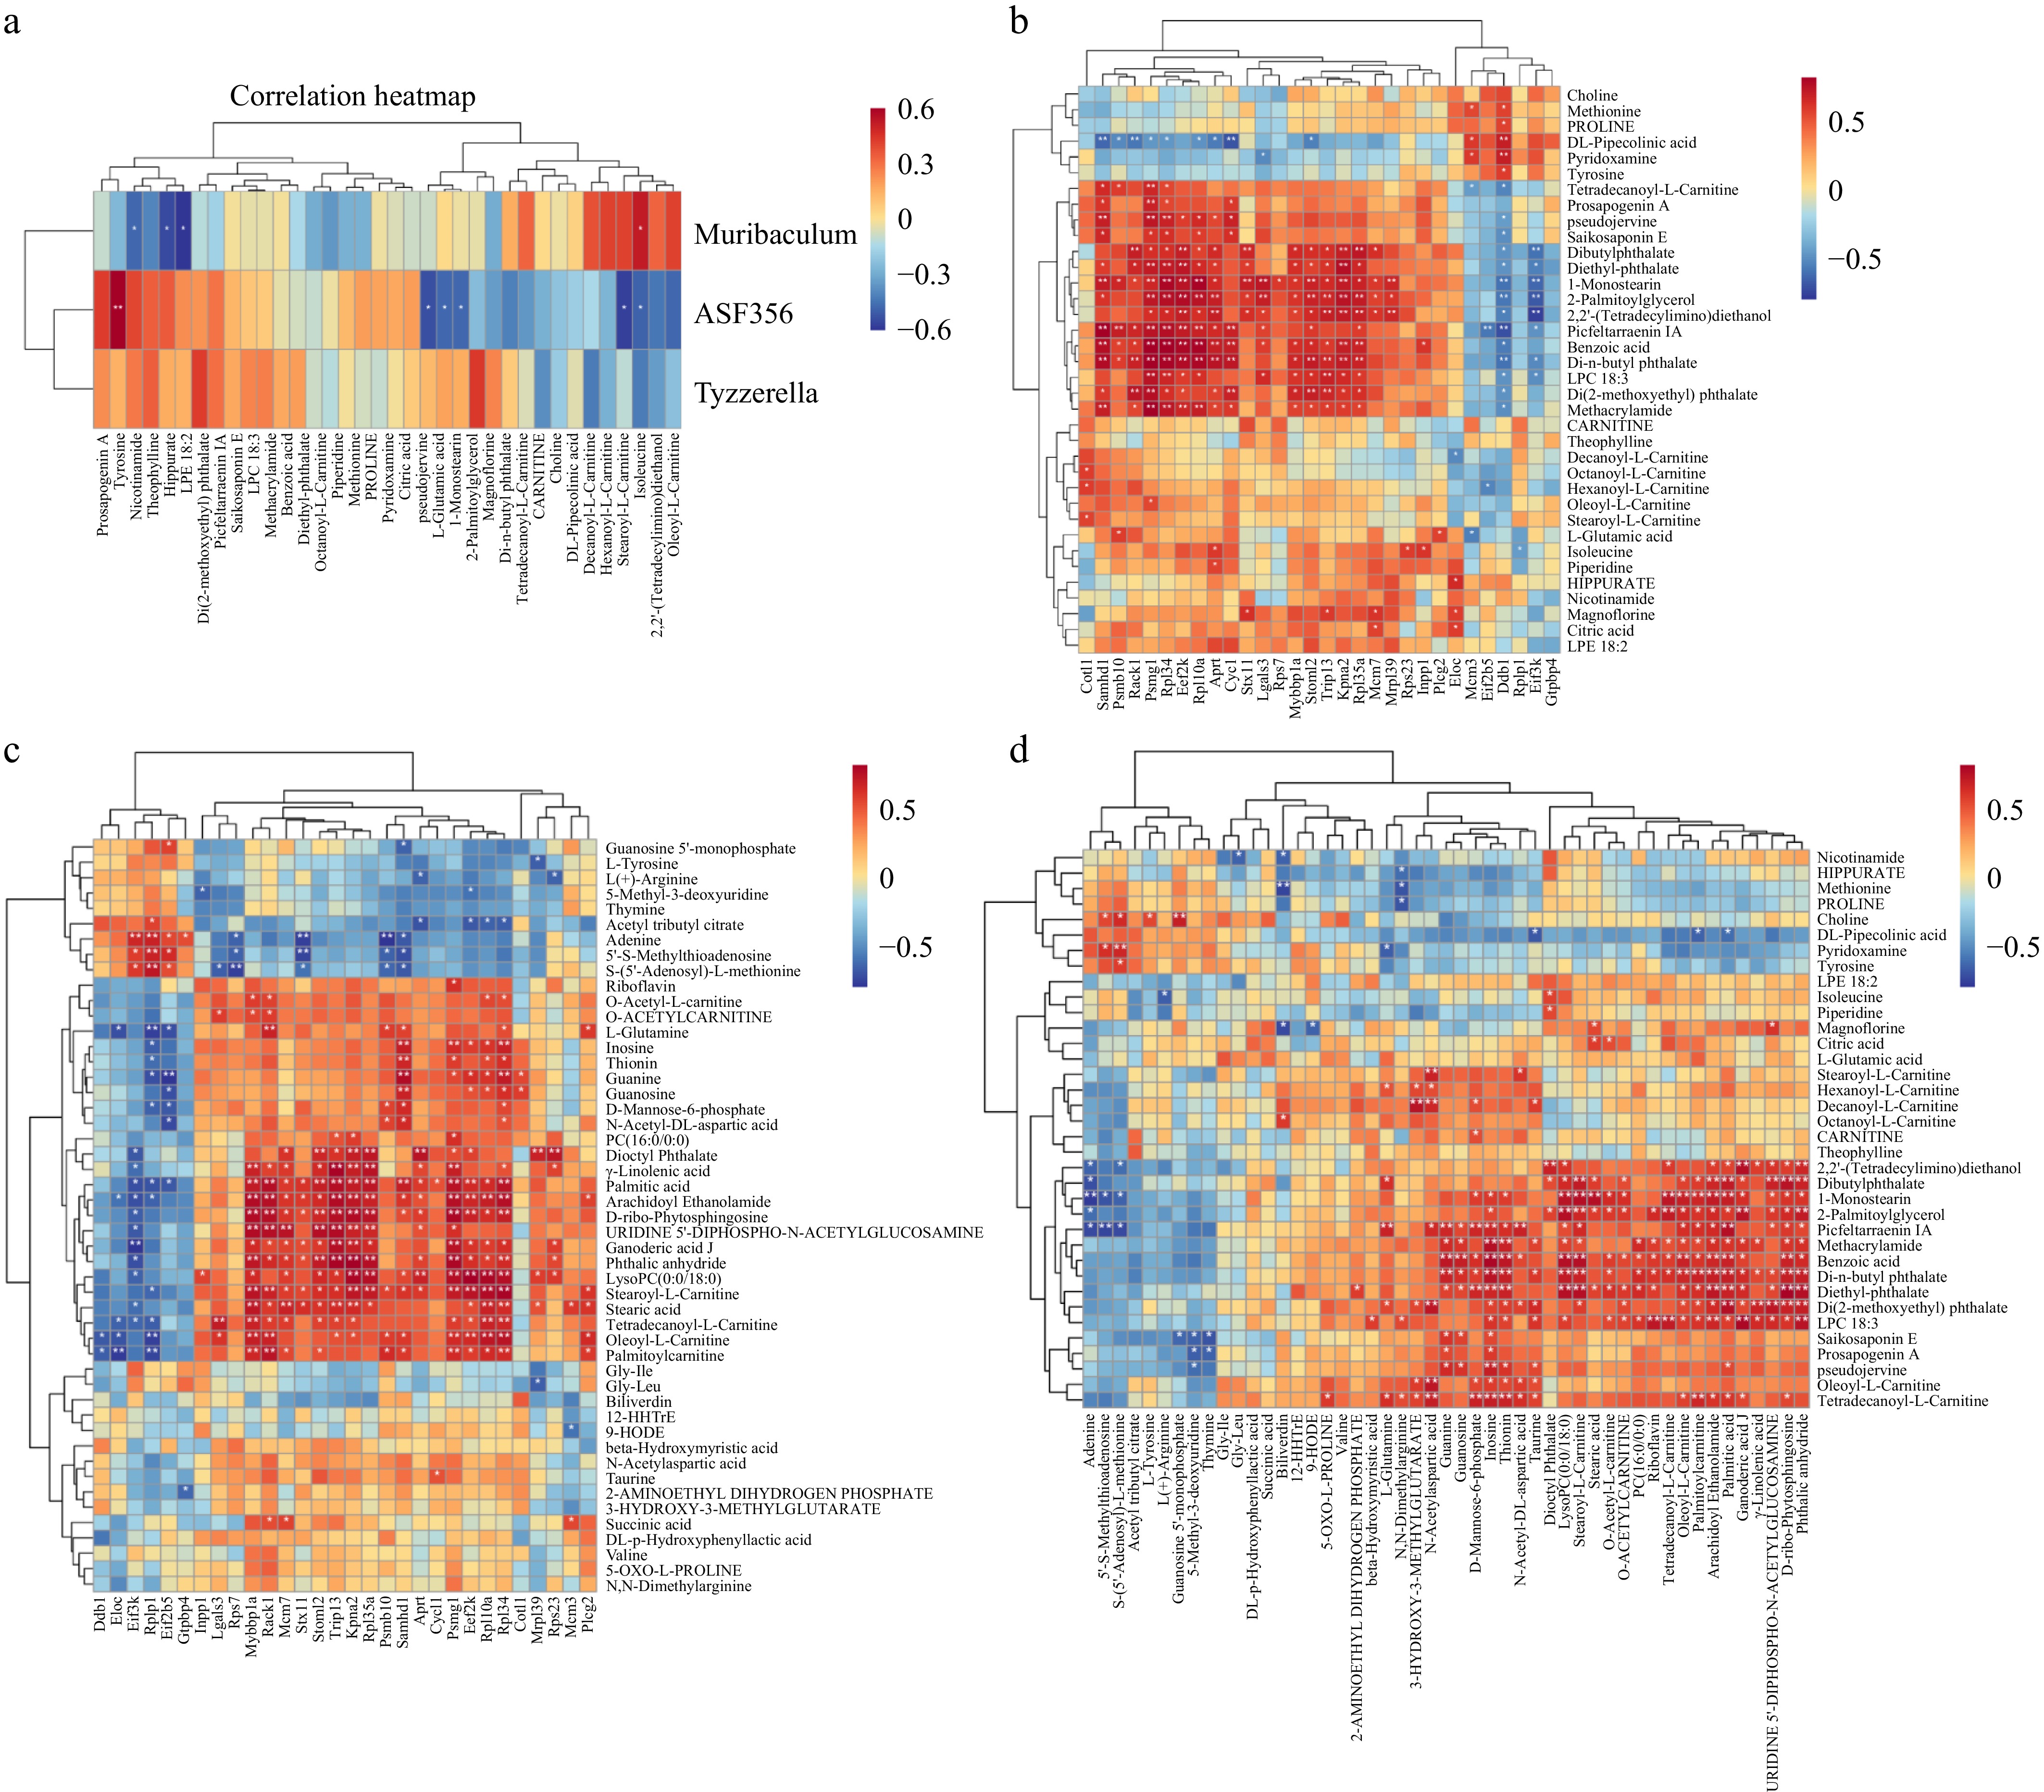
Figure 6.
Integration of multi-omics data. (a) Spearman correlation analysis of intestinal flora and serum metabolites. (b) Spearman correlation analysis between serum metabolites and spleen proteins. (c) Spearman correlation analysis of spleen proteins and spleen metabolites. (d) Spearman correlation analysis of spleen metabolites and serum metabolites. Note: *, p < 0.05; **, p < 0.01.
-
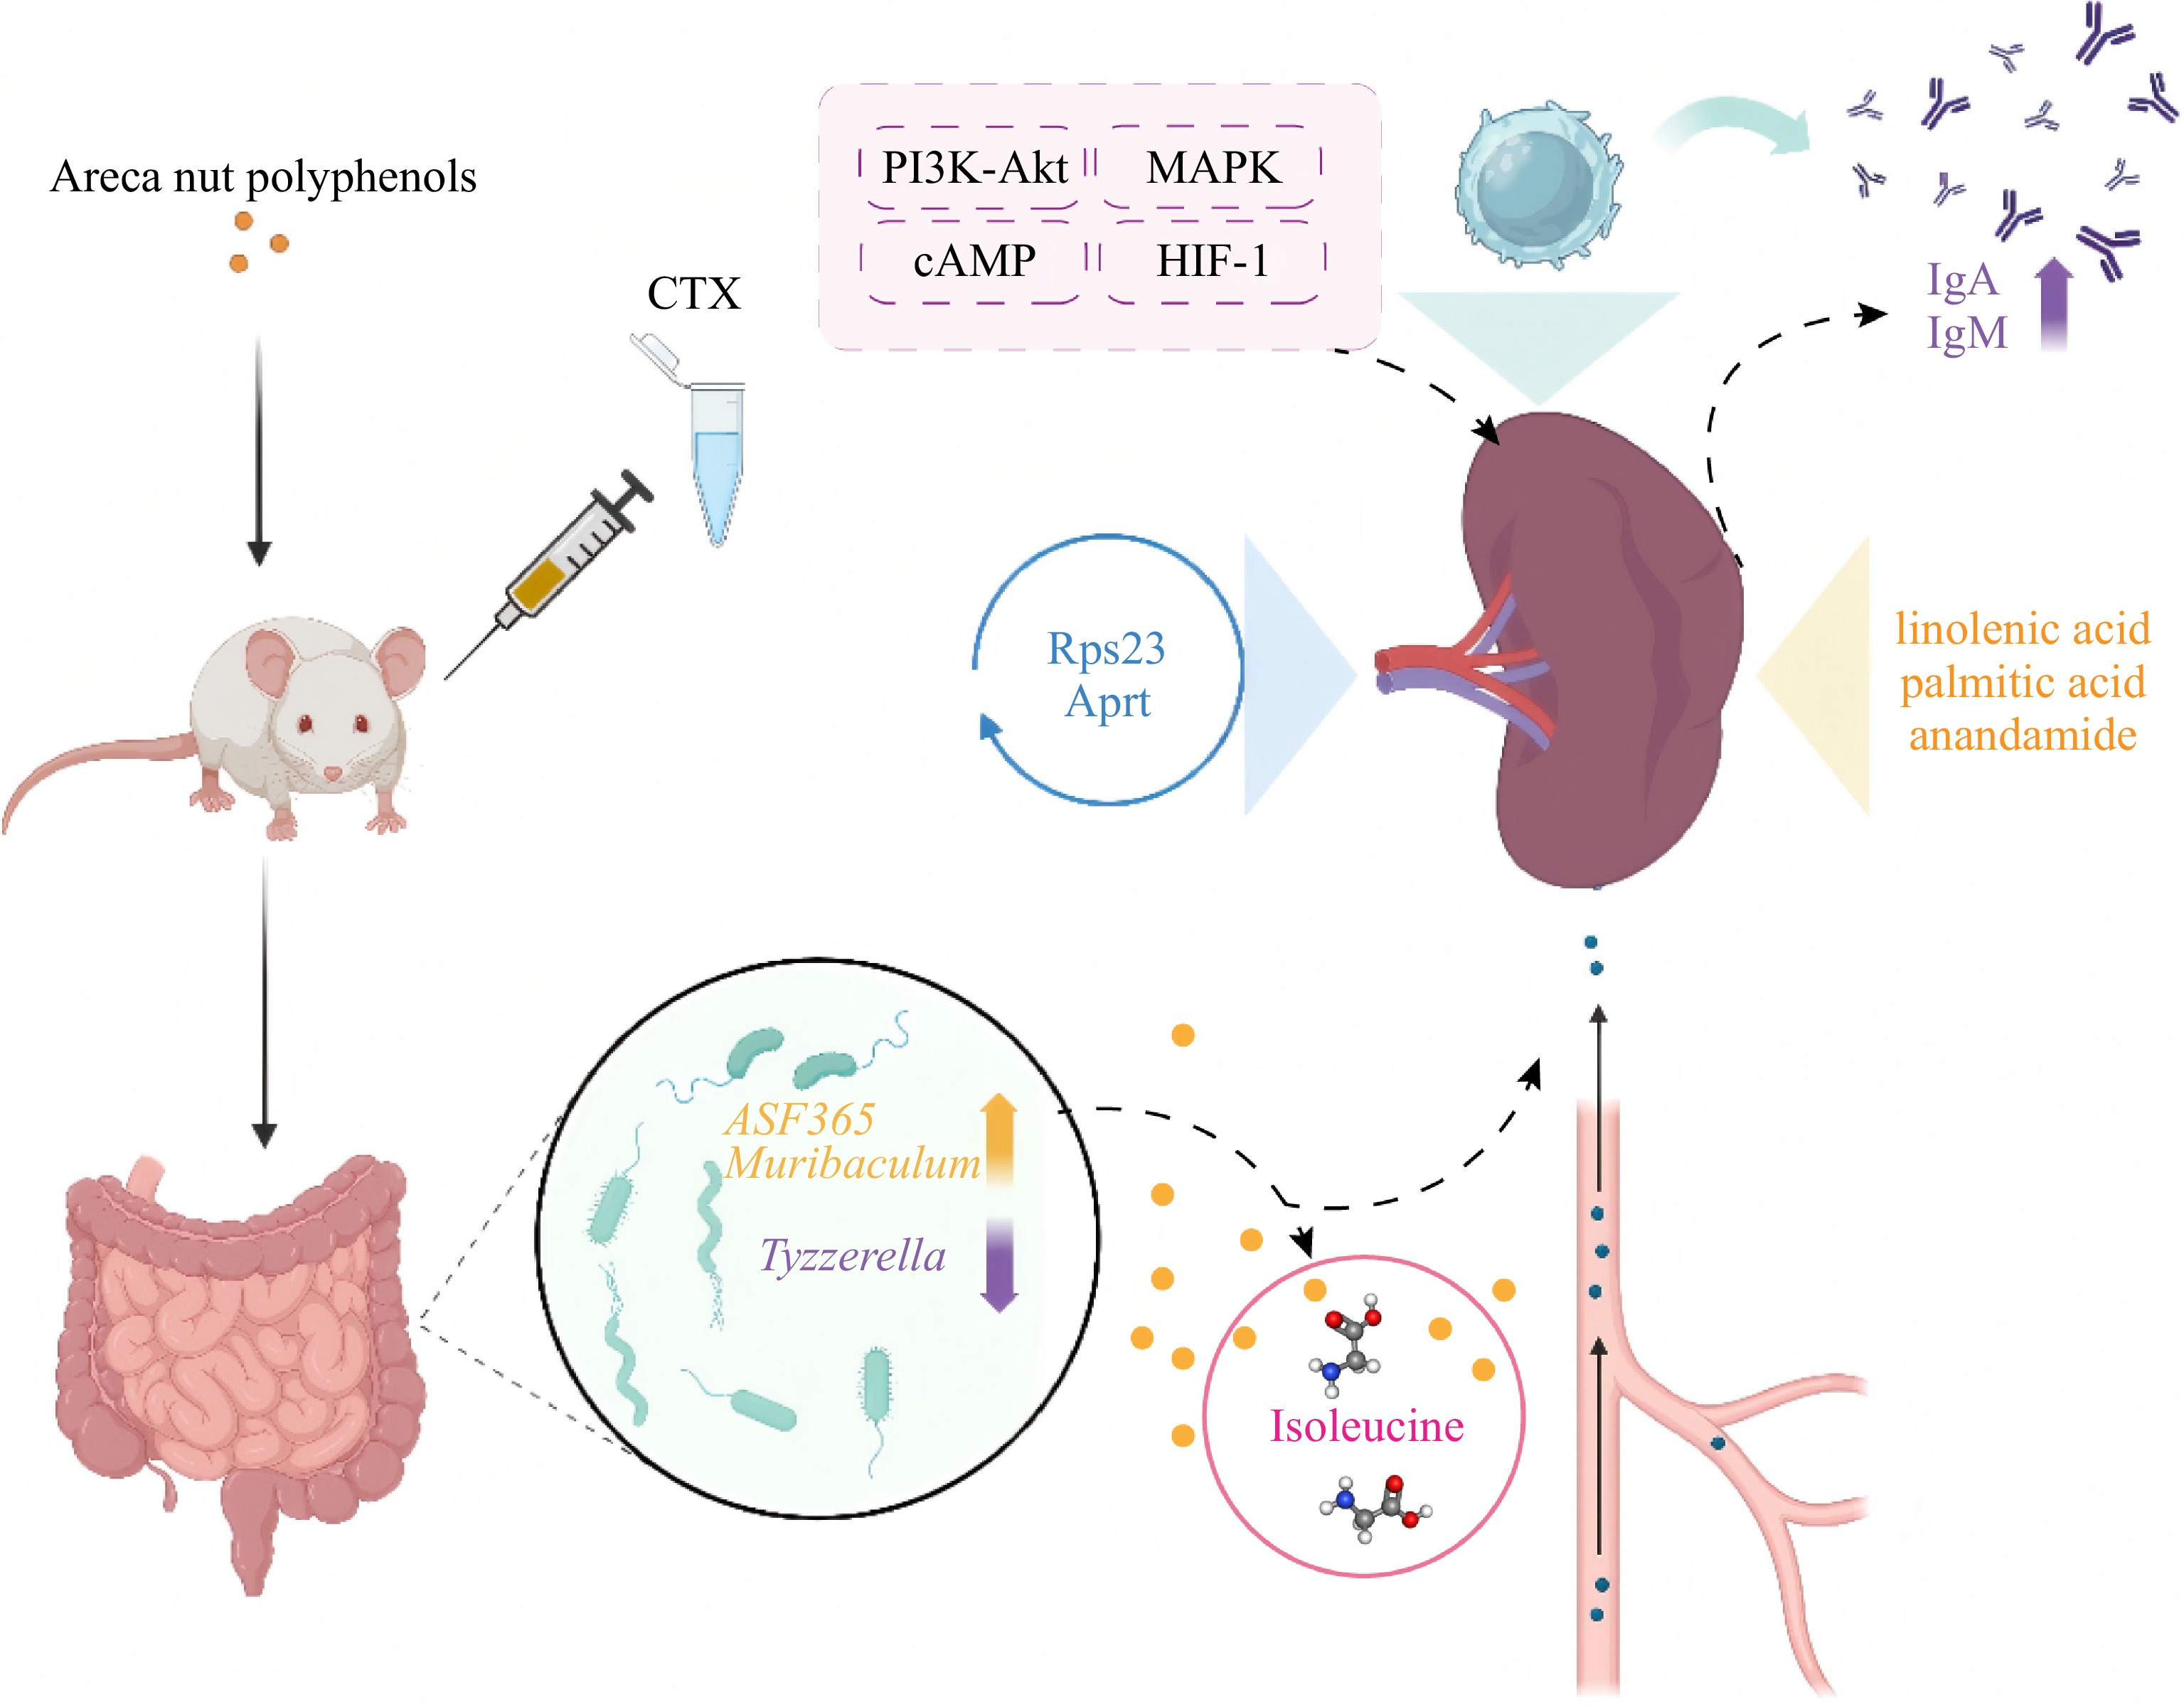
Figure 7.
Schematic diagram of potential mechanisms.
Figures
(7)
Tables
(0)