-
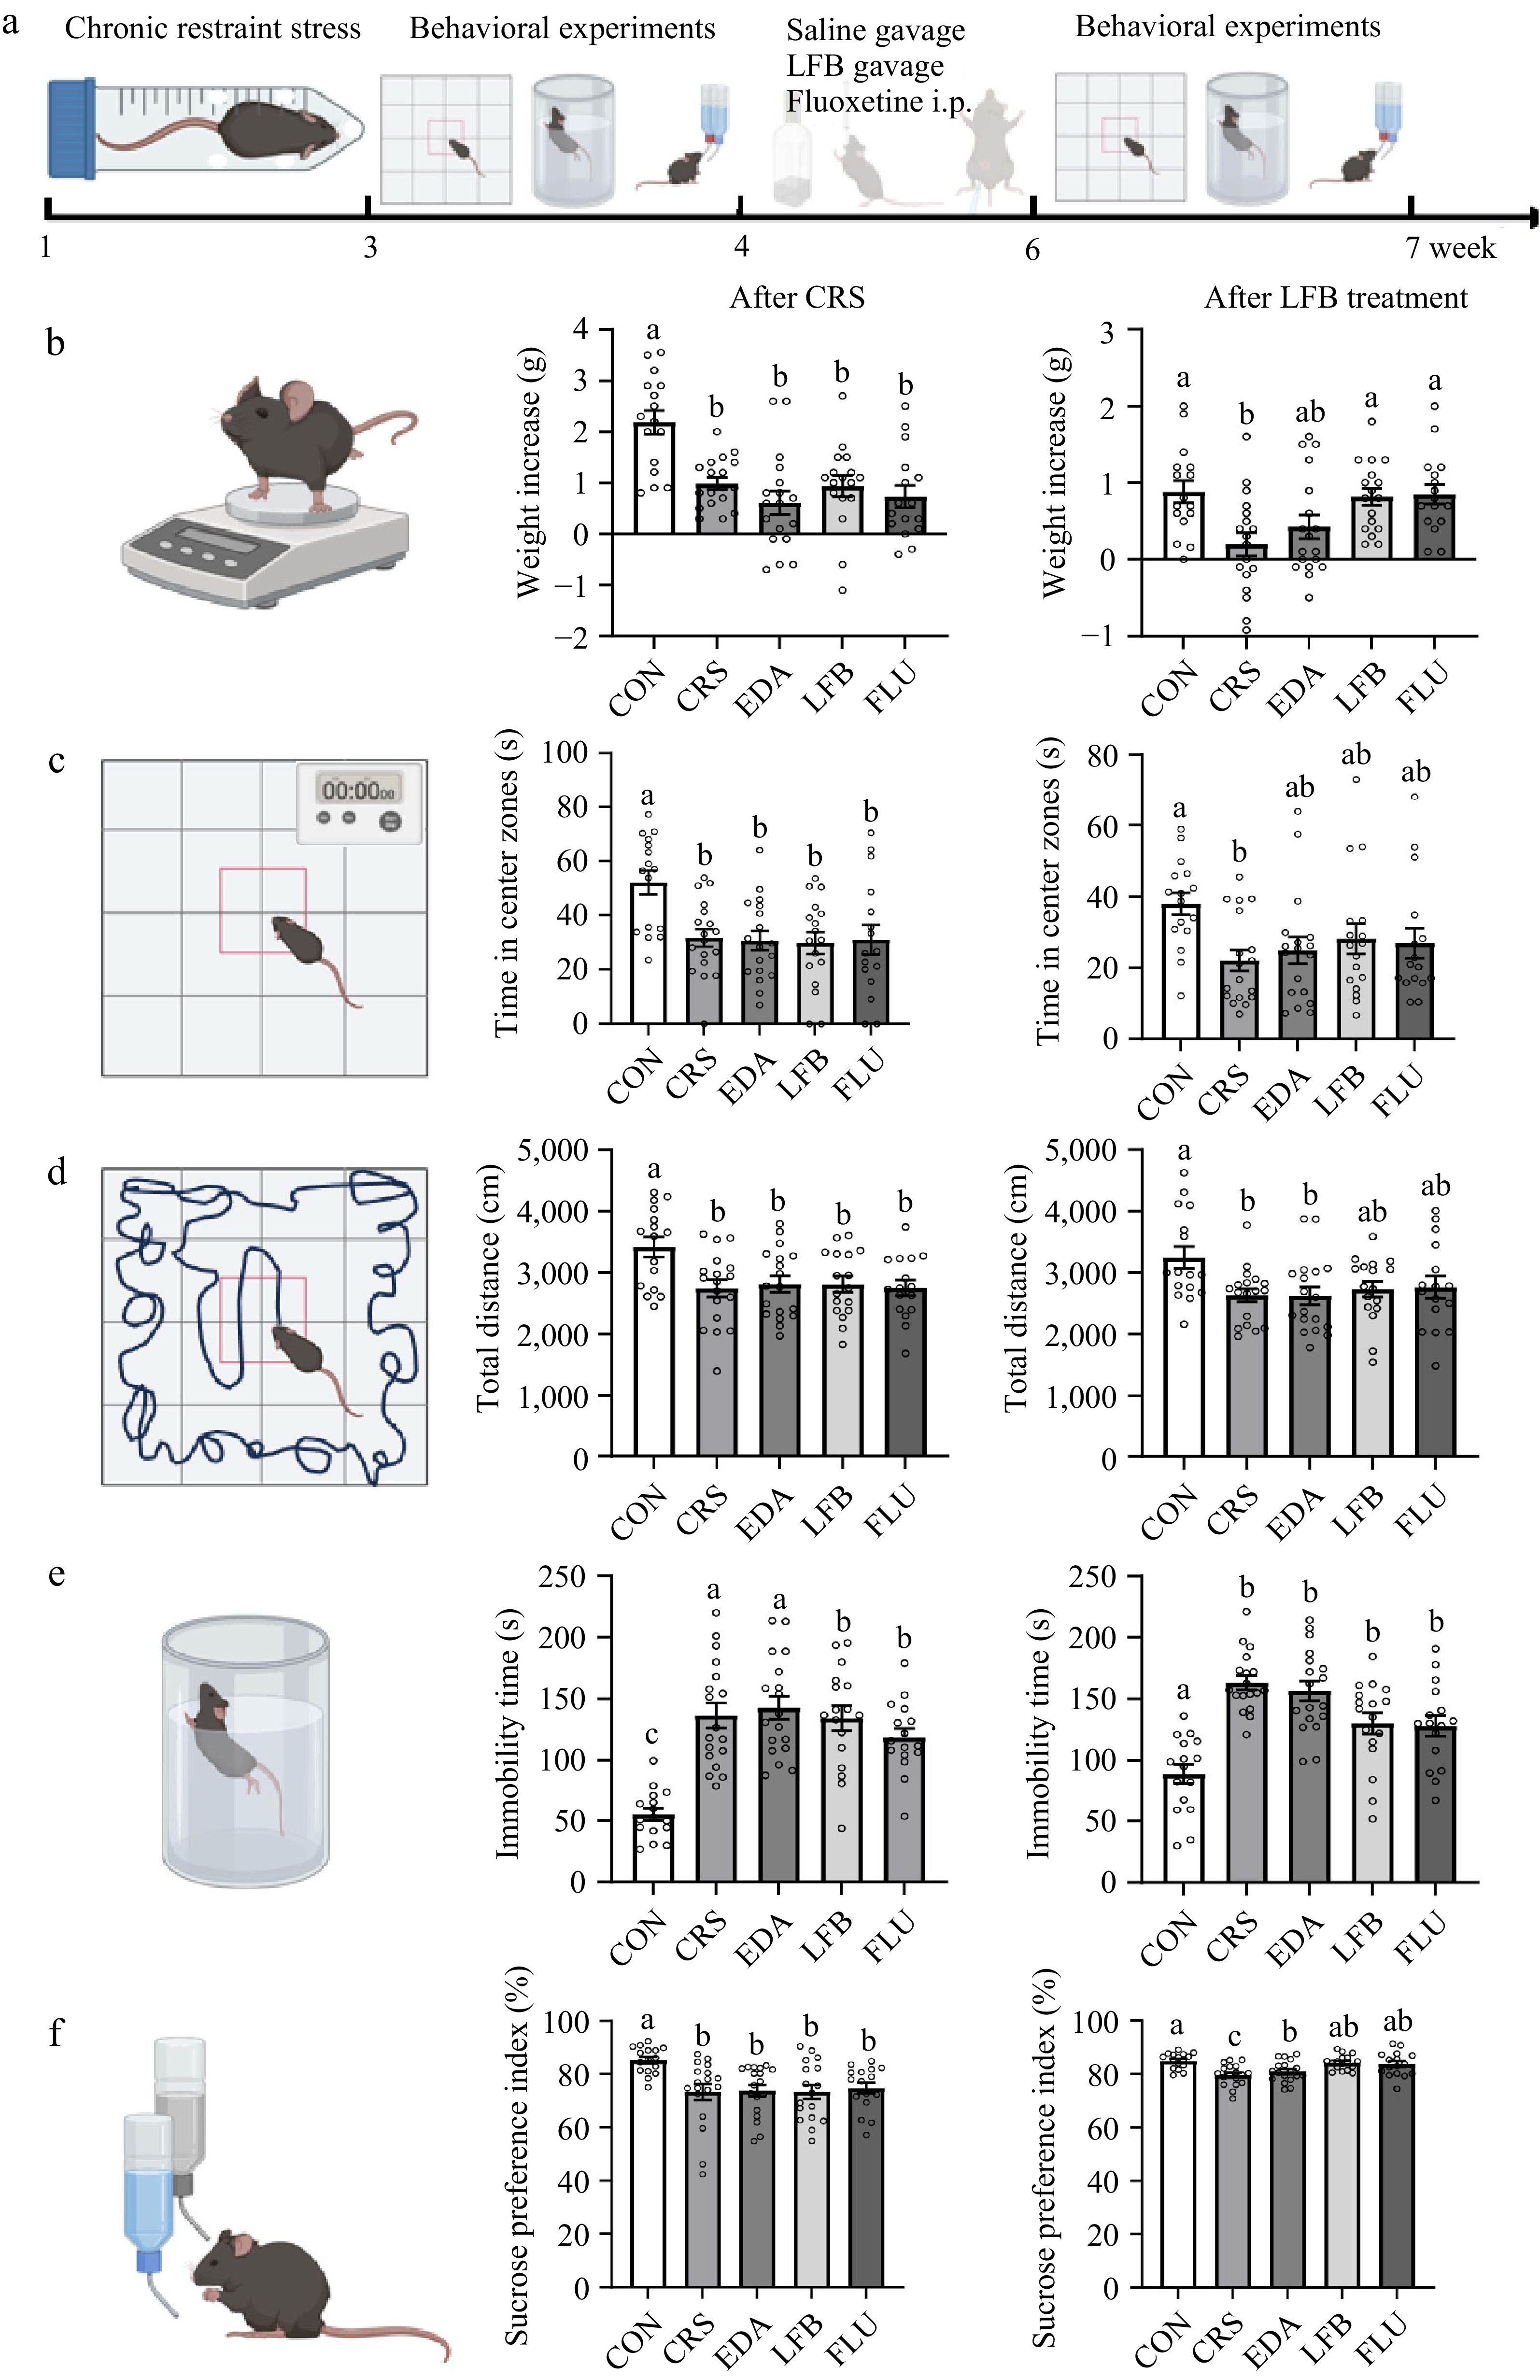
Figure 1.
Effects of LFB on body weight and behavioral outcomes under chronic restraint stress. (a) Schematic timeline of the experimental design illustrating chronic restraint stress (CRS) exposure, subsequent interventions, and behavioral assessments used to evaluate stress-associated behavioral outcomes. (b) Changes in body weight following CRS exposure and subsequent interventions. (c) Time spent in the center zone during the open field test, reflecting exploratory behavior under stress conditions. (d) Total distance traveled in the open field test, indicating locomotor activity. (e) Immobility time in the forced swim test, representing stress-associated behavioral despair-like responses. (f) Sucrose preference index in the sucrose preference test, reflecting reward-related behavioral responsiveness. Control group (CON), chronic restraint stress group (CRS), edible alcohol group (EDA), Luzhou-flavor Baijiu group (LFB), and fluoxetine group (FLU) (n = 16 per group). Different superscript letters (a, b, c) indicate statistically significant differences between groups (p < 0.05), while groups sharing at least one common letter are not significantly different. Illustrations were created using BioRender.com (
https://BioRender.com/0yqfv7d ). -
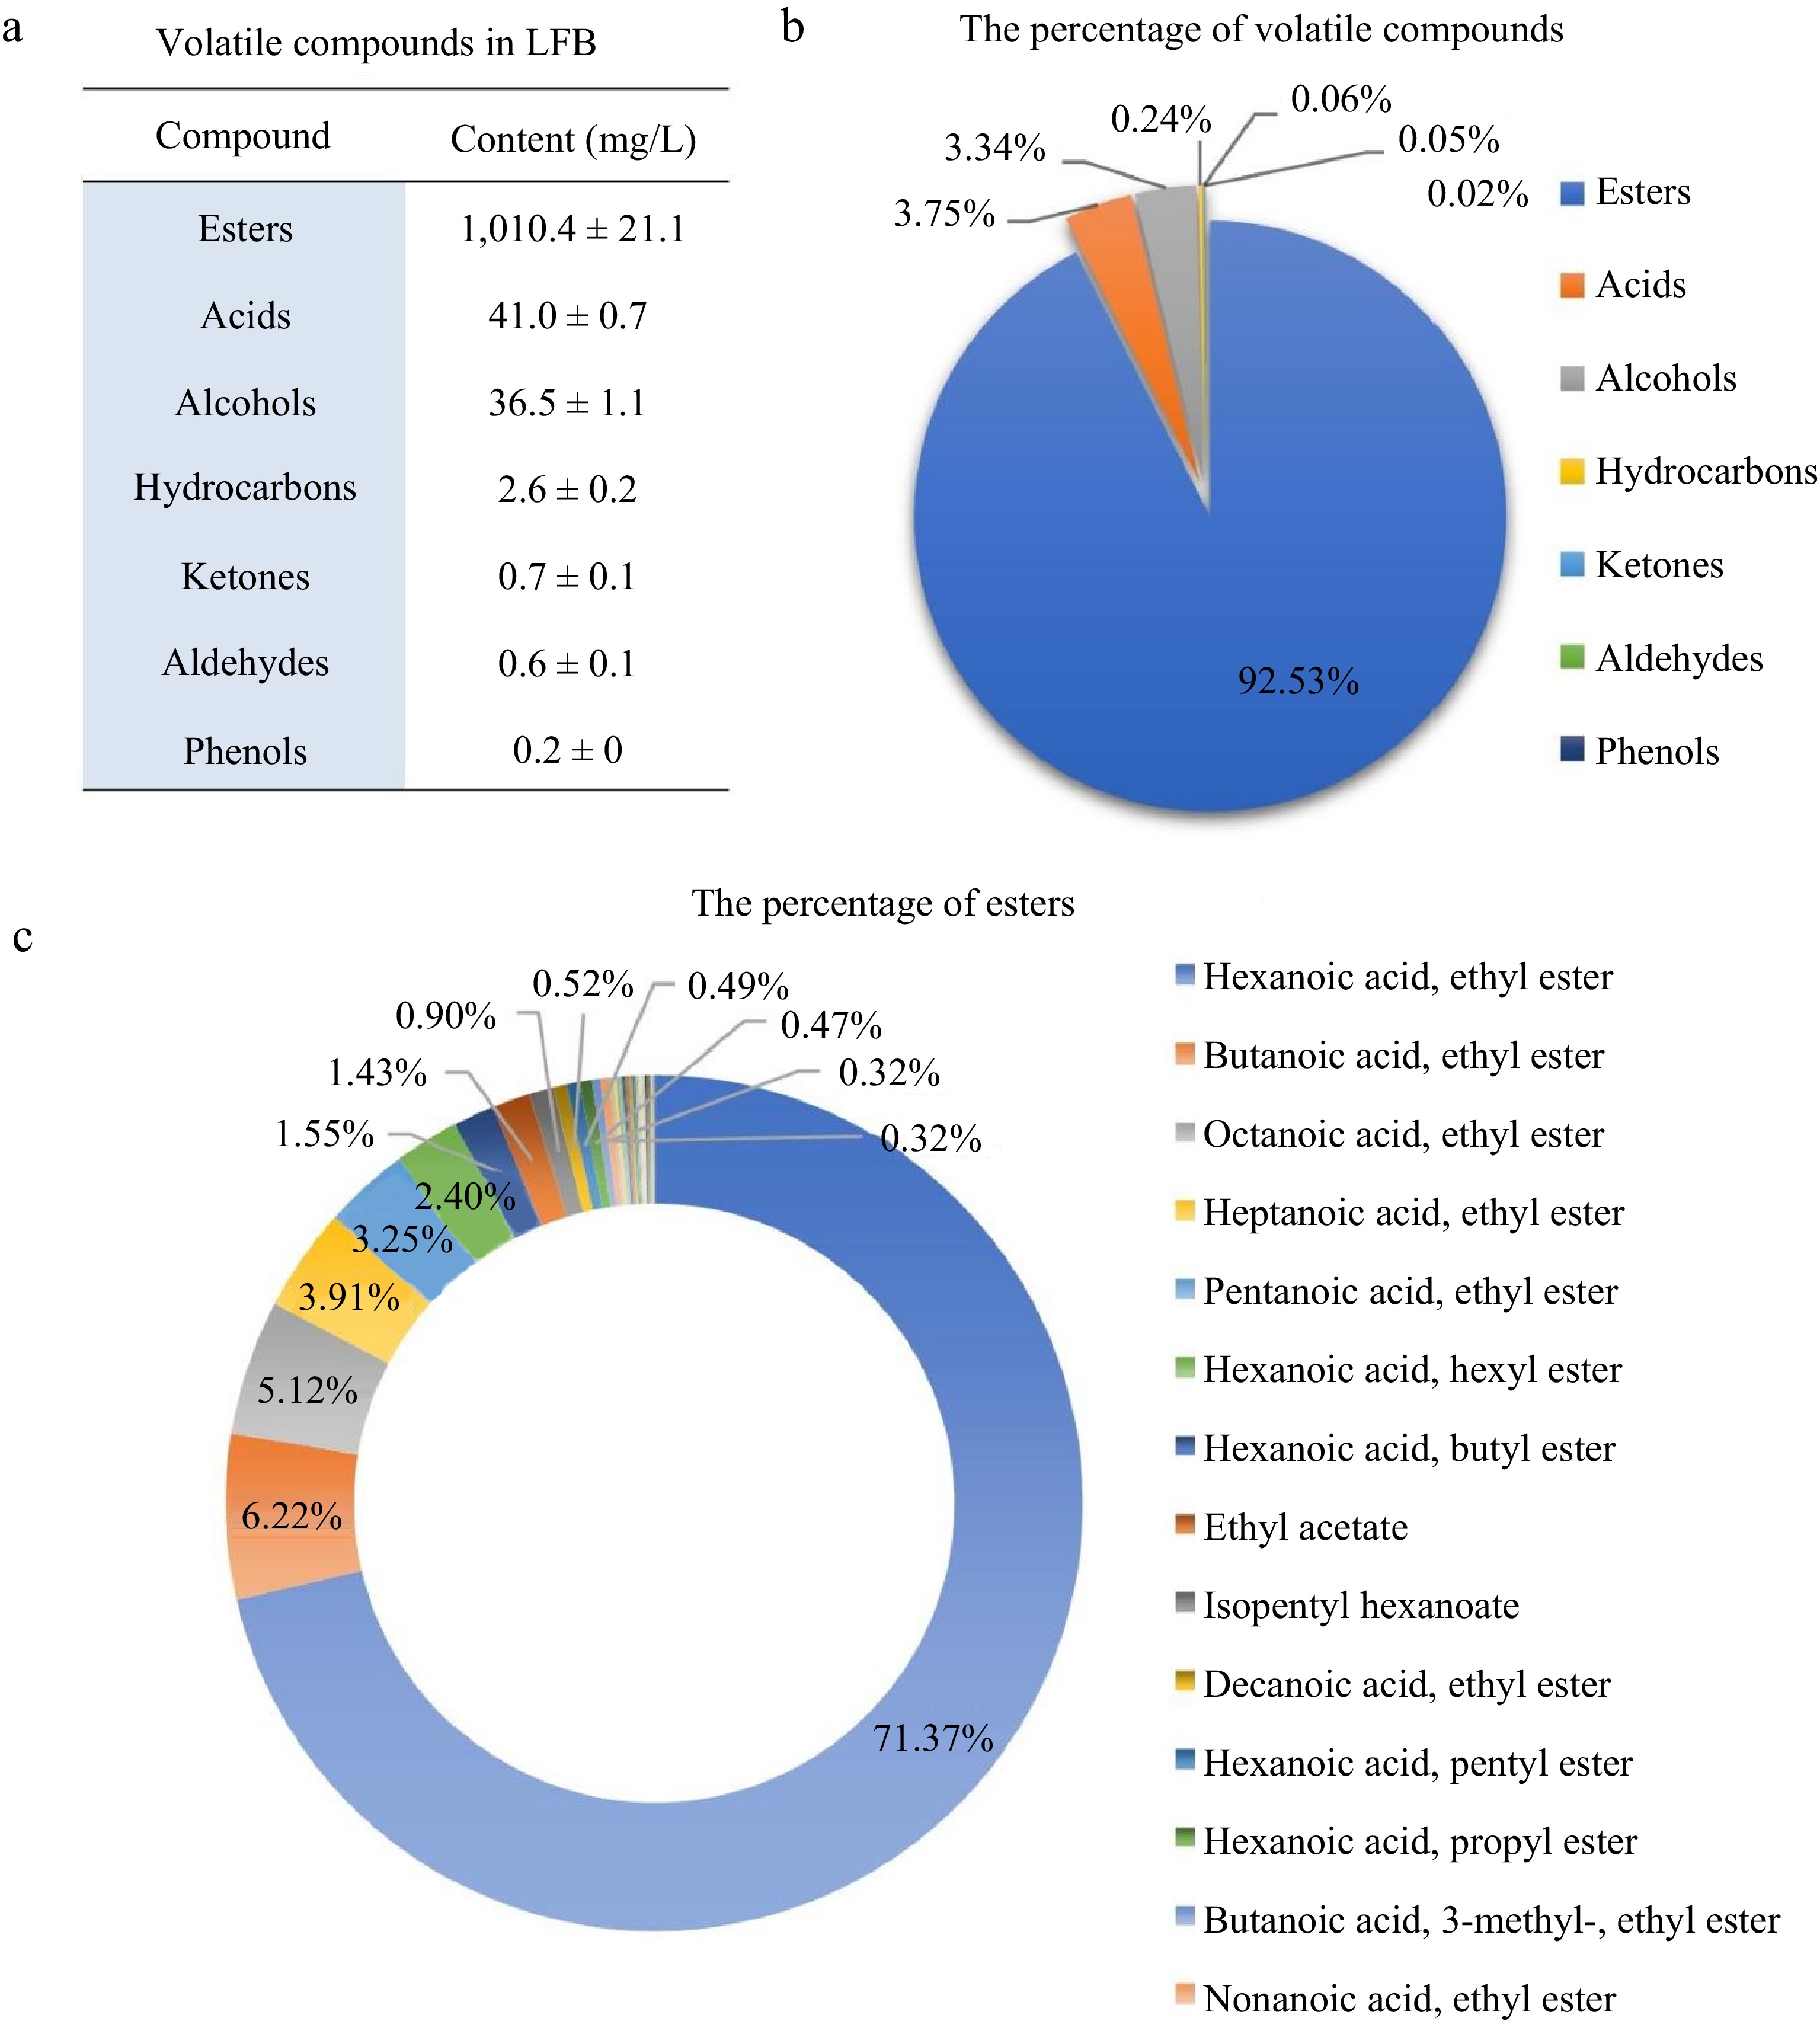
Figure 2.
Chemical composition of volatile constituents in Luzhou-flavor Baijiu (LFB). (a) Quantitative analysis of volatile compounds in LFB, classified into seven chemical categories, including esters, acids, alcohols, hydrocarbons, ketones, aldehydes, and phenols. Data are expressed as mean ± standard deviation (mg/L). (b) Relative proportion of volatile compounds across the seven chemical categories identified in LFB. (c) Relative distribution of the major ester compounds in LFB, showing the top 14 esters based on their proportional abundance.
-
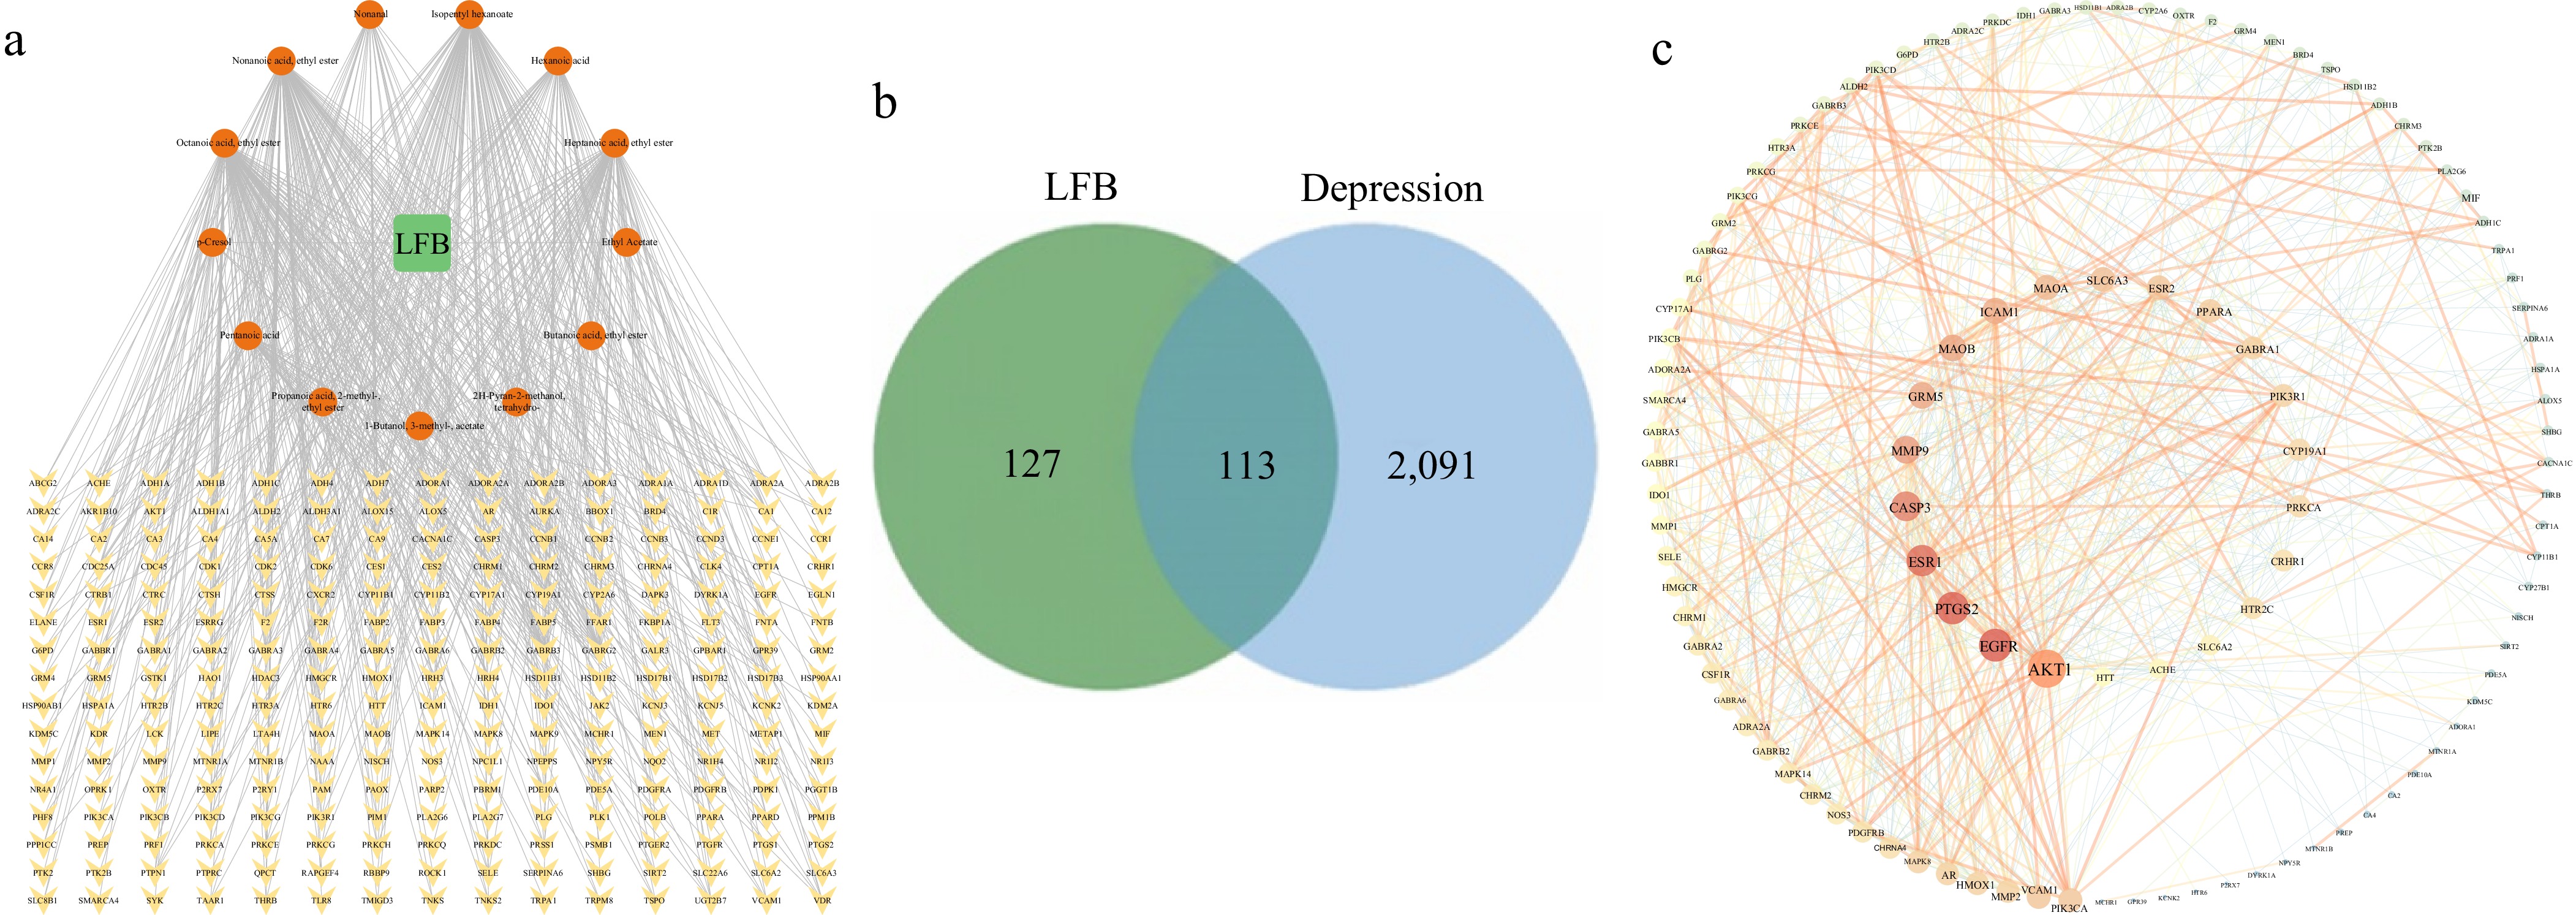
Figure 3.
Network pharmacology analysis of candidate targets associated with LFB. (a) Compound–target network illustrating candidate bioactive volatile components of LFB and their predicted molecular targets. Target genes were obtained from public databases and integrated for network construction. (b) Venn diagram showing the overlap between predicted LFB-associated targets (n = 240) and an emotion/mood-related gene set curated from GeneCards and OMIM databases. A total of 113 shared targets were identified and selected for subsequent analysis. (c) Protein–protein interaction (PPI) network constructed from the 113 shared targets. Network topology highlights highly connected nodes, representing hub targets potentially involved in LFB-associated biological processes.
-
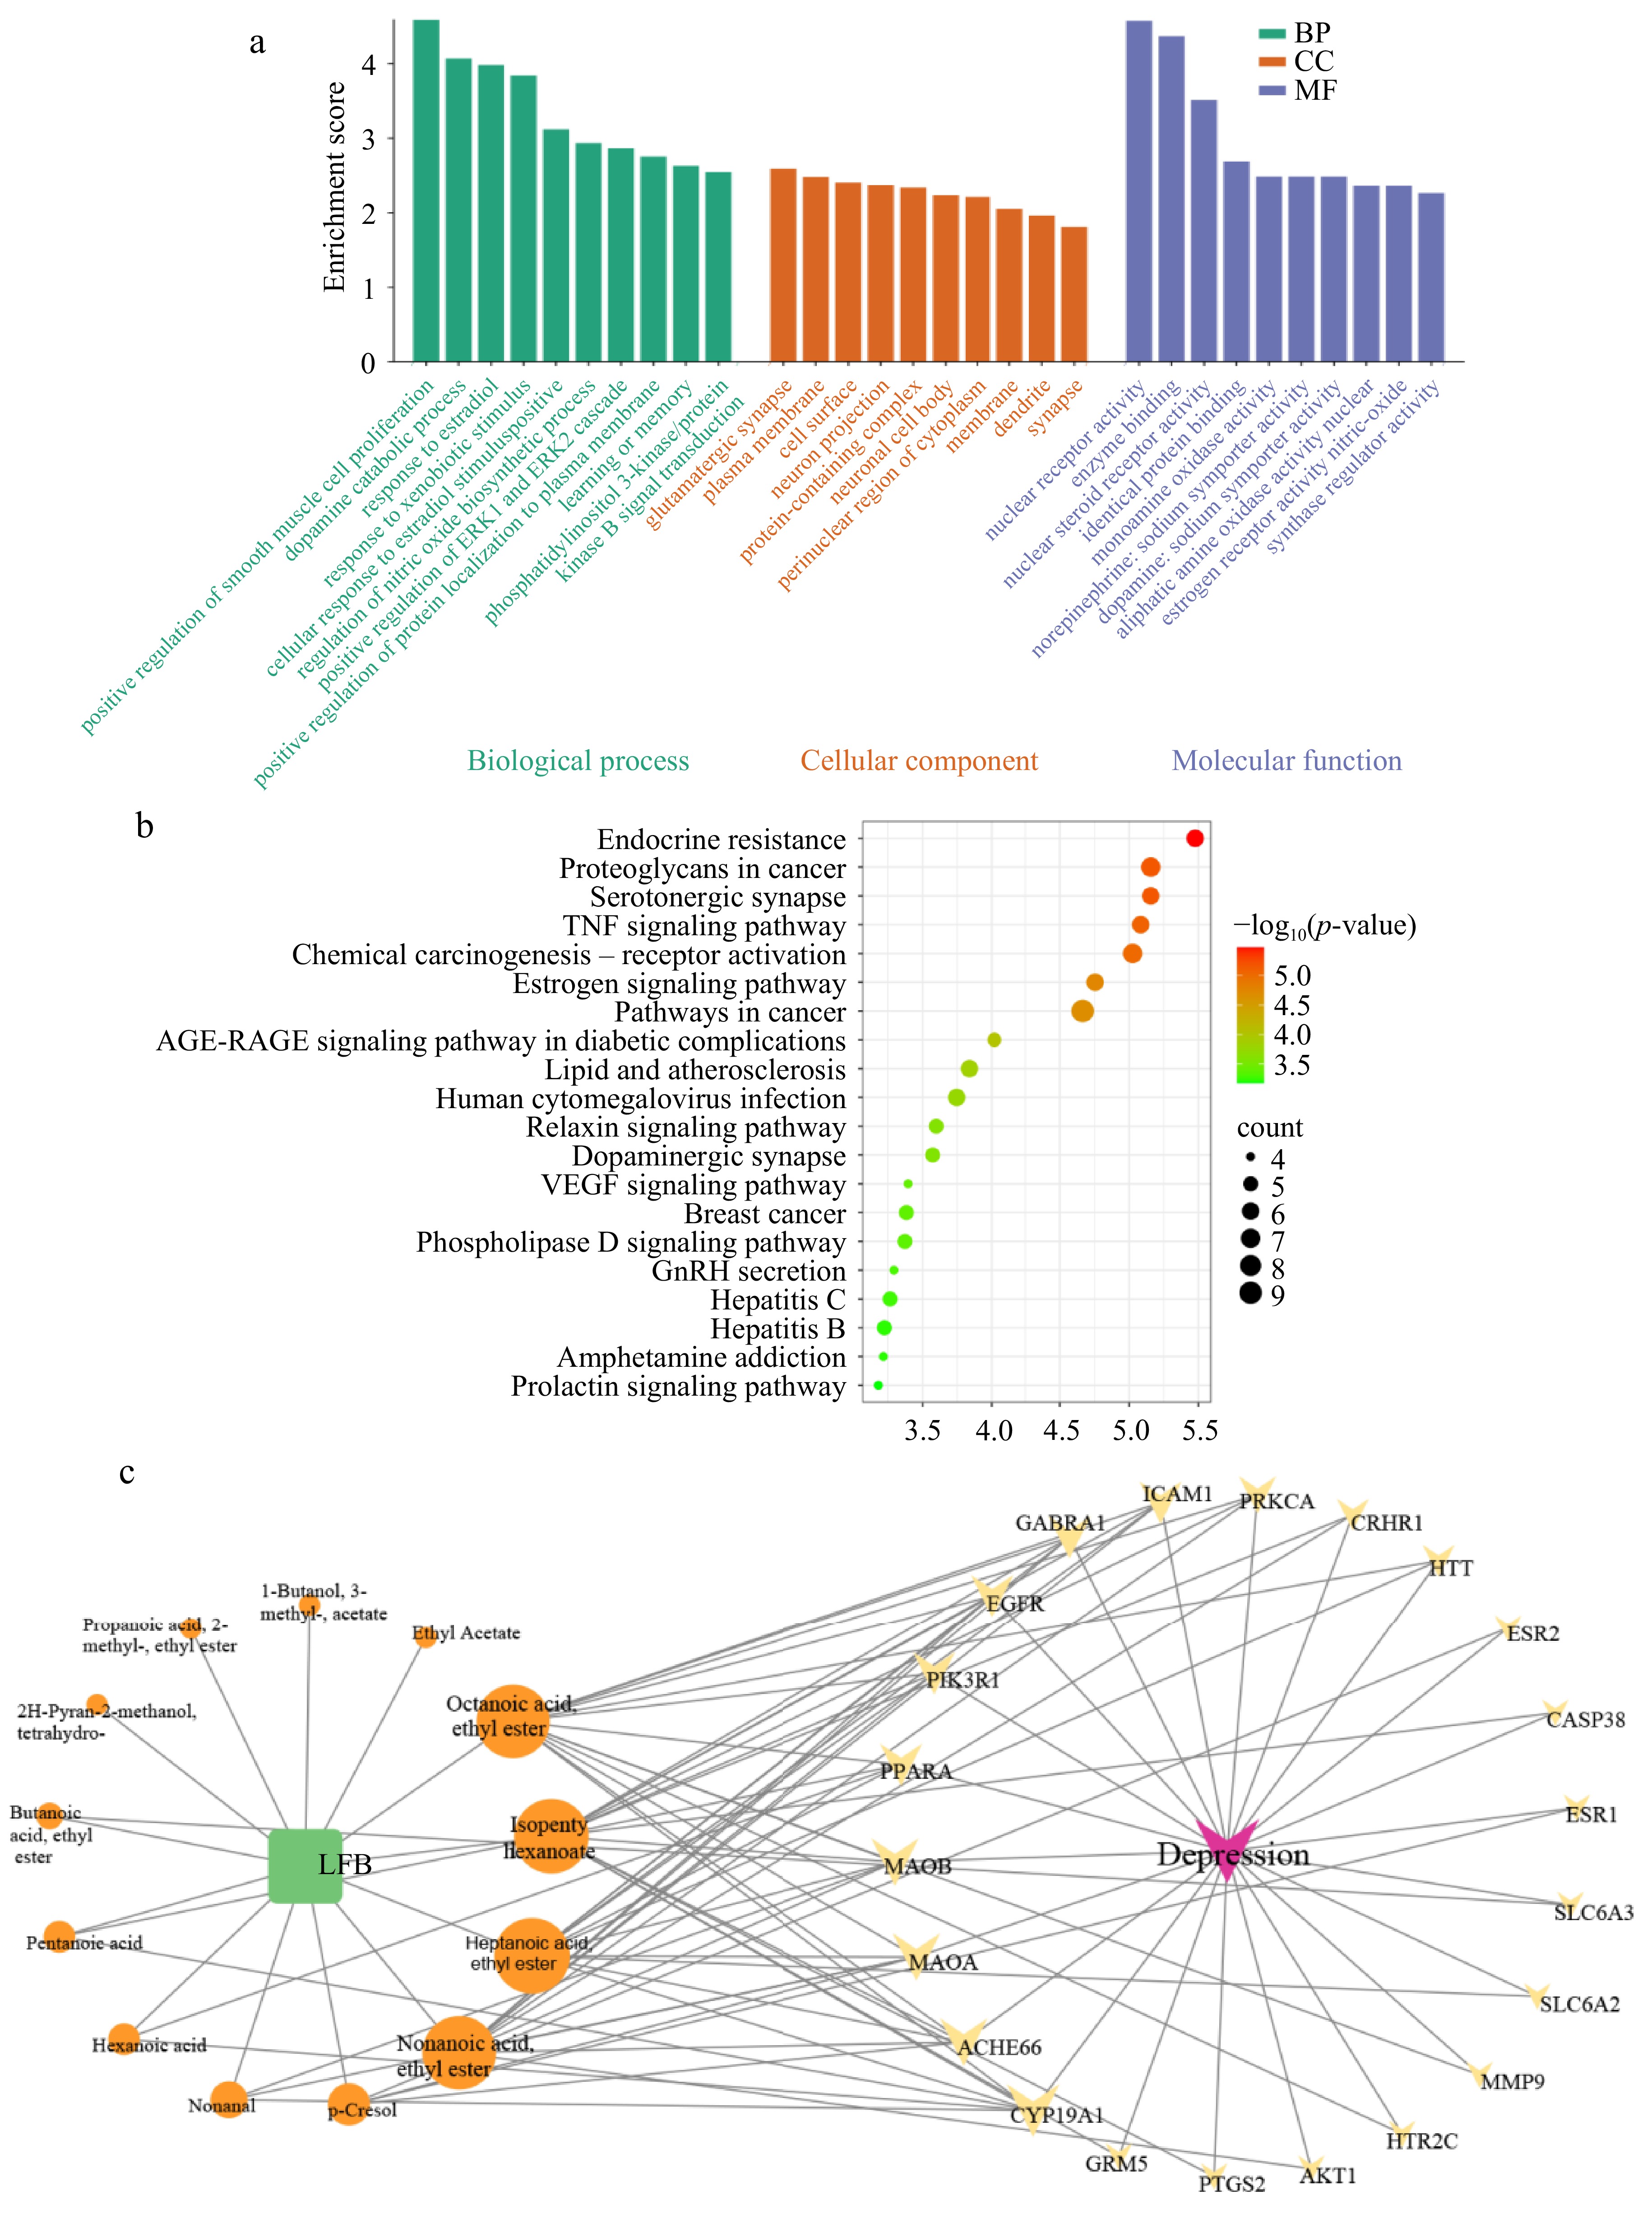
Figure 4.
Functional enrichment and network analysis of shared targets associated with LFB. (a) Gene Ontology (GO) enrichment analysis of shared targets, including biological processes (BP), cellular components (CC), and molecular functions (MF). The top enriched terms in each category are shown based on enrichment scores. (b) Kyoto Encyclopedia of Genes and Genomes (KEGG) pathway enrichment analysis of shared targets. The top 20 enriched pathways are displayed according to −log10(p-value), with node size representing the number of genes involved in each pathway. (c) Integrated 'LFB–component–target–phenotype' network illustrating relationships among LFB, its candidate volatile components, predicted molecular targets, and an emotion/mood-related phenotype. Node size reflects the degree value, indicating the relative importance of individual components or targets within the network.
-
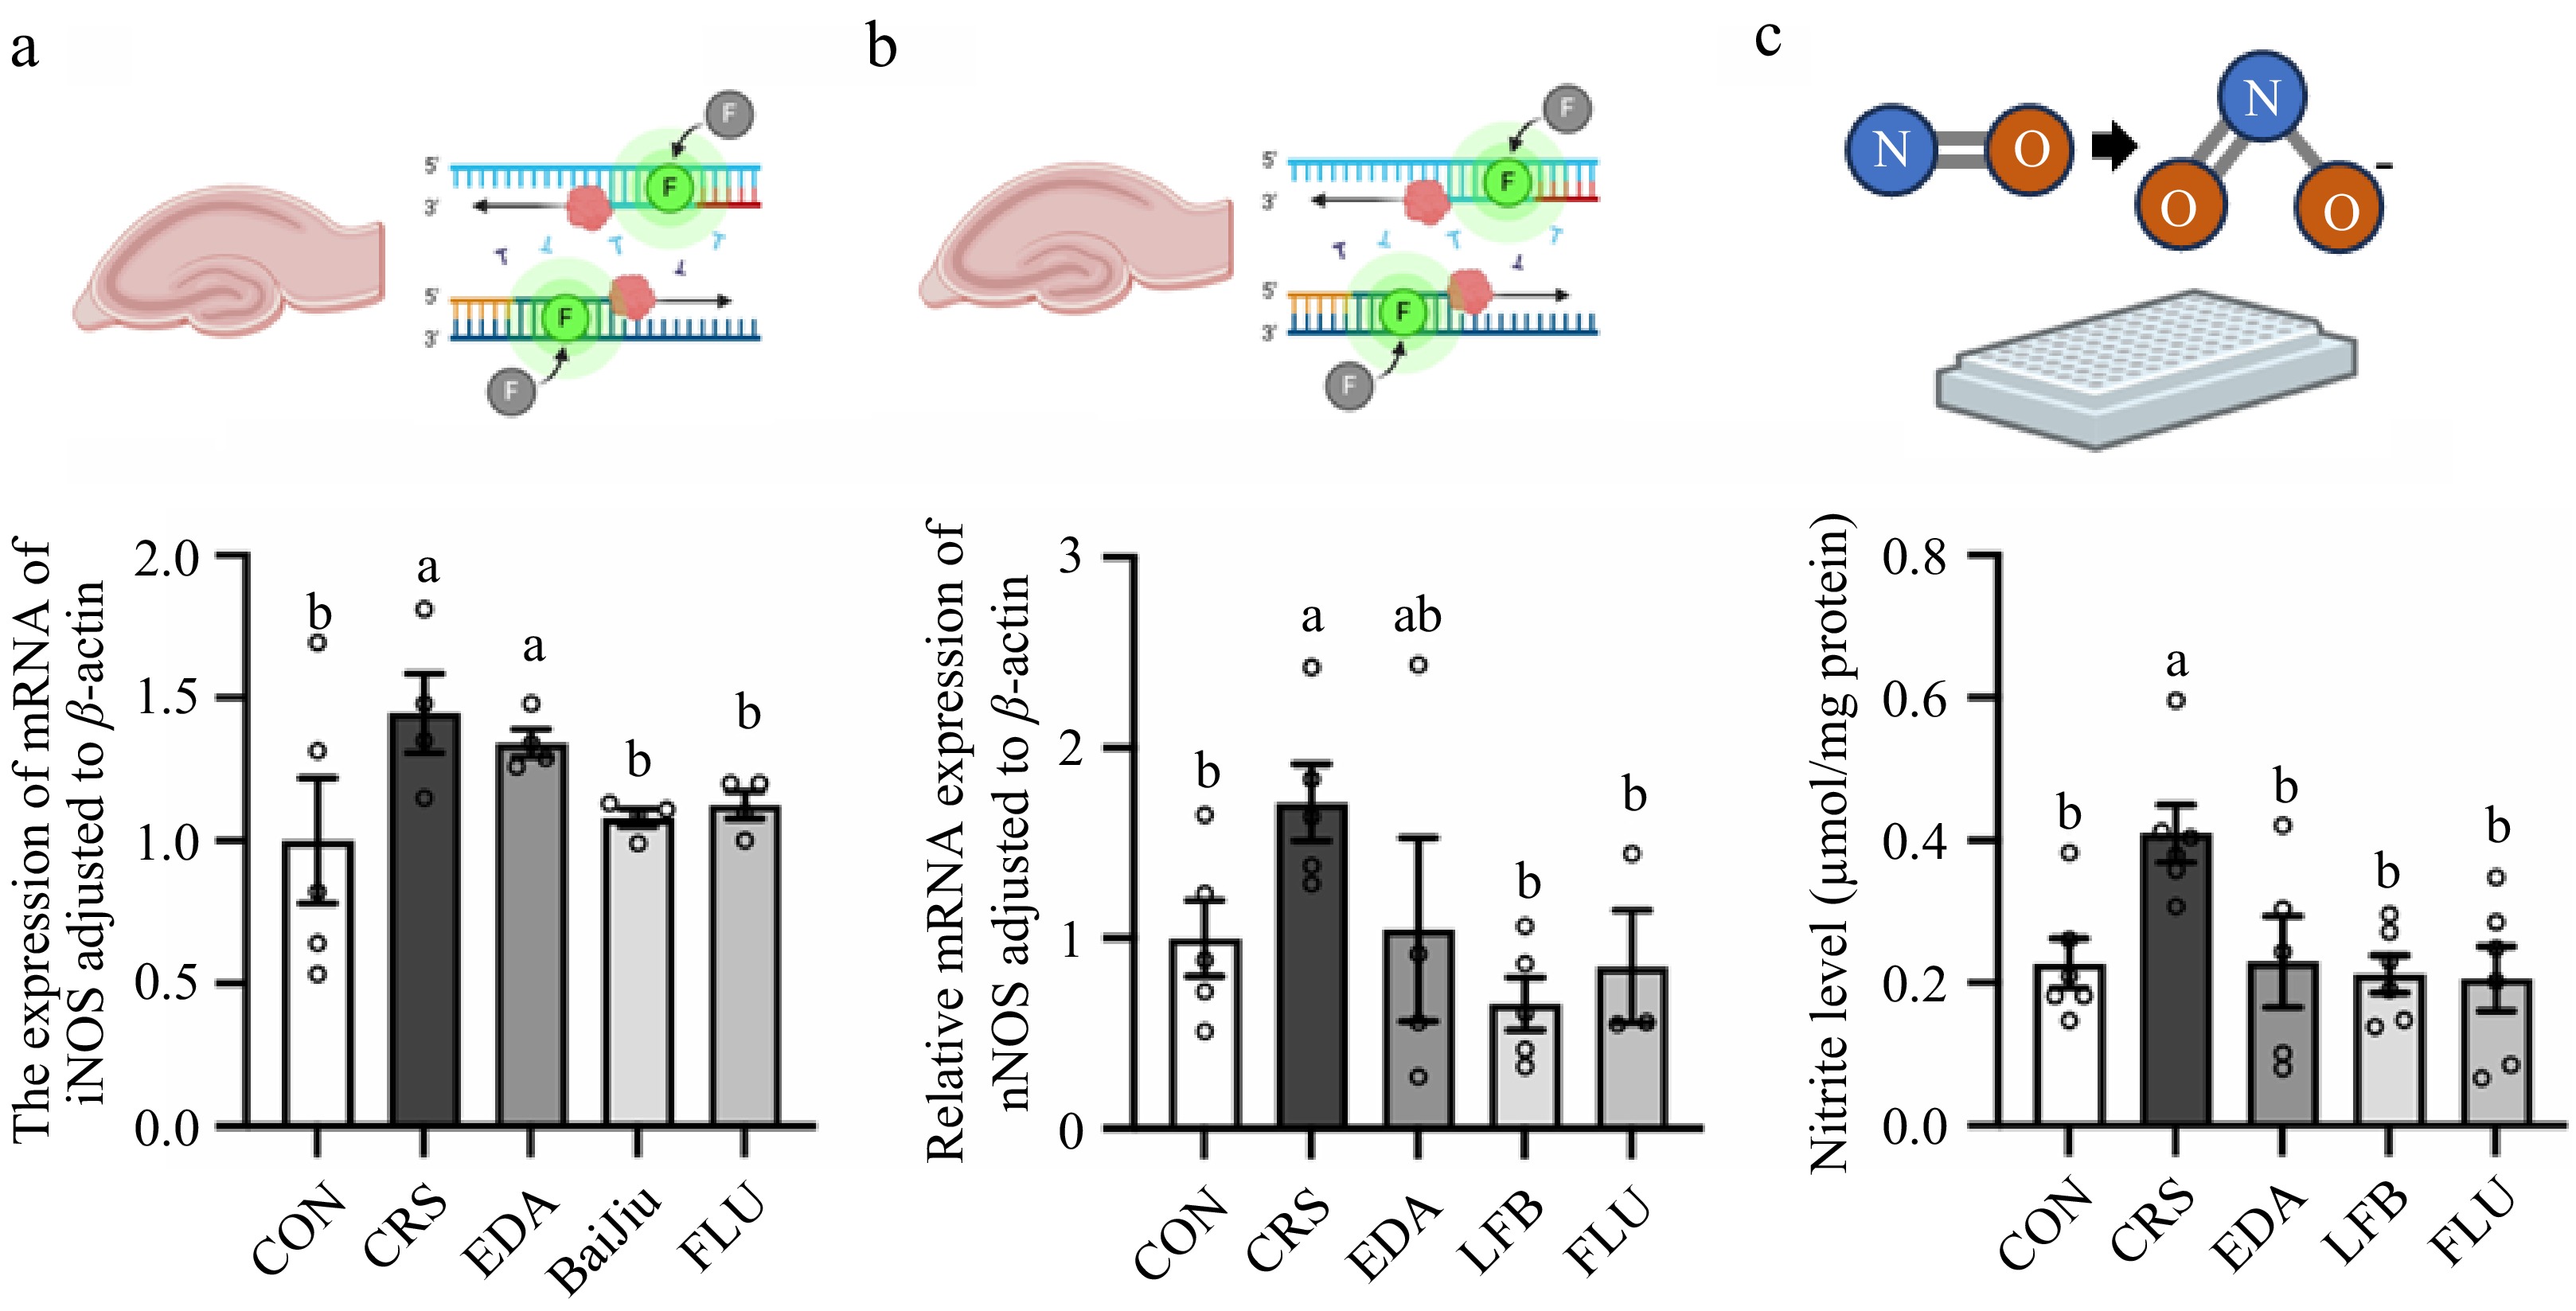
Figure 5.
Effects of LFB on hippocampal nitric oxide synthase expression and nitric oxide levels under chronic restraint stress. (a) Relative mRNA expression of inducible nitric oxide synthase (iNOS) in the hippocampus, normalized to β-actin. (b) Relative mRNA expression of neuronal nitric oxide synthase (nNOS) in the hippocampus, normalized to β-actin. (c) Total nitric oxide–related metabolite levels (nitrite/nitrate) in the hippocampus. Control group (CON), chronic restraint stress group (CRS), edible alcohol group (EDA), Luzhou-flavor Baijiu group (LFB), and fluoxetine group (FLU) (n = 5 per group). Different superscript letters (a, b, c) indicate statistically significant differences between groups (p < 0.05), while groups sharing at least one common letter (e.g., ab) are not significantly different. Illustrations were created using BioRender.com (
https://biorender.com/vn7vc01 ). -
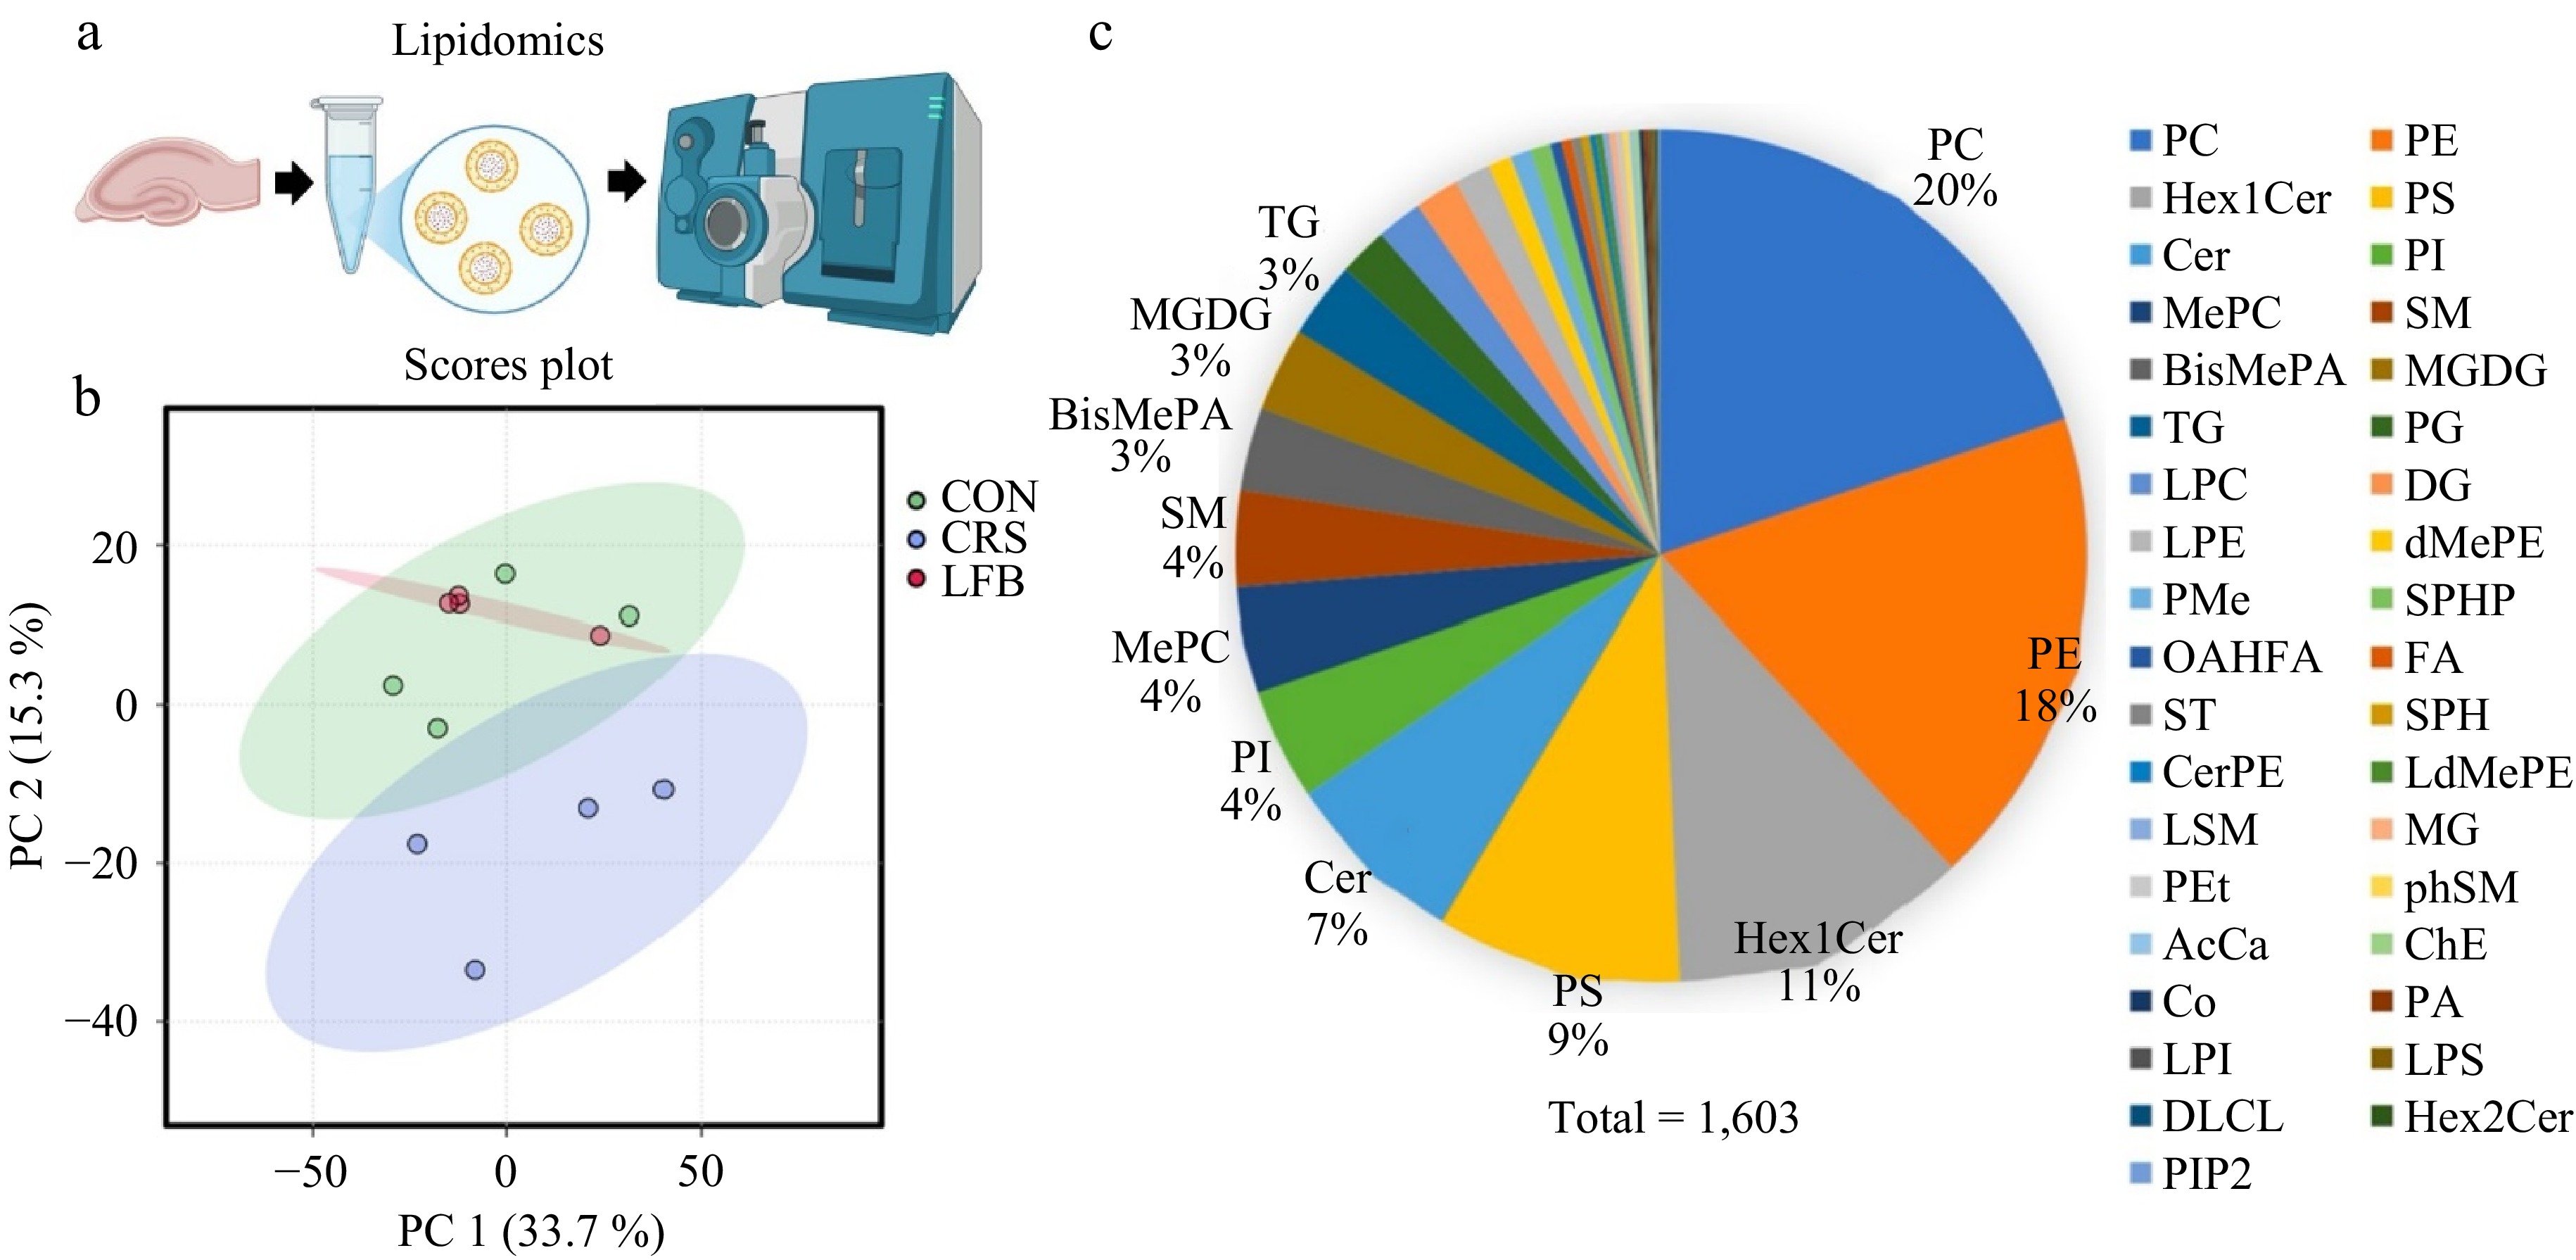
Figure 6.
Hippocampal lipidomic profiling in control, CRS, and LFB groups. (a) Schematic overview of the lipidomic workflow using hippocampal tissue from mice. (b) Principal component analysis (PCA) score plot based on hippocampal lipidomic data, illustrating overall differences in lipid profiles among the control (CON), chronic restraint stress group (CRS), and Luzhou-flavor Baijiu group (LFB). (c) Relative distribution of lipid subclasses identified in mouse hippocampal tissue, showing the proportional composition of major lipid categories. A total of 1,603 lipid species were detected. Illustrations were created using BioRender.com (
www.biorender.com/9wkgq1h ). -
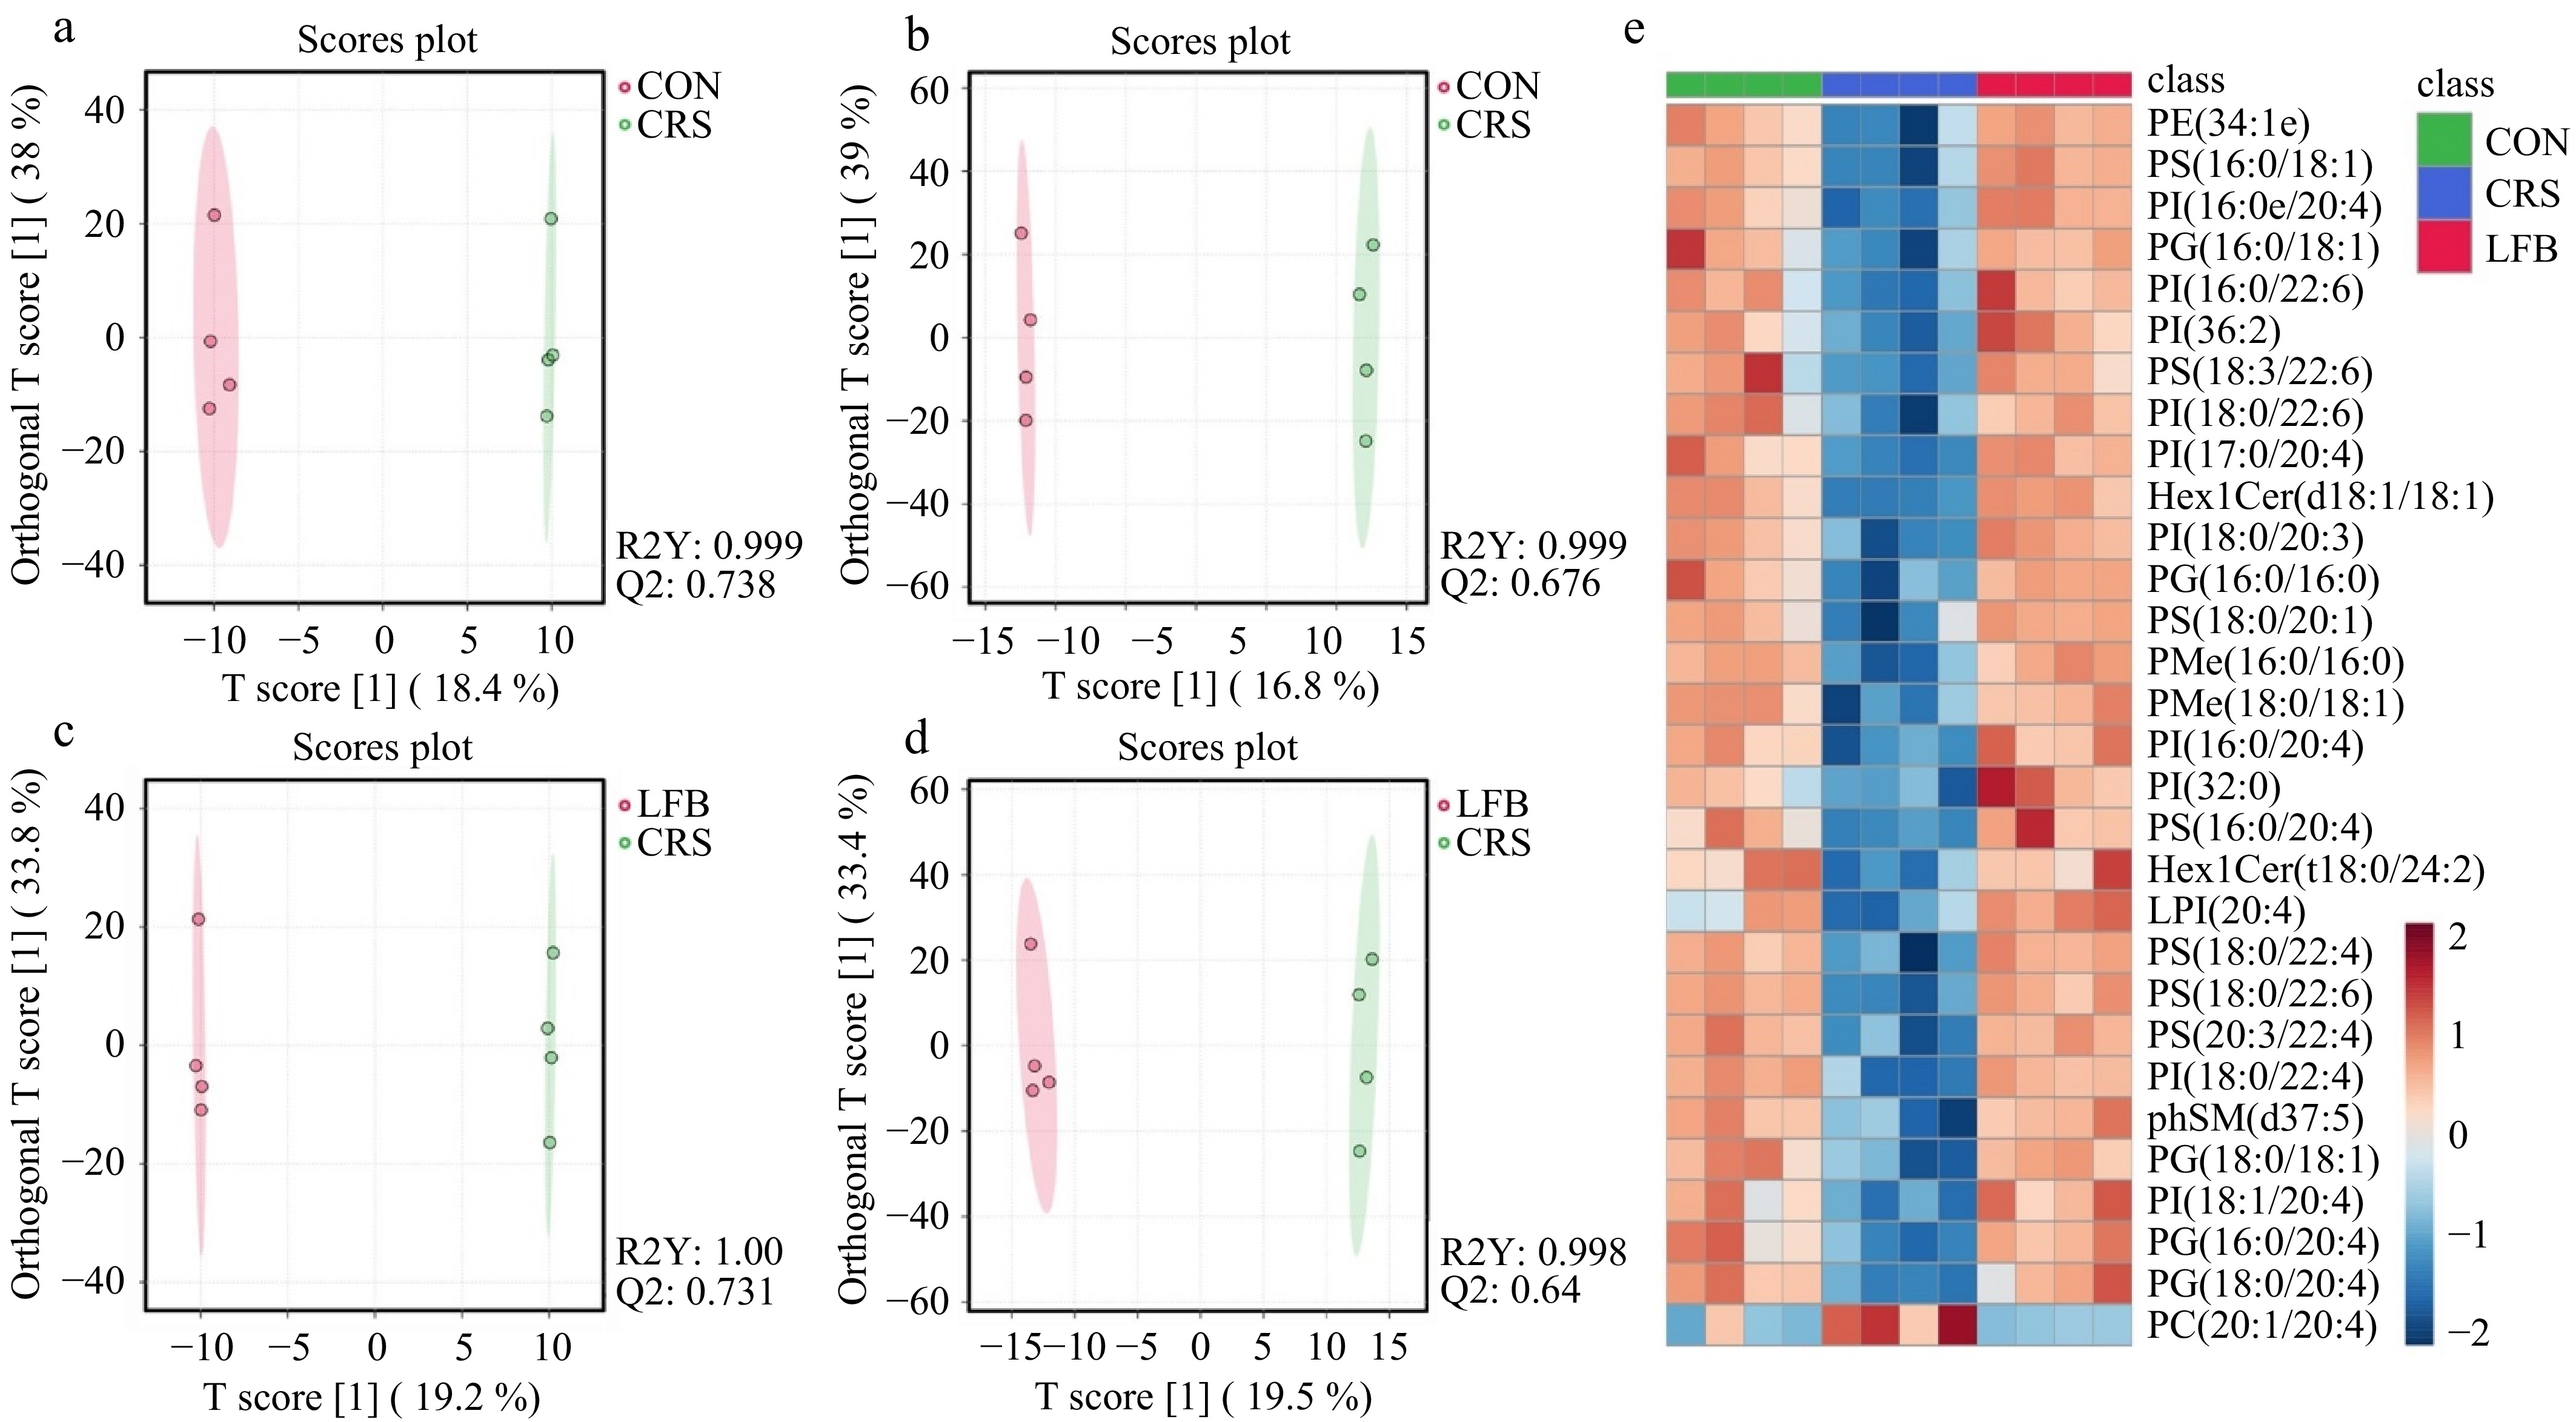
Figure 7.
Multivariate discrimination and hierarchical clustering analysis of hippocampal lipidomic data. (a) Orthogonal partial least squares discriminant analysis (OPLS-DA) score plot comparing the control (CON) and CRS groups under electrospray ionization (ESI) negative mode. (b) OPLS-DA score plot comparing the CON and CRS groups under ESI positive mode. (c) OPLS-DA score plot comparing the LFB and CRS groups under ESI negative mode. (d) OPLS-DA score plot comparing the LFB and CRS groups under ESI positive mode. (e) Heatmap of hierarchical cluster analysis showing lipid metabolites with significant differences among the control (CON), chronic restraint stress group (CRS), and Luzhou-flavor Baijiu group (LFB) groups (n = 4 per group). Color intensity represents relative abundance patterns across samples.
-
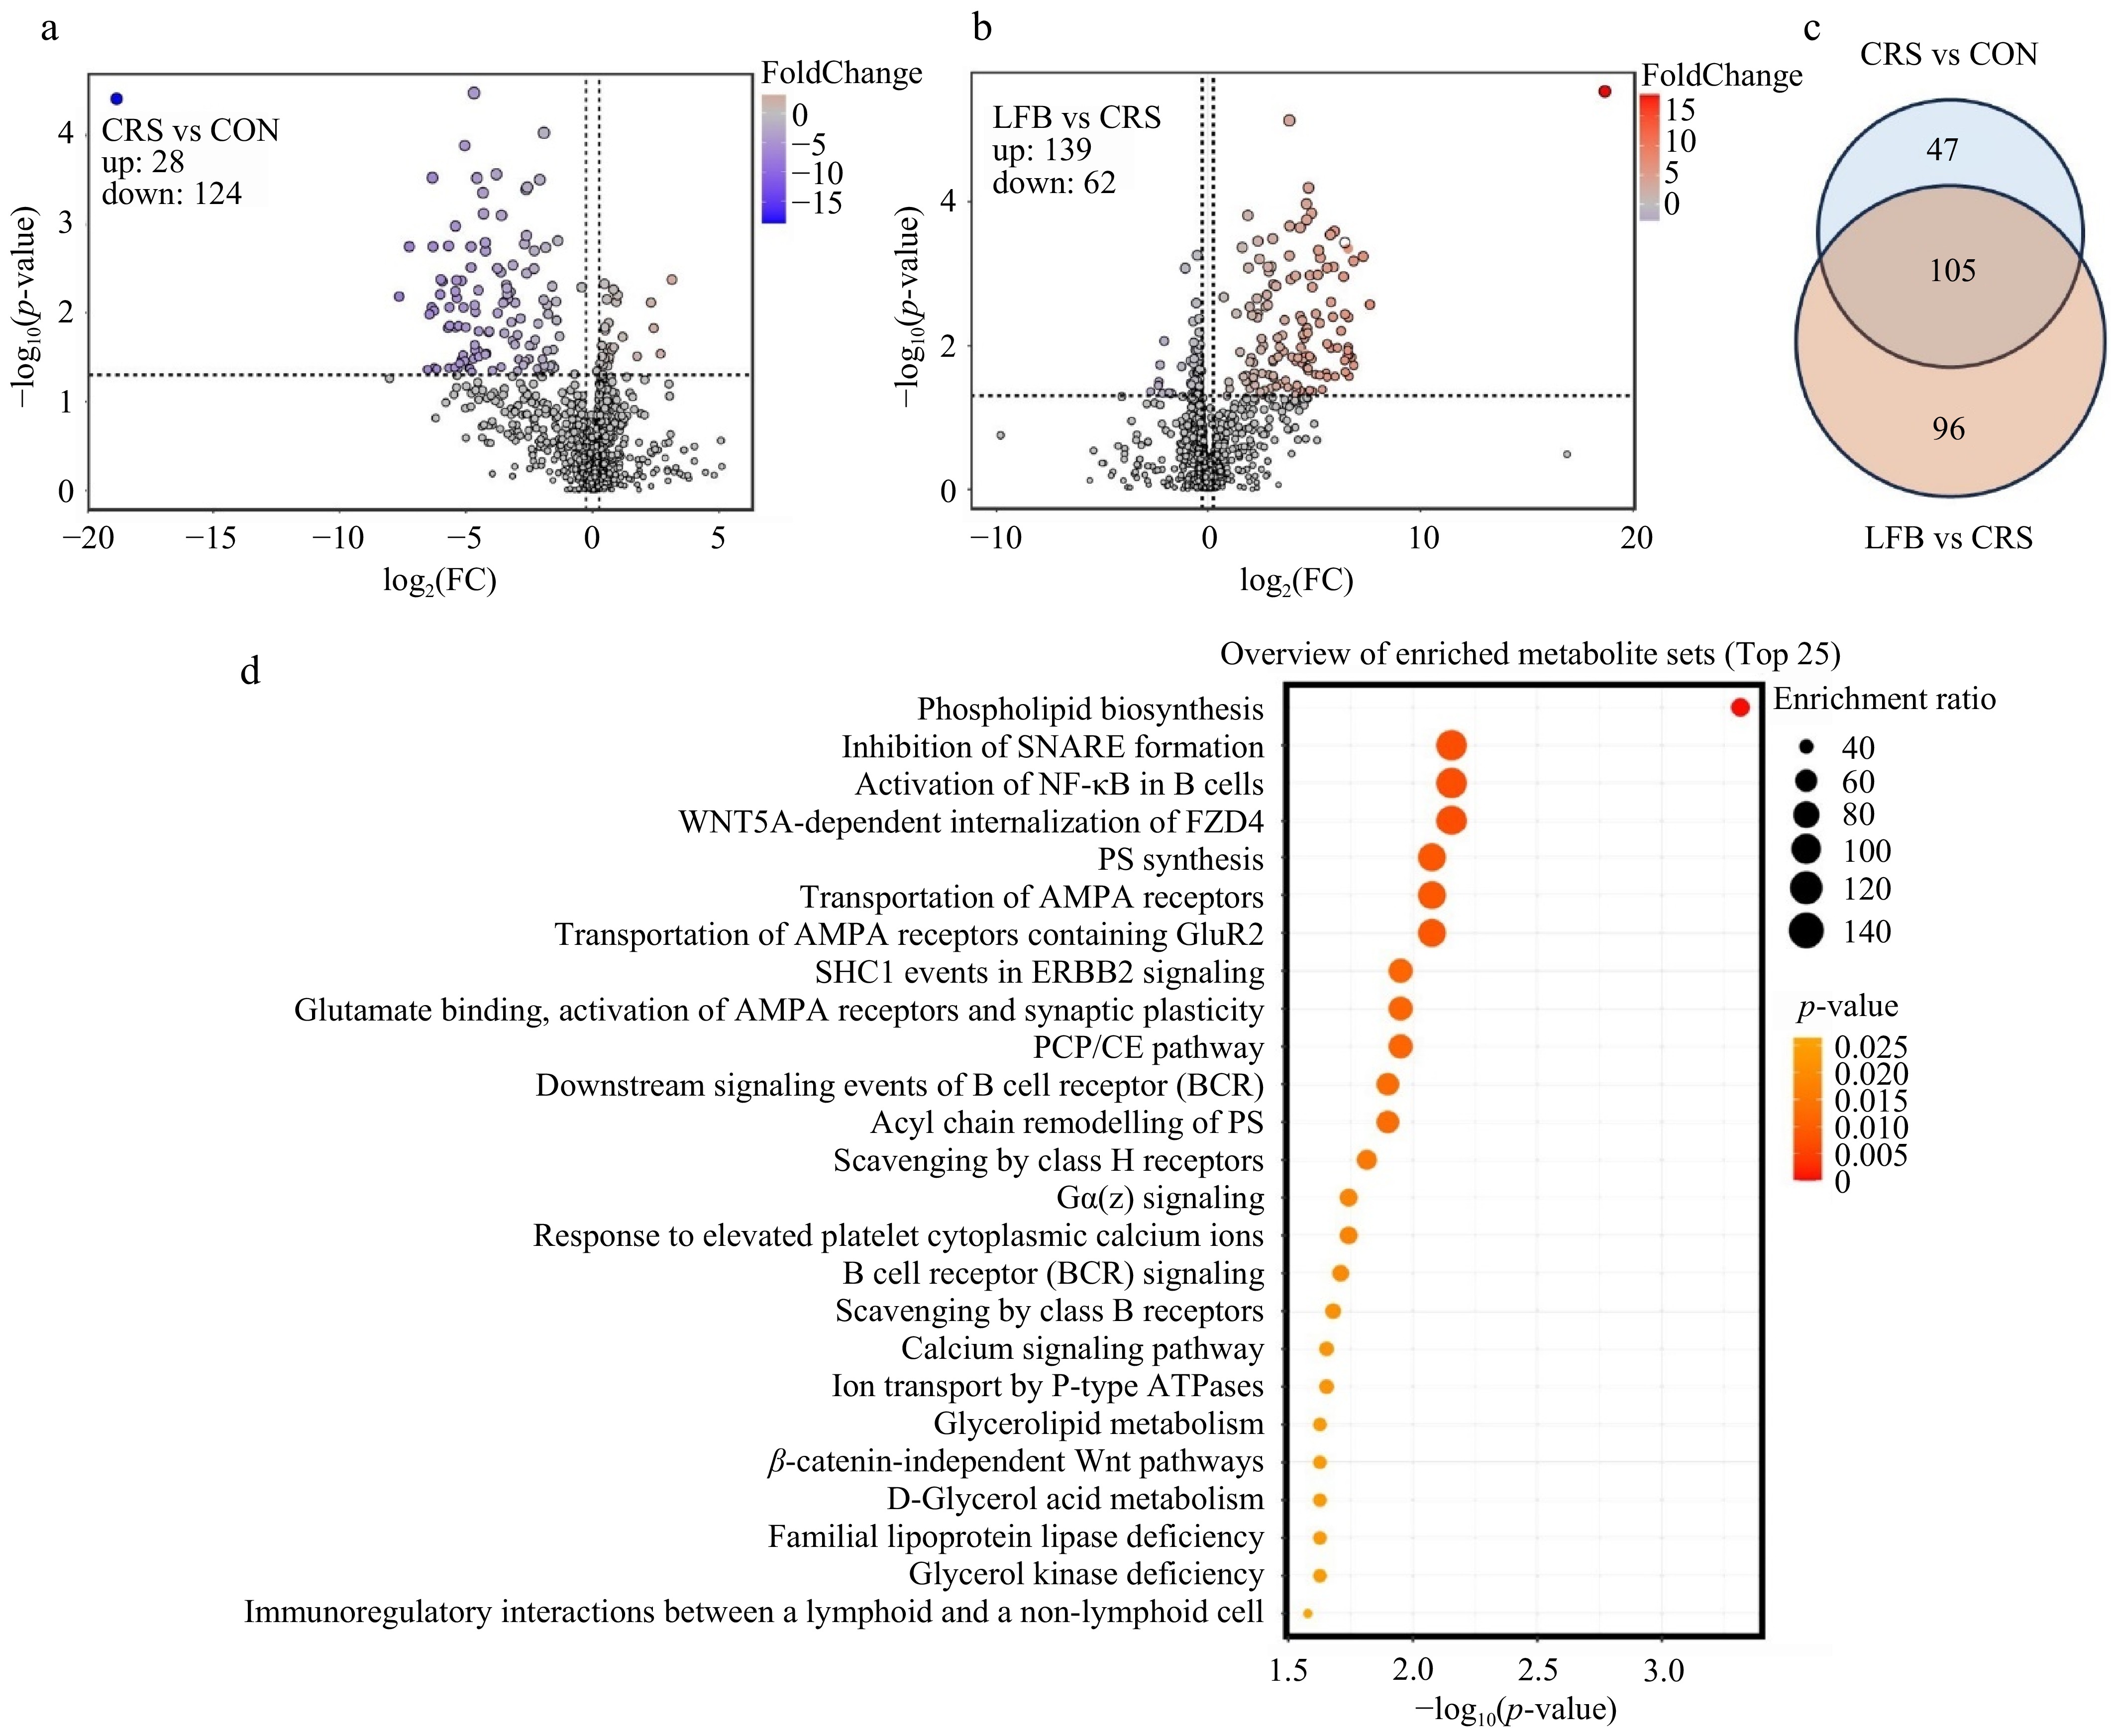
Figure 8.
Differential lipidomic features associated with CRS exposure and LFB administration. (a) Volcano plot showing differential lipid metabolites between chronic restraint stress group (CRS) and control (CON) groups. Lipid species meeting the selection criteria are highlighted. (b) Volcano plot showing differential lipid metabolites between the Luzhou-flavor Baijiu group (LFB and CRS group. (c) Venn diagram illustrating the overlap of differential lipid metabolites identified in the CRS vs CON and LFB vs CRS comparisons. A total of 105 lipid species were shared between the two comparisons. (d) Pathway enrichment analysis of the 105 shared differential lipid metabolites based on the RaMP database. The top enriched metabolic pathways are displayed according to −log10(p-value), with enrichment ratio indicated by dot size.
Figures
(8)
Tables
(0)