-
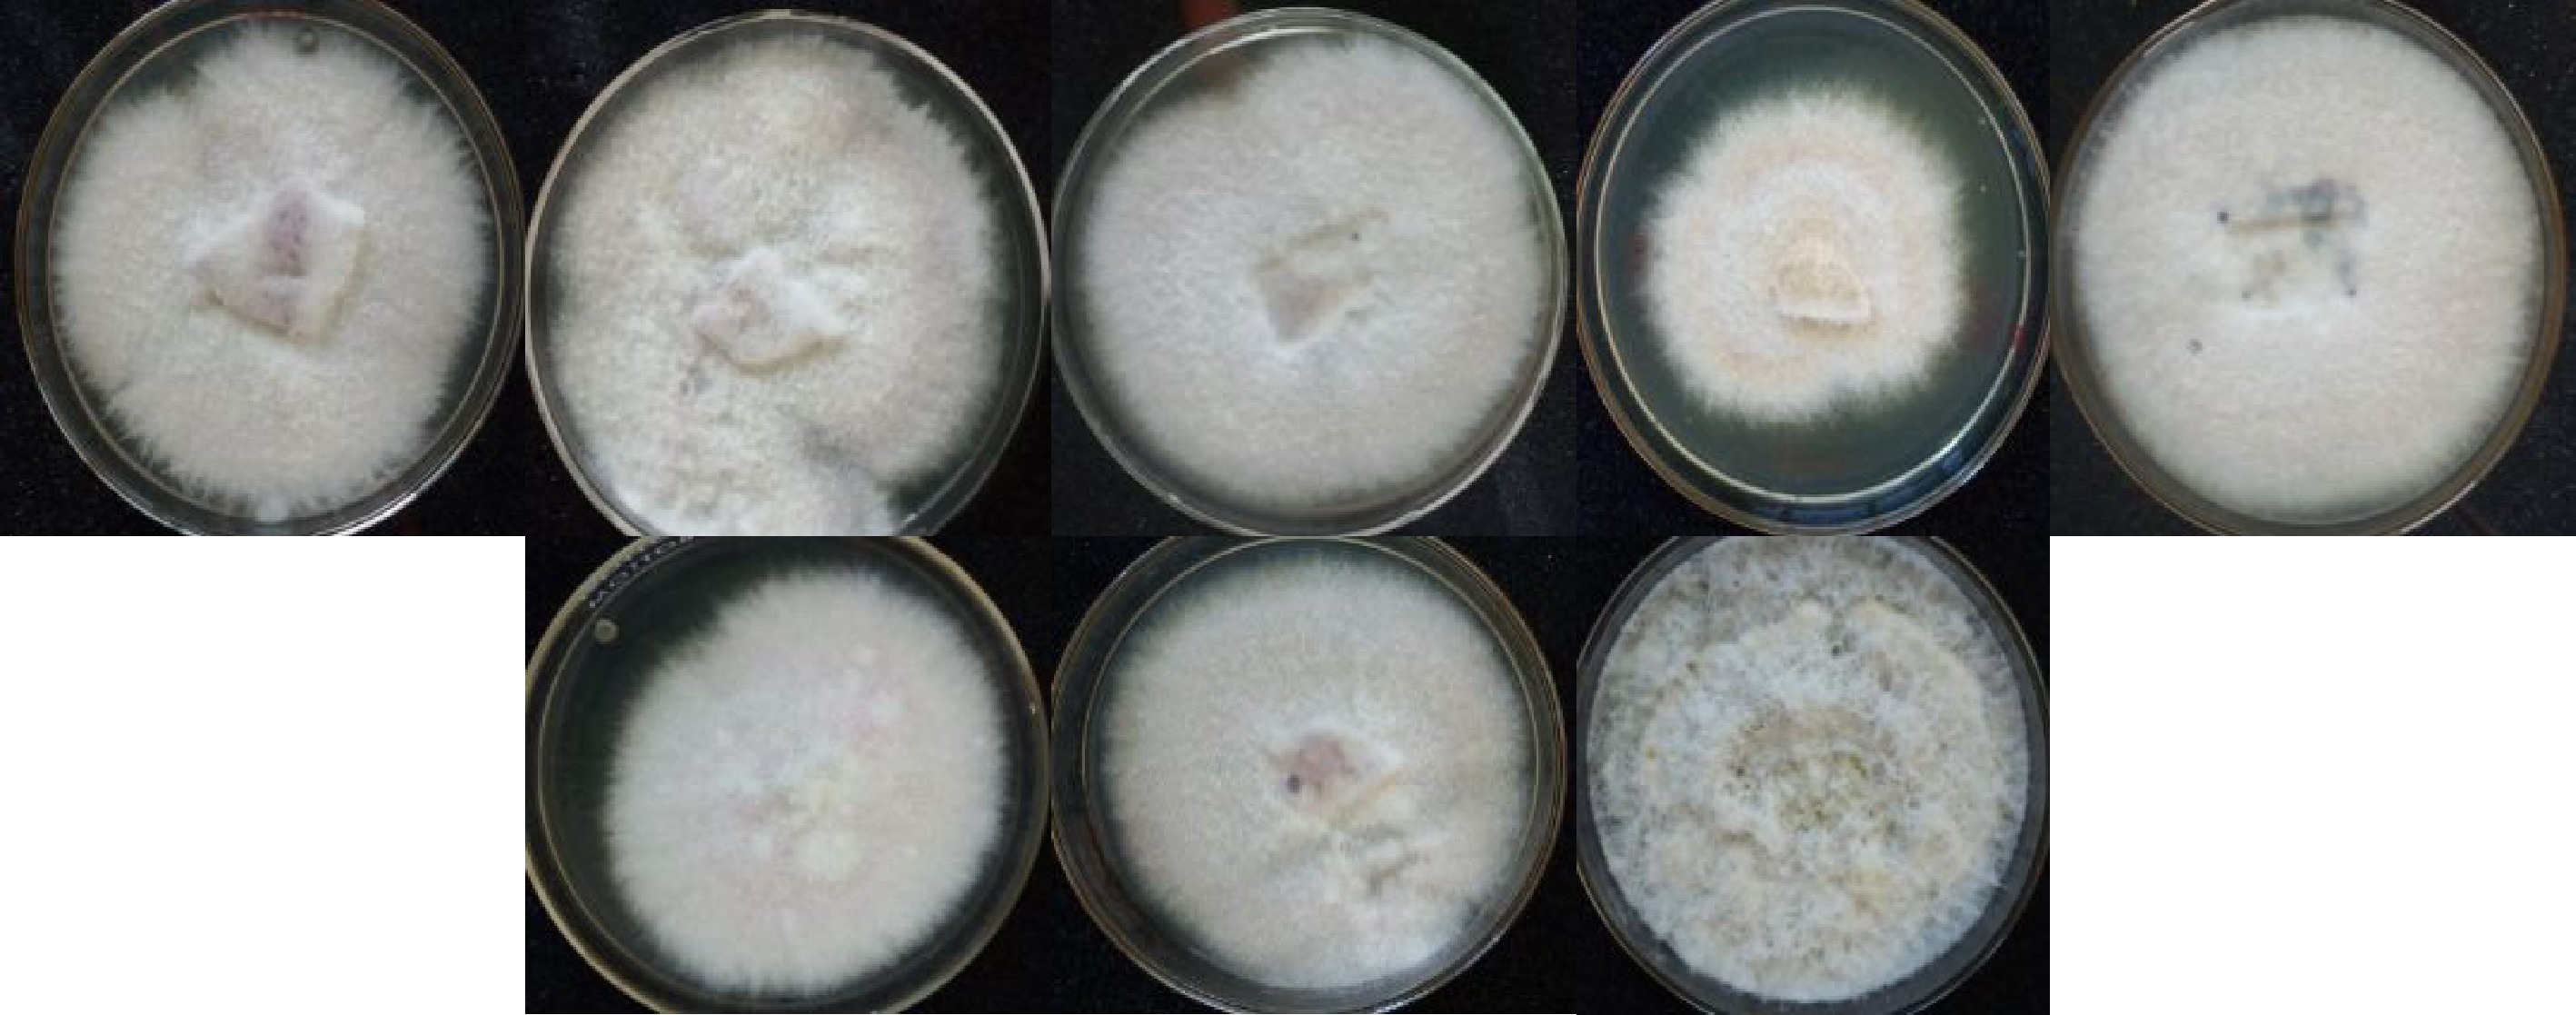
Figure 1.
Pure white-rot fungal isolates on PDA.
-
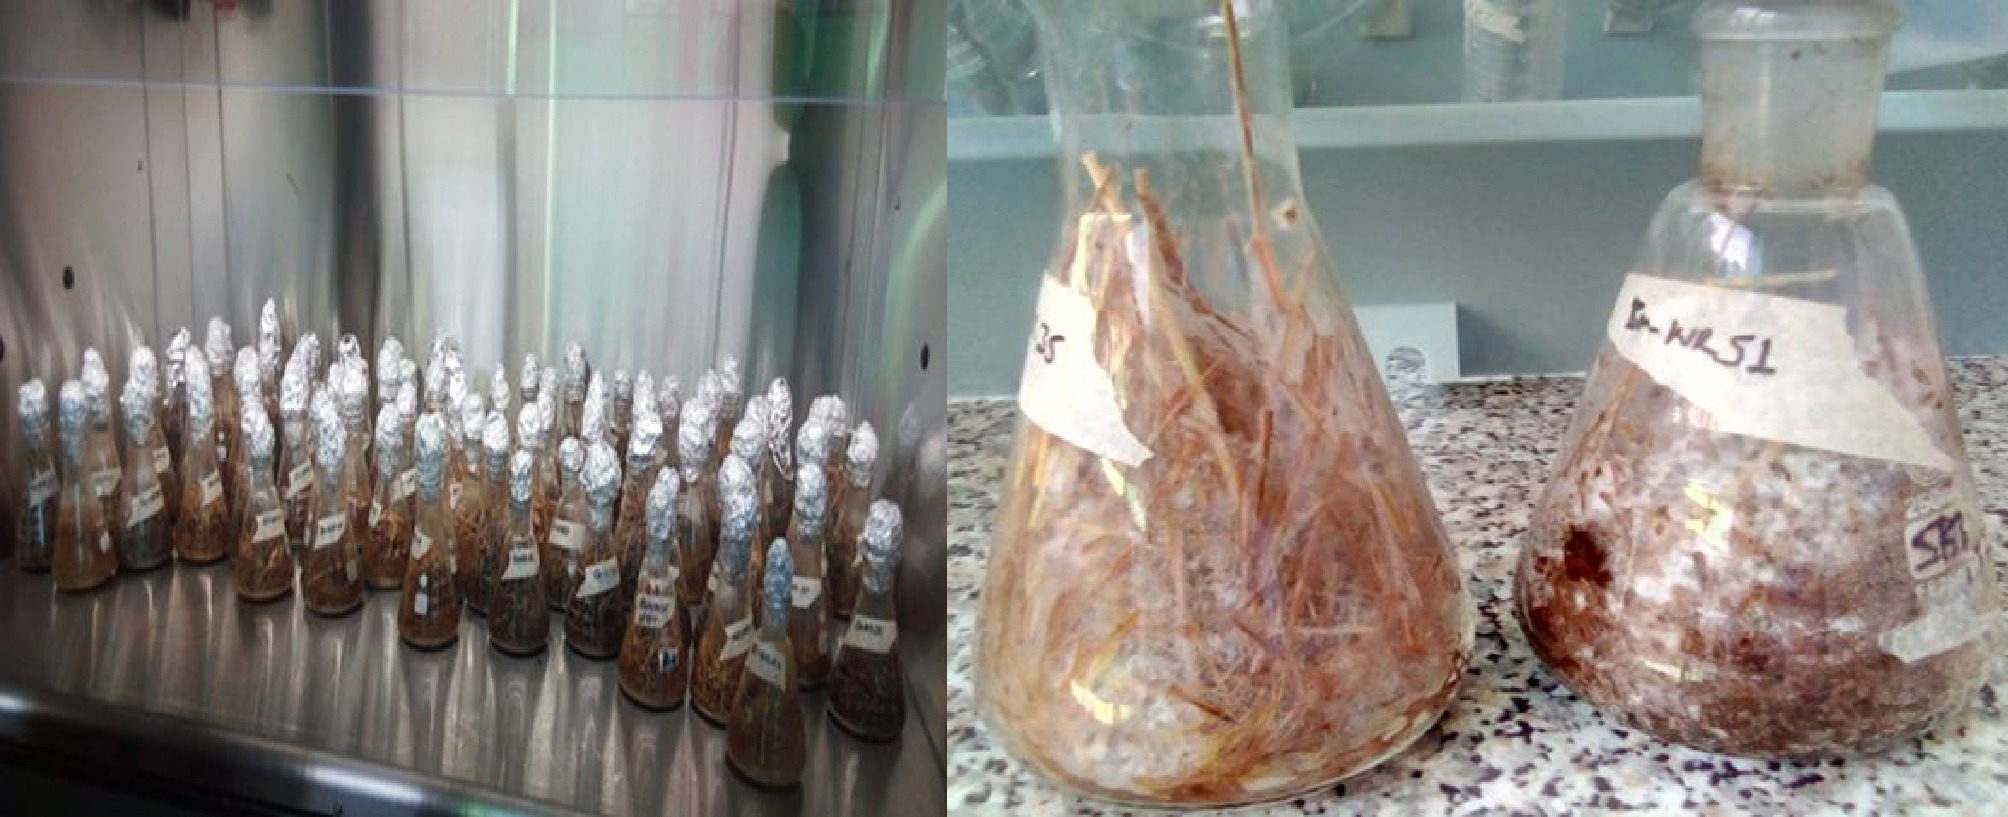
Figure 2.
Solid state fermentation of agricultural residues and fungal growth on the biomass.
-
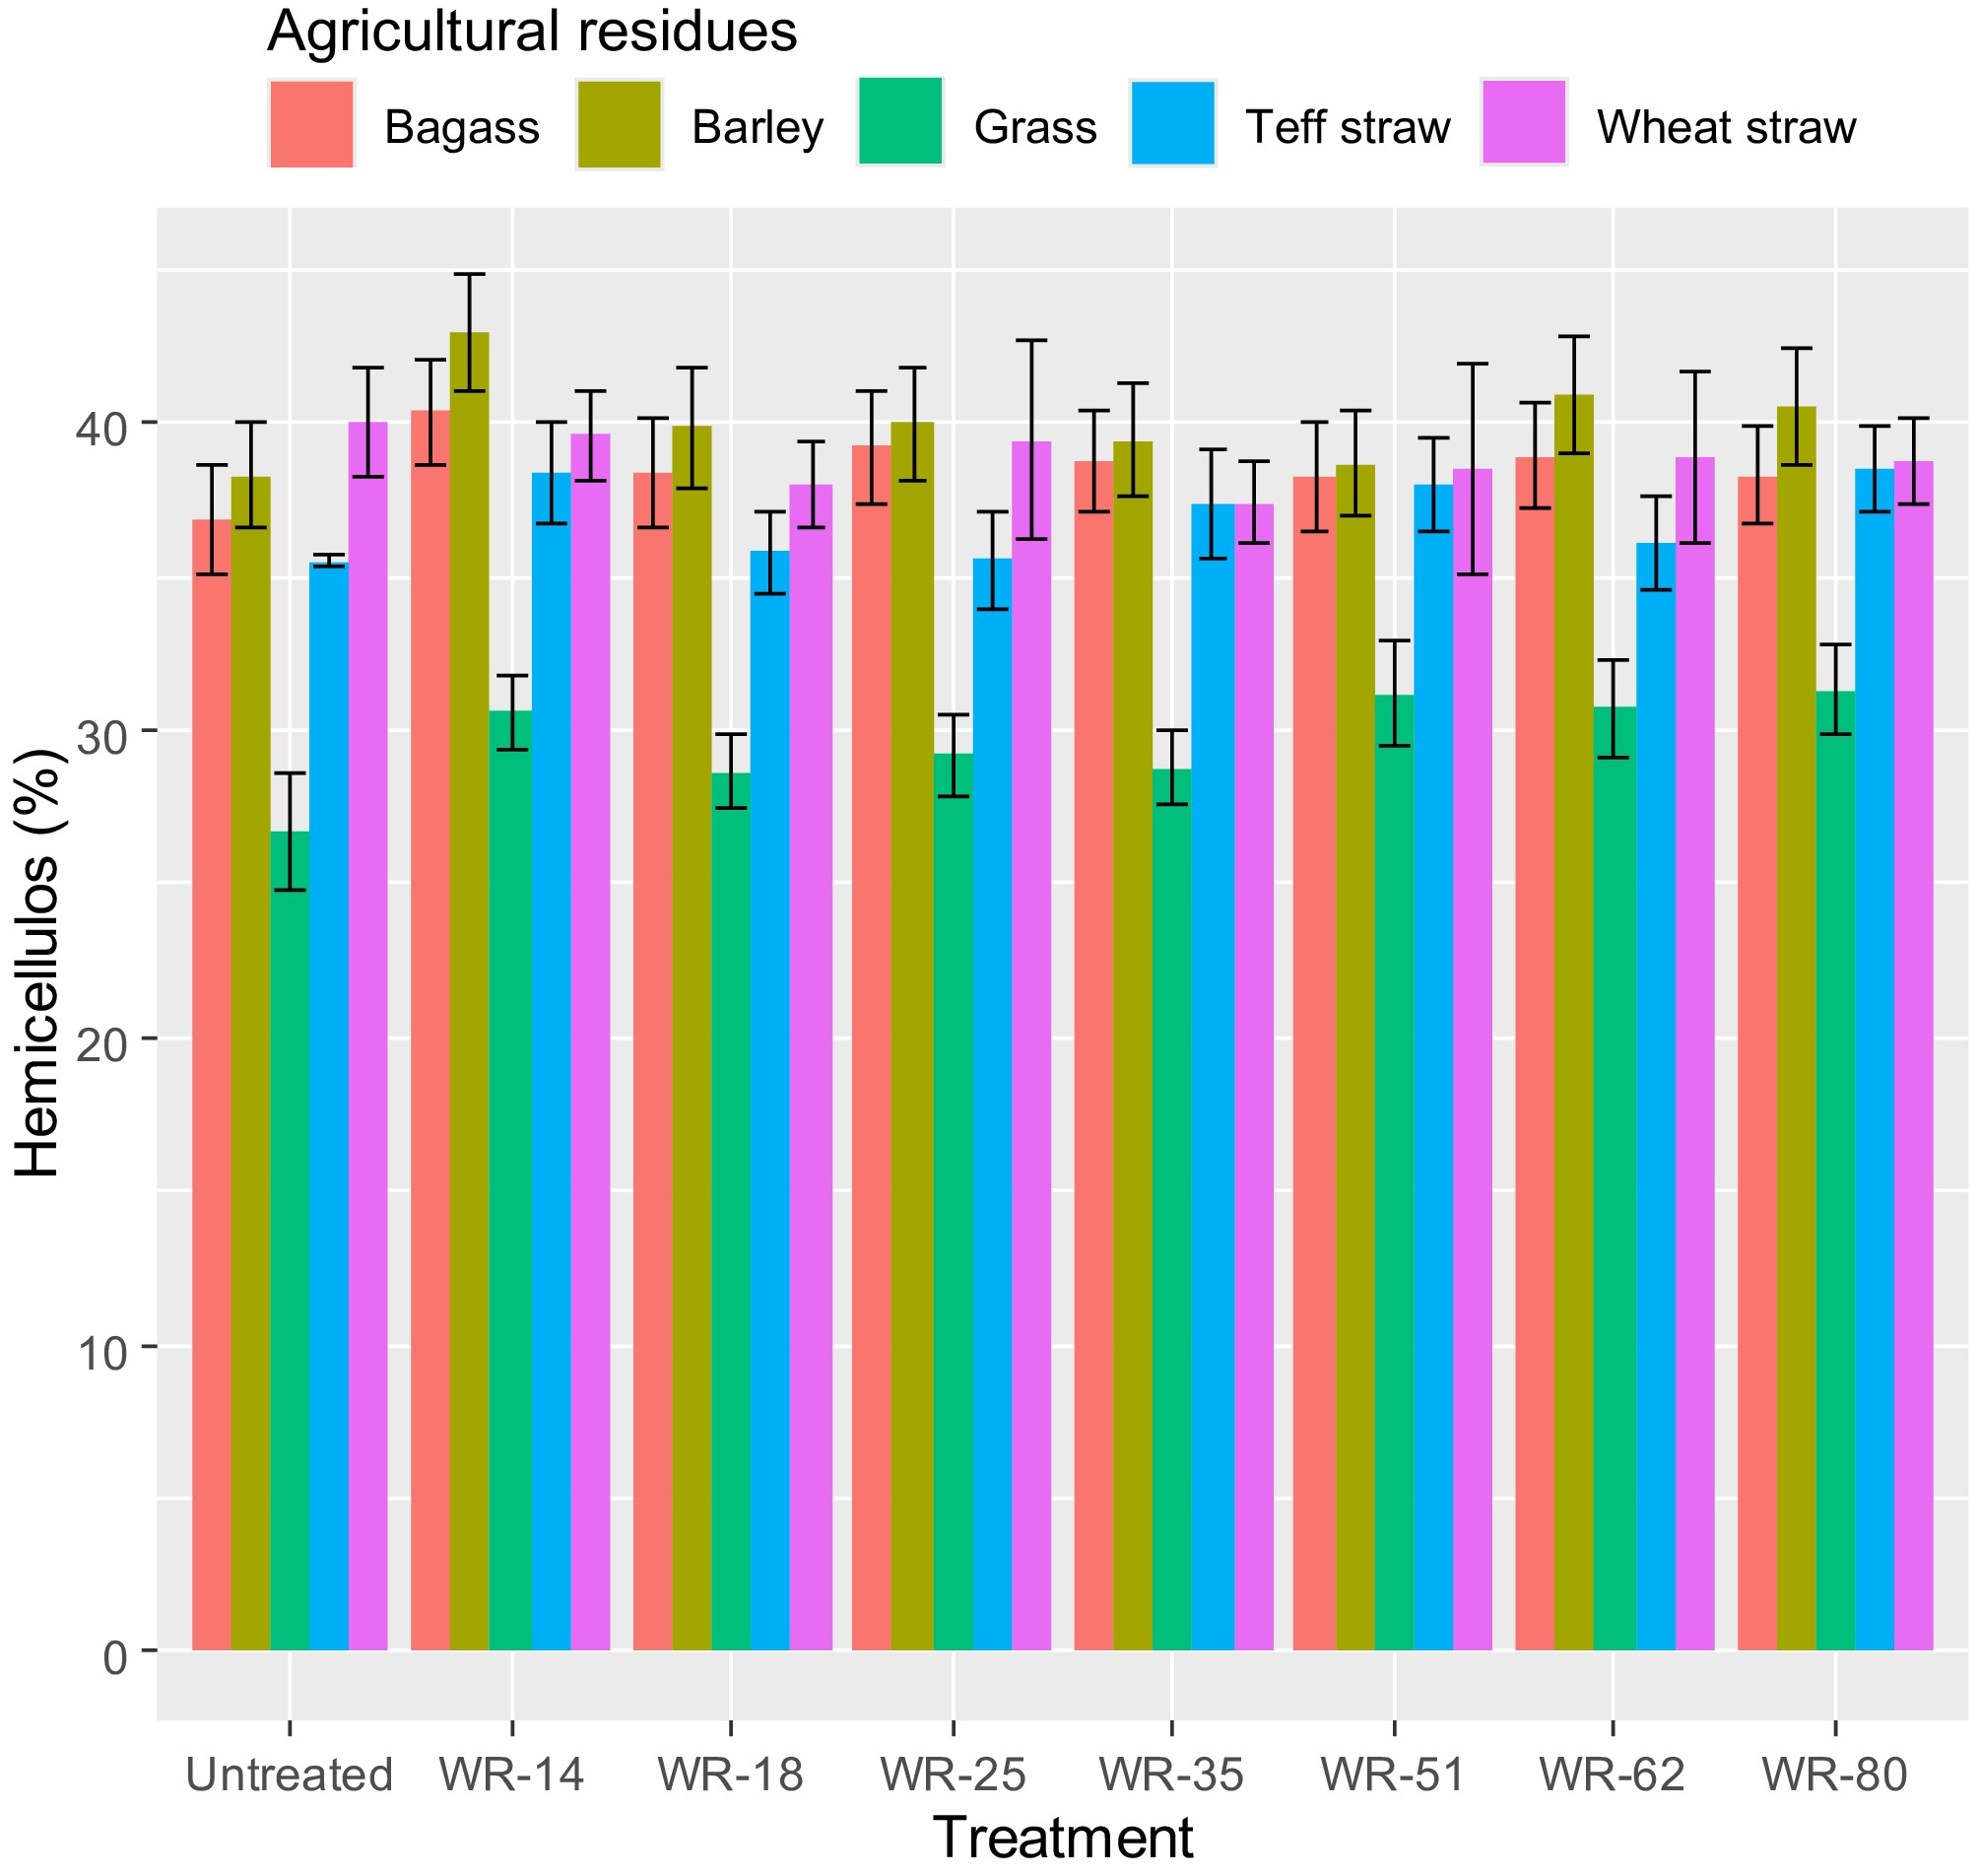
Figure 3.
Effect of white-rot fungal treatment on hemicellulose content of agricultural residues.
-
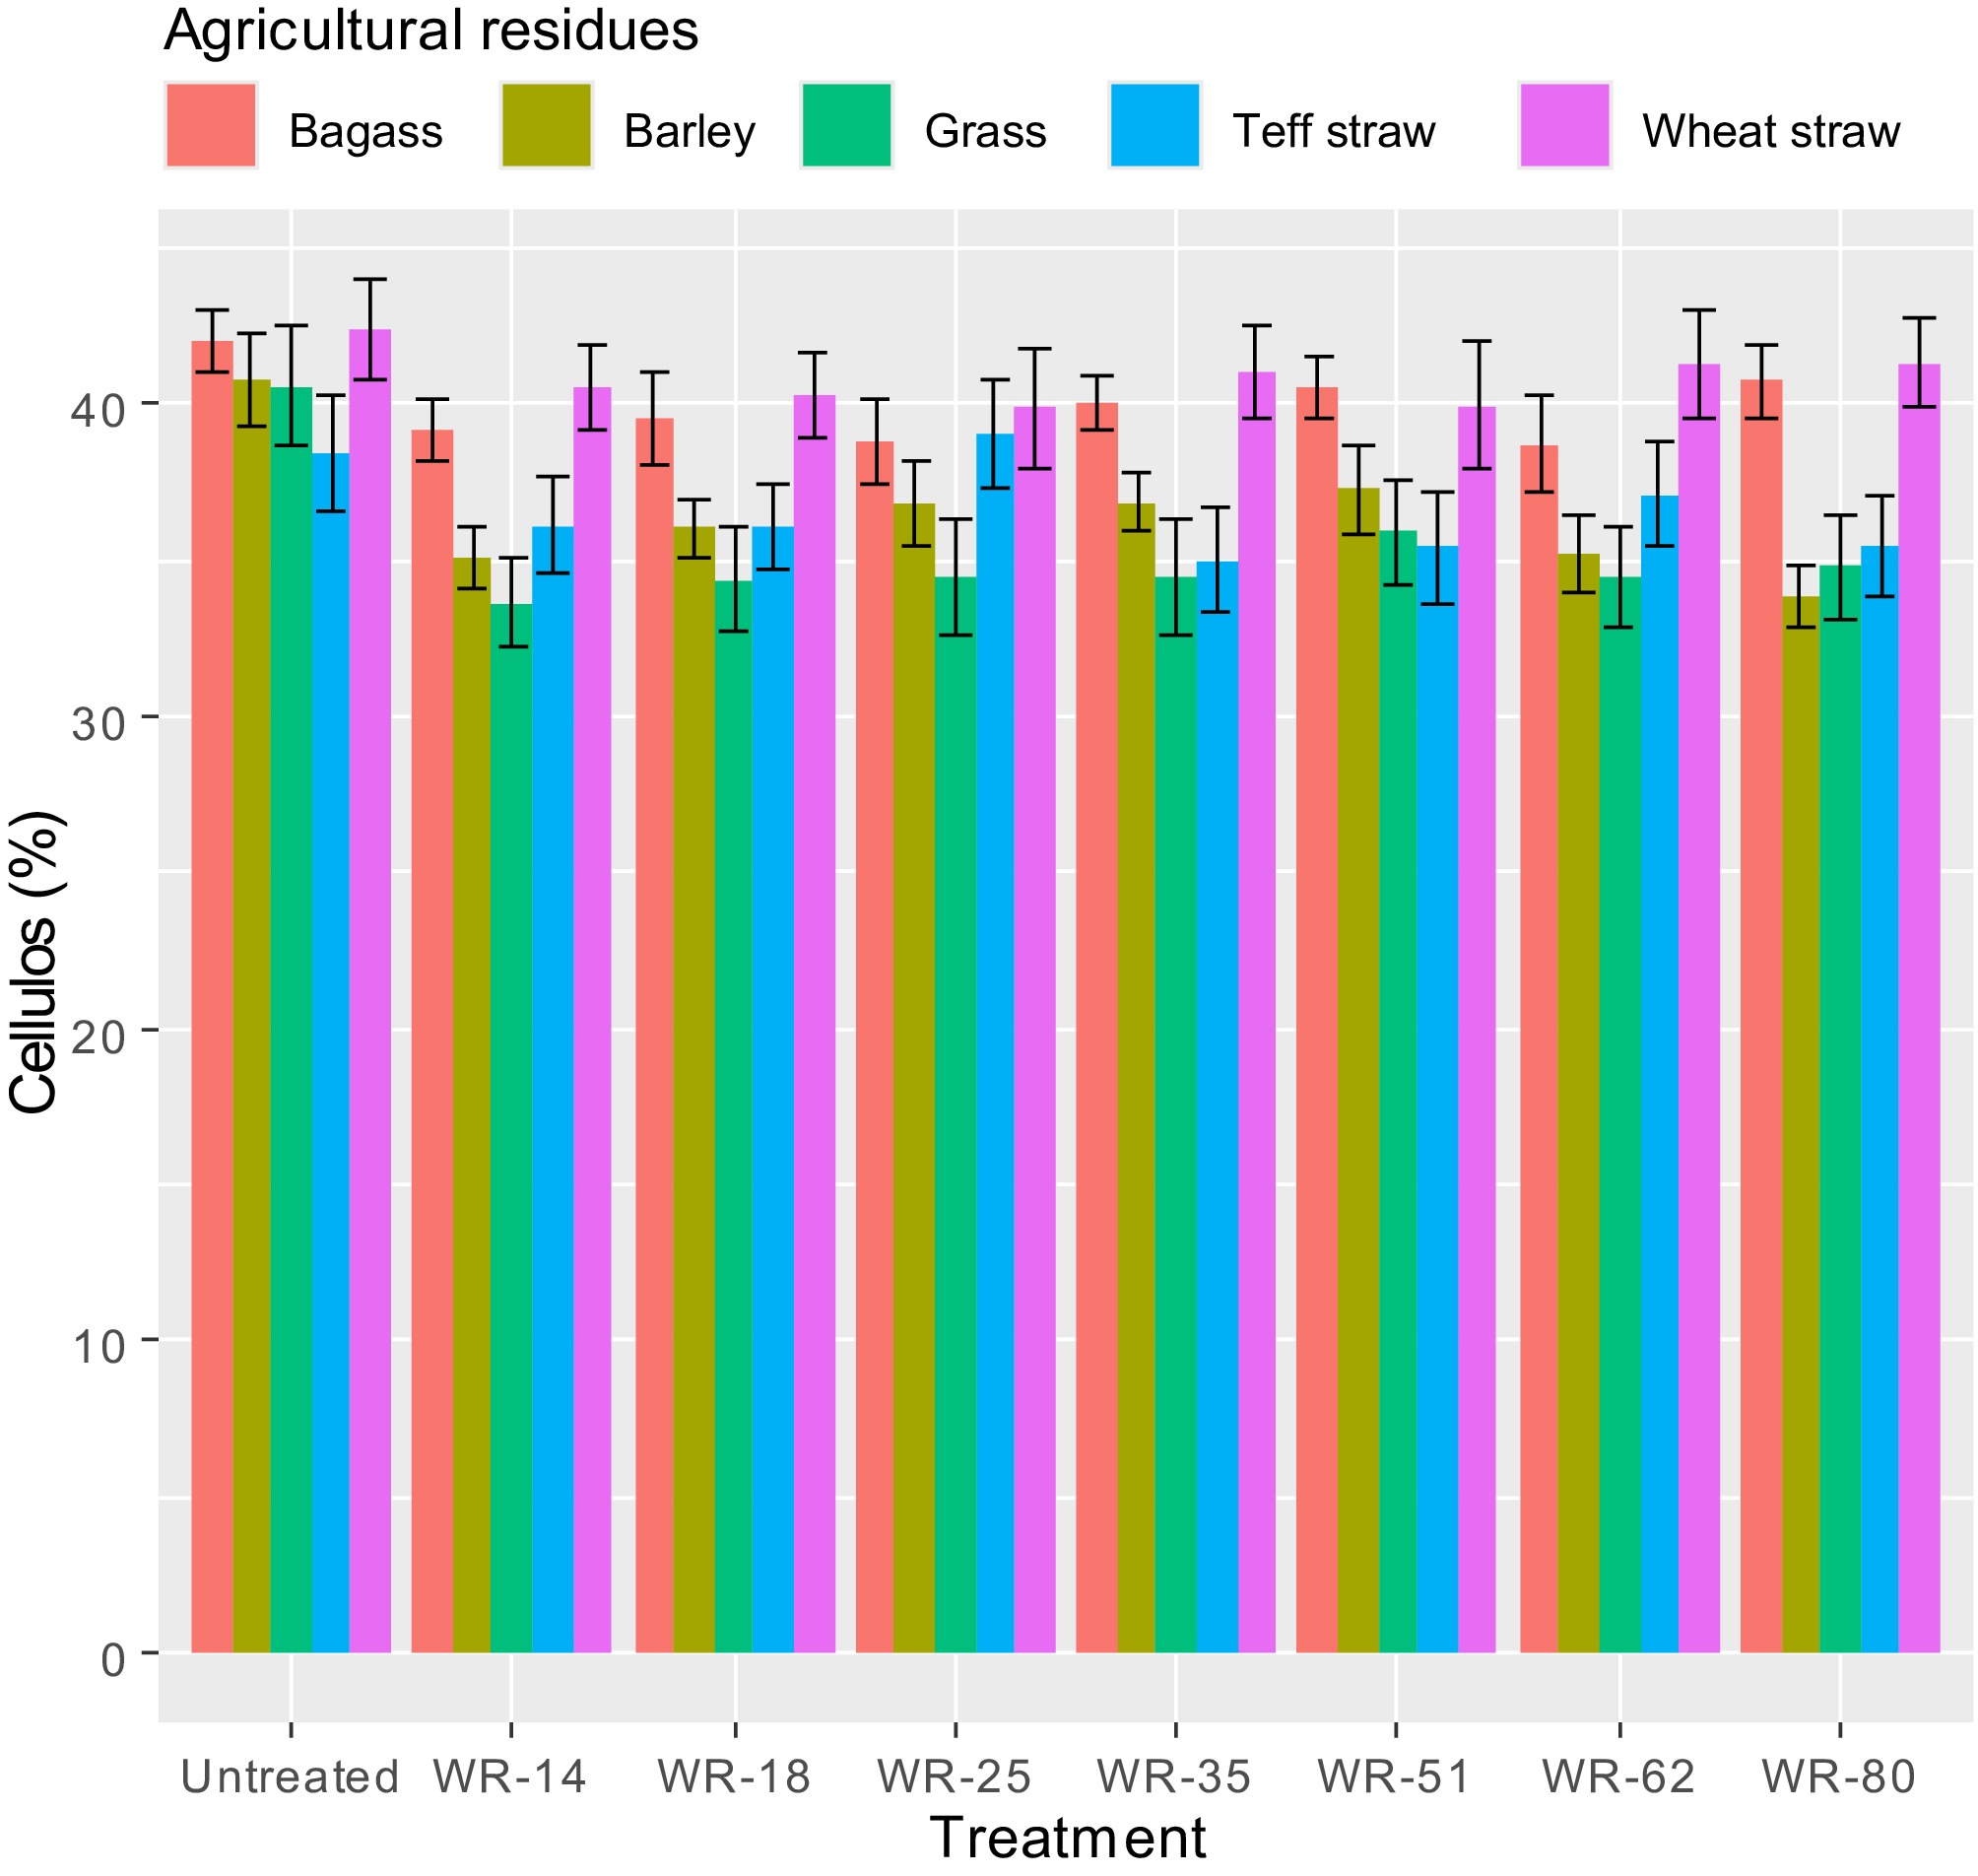
Figure 4.
Effect of white-rot fungal treatment on cellulose content of agricultural residues.
-
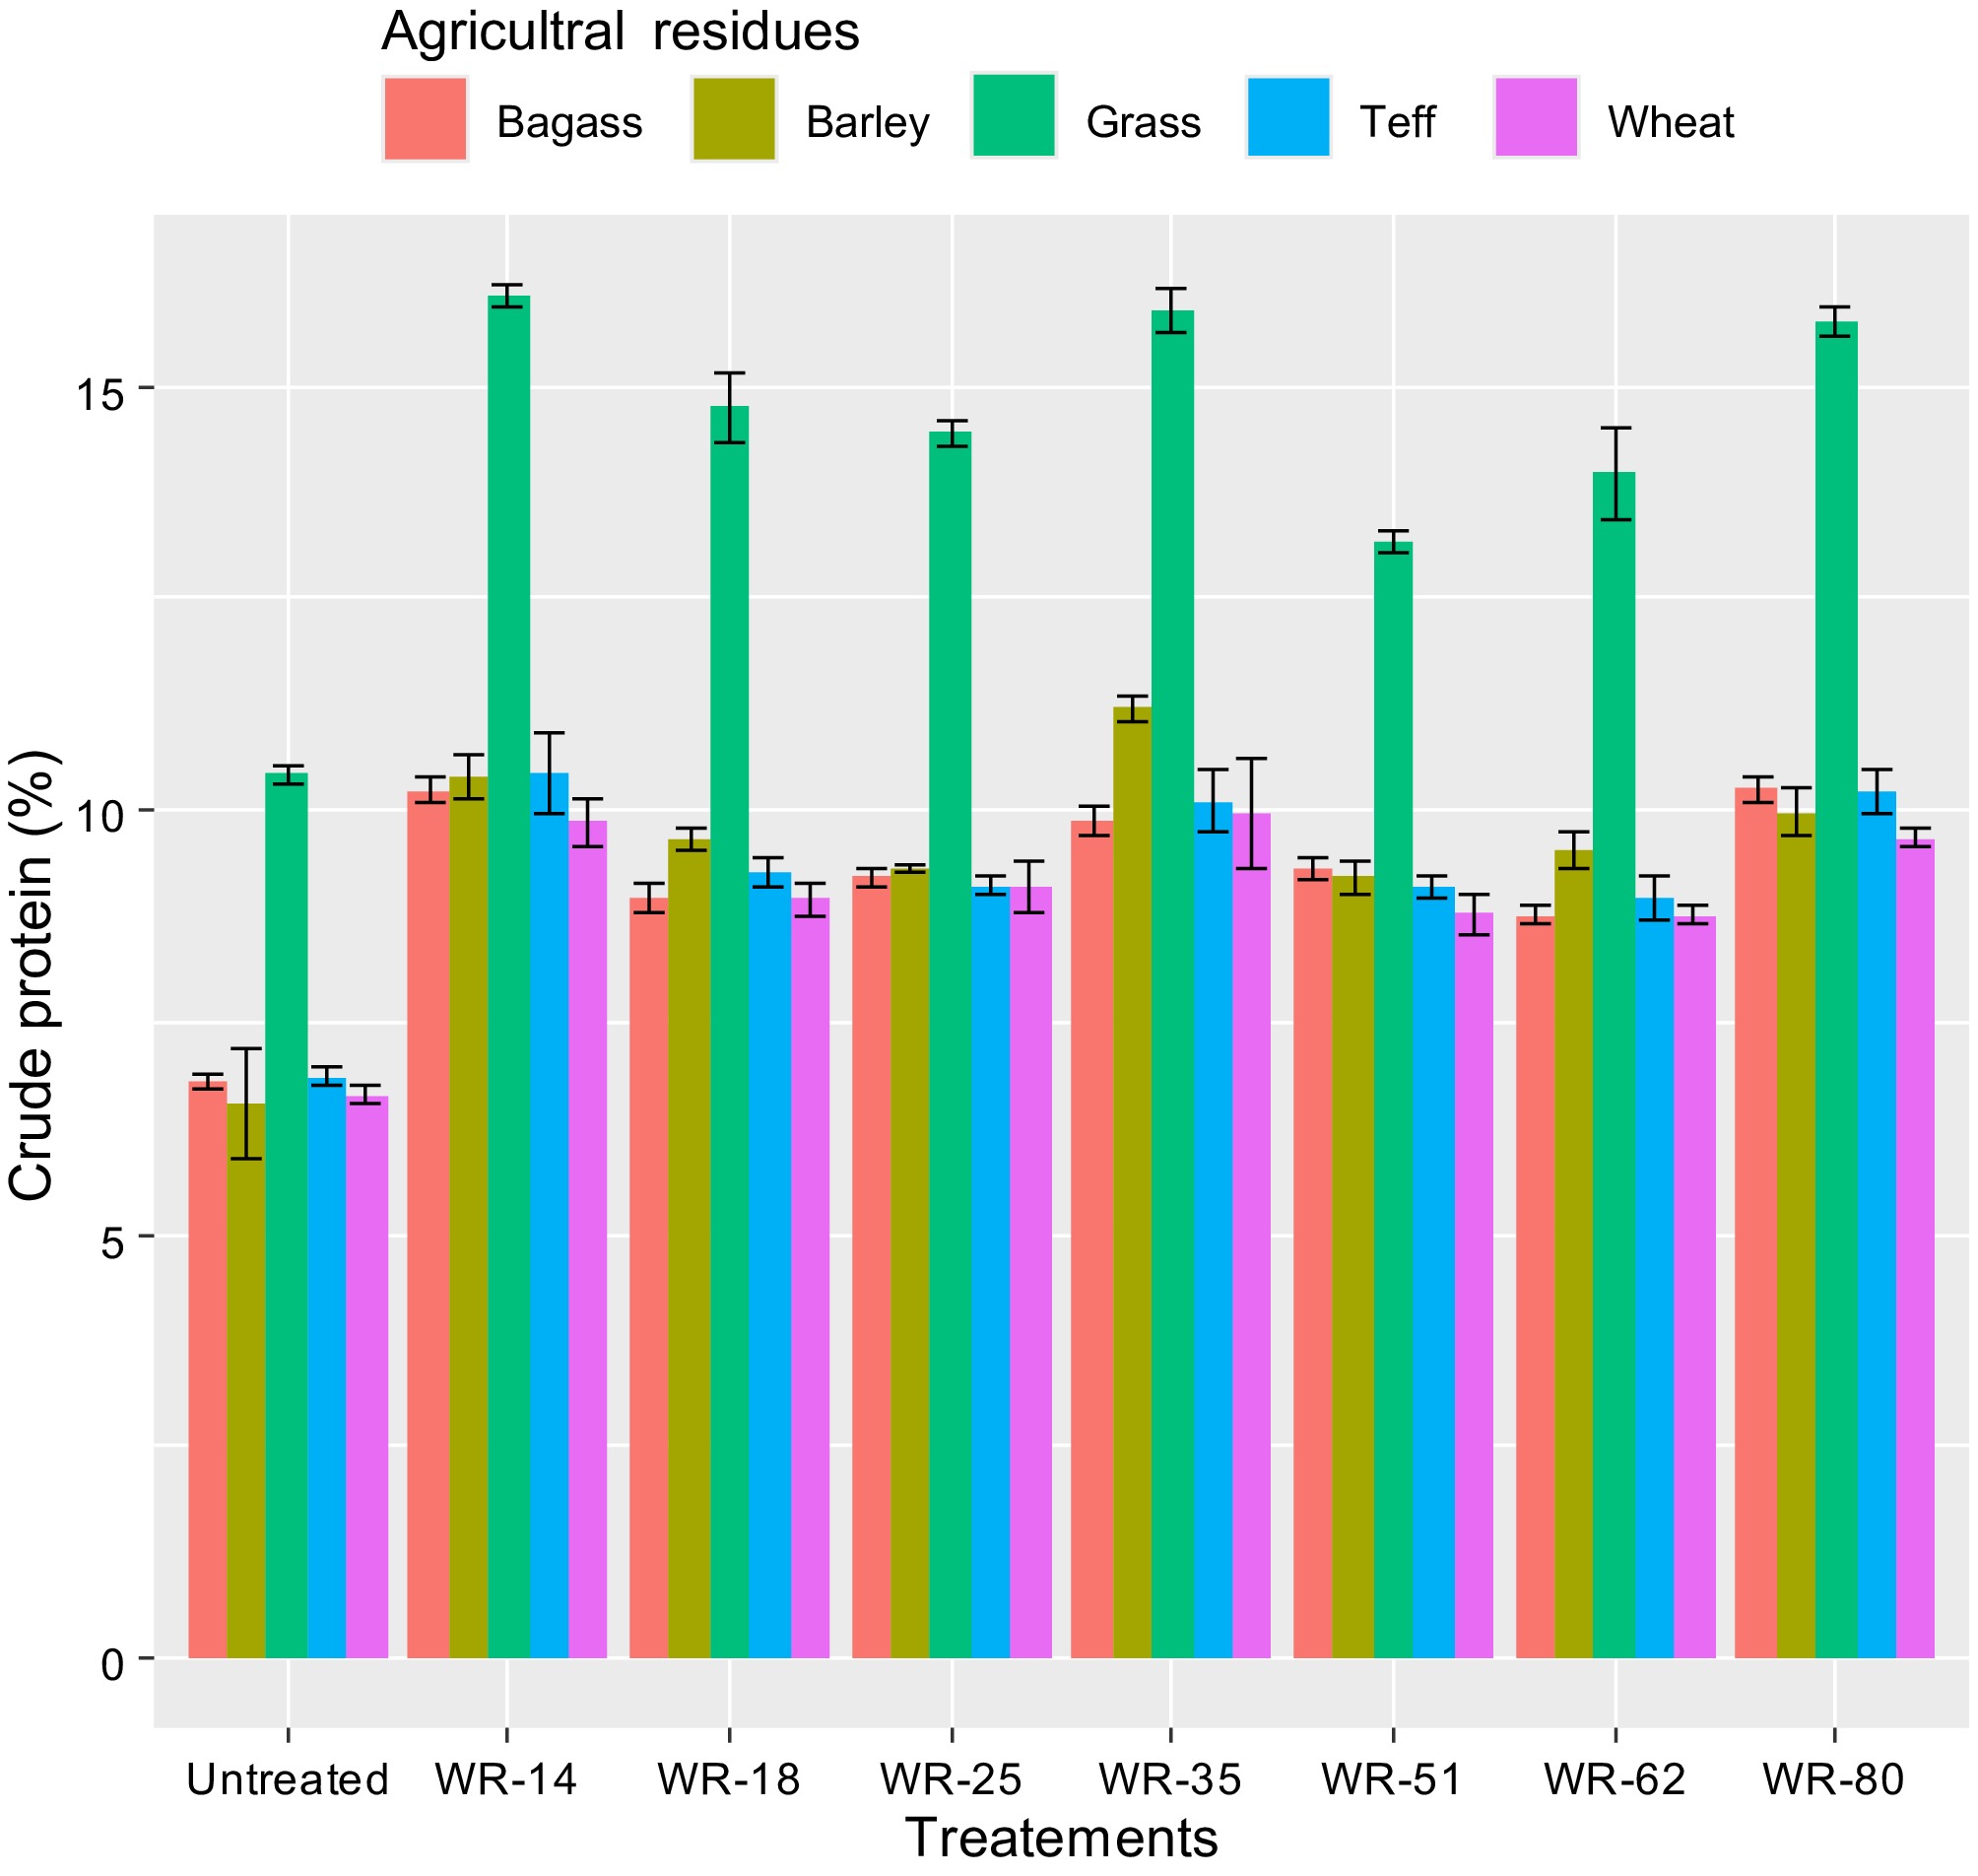
Figure 5.
Effect of white-rot fungal treatment on crude protein content of agricultural residues.
-
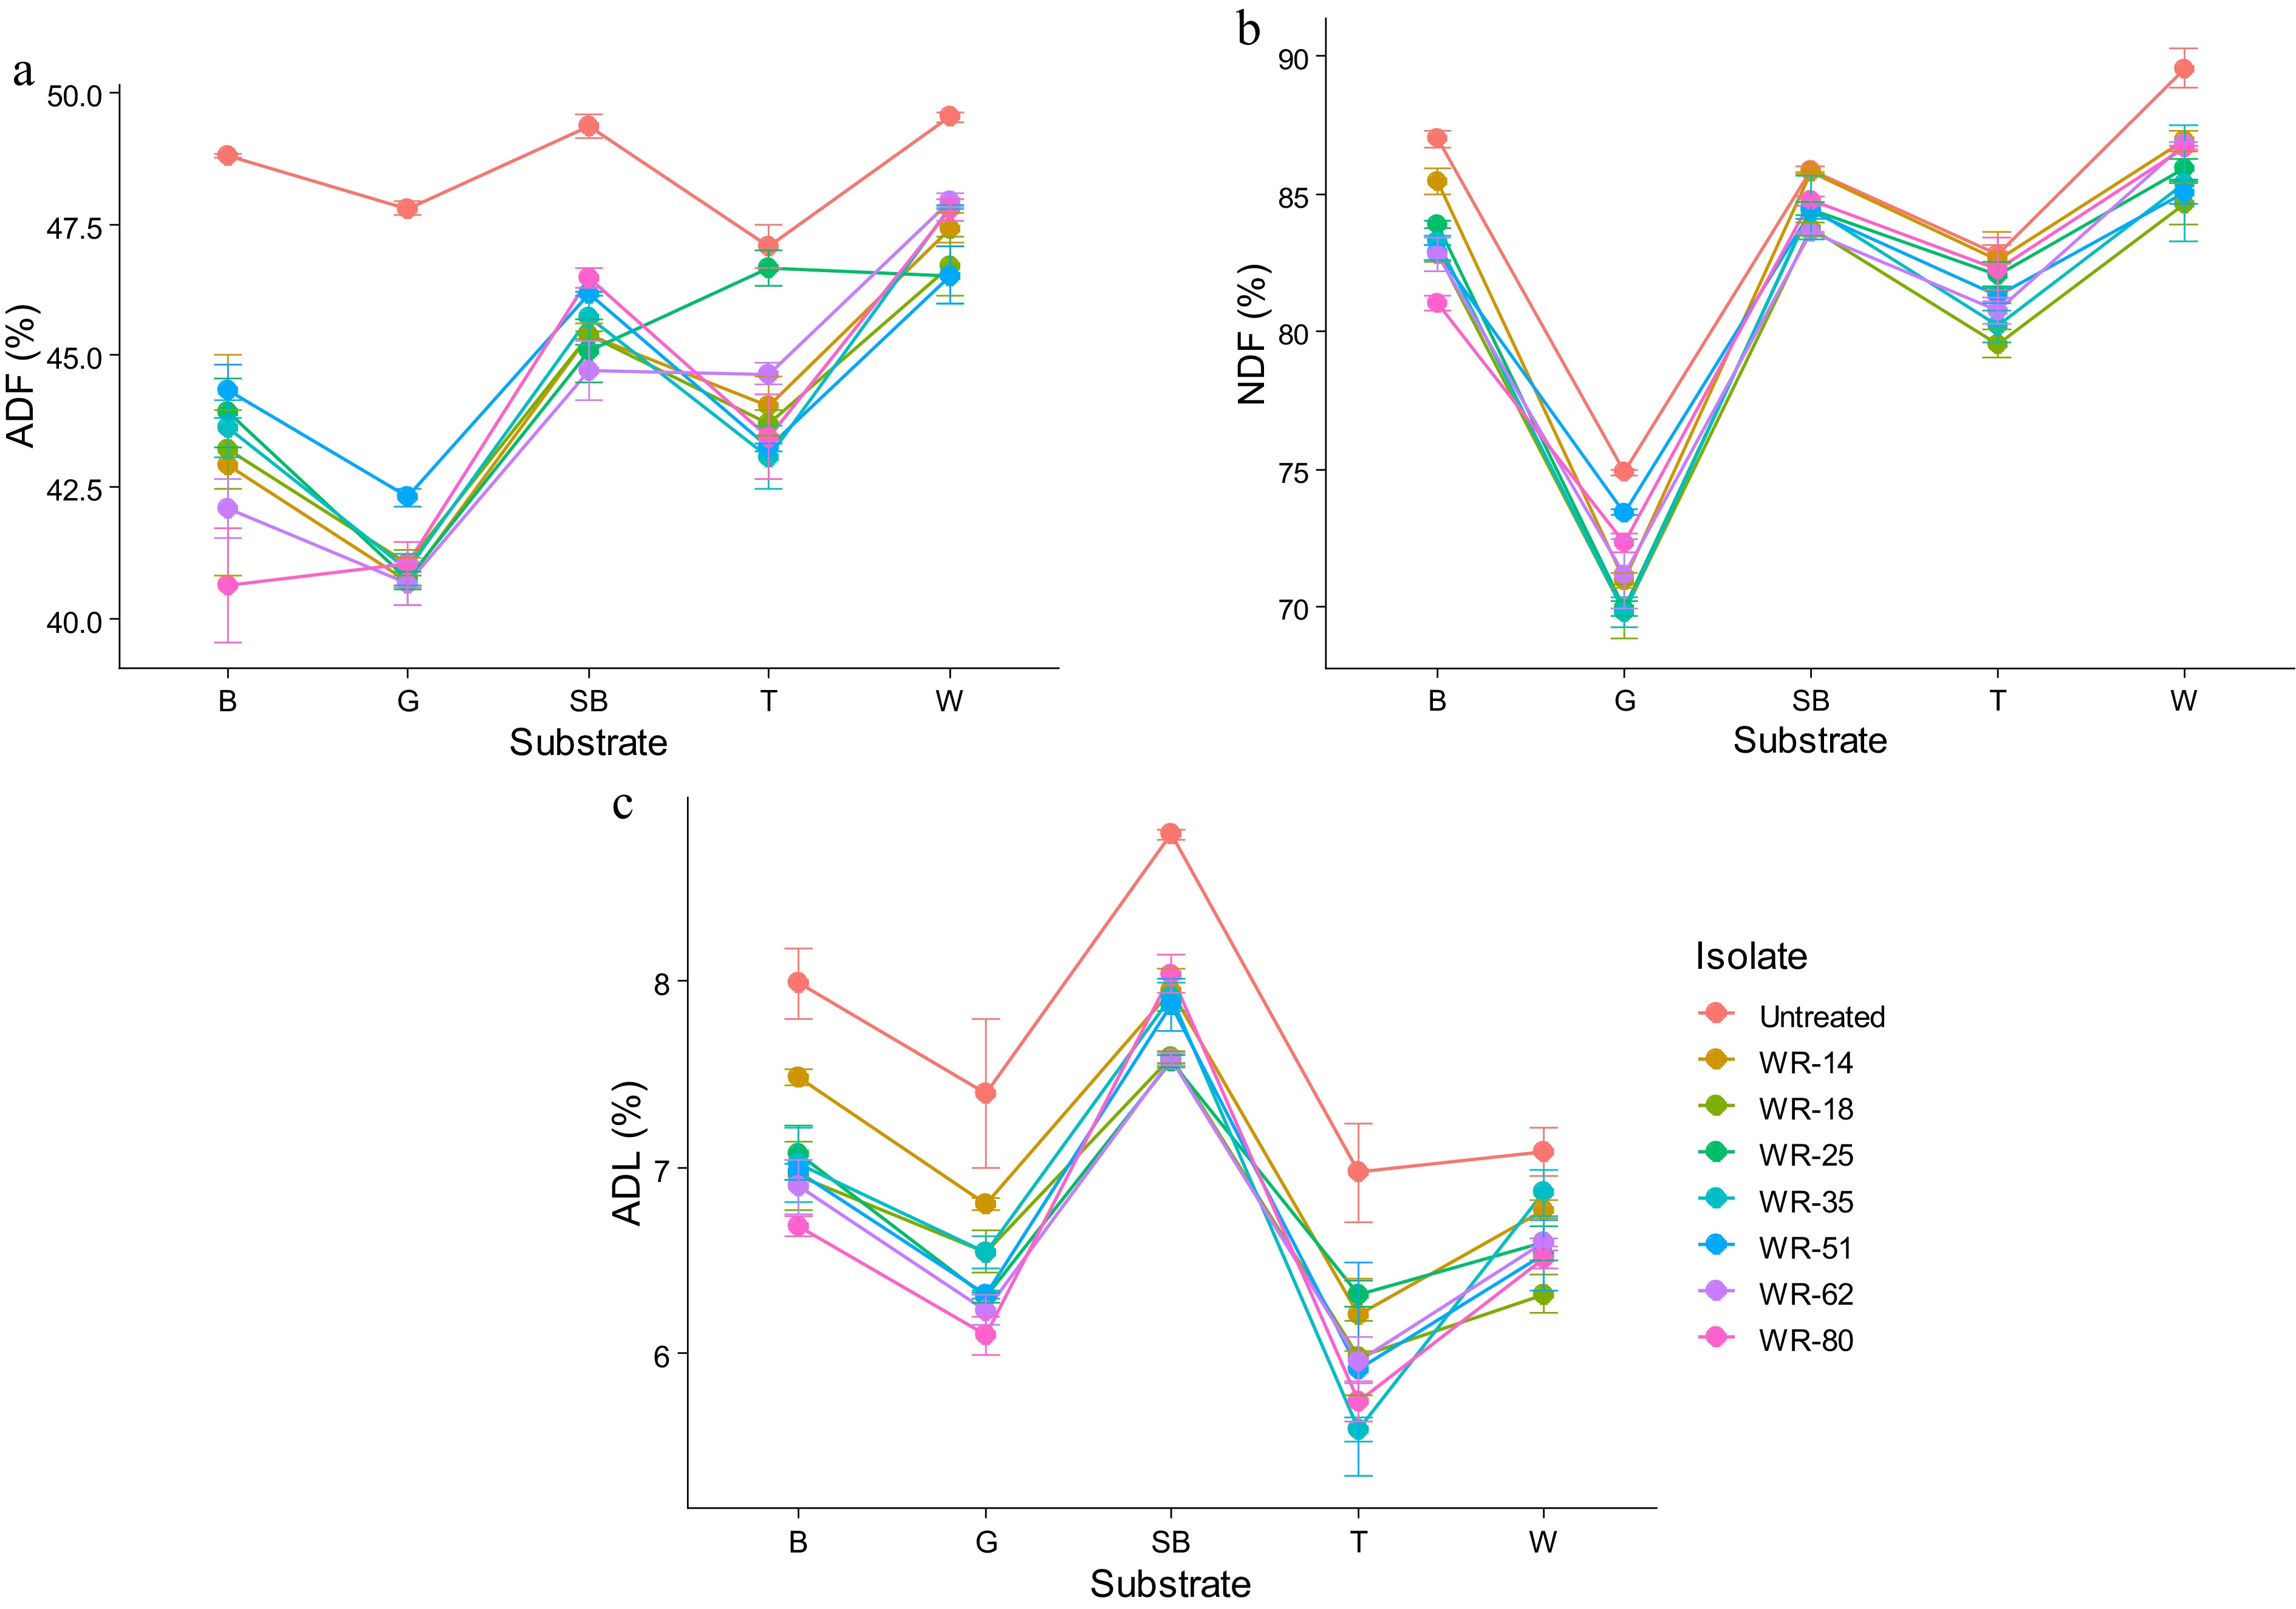
Figure 6.
Interaction effect of WRF isolates and substrates on fiber and lignin content: (a) ADF%, (b) NDF%, and (c) ADL%.
-
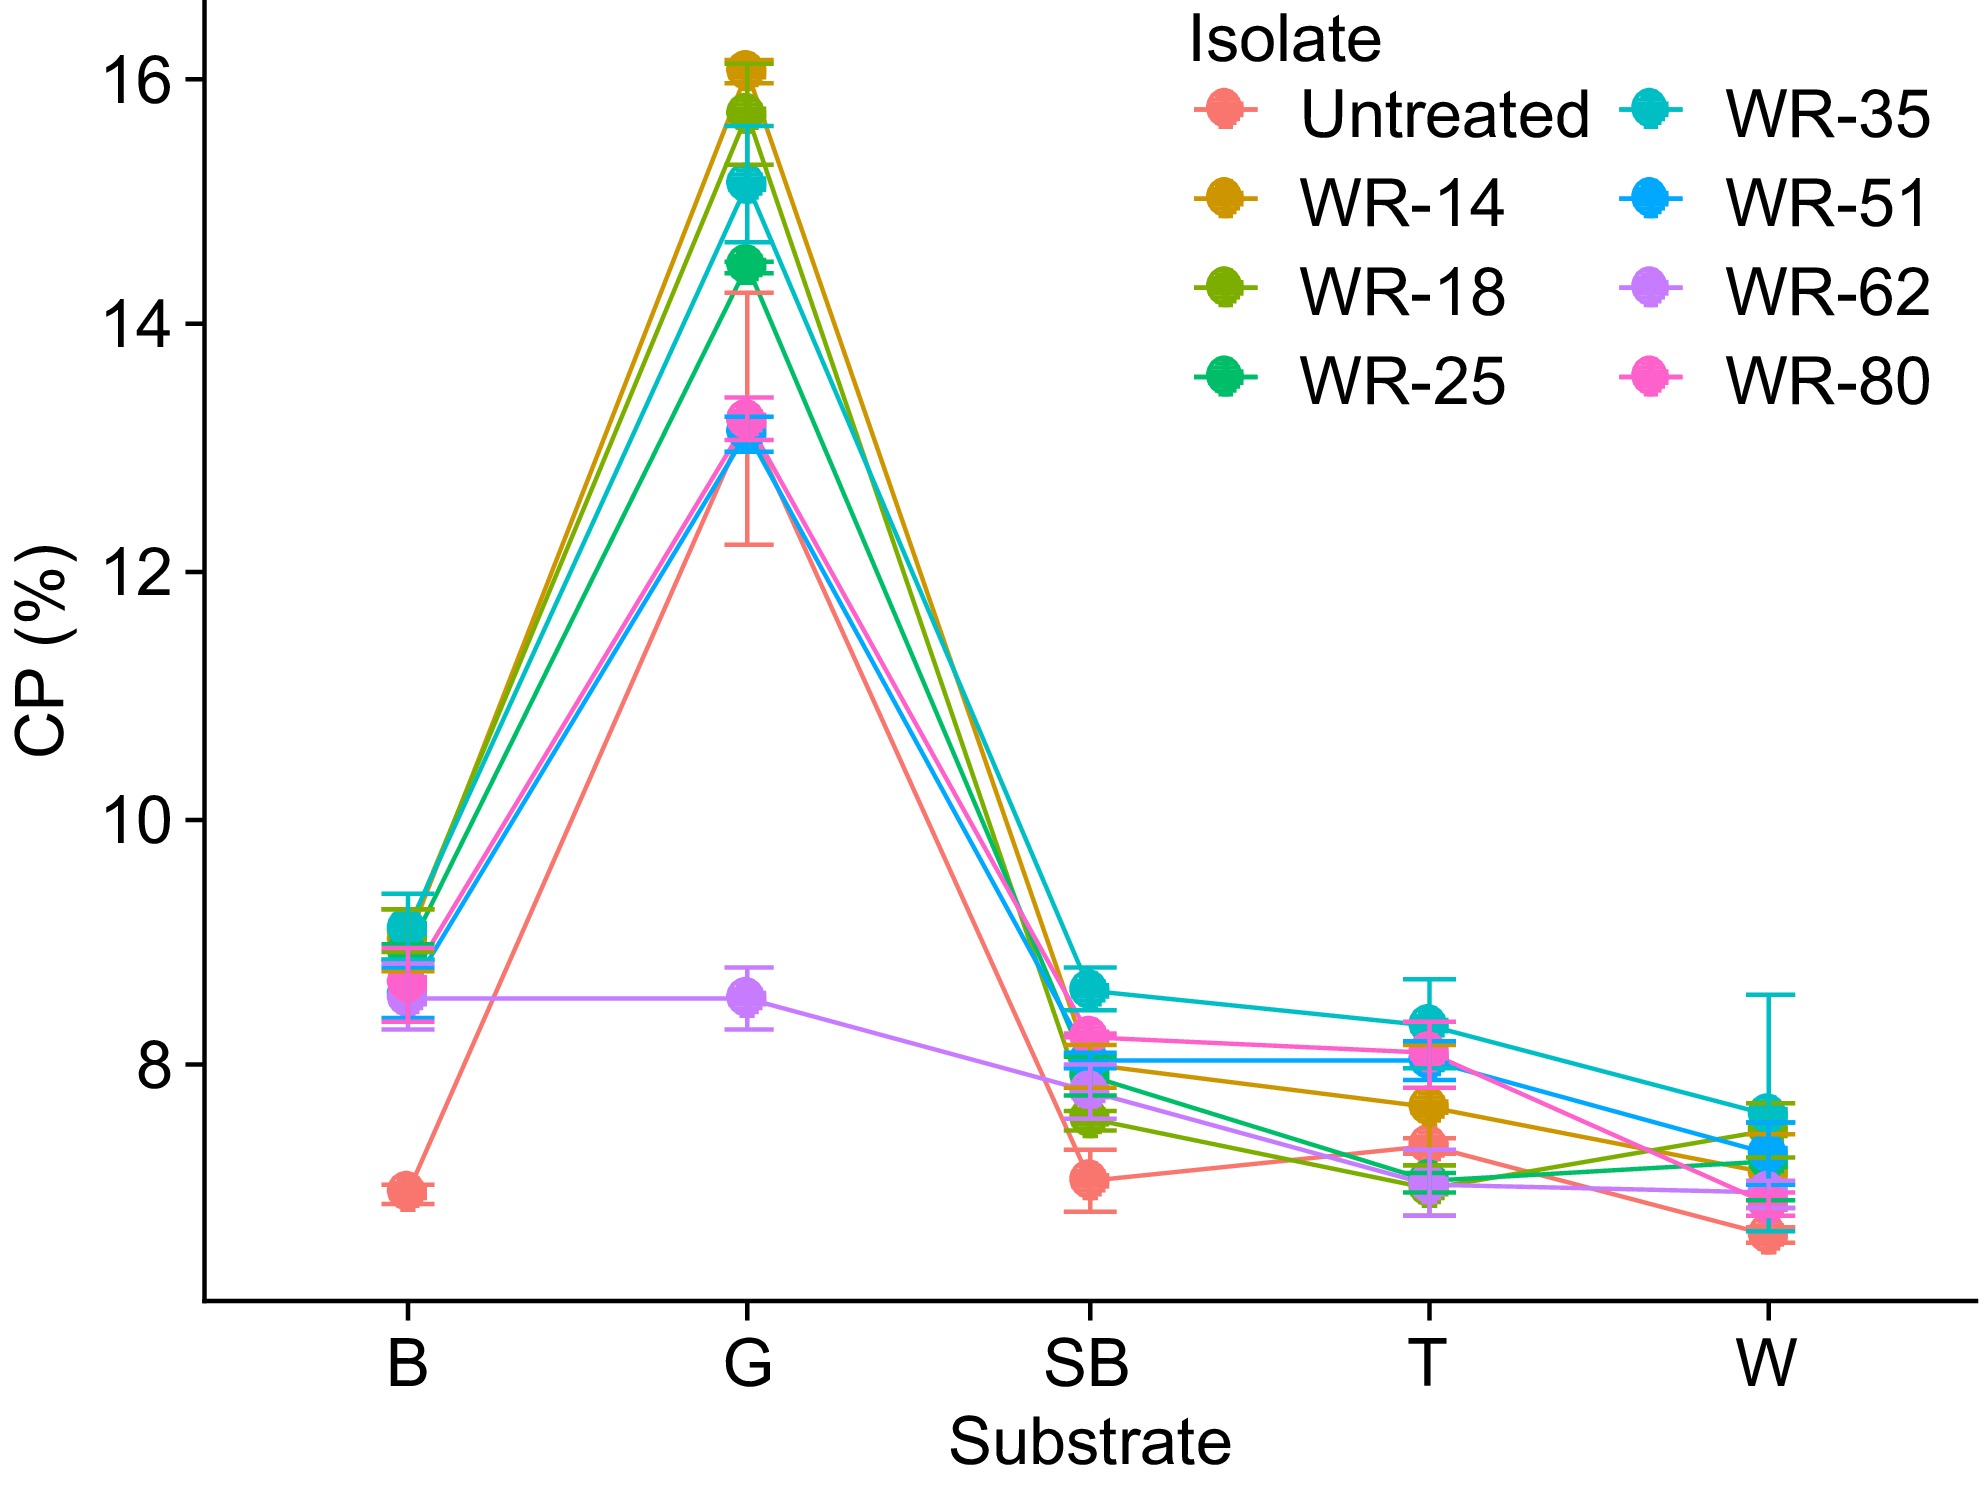
Figure 7.
Interaction effect of WRF isolates and substrates on protein content.
-
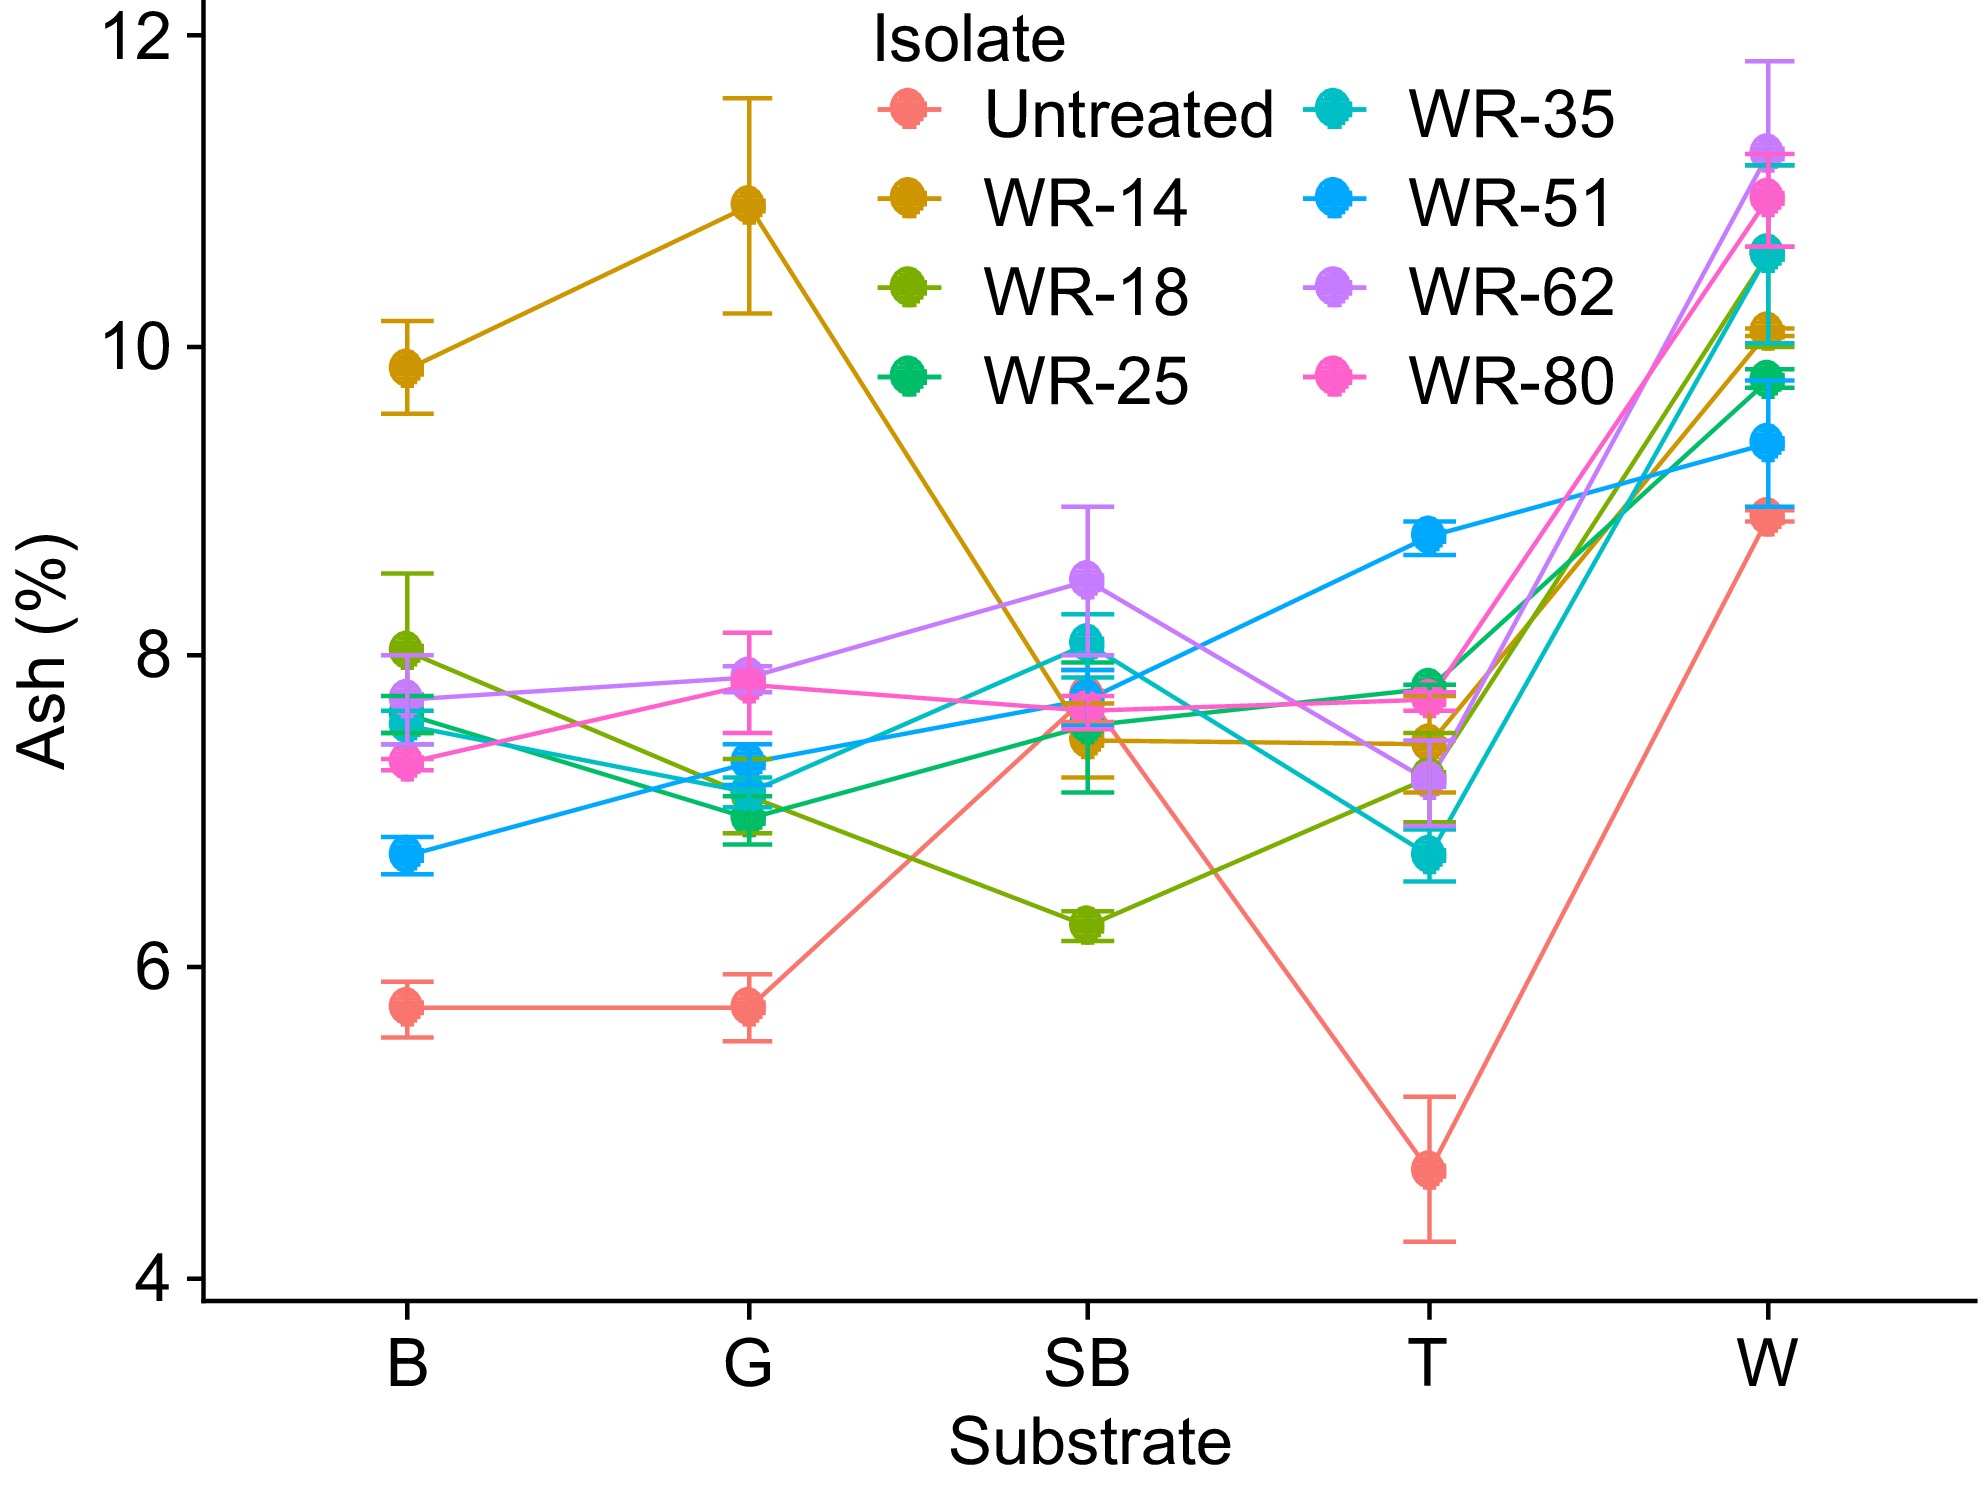
Figure 8.
Interaction effect of WRF isolates and substrates on ash content.
-
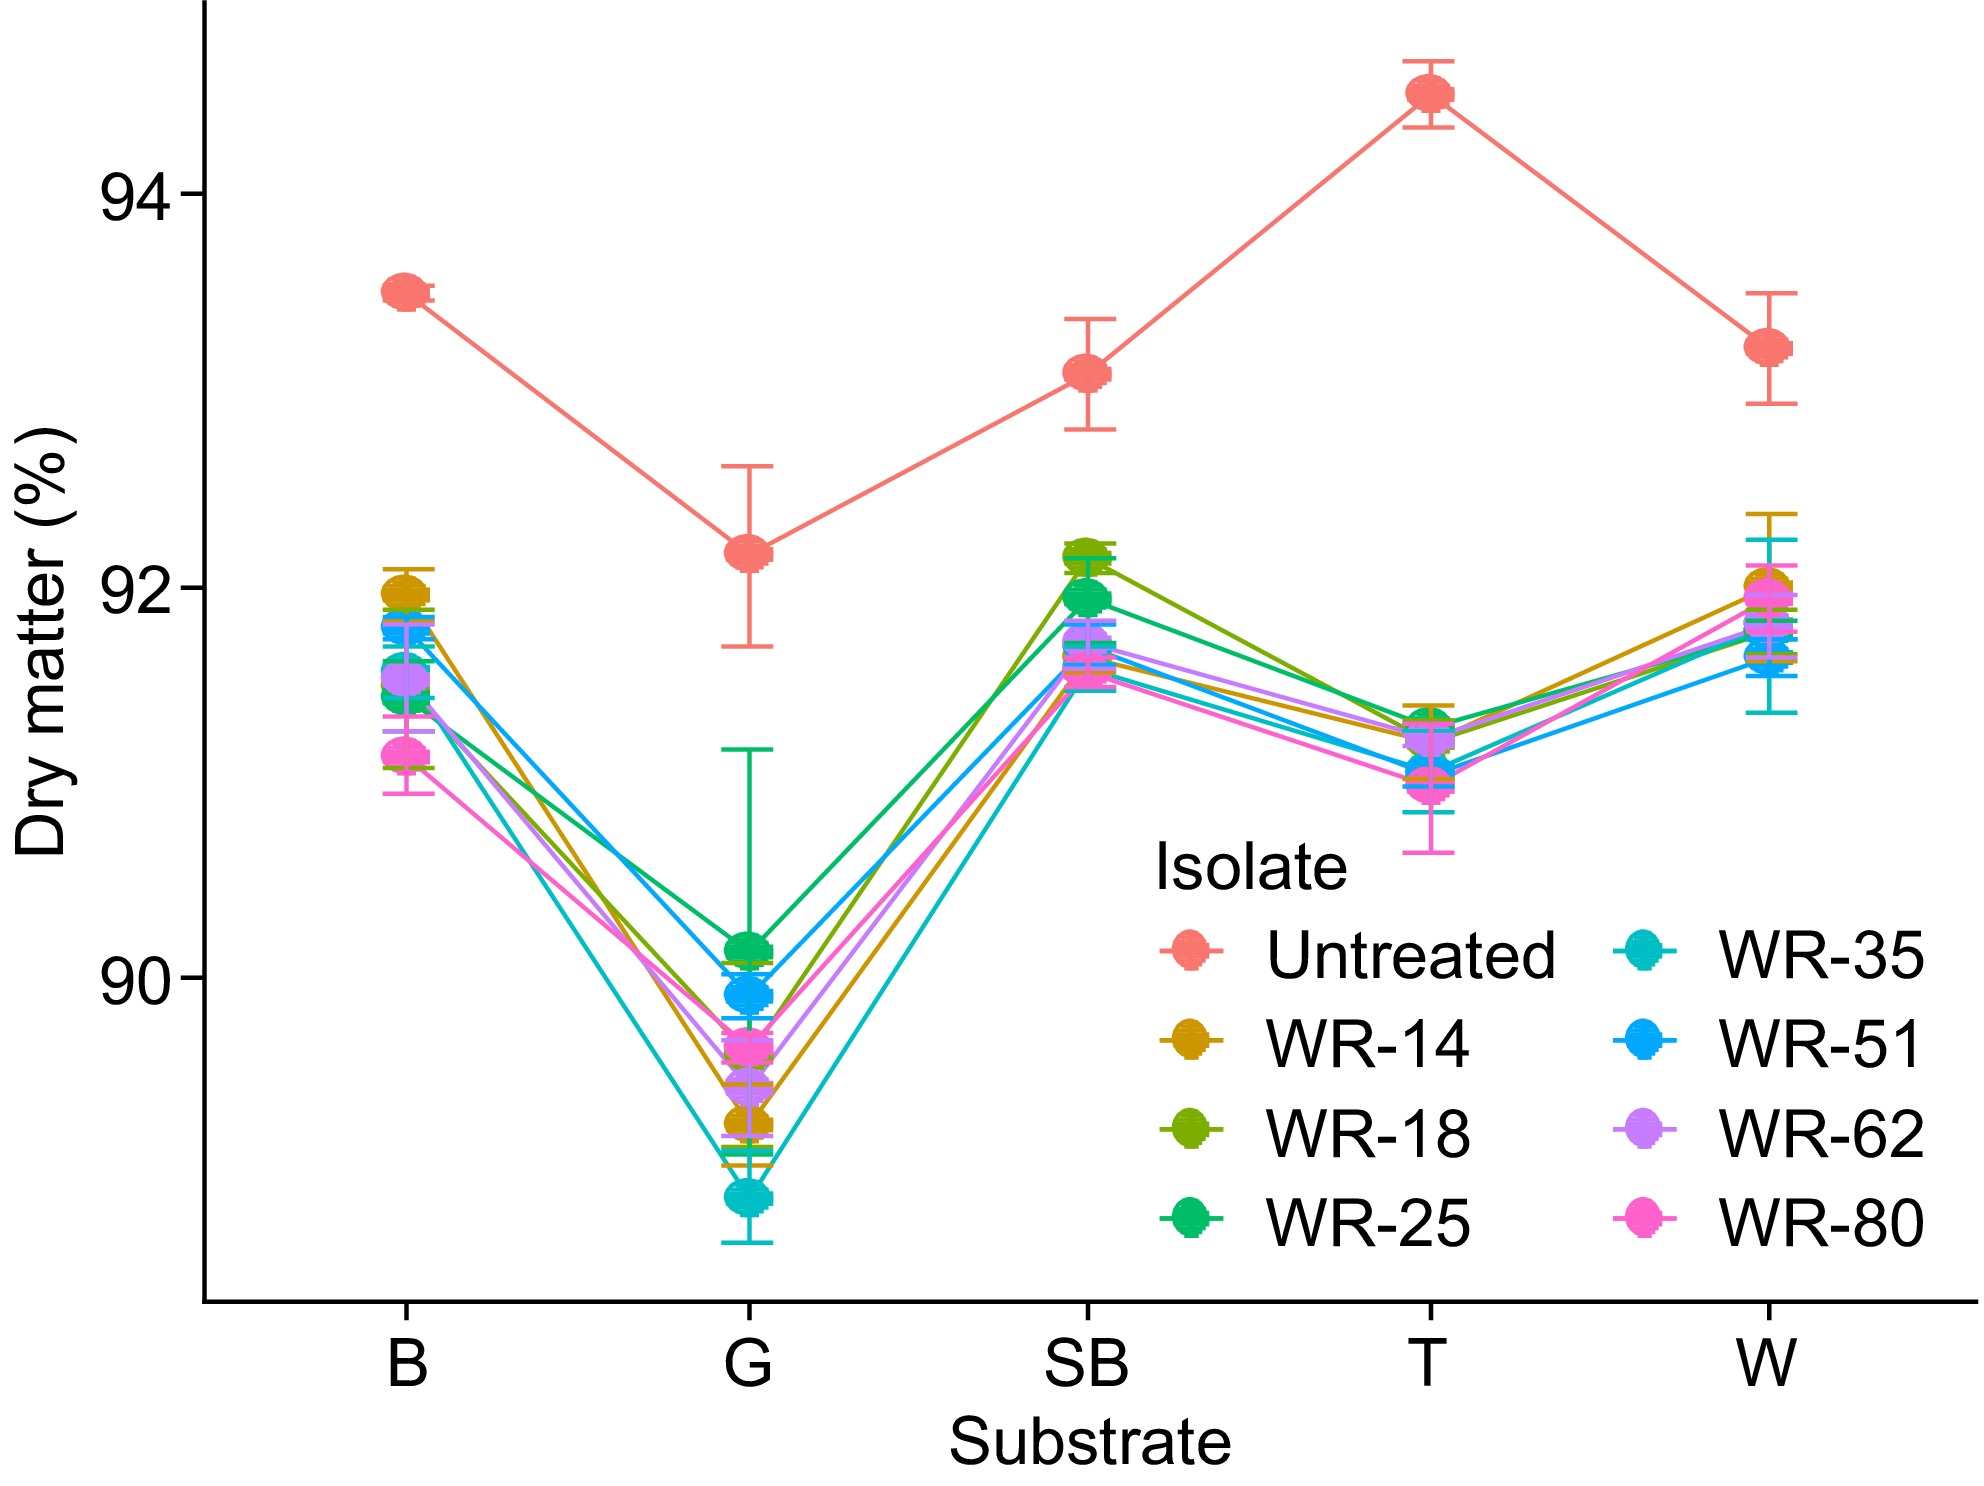
Figure 9.
Interaction effect of WRF isolates and substrates on DM content.
-
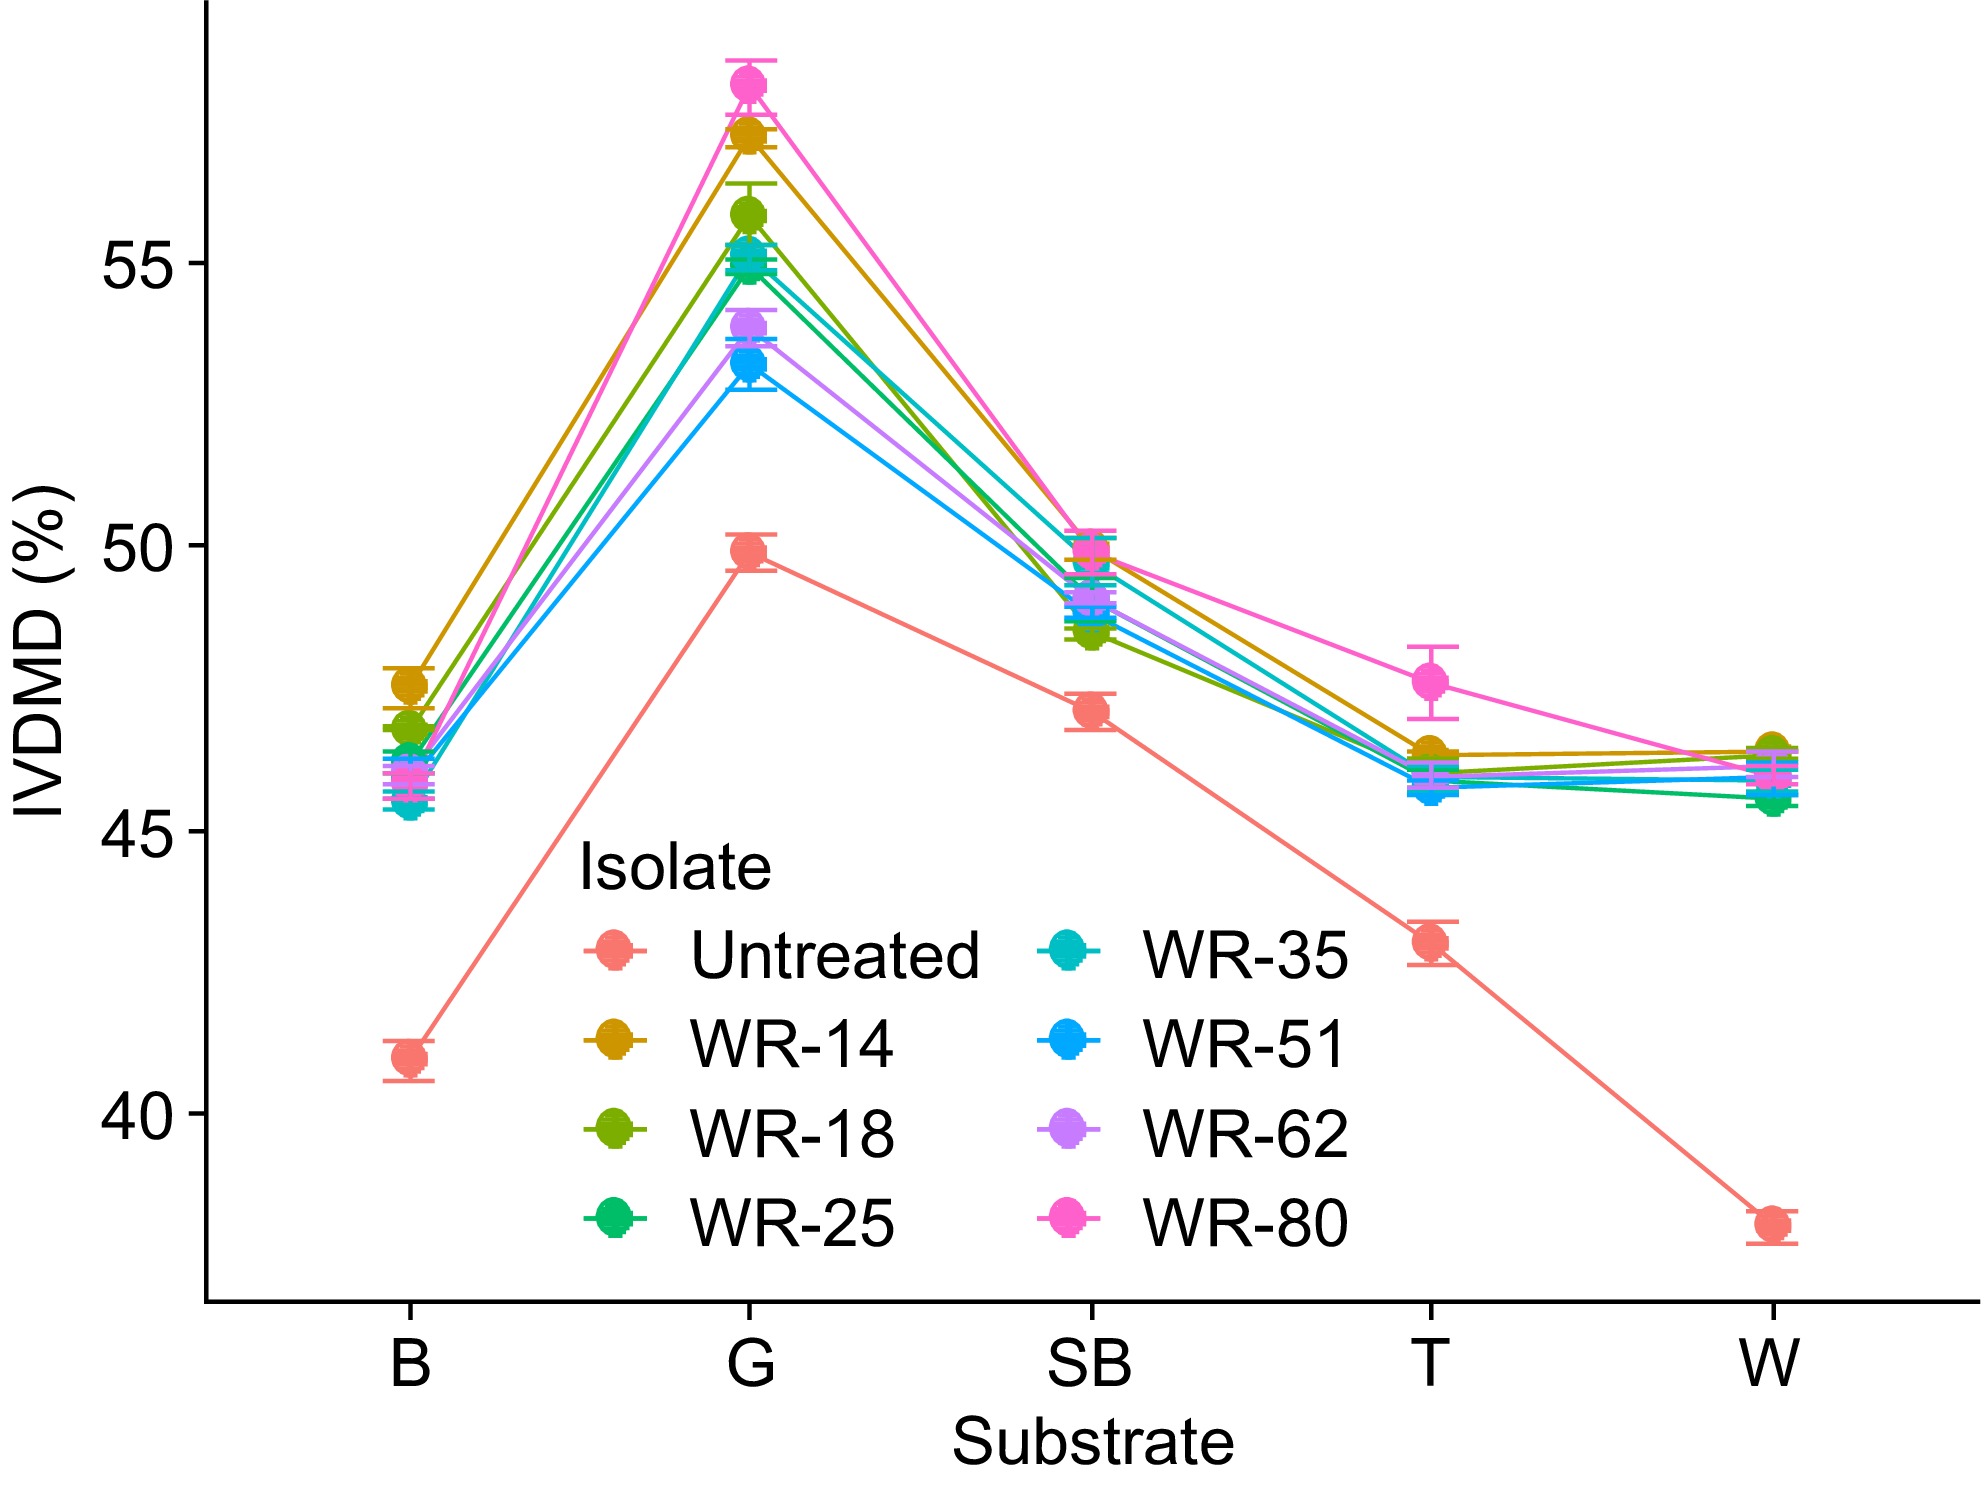
Figure 10.
Interaction effect of WRF isolates and substrates on IVDMD.
-
Fungal isolates Colony morphology on PDA Hyphal system Genus Top and reverse image on PDA WR-62 Growth rate: very fast;
Colony color (top): white, cottony;
Reverse pigmentation: bright orange-redTrimitic Pycnoporus 
WR-25 Growth rate: very fast;
Colony color (top): white, fluffy;
Reverse pigmentation: reddish-brownTrimitic Trametes 
WR-80 Growth rate: very fast;
Colony color (top): white, fluffy;
Reverse pigmentation: yellowishTrimitic Trametes versicolor 
WR-18 Growth rate: very fast;
Colony color (top): fluffy white mycelium with a pale yellow-green tinge;
Reverse pigmentation: from dark in the center to lighter at the edgesDimitic Lentinus species 
WR-35 Growth rate: very fast;
Colony color (top): white, fluffy mycelium in the center with a smooth outer edge;
Reverse pigmentation: orange and reddish huesTrimitic Ganoderma species 
WR-14 Growth rate: very fast;
Colony color (top): fluffy, white, radial mycelial with a darker center;
Reverse pigmentation: orange to reddish colorMonomitic Phanerochaete chrysosporium 
WR-51 Colony color (top): white, fluffy mycelium;
Reverse pigmentation: light yellowTrimitic Trametes versicolor 
Table 1.
Morphological characteristics of white-rot fungal isolates.
-
Treatments Chemical composition (g/100 g DM) DM Ash NDF ADF ADL IVDMD WR-35 45.63 ± 0.17bcd 8.00 ± 0.21ab 84.425 ± 1.63bc 45.63 ± 0.71bcd 7.93 ± 0.1bc 49.93 ± 0.35a WR-14 45.36 ± 0.08bcd 7.39 ± 0.28b 85.765 ± 0.06ab 45.36 ± 0.28bcd 7.985 ± 0.15bc 49.51 ± 1.1ab WR-80 46.42 ± 0.09b 7.635 ± 0.15ab 84.73 ± 0.23abc 46.42 ± 0.2b 8.02 ± 0.14b 49.68 ± 0.92ab WR-18 45.375 ± 0.07bcd 6.225 ± 0.12c 83.765 ± 0.29c 45.375 ± 0.11bcd 7.57 ± 0.0d 48.44 ± 0.13bc WR-62 44.62 ± 0.17d 8.405 ± 0.66a 83.595 ± 0.06c 44.625 ± 0.77d 7.565 ± 0.01d 49.13 ± 0.06ab WR-25 45.14 ± 0.3cd 7.475 ± 0.57b 84.41 ± 0.28bc 45.14 ± 0.85cd 7.56 ± 0.05d 49.13 ± 0.52ab WR-51 46.17 ± 0.13bc 7.745 ± 0.25ab 84.39 ± 0.31bc 46.17 ± 0.01bc 7.80 ± 0.08c 48.81 ± 0.16ab Untreated 49.12 ± 0.3a 5.25 ± 0.35d 85.88 ± 0.17a 49.12 ± 0.27a 8.785 ± 0.04a 47.28 ± 0.59c The same superscript lowercase letters on the top right side within columns indicate that the values are not significantly different, whereas different superscript letters indicate that the values are significantly different at p < 0.05. Table 2.
Effect of white-rot fungal treatment on chemical composition sugarcane bagasse.
-
Treatments Chemical composition (g/100 g DM) DM Ash NDF ADF ADL IVDMD WR-35 91.60 ± 0.17bc 7.54 ± 0.16b 83.25 ± 0.23c 43.780 ± 0.64bc 6.905 ± 0.08cd 45.49 ± 0.21d WR-14 91.975 ± 0.18b 9.85 ± 0.41a 85.485 ± 0.6ab 42.56 ± 2.83bc 7.46 ± 0.03b 47.40 ± 0.45a WR-80 91.165 ± 0.28c 7.29 ± 0.03bc 81.045 ± 1.08d 40.505 ± 1.49c 6.655 ± 0.01d 45.745 ± 0.32cd WR-18 91.38 ± 0.51bc 7.98 ± 0.72b 82.91 ± 0.42c 43.025 ± 0.97bc 6.985 ± 0.25cd 46.795 ± 0.01ab WR-62 91.465 ± 0.35bc 7.68 ± 0.40b 82.945 ± 0.78c 42.01 ± 0.76bc 6.815 ± 0.04cd 45.99 ± 0.24cd WR-25 91.42 ± 0.25bc 7.58 ± 0.11b 83.88 ± 1.24bc 43.89 ± 0.93b 7.075 ± 0.21c 46.30 ± 0.04bc WR-51 91.77 ± 0.07bc 6.685 ± 0.16c 82.935 ± 0.35c 44.22 ± 0.65b 6.955 ± 0.01cd 45.90 ± 0.49cd Untreated 93.45 ± 0.04a 5.715 ± 0.2d 87.05 ± 0.41a 48.79 ± 0.028a 7.94 ± 0.24a 40.99 ± 0.48e The same superscript lowercase letters on the top right side within columns indicate that the values are not significantly different, whereas different superscript letters indicate that the values are significantly different at p < 0.05. Table 3.
Effect of white-rot fungal treatment on chemical composition of barley straw.
-
Treatments Chemical composition (g/100 g DM) DM Ash NDF ADF ADL IVDMD WR-35 91.825 ± 0.62b 10.55 ± 0.81ab 85.245 ± 2.99b 47.82 ± 0.06bc 6.82 ± 0.14ab 45.855 ± 0.29ab WR-14 92.07 ± 0.49b 10.08 ± 0.01abc 86.96 ± 0.51ab 47.34 ± 0.33bcd 6.775 ± 0.06abc 46.39 ± 0.0a WR-80 91.905 ± 0.23b 10.88 ± 0.38ab 86.655 ± 0.11b 47.82 ± 0.28bc 6.485 ± 0.05cd 45.955 ± 0.19ab WR-18 91.795 ± 0.15b 10.54 ± 0.82ab 84.675 ± 1.07b 46.61 ± 0.76cd 6.305 ± 0.13d 46.30 ± 0.13a WR-62 91.76 ± 0.20b 11.00 ± 0.64a 86.815 ± 0.11ab 47.885 ± 0.06b 6.59 ± 0.01bcd 46.105 ± 0.30ab WR-25 91.770 ± 0.07b 9.78 ± 0.08bc 85.94 ± 0.54b 46.465 ± 0.77d 6.60 ± 0.13bcd 45.50 ± 0.16b WR-51 91.630 ± 0.13b 9.245 ± 0.47c 85.00 ± 0.74b 46.465 ± 0.77d 6.51 ± 0.26bcd 45.75 ± 0.17ab Untreated 93.15 ± 0.37a 8.905 ± 0.05c 89.51 ± 1.02a 49.63 ± 0.13a 7.08 ± 0.18a 38.34 ± 0.81c The same superscript lowercase letters on the top right side within columns indicate that the values are not significantly different, whereas different superscript letters indicate that the values are significantly different at p < 0.05. Table 4.
Effect of white-rot fungal treatment on chemical composition of wheat straw.
-
Treatments Chemical composition (g/100 g DM) DM Ash NDF ADF ADL IVDMD WR-35 91.105 ± 0.19b 6.705 ± 0.25c 80.33 ± 0.76bc 42.93 ± 0.81c 5.595 ± 0.09d 45.885 ± 0.32b WR-14 91.17 ± 0.18b 7.360 ± 0.41bc 82.555 ± 1.45a 44.12 ± 0.76bc 6.180 ± 0.27bc 46.325 ± 0.06ab WR-80 91.06 ± 0.29b 7.705 ± 0.08b 82.05 ± 1.56ab 43.485 ± 1.14bc 5.690 ± 0.08d 47.26 ± 1.30a WR-18 91.20 ± 0.12b 7.15 ± 0.37bc 79.495 ± 0.71c 43.695 ± 0.33bc 5.860 ± 0.03cd 46.085 ± 0.30ab WR-62 91.215 ± 0.03b 7.155 ± 0.39bc 80.805 ± 0.67abc 44.67 ± 0.30b 5.890 ± 0.03cd 45.955 ± 0.30b WR-25 91.28 ± 0.02b 7.790 ± 0.03b 82.205 ± 0.60ab 46.635 ± 0.46a 6.305 ± 0.09b 45.775 ± 0.08b WR-51 91.07 ± 0.02b 8.770 ± 0.16a 81.24 ± 0.37abc 43.22 ± 0.01bc 5.585 ± 0.09d 45.675 ± 0.06b Untreated 94.33 ± 0.16a 4.60 ± 0.62d 82.765 ± 0.45a 47.225 ± 0.49a 6.965 ± 0.37a 43.06 ± 0.54c The same superscript lowercase letters on the top right side within columns indicate that the values are not significantly different, whereas different superscript letters indicate that the values are significantly different at p < 0.05. Table 5.
Effect of white-rot fungal treatment on chemical composition of teff straw.
-
Treatments Chemical composition (g/100 g DM) DM Ash NDF ADF ADL IVDMD WR-35 89.00 ± 0.20c 7.09 ± 0.08bc 69.775 ± 0.74d 40.995 ± 0.39c 6.51 ± 0.1bc 55.125 ± 1.12cd WR-14 89.255 ± 0.29bc 10.98 ± 0.96a 71.045 ± 1.32cd 40.44 ± 0.04c 6.81 ± 0.04b 57.16 ± 0.21ab WR-80 89.65 ± 0.10bc 7.795 ± 0.45bc 72.255 ± 0.42bc 40.935 ± 0.56c 6.15 ± 0.07e 58.11 ± 0.62a WR-18 89.36 ± 0.20bc 7.02 ± 0.27bc 69.55 ± 1.24d 40.90 ± 0.04c 6.505 ± 0.12bcd 55.855 ± 0.77bc WR-62 89.50 ± 0.33bc 7.86 ± 0.13b 71.39 ± 1.70bcd 40.66 ± 0.58c 6.19 ± 0.03de 54.075 ± 0.74de WR-25 90.325 ± 1.4b 6.86 ± 0.03c 69.925 ± 0.36d 40.72 ± 0.25c 6.285 ± 0.01cde 54.60 ± 0.66cde WR-51 89.86 ± 0.11bc 7.29 ± 0.2bc 73.415 ± 0.13ab 42.24 ± 0.20b 6.305 ± 0.02cde 53.28 ± 0.57e Untreated 92.68 ± 0.49a 5.72 ± 0.3d 74.54 ± 0.65a 47.815 ± 0.21a 7.215 ± 0.35a 49.94 ± 0.41f The same superscript lowercase letters on the top right side within columns indicate that the values are not significantly different, whereas different superscript letters indicate that the values are significantly different at p < 0.05. Table 6.
Effect of white-rot fungal treatment on chemical composition of grass straw.
Figures
(10)
Tables
(6)