-
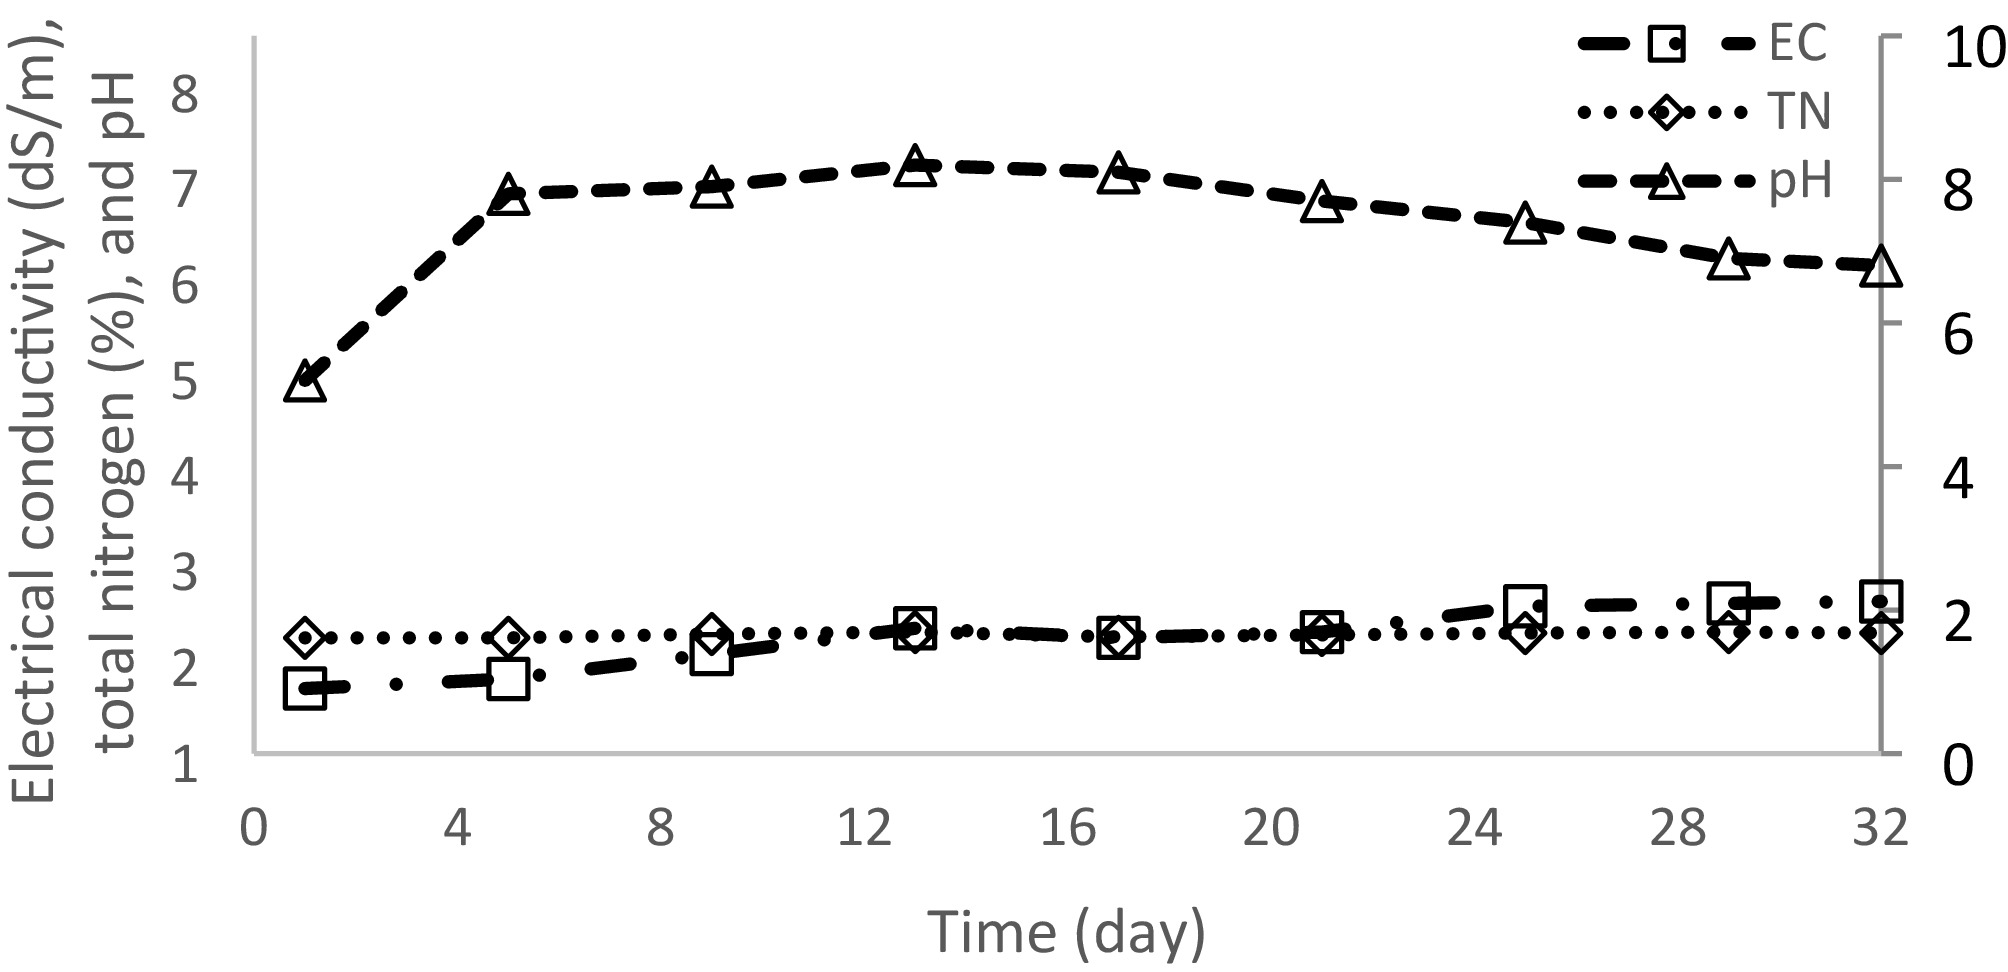
Figure 1.
Changes in electrical conductivity, total nitrogen, and pH during the composting process.
-
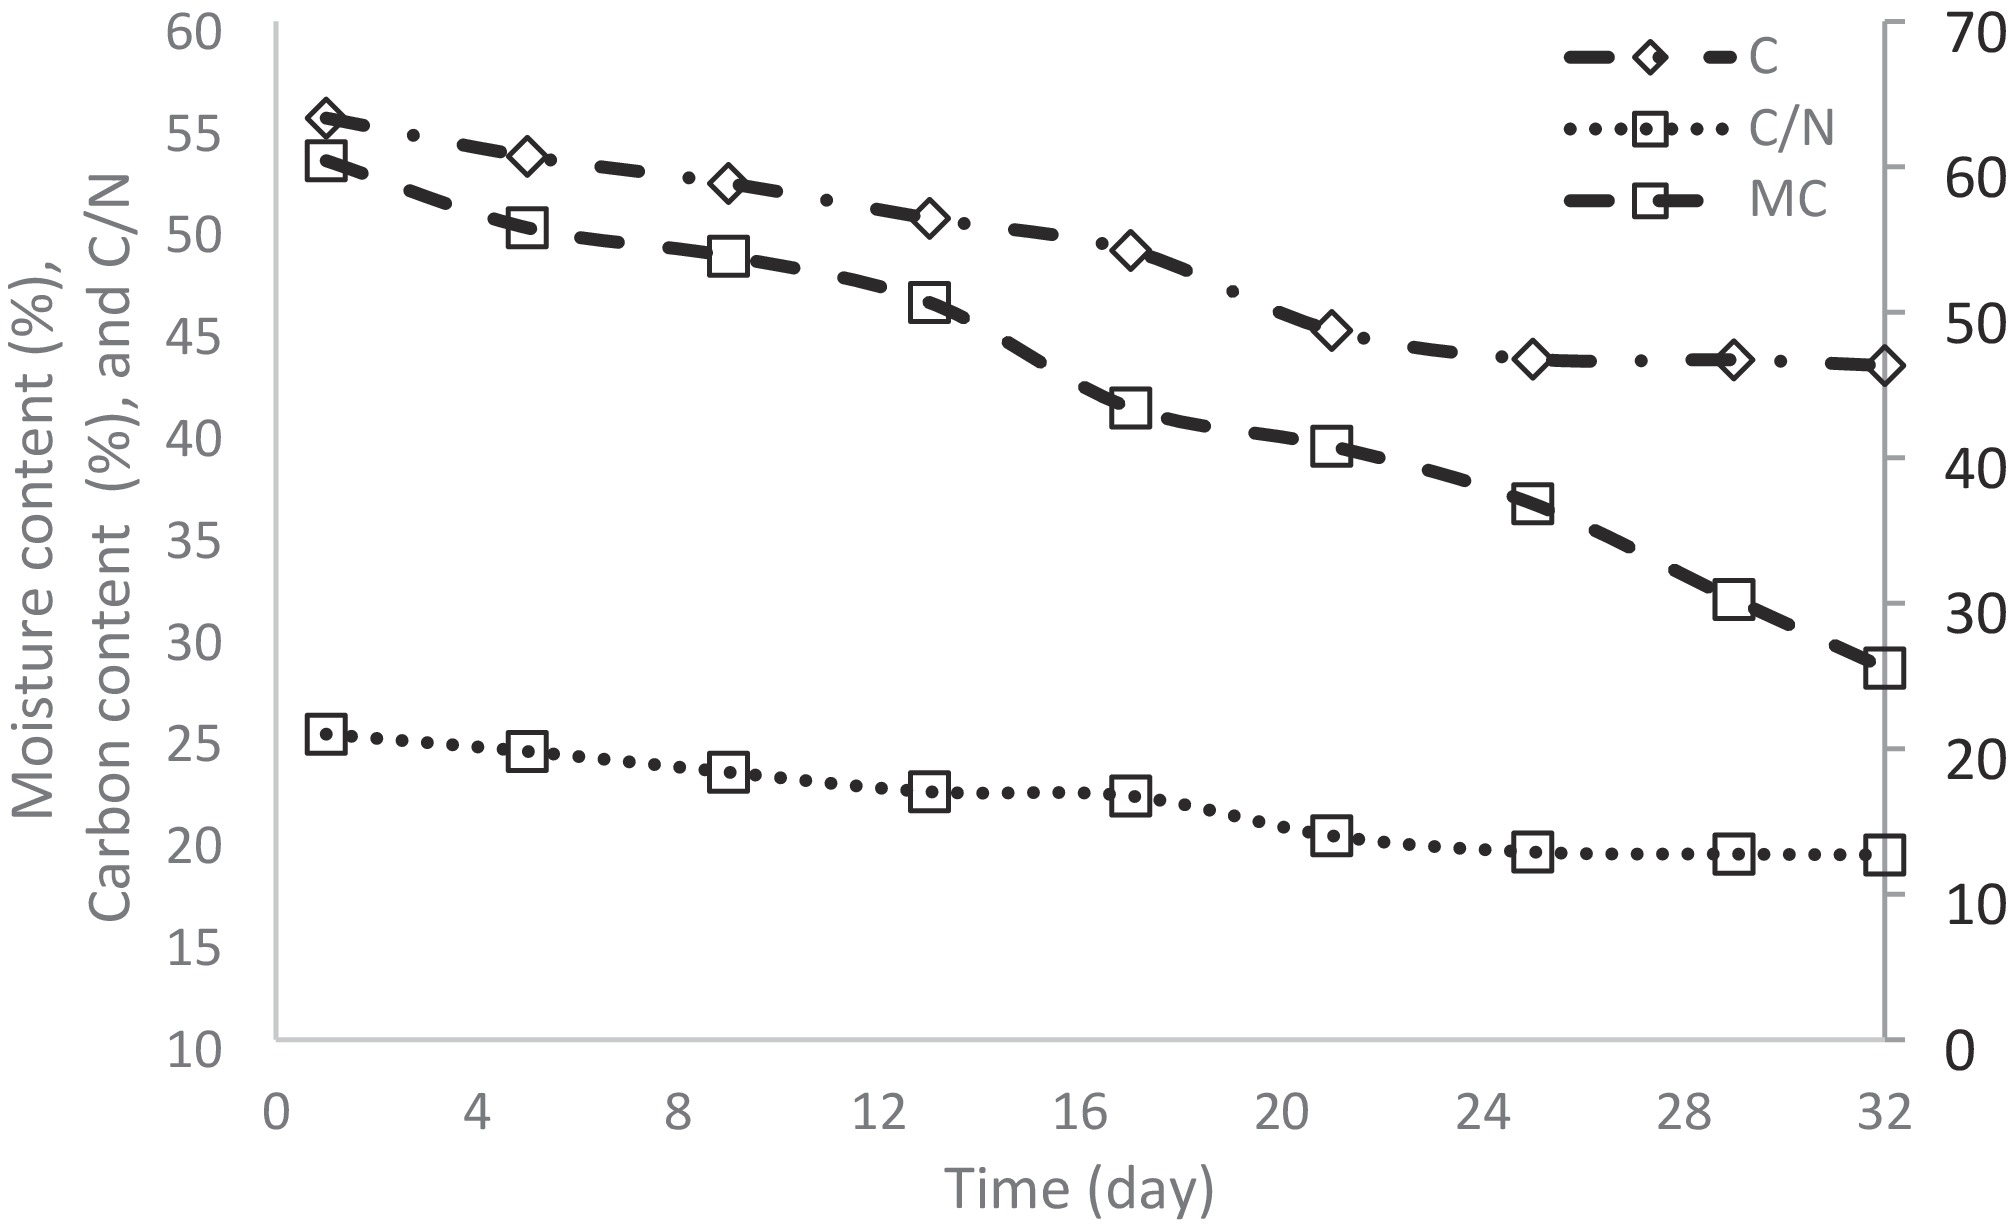
Figure 2.
Changes in moisture content, carbon content, and C/N ratio during composting process.
-
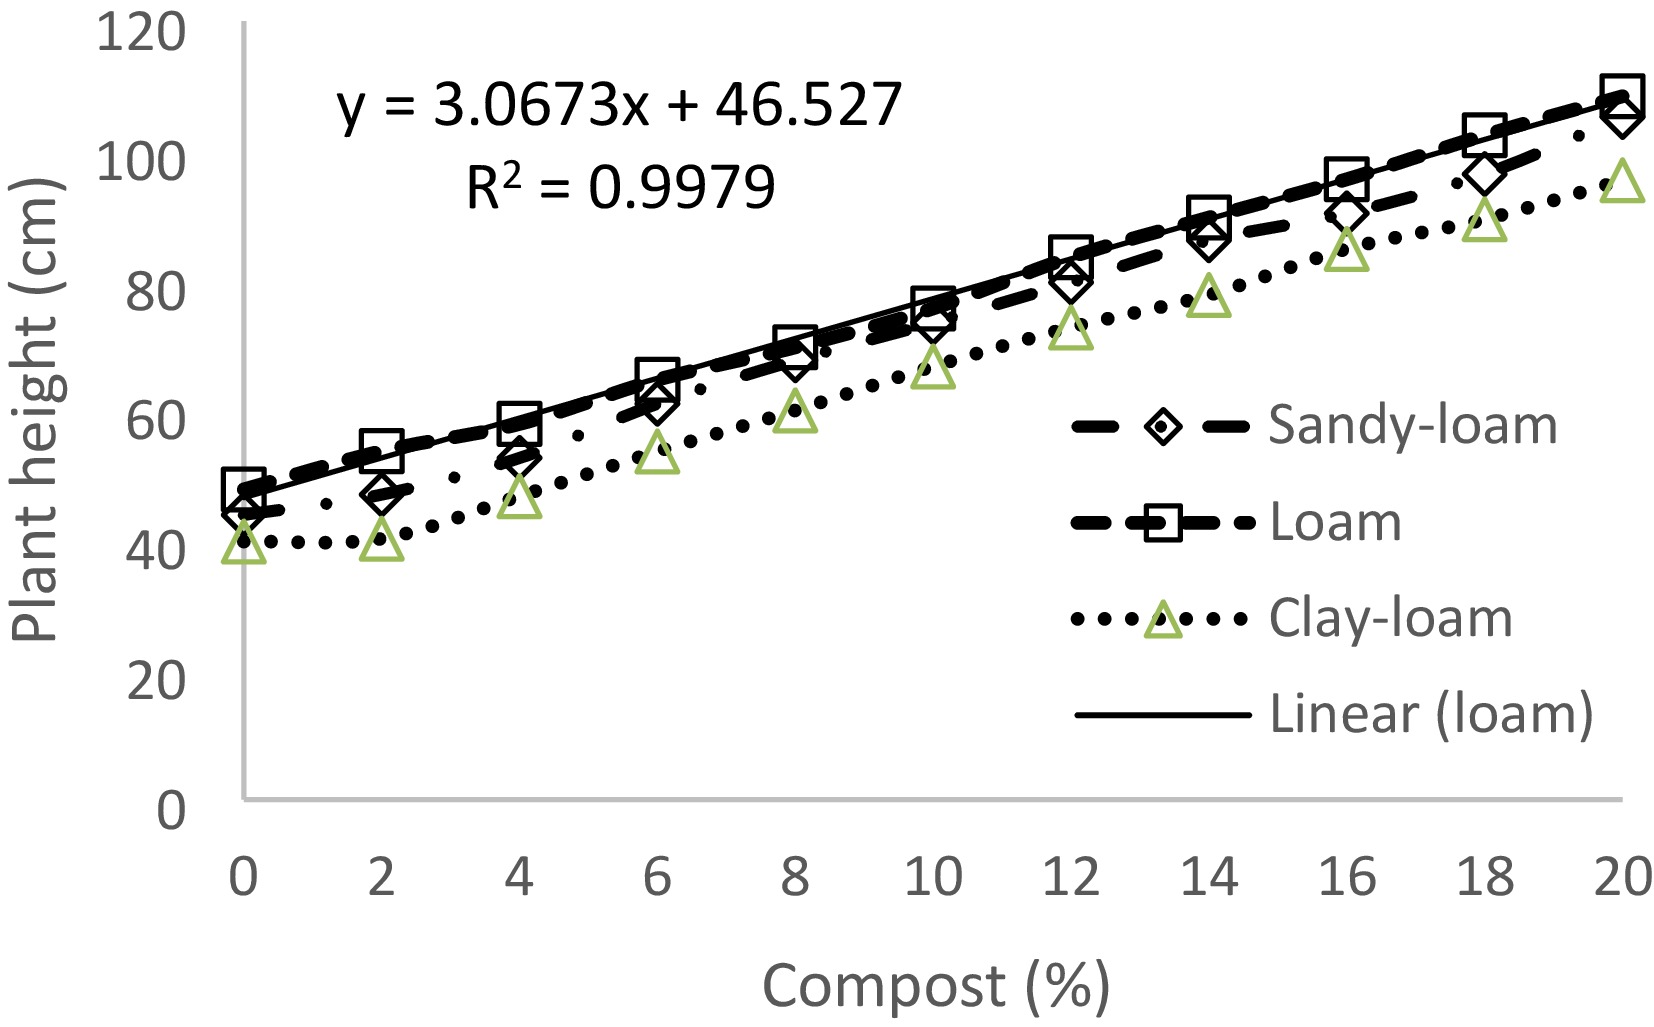
Figure 3.
Plant height in relation to soil-compost content at 6 weeks after transplanting.
-
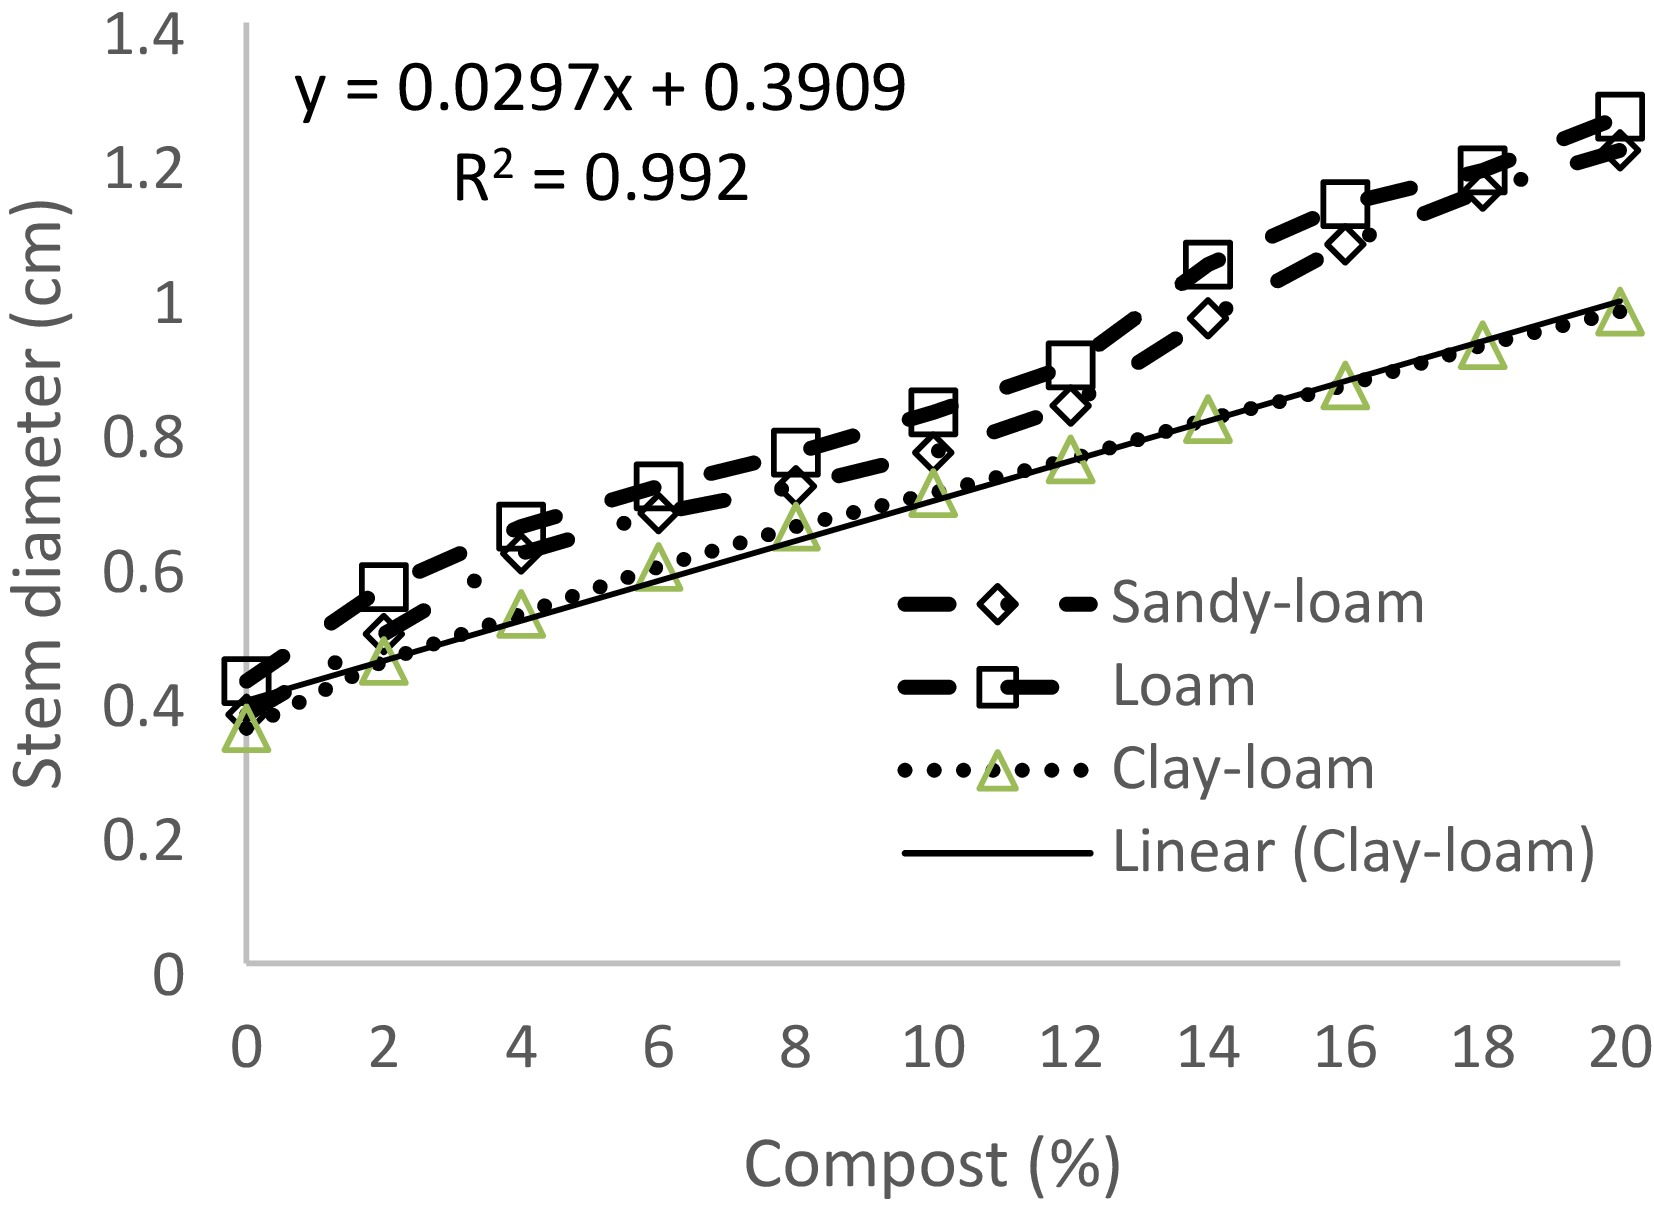
Figure 4.
Plant stem diameter in relation to soil-compost mixture at 6 weeks after transplanting.
-
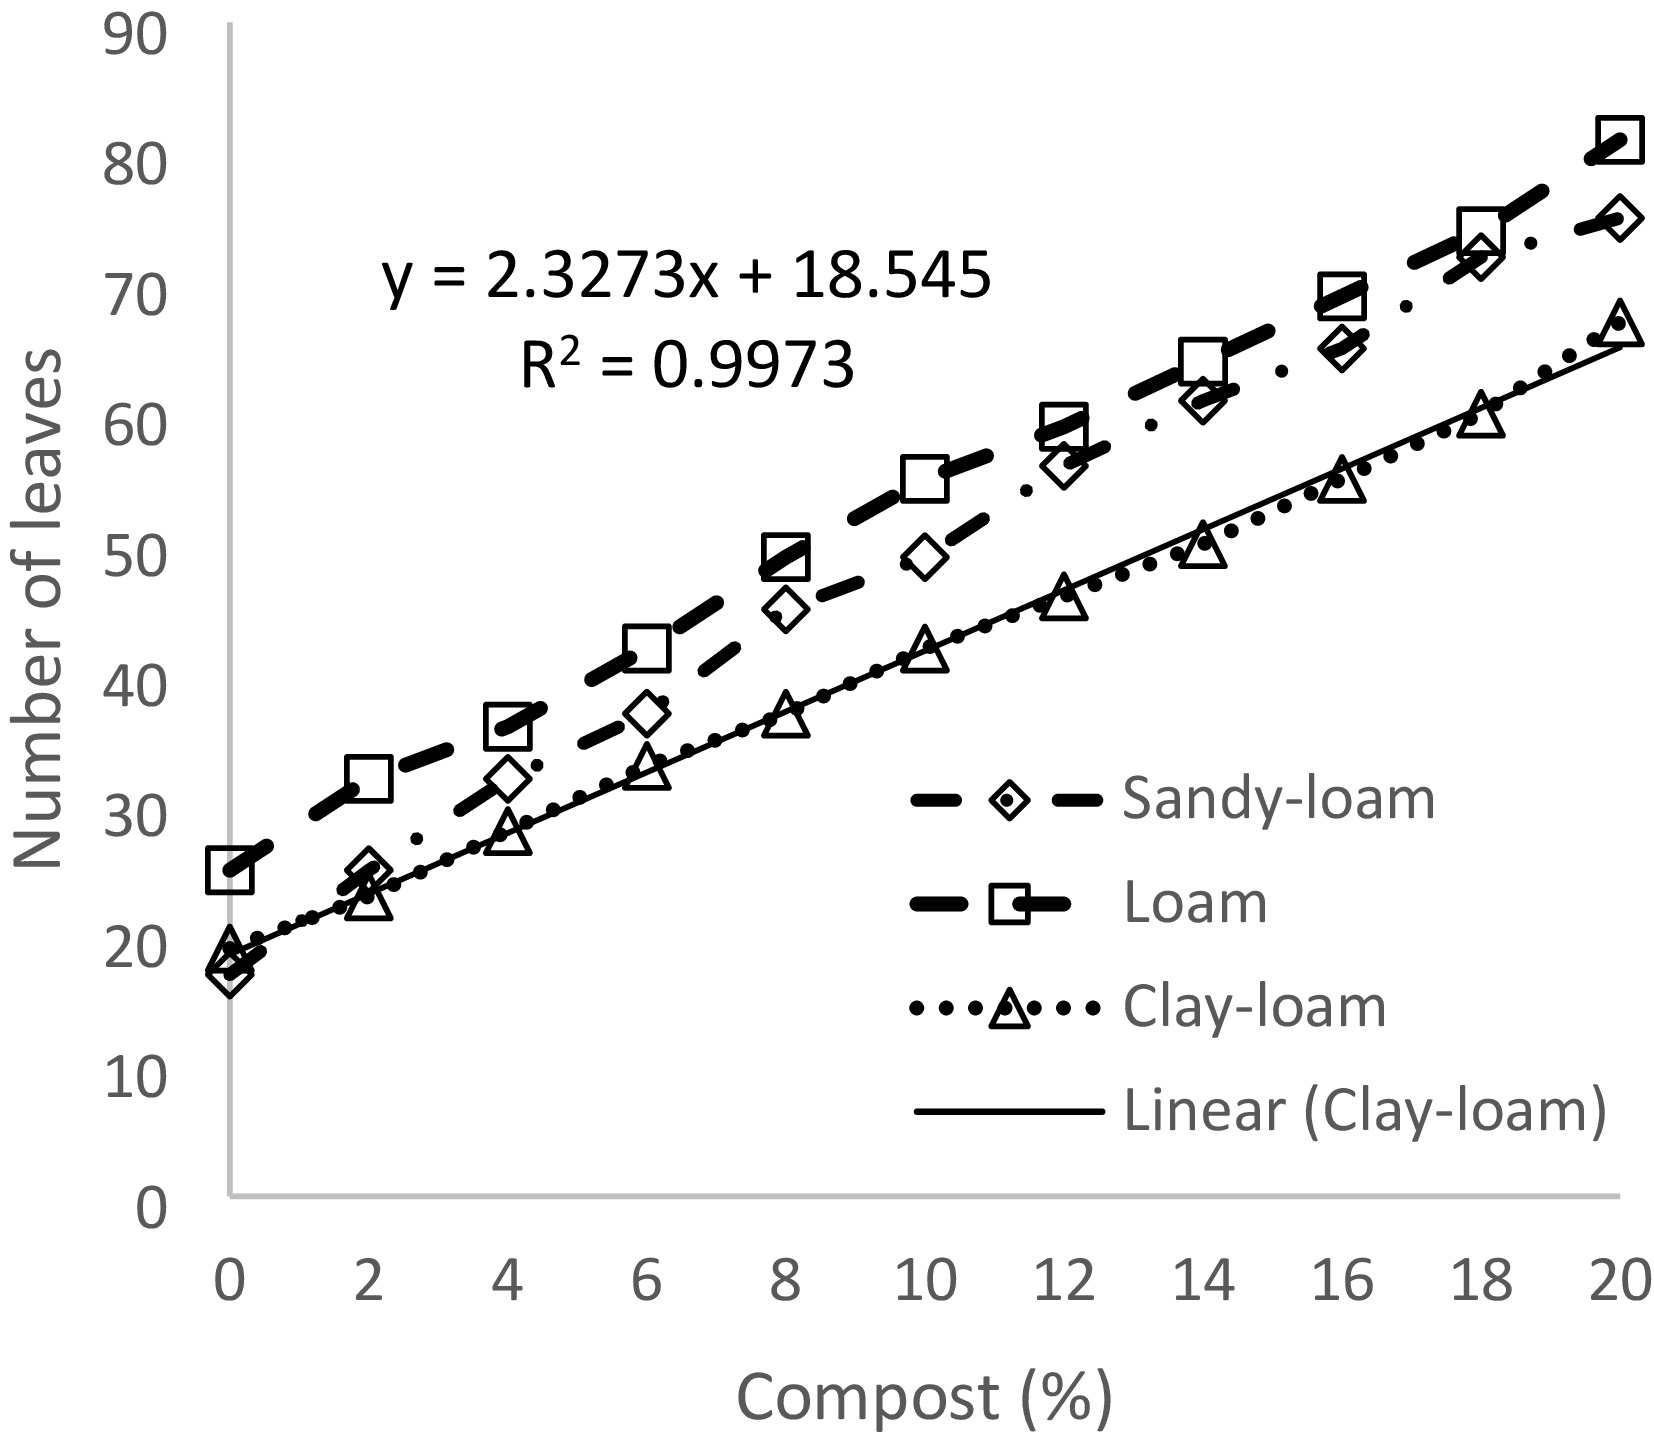
Figure 5.
Number of leaves in relation to soil-compost content at 6 weeks after transplanting.
-
Physicochemical properties Values pH 6.8 ± 0.321 EC (mS/cm) 2.59 ± 0.061 C/N ratio 10.24 ± 0.5 Total nitrogen (%) 2.15 ± 0.023 Carbon (%) 22.02 ± 0.3 Loose bulk density 0.231 ± 0.12 Moisture content (%) 25.54 ± 0.012 Germination index (%) 120 Table 1.
Physicochemical properties of the final compost.
-
Parameters Shapiro-Wilk W Shapiro-Wilk p-value Normality Levene's F Levene's p-value Homogeneity of variance Plant height 0.897 0.167 Normal 1.067 0.388 Homogeneous Number of leaf 0.964 0.820 Normal 0.778 0.491 Homogeneous Stem diameter 0.960 0.778 Normal 4.005 0.062 Borderline (marginally unequal) Table 2.
Shapiro-Wilk normality and Levene's homogeneity statistics test results.
-
Parameter Source F-value p-value Significance Plant height Compost 126.4 < 0.001 Significant Block 0.91 0.42 NS Number of leaves Compost 198.5 < 0.001 Significant Block 1.11 0.36 NS Stem diameter Compost 217.2 < 0.001 Significant Block 0.79 0.46 NS NS = Not significant. Table 3.
Two-way analysis of variance results (RCBD).
-
Growth parameter Partial eta squared (η²) Effect size interpretation Plant height 0.96 Large Number of leaves 0.94 Large Stem diameter 0.98 Large Table 4.
Partial eta squared results.
-
Dependent variable Independent variable Slope Intercept R2 Plant height (cm) Compost content 3.067 46.53 0.99 Stem diameter (mm) Compost content 0.029 0.391 0.99 Number of Leaves Compost content 2.327 18.54 0.99 Table 5.
Summary of linear regression of plant height (cm) and stem diameter (mm) of Amaranthus cruentus soil-compost contents.
-
Response variable Statistical test Purpose of analysis Significance level Plant height Shapiro–Wilk test Assess normality of data α = 0.05 Number of leaves Shapiro–Wilk test Assess normality of data α = 0.05 Stem diameter Shapiro–Wilk test Assess normality of data α = 0.05 Plant height, number of leaves, stem diameter Levene's test Assess homogeneity of variances α = 0.05 Stem diameter Log transformation Stabilize variance before ANOVA because the homogeneity assumption was marginally violated — Plant height Two-way ANOVA (Treatment × Block) Determine the effects of compost application rate and block (replicate) α = 0.05 Number of leaves Two-way ANOVA (Treatment × Block) Determine the effects of compost application rate and block (replicate) α = 0.05 Stem diameter Two-way ANOVA (Treatment × Block) Determine the effects of compost application rate and block (replicate) α = 0.05 Significant ANOVA results Tukey's HSD Separate treatment means α = 0.05 Plant height vs compost rate Linear and quadratic regression Evaluate the relationship between compost application rate and plant height p < 0.05 Number of leaves vs compost rate Linear and quadratic regression Evaluate the relationship between compost application rate and leaf production p < 0.05 Stem diameter vs compost rate Linear and quadratic regression Evaluate the relationship between compost application rate and stem diameter p < 0.05 Plant height, number of leaves, stem diameter Partial eta squared (η²) Quantify the magnitude of compost treatment effects Cohen's guidelines Table 6.
Summary of statistical analysis performed.
Figures
(5)
Tables
(6)